

Abstract
We often generate movements without any external event that immediately triggers them. How the brain decides the timing of self-initiated movements remains unclear. Previous studies suggest that the basal ganglia–thalamocortical pathways play this role, but the subcortical signals that determine movement timing have not been identified. The present study reports that a subset of thalamic neurons predicts the timing of self-initiated saccadic eye movements. When monkeys made a saccade in response to the fixation point (FP) offset in the traditional memory saccade task, neurons in the ventrolateral and the ventroanterior nuclei of the thalamus exhibited a gradual buildup of activity that peaked around the most probable time of the FP offset; however, neither the timing nor the magnitude of neuronal activity correlated with saccade latencies, suggesting that the brain is unlikely to have used this information to decide the times of saccades in the traditional memory saccade task. In contrast, when monkeys were required to make a self-timed saccade within a fixed time interval after an external cue, the same neurons again exhibited a strong buildup of activity that preceded saccades by several hundred milliseconds, showing a close correlation between the times of neuronal activity and the times of self-initiated saccades. The results suggest that neurons in the motor thalamus carry subjective time information, which is used by cortical networks to determine the timing of self-initiated saccades.
Keywords: saccade, self-timing, thalamus, motor system, physiology, primate
Introduction
Although the basal ganglia–thalamocortical circuitry has been implicated in the generation of self-timed movements, how the subcortical signals contribute to these movements remains unclear. Previous studies have shown that many neurons in the basal ganglia (Kimura et al., 1992; Schultz and Romo, 1992; Lee and Assad, 2003; Turner and Anderson, 2005), thalamus (van Donkelaar et al., 1999), and cerebral cortex (Okano and Tanji, 1987; Kurata and Wise, 1988; Mushiake et al., 1991; Romo and Schultz, 1992) discharge differently between internally triggered, self-timed movements and externally triggered, reactive movements. However, individual neurons in the pathways are generally active during both types of movement, and the premovement brief burst of activity in the population of neurons exhibits no systematic preference for either type of movement (Thaler et al., 1988; Mink and Thach, 1991; Lee and Assad, 2003; Turner and Anderson, 2005). These previous observations suggest that the basal ganglia–thalamocortical pathways are unlikely to provide the immediate trigger or drive signals for a specific type of movements; instead, they might provide proactive signals that are necessary for the decision to make internally triggered movements (Schultz and Romo, 1992; Lee and Assad, 2003; Maimon and Assad, 2006).
The neural mechanisms underlying decision making have been extensively examined using reaction time paradigms. One of the most realistic models of decision making assumes a neural process that integrates sensory information over time, accumulating evidence toward the predetermined threshold for perceptual or movement decisions (Carpenter and Williams, 1995; Usher and McClelland, 2001; Smith and Ratcliff, 2004). Previous physiological studies in nonhuman primates have found the neural correlates of this process within the cerebral cortex, showing a gradual ramping up of firing rates before decisions are made (Hanes and Schall, 1996; Kim and Shadlen, 1999; Shadlen and Newsome, 2001; Roitman and Shadlen, 2002). In particular, neurons in the parietal cortex showed a gradual elevation of firing rate when the animals expected an external trigger for subsequent eye movements (Janssen and Shadlen, 2005), or when they prepared for self-timed arm movements (Maimon and Assad, 2006). A gradual buildup of activity before self-timed movements has also been reported in the basal ganglia (Schultz and Romo, 1992). Because both the basal ganglia and association areas in the frontal and parietal cortices are known to be involved in representation of time over a range of seconds (Rao et al., 2001; Buhusi and Meck, 2005), the corticosubcortical networks through the thalamus may process time information for the internal triggering of movements.
Previously, we showed that inactivation of the motor thalamus delays the initiation of self-timed saccades (Tanaka, 2006). To explore the neuronal signals that regulate the timing of self-initiated movements, activities of single neurons were recorded from the motor thalamus when monkeys performed the eye movement tasks similar to those used in the previous inactivation studies. Many neurons exhibited a gradual elevation of firing rate in anticipation of an external trigger or the occurrence of self-timed saccades, suggesting that neurons in the thalamus carry proactive timing information for the internal triggering of movements.
Materials and Methods
Animal preparation.
One male and three female Japanese monkeys (Macaca fuscata; monkeys A, B, D, and E) were prepared for chronic experiments using procedures described in detail previously (Tanaka, 2005, 2007). Briefly, the animals were implanted with a pair of head holders, a recording cylinder, and an eye coil in separate surgeries that were performed under general halothane and pentobarbital anesthesia and using sterile procedures. Analgesics and antibiotics were administered after each surgery. During training and experimental sessions, the monkeys' heads were secured to the primate chair using the head holders, and eye movements were recorded using the search coil technique. Water intake of monkeys was controlled daily so that they were motivated to perform the oculomotor tasks. All experimental protocols described here were evaluated and approved in advance by the Animal Care and Use Committee of the Hokkaido University School of Medicine and were in accordance with the Guide for the Care and Use of Laboratory Animals (National Research Council, 1996). Three of the monkeys (A, B, and D) were also used in previous inactivation experiments (Tanaka, 2006) that were performed after the recording experiments reported here. For two monkeys (A and B), the recording sites were reconstructed from histological sections based on stereotaxic coordinates and the locations of electrolytic lesions made by passing direct current through the electrodes.
Visual stimuli and behavioral tasks.
Experiments were controlled by a Windows-based real-time data acquisition system (TEMPO; Reflective Computing, St. Louis, MO) running on Pentium PCs. All events were updated every 5 ms, and visual stimuli were presented on a 24 inch cathode-ray tube monitor (refresh rate, 60 Hz) that was subtended 64 × 44° of visual angle. A 0.5° square spot served as the visual stimulus. Three saccade tasks were used in this study (see Fig. 1). In the memory saccade task (Hikosaka and Wurtz, 1983), a visual cue was presented briefly (200 ms) during central fixation, and monkeys were required to remember the location of the cue and to maintain fixation for an additional delay interval (1000 or 1500 ms). Within 400 ms of the offset of the fixation point (FP), monkeys made a saccade to the cue location to obtain a liquid reward. In the self-timed saccade task, monkeys were required to make a saccade to the location of previously presented visual cue within 1200 ± 400 ms of the cue offset. The FP disappeared only after monkeys generated a self-timed saccade, when eye position deviated >3° from the FP. In both the memory saccade task and the self-timed saccade task, the peripheral target reappeared 400 ms after the FP offset. In the visual saccade task, the saccade target appeared at the time of FP offset, and monkeys made a saccade within 400 ms. The color of the stimulus was white for the saccade target, and was either blue (self-timed saccade task) or red (other tasks) for the FP (Fig. 1). Monkeys were rewarded with drops of water or apple juice if they moved their eyes within a “window” that surrounded the target location at specific time intervals; otherwise, a trial was aborted and followed by a newly selected trial. Typically, the size of the window was 2° (4° in diameter) for initial fixation and the delay, and was 4° (8° in diameter) for the peripheral target. The window size for the peripheral target ranged from 3 to 5° (6–10° in diameter) depending on animals, trial types, and saccade directions. Although relatively large target window was used, saccades during recording sessions were quite accurate; the distance from saccade endpoint to the target during recording of 48 buildup neurons averaged 1.82 ± 0.48° (SD), 1.78 ± 0.45°, and 1.11 ± 0.34° for the self-timed saccade task, the memory saccade task, and the visual saccade task, respectively. In addition, eye position during the delay period was not altered consistently over time in both the self-timed saccades task and the memory saccade task (supplemental Fig. 1, available at www.jneurosci.org as supplemental material). Trials were presented randomly in a block. When we searched for eye movement-related neurons, the block usually consisted of the memory saccade trials (1000 ms delay) in four cardinal directions (right, left, up, down), horizontal self-timed saccade trials, and smooth-pursuit trials. Once a neuron with delay period activity or a saccade-related burst of activity was isolated, the trial block was switched to include seven different saccade trials, which consisted of four standard memory saccade trials (1000 ms delay) in different directions, a probe memory saccade trial (1500 ms delay), a self-timed saccade trial, and a visual saccade trial. The latter three trials were presented only in the optimal direction of the neuron under study (selected from the four cardinal directions). All trial types were randomly interleaved within a block. In all trials, the saccade target was located 16° eccentrically. To exclude possible effects of reward on the modulation of neuronal activity in different tasks, the same amount of reward was given for all correct trials throughout the experiments.
Figure 1.

Sequence of events in three saccade paradigms. Monkeys made a saccade in response to the fixation point offset (memory task and visual task), or within 1200 ± 400 ms of the cue offset (self-timed task). The color of the FP was red in the former two tasks, but was blue in the latter task to inform monkeys of the trial type. Monkeys obtained the same amount of reward for each correct behavior in the three saccade paradigms. Trials were presented randomly in a block, which consisted of seven different tasks including five memory saccade tasks and two other tasks (see Materials and Methods).
Data acquisition and analysis.
Eye position signals were obtained directly from eye coil electronics (MEL-25; Enzanshi Kogyo, Chiba, Japan). Neuronal activity was recorded through tungsten microelectrodes (FHC, Bowdoin, ME). After amplification and filtering of the signals, spikes of single thalamic neurons were isolated using a real-time spike sorter with template-matching algorithm (MSD; Alpha Omega, Nazareth, Israel). Data were digitized and sampled at 1 kHz during experiments and were stored in files for subsequent off-line analysis that was performed using Matlab (Mathworks, Natick, MA). During the recording sessions, we did not store the data of failed trials. Data were aligned on either the stimulus onset or the saccades, and the spike density (ς = 15 ms) was obtained for each task to assess the time course of neuronal activity. Except for the two analyses illustrated in Figures 5 and 6, quantitative measurements were made on the basis of spike count at specific task intervals. To detect a significant modulation of neuronal activity during the delay period in the memory saccade task, we measured the firing rates for every 400 ms interval within the time window starting from 200 to 1000 ms after the cue offset. Then, the activity for the interval showing a maximal mean value was compared with the baseline activity measured during the 400 ms before the cue onset. For the plots in Figures 5 and 7, the existence or absence of brief burst of activity after the FP offset was determined by eye. Also, the timing of burst of activity relative to saccades (i.e., presaccadic or postsaccadic) was determined by watching the data aligned on saccade initiation. The details of other measures are described in the relevant text or Figure legends.
Figure 5.

The time course of buildup activity predict the timing of fixation point offset in the memory saccade task. A, An example illustrating how we compared the activities between trials with different delay intervals for individual neurons. Based on data from the memory saccade task with a 1000 ms delay (standard trial), we tried to estimate the firing rate at the end of a probe trial with a 1500 ms delay. Because the firing rate during the delay period increased linearly, we fitted a line (least squares) to the spike density (black trace) for the standard trial. The fitted function incorporated a recruitment threshold, and the spike densities during the 200–1000 ms after the cue offset were used for the fitting. B, The predicted activity was compared with the actual measures in the probe trials (the last 100 ms in the delay period). For almost all neurons, the observed activity was less than the predicted activity. Data for observed activity (red symbols) distributed around the equality line, indicating that many neurons showed a similar amount of activity at the time of FP offset, regardless of the length of the delay interval. Data for neurons that showed a transient activity after the FP offset are plotted by triangles. C, Time course of population activity for memory saccade tasks with different delay intervals. Note that the activity remained unchanged throughout the extended delay period in the probe trial (red trace). Data for 14 neurons whose activity did not fit well with a line (r2 < 0.7) also contributed to the population activity.
Figure 6.

Analysis of the correlation between neuronal and behavioral latencies. A, Data from a neuron exhibiting a buildup of activity in the self-timed task are aligned with the cue onset. Times of saccade initiation are shown as yellow dots, and the trials are sorted according to saccade latency. B, Spike densities were obtained from every five consecutive trials for the neuron shown in A. Traces in colors indicate spike densities for trials marked by the corresponding colors in A. The neuronal latency was measured when the spike density exceeded half of the maximal modulation of neuronal activity (dashed line). C, The maximal modulation was defined as the difference in activity measured during the 250–150 ms before saccade initiation (black bar) and that measured 300 ms before cue onset (baseline). D, Each panel compares the neuronal and behavioral latencies for either the self-timed task or the memory task. The behavioral latencies are the means of five trials, and are expressed as the time from the cue offset in both tasks.
Figure 7.

Correlation with saccade latency. A, Correlation between neuronal and behavioral latencies. For each neuron, the latencies were measured using the methods summarized in Figure 6. The correlation coefficients were greater for the self-timed saccade task than for the memory saccade task (paired t test, one-tailed, p < 10−3). Data from neurons that showed a transient activity after the FP offset are plotted by triangles. B, Comparison of variations in neuronal and behavioral latencies. Each data point plots SDs for the means of every five trials that were grouped according to saccade latency and were used to compute the correlation coefficients plotted in A. C, Lack of correlation between the firing rate and saccade latency. For individual neurons, correlation coefficients were computed between the magnitude of neuronal activity and saccade latency for every five consecutive trials, sorted by saccade latency. The neuronal activity was measured between 250 and 150 ms before saccade initiation (self-timed task) or during the 100 ms before fixation point offset (memory task). The correlation coefficients were not statistically different between the tasks (paired t test, two-tailed, p = 0.10). D, Medians of correlation and regression coefficients between neuronal and saccade latencies for different levels of criterion to measure the neuronal latency. The level of threshold at the half of the maximal firing modulation (threshold level = 0.5) was used to compute the data plotted in A and B.
Results
Preparatory activity predicts the timing of an external trigger for saccades
We searched for neurons in the ventrolateral (VL) and ventroanterior (VA) nuclei of the thalamus that discharged before saccades when monkeys performed the memory saccade task with a delay of 1000 ms. Consistent with previous studies (Wyder et al., 2003, 2004; Tanaka, 2005), many neurons in the VL thalamus began firing during the delay period, well before the FP offset (Fig. 2, red triangles). Among 266 task-related neurons examined in this study, 106 neurons showed significant modulation of activity for a 400 ms interval during the delay period, in comparison with the 400 ms baseline interval immediately before the cue onset (see Materials and Methods) (Wilcoxon rank-sum test, p < 0.05). For each neuron, the preferred direction was designated by comparing the maximal activity (measured for 400 ms) during the delay period for trials in different directions. The time course of the population activity shown in Figure 3A indicates that some of these neurons were directional, and that the firing rates increased gradually during the fixed delay interval. Indeed, for 55% of the neurons, the firing rates measured during the last 400 ms of the delay period for trials in opposite directions were statistically different (n = 58; Wilcoxon rank-sum test, p < 0.05) (Fig. 3B, black bars). In addition, for 90% of the neurons, the ratio of late activity (700–1000 ms) to early activity (200–500 ms) during the delay period was >1.0, indicating that most neurons exhibited an increase in activity (Fig. 3C). The firing rates were statistically different between these two measuring intervals within the delay period for 68% of neurons (n = 72; Wilcoxon rank-sum test, p < 0.05) (Fig. 3C, black bars).
Figure 2.
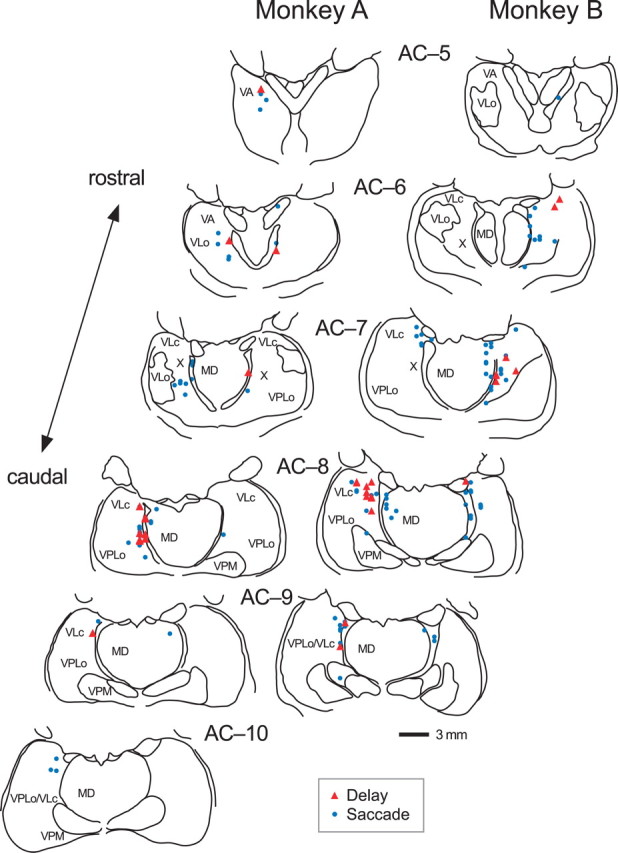
Locations of neurons in two monkeys. Recording sites were reconstructed from histological sections (50 μm, stained with cresyl violet) on the basis of stereotaxic coordinates of electrode penetrations and several electrolytic lesions made during experiments. Red triangles indicate neurons showing a significant firing modulation during the delay period in the memory saccade task. Blue dots indicate neurons showing a brief burst of activity associated with saccades. Neurons with both the properties are plotted by red triangles. The levels of frontal sections are shown as the position posterior to the anterior commissure (AC). MD, Mediodorsal nucleus; VA, ventroanterior nucleus; VLc and VLo, caudal and oral divisions of ventrolateral nucleus, respectively; VPLo, oral division of ventroposterolateral nucleus; VPM, ventroposteriomedial nucleus; X, area X.
Figure 3.

Neurons in the ventrolateral thalamus show a ramping up of firing rate during the delay period. A, Population activity in the memory saccade task with a delay of 1000 ms. B, Distribution of directionality index. The index was measured for individual neurons as 1 − Opp/Pref, where Pref indicates the activity during the last 400 ms of the delay period minus the baseline activity for trials in the preferred direction, and Opp indicates those for trials in the opposite direction. Data with statistically significant directional modulation (Wilcoxon rank-sum test, p < 0.05) are plotted as filled bars (n = 58; 55%). C, Ratio of late activity (700–1000 ms) to early activity (200–500 ms) during the delay period, for individual neurons. Values were >1.0 for most neurons (90%), indicating that the activity gradually increased over time during the delay period. Data showing a statistically significant difference (p < 0.05) are plotted by filled bars (n = 72; 68%).
To test whether the time course of the preparatory activity reflected the monkeys' expectation for the timing of the FP offset, we presented a probe trial that had a longer delay (1500 ms) within a block. Each block consisted of seven randomized trials including four standard memory saccade tasks (1000 ms delay) in four cardinal directions, and one probe trial, as well as another two tasks in the preferred direction of the neuron under study (see Materials and Methods). Figure 4 illustrates data from two representative neurons for saccades in the preferred direction. Regardless of the presence (top row) or absence (bottom) of a brief burst activity after the FP offset, the firing rates of these neurons increased gradually before the FP offset, and peaked around the time of saccades (Fig. 4, left column, blue traces). When the delay period was prolonged in the probe trials, both neurons continued firing, but the firing rates did not increase any more during the extended delay interval (Fig. 4, second column, red traces).
Figure 4.

Activity of two thalamic neurons in four different conditions. Each row plots data from a buildup neuron with (top) or without (bottom) a saccade-related burst of activity. For each panel, data are aligned with either the cue onset (left 3 columns) or saccades (other columns) in the preferred direction, and are sorted according to saccade latency. Data in the third and fourth columns are identical, but are aligned with different time references. Solid continuous traces indicate spike densities for the associated rasters. The blue dashed traces in the second column plot the same spike densities as those in the first column for comparison. Yellow symbols indicate the times of saccade (left 3 columns), reappearance of the target (fourth column), or FP offset (right column).
Many neurons in the VA/VL thalamus discharged similarly to the examples shown in Figure 4. To quantify the activities of individual neurons, we attempted to estimate the firing rate 100 ms before the FP offset in the probe trial (1500 ms delay), based both on data from the standard memory saccade trials (1000 ms delay) and on the assumption that the firing rate increased at a constant rate during the extended delay interval (Fig. 5A). For 44 of the 58 neurons tested for the probe trials, the spike density (ς = 15 ms) computed from the neuronal activity in the standard trials were well fit by a regression line incorporating a recruitment threshold (least squares, r2 > 0.7). Figure 5B plots the estimated activity (blue symbols) and the actual activity (red symbols) in the probe trials as a function of the mean firing rates measured during the 100 ms before the FP offset in the standard trials, and shows that the estimated activity was greater than the actual activity for almost all of these neurons (95%; n = 42). In addition, the activities measured during the 100 ms before the FP offset in trials with two different delay intervals were not statistically different for all tested neurons (paired t test, p = 0.14; n = 58), and the magnitude of the population activity was not altered over the extended delay interval (Fig. 5C). These results indicate that the firing rate during the delay period in the memory saccade tasks increased so that it reached a peak around the most probable time of the FP offset, which was 1000 ms after the cue offset. Thus, the time course of the preparatory activity during the delay period appeared to reflect the monkeys' expectation for the timing of the FP offset, or, alternatively, the timing of the saccade, which occurred in close succession to FP offset. However, in this traditional memory saccade task, monkeys were not allowed to trigger eye movements using this subjective time information, but instead were required to make a saccade in response to the FP offset.
Preparatory activity predicts the occurrence of self-timed saccades
To understand the roles of thalamic neurons in self-timing, we next examined the activity of the same neurons in a self-timed saccade task (Fig. 1). In this task, the FP disappeared only after a monkey had made a saccade to the location of the previously presented visual cue, and monkeys were rewarded when they generated a self-initiated saccade within 1200 ± 400 ms of the cue offset. Thus, the task required self-triggering of movements using information about the elapsed time after the external cue. For both of the example neurons shown in Figure 4, the firing rate increased gradually before the initiation of self-timed saccades, which are shown as yellow dots on the raster lines (Fig. 4, middle column). When the same data were aligned on saccades, the corresponding spike densities started to modulate >400 ms before the saccades (Fig. 4, fourth column, green traces). These neurons showed only a minimal change in activity for saccades to a visible target (Fig. 4, right column).
To examine whether neurons in the VA/VL thalamus carry signals that regulate saccade timing, correlations between the times of neuronal activity and the times of saccades were computed for individual neurons, for both the memory saccade task and the self-timed saccade task. To do this, data from individual trials were sorted according to saccade latencies (Fig. 6A), and the latencies of neuronal activity were measured for every consecutive five trials by taking the time when the corresponding spike densities (ς = 60 ms) exceeded a threshold (Fig. 6B), which was defined as the baseline activity (300 ms before cue onset) plus half of the maximal modulation measured during the 250–150 ms before saccade initiation (Fig. 6C, black bar). The latencies of neuronal activity and those of saccades were compared for every five consecutive trials (Fig. 6D), and the correlation coefficients were computed for each of 48 neurons that showed a significant modulation in both the memory saccade task and the self-timed saccade task. A subset of neurons that showed a significant firing modulation in the memory saccade task but lacked activity before saccades in the self-timed task (n = 8) or showed only a transient activity (n = 2) were excluded from the analysis.
Figure 7A summarizes the correlation coefficients of the times of neuronal activity and the latencies of saccades for individual neurons (The regression slopes are shown in supplemental Fig. 2 (available at www.jneurosci.org as supplemental material). All regressions were conducted as type II and slopes were calculated with neuronal latency on the x-axis and saccade latency on the y-axis). In the memory saccade task, only 13% (n = 6 of 48) of neurons showed correlation coefficients >0.5, and the values were not significantly different from zero across the population (two-tailed t test, p = 0.11). In contrast, in the self-timed saccade task, the correlation coefficients for 58% (n = 28) of neurons were >0.5, and the median of all tested neurons was 0.62. When the rank correlation coefficients were computed for the same set of the data, the medians of the values were 0.10 and 0.64 for the memory saccade task and the self-timed task, respectively. Thus, the times of neuronal activity did not correlate with the times of eye movements in the memory saccade task, but they did in the self-timed saccade task.
The results of correlation analyses suggest that the contribution of the thalamic signals to the timing of saccades is different between the tasks. An important issue is that the range of movement times in the self-timed saccade task was much larger than that in the memory saccade task (e.g., compare the range of values along the ordinates in Fig. 6D). This raises the possibility that a similar correlation between neuronal latencies and movement times might exist in both the tasks, but that this correlation is too difficult to detect in the memory saccade task because of the associated small range of movement times. To address this issue, we examined the variance of movement-time distributions and neuronal-latency distributions in the two tasks. Figure 7B plots the SDs of latencies for the means of every five trials that were used to compute the correlation coefficients. Whereas the variance in movement time was significantly less for the memory-saccade task than for the self-timed saccade task (Fig. 7B, filled symbols) (paired t test, p < 10−10), the variance in neuronal latency was comparable between the two tasks (open circles, p = 0.61). In other words, in the self-timed saccade task, the variability in neuronal latencies roughly matched the variability in movement times, whereas in the memory saccade task, neuronal latencies had much more variability than expected if they were to serve a role in determining saccade timing. These data argue against the idea that VA/VL neurons subserved the same process in both tasks, suggesting, instead, that these neurons regulated movement timing in the self-timed task specifically.
We also confirmed that the correlation between latencies was not affected greatly by the levels of threshold that were used to measure the neuronal latency. Figure 7D plots the medians of correlation and regression coefficients (type II) as a function of the levels of threshold (20–80% of maximal modulation). The correlation coefficients were consistently greater for the self-timed saccade task than for the memory saccades task. The regression coefficients (slopes) had medians of ∼0.6 across the levels of threshold, but the values were greatly variable from neuron to neuron (supplemental Fig. 2, available at www.jneurosci.org as supplemental material). When the means of the regression slopes were computed after eliminating a few outliers (absolute slope >3), the values were 0.54 (n = 46), 0.58 (n = 46), 0.61 (n = 46), 0.62 (n = 45), 0.64 (n = 46), 0.65 (n = 45) and 0.70 (n = 45) for the levels of threshold at 20, 30, 40, 50, 60, 70, and 80% of the maximal modulation, respectively.
In contrast to the clear correlation between latencies in the self-timed saccade task, the magnitudes of neuronal activity did not correlate with saccade latencies. Figure 7C plots the correlation coefficients between saccade latencies and the magnitudes of buildup activity measured during the 100 ms before the FP offset (memory task) or 250–150 ms before self-timed saccades. The correlation coefficients averaged 0.02 ± 0.25 (median, 0.08) and −0.07 ± 0.26 (−0.04) for the self-timed saccade task and the memory saccade task, respectively, and were not different from zero in either task (two-tailed t test, p > 0.05). Spearman's rank correlation coefficients computed for the same sets of data averaged 0.06 ± 0.22 (median, 0.06) and −0.02 ± 0.22 (−0.01) for the self-timed task and memory task, respectively, and were not statistically different from zero in either paradigm (p > 0.05). We also found that correlation between saccade latency and other saccade parameters (peak velocity and accuracy) was very small in both saccade paradigms. In the self-timed saccade task, correlation coefficients computed for 48 individual recording sessions averaged −0.10 ± 0.23 (SD, velocity) and 0.05 ± 0.24 (accuracy). In the memory saccade task, the values averaged −0.01 ± 0.27 (velocity) and −0.03 ± 0.21 (accuracy).
The results of correlation analyses suggest that the times of self-timed saccades could be regulated by the times of neuronal activity. However, the median of correlation coefficients computed from individual neurons was only 0.62 (Fig. 7A). The weak correlation between latencies could be a result of the relatively large variability of firing rate in individual neurons; neuronal latency measured from the spike density for five trials (n to n + 4th, for example) was sometimes longer than that measured from the spike density for the following five trials (n + 1 to n + 5th) (Fig. 6B). Similarly, the shallow regression slopes for many neurons (Fig. 7D, supplemental Fig. 2, available at www.jneurosci.org as supplemental material) resulted from the relatively large trial-by-trial variation in neuronal latencies, compared with the variation in saccade latencies (Fig. 7B); whereas the noise in the instantaneous firing rate increases the variation in neuronal latencies, the times of saccades are determined by the population of neurons and are generally insensitive to the small fluctuations of the firing rate in each neuron (supplemental Fig. 3, available at www.jneurosci.org as supplemental material). This is consistent with the observation that the variation in individual neuronal latency was statistically greater than the variation in saccade latency in the self-timed saccade task (Fig. 7B) (paired t test, p < 10−3).
To reveal the time course of the population activity in the self-timed task, and to examine whether the times of threshold crossing could determine the times of saccades, we performed the analysis that was similar to the one developed by Maimon and Assad (2006). For each neuron, the data were divided into five groups according to saccade latencies so that each group contained equal number of trials. Then, the data were aligned on either the cue offset or the initiation of saccades, and were averaged to obtain five spike density curves (ς = 15 ms). Figure 8A plots the traces of the population activity aligned either on the cue (left) or saccades (right). Each trace in the right panel is shifted in time so that the time of saccade is placed at the mean of saccade latency relative to the cue offset for the relevant trials (vertical line). The time course of the population activity in Figure 8A appears to be consistent with the hypothesis that the time of saccade is regulated by the time when the neuronal activity reaches the predetermined threshold. When we applied the regression analysis in Figures 6 and 7D to the traces of the population activity, the regression slopes (type II) were 0.98, 1.21, 1.46, and 2.46 for the levels of neuronal threshold at 90, 70, 50, and 30% of the maximal firing modulation, respectively, and the corresponding correlation coefficients were 0.97, 0.98, 0.99, and 0.80, respectively. The difference in regression slopes for the population activity from those for individual neurons could be caused by the greater variation of firing in individual neurons (computer simulation showed that the noise in neuronal activity reduces both the regression slope and the correlation coefficient; see supplemental Fig. 3, available at www.jneurosci.org as supplemental material). Nevertheless, the analyses in individual neurons revealed the difference in neuronal activity between the self-timed saccade task and the memory saccade task, whereas the analyses in the population activity showed that neuronal activity reached the constant level immediately before the self-timed saccades.
Figure 8.
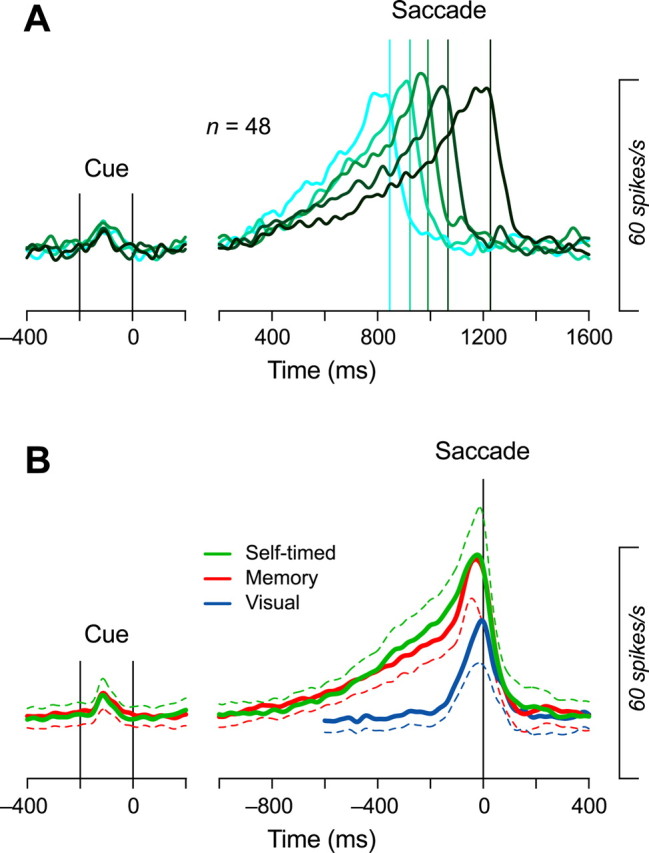
Time courses of the population activity. A, Activity in the self-timed saccade task. For each neuron, data were divided into five groups according to saccade latencies. Data were aligned either on the cue (left) or saccades (right), then were averaged across the population. In the right panel, traces are shifted in time so that the times of saccades are placed at the means of the saccade latency relative to the cue offset (vertical lines). B, Comparison between the three saccade paradigms. Data for 48 neurons are aligned on the cue (left) or saccades (right). Dashed traces indicate plus or minus 95% confidence interval. Note that the population activity for the self-timed task was slightly enhanced ∼400 ms before saccades in comparison with that for the memory saccade task.
To analyze further the time course of the population activity, Figure 8B compares the data across the three saccade paradigms, aligned on the cue (left) or saccades (right). The firing rate increased gradually in the memory saccade task (red trace) and in the self-timed task (green trace), and the activity was slightly enhanced ∼400 ms before the initiation of saccades in the self-timed task, compared with the activity in the memory saccade task. This slight difference in neuronal activity between the tasks was unlikely to be related to the occurrence of small saccades within the fixation window during the delay period. We found microsaccades (net eye speed >20°/s, mean amplitude, 0.84 ± 0.44°) during the period starting from the cue offset to 100 ms before the targeting saccade in 34% of the self-timed saccade trials and in 41% of the memory saccade trials (supplemental Fig. 4, available at www.jneurosci.org as supplemental material). Most microsaccades occurred within 500 ms after the cue offset, and only a small fraction of microsaccades were found several hundred milliseconds before the initiation of saccades. The numbers of microsaccades during the 500 ms immediately before the initiation of targeting saccades averaged 0.05 ± 0.06 and 0.04 ± 0.05 per trial (n = 48) for the self-timed saccade task and the memory saccade tasks, respectively, and these values were not statistically different (paired t test, p = 0.11). Furthermore, the basic pattern of population activity shown in Figure 8A is unlikely to be related to the occurrence of microsaccades; the ramp-up of firing rate toward the initiation of targeting saccades was also found even when the population activities were computed from the selected self-timed saccade trials that contained no microsaccade during the delay period (supplemental Fig. 5, available at www.jneurosci.org as supplemental material). Although the difference in the population activity found in Figure 8B might be attributed to the difference in task difficulty, we do not have available data to examine this possibility. The same neurons showed no gradual buildup of activity before saccades in the visual task (blue trace).
Comparison of saccade-related burst activity across paradigms
Consistent with previous studies (Schlag and Schlag-Rey, 1984; Wyder et al., 2003, 2004; Tanaka, 2005), many neurons in the VA/VL thalamus showed a brief, presaccadic burst of activity which could also regulate saccade initiation (Fig. 2, blue dots). Because the previous study demonstrated that local inactivation of the VL thalamus resulted in a greater deficit of saccades in the self-timed task than in the memory saccade task (Tanaka, 2006), the saccade signals in the motor thalamus might be greater for self-initiated saccades. However, like the two example neurons plotted in Figure 9A, most burst neurons showed activities that were comparable between the memory saccade task and the self-timed task, whereas the magnitude of activity in these two paradigms was as large as (Fig. 9A, top row) or greater than (bottom row) that in the visual saccade task. We examined activities of 124 thalamic neurons that had a presaccadic burst of activity, including 28 neurons that showed a significant delay period activity in the memory saccade task. Of these, 109 neurons were tested for all three saccade paradigms, whereas 15 neurons were tested only for the memory saccade task and the visual saccade task. Among the 109 neurons, only 14% (n = 15) of neurons showed greater activity during the self-timed task than during the memory saccade task (Fig. 9B) (one-way ANOVA and post hoc comparisons, p < 0.05). In contrast, 44% (n = 55 of 124) showed greater activity during the memory saccade task than during the visual saccade task (Fig. 9C). Across the whole population of neurons, activity during the memory saccade task did not differ from that during the self-timed task (paired t test, two-tailed, p = 0.18), but it did differ statistically from activity during the visual saccade task (p < 10−5).
Figure 9.
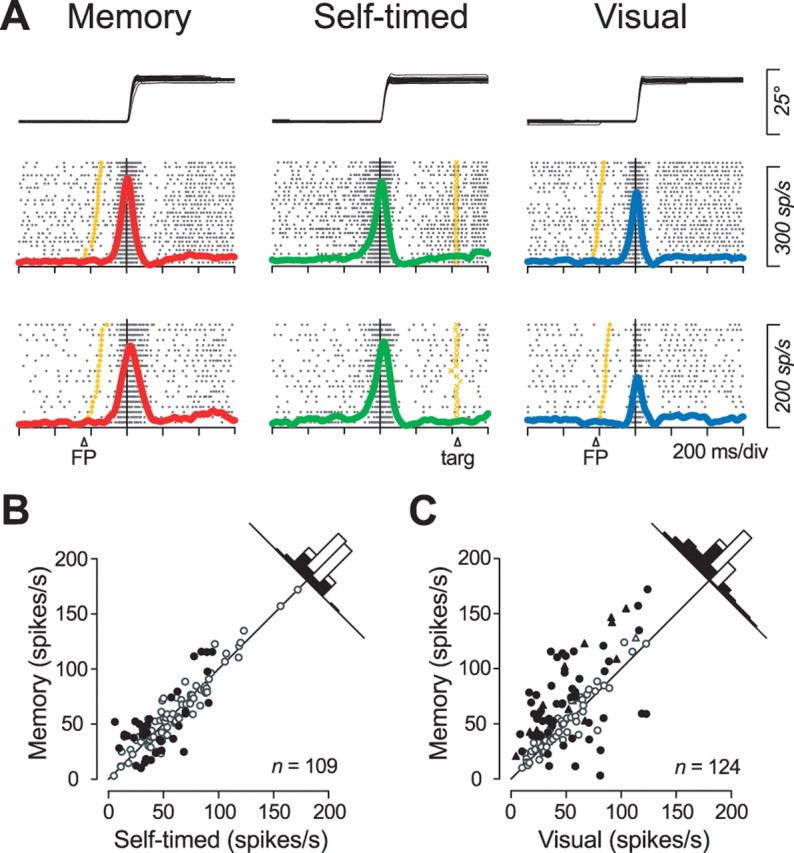
Comparison of presaccadic burst activity between three different tasks in the preferred direction. A, Activity of two example neurons aligned on saccade initiation. B, C, Quantitative comparison of burst activity measured during a 150 ms window within a 350 ms interval starting from 200 ms before saccade initiation. The measuring window was placed to obtain maximal activity across paradigms. Filled symbols indicate data with a significant difference according to multiple comparisons (Scheffé, p < 0.05). Data for neurons that were not examined in the self-timed task are plotted by triangles in C.
Figure 10A compares the relative magnitudes of neuronal activity during the three saccade paradigms. The firing rates measured for a 150 ms interval immediately before and during saccades were normalized so that the distance from each side of the triangle was proportional to the inverse of the firing rate measured during the corresponding task (i.e., the sum of the inverse of firing rates measured for the three paradigms was normalized for the height of the triangle). Although many neurons altered their activity depending on the paradigm (n = 83; one-way ANOVA, p < 0.05), the population of neurons showed no clear preference for self-timed saccades. A similar tendency was also found in another class of neurons that showed a postsaccadic burst of activity (n = 65) (Fig. 10B, one of these neurons also had a significant delay period activity). Thus, the burst activity associated with saccades in the thalamus did not discriminate how the timing of the movement was determined, although the activity was often enhanced when the saccade goals were determined internally, based on memory of the cue location. These results suggest that the loss of burst signals after thalamic inactivation should not be responsible for the greater deficits in the initiation of self-timed saccades reported previously.
Figure 10.

Relative magnitudes of saccade-related burst activity across three paradigms. A, The maximal activity before and during saccades was measured for each presaccadic neuron and paradigm, as in Figure 8, B and C. Data for the three tasks were normalized so that the distance from each side of the triangle is proportional to the inverse of the firing rate measured for the corresponding task. The data points on each dashed line indicate neurons showing an equal amount of activity for the two tasks. B, Data from postsaccadic burst neurons. The neuronal activity was measured during a 150 ms time window located within a 350 ms interval starting from 50 ms after saccade initiation.
Discussion
Previous studies have shown that inactivation of the primate motor thalamus impairs self-triggering of limb (van Donkelaar et al., 2000) or eye (Tanaka, 2006) movements. To explore the signals through the thalamus that regulate the timing of self-initiated movements, we examined two types of neuronal activity that preceded saccades. Many neurons in the paralaminar part of the VL thalamus and the adjacent VA nucleus exhibited a buildup of activity during the delay period of memory saccade tasks. By analyzing the time course of firing in probe trials that had a longer delay and were presented at a lower probability, we found that neuronal activity predicted the timing of the FP offset; the time course of the preparatory activity presumably reflected the monkeys' expectation of the occurrence of an external event triggering saccades. Because the delay period activity was directional for more than half of the neurons (55%) (Fig. 3B), the activity was likely to be related to saccade preparation, rather than to a generic code of passage of time. This is consistent with the fact that the level of neuronal firing was stable during the extended delay period in the probe trial (Fig. 5C). As long as monkeys were required to make a saccade in response to FP offset in the traditional memory saccade task, neither the timing nor the magnitude of neuronal activity correlated with the movement timing. However, once monkeys were allowed to use subjective time information to trigger movements in the self-timed saccade task, the times of neuronal activity and the times of saccades were correlated with each other. These results suggest a novel view of the roles of the motor thalamus in the generation of voluntary movements. Neurons in the motor thalamus carry preparatory signals that keep track of elapsed time until the expected time of movements, while the brain consults this information to decide movement timing when, and only when, subjects are required to generate a self-timed movement. The loss of these signals is likely to be responsible for the previous findings showing that inactivation of the VL thalamus delays self-timed, contraversive saccades (Tanaka, 2006).
Another type of signal in the motor thalamus that could regulate saccade timing is a presaccadic burst of activity. When we compared the magnitudes of burst activity associated with saccades, many neurons displayed greater activity in the memory saccade task than in the visual saccade task, consistent with the previous study (Tanibuchi and Goldman-Rakic, 2005). Thus, the magnitudes of the burst activity depended how the goals of saccades were determined. Because saccades were faster and more accurate in the visual saccade task than in the other tasks, one might argue that the reduced saccade-related activity during the visual saccade task observed in this study was related to the excellence of saccade performance in the task. However, the previous study demonstrated that inactivation of the thalamus neither increased velocity nor improved accuracy (Tanaka, 2006), suggesting that the reduced saccade-related activity in the visual saccade task cannot be explained by the difference in saccade performance from the other tasks. Because the activity of saccade-related neurons in the basal ganglia is also known to be enhanced in the memory saccade task in comparison with the visual saccade task (Hikosaka and Wurtz, 1983), some of these signals might come from the basal ganglia. On the other hand, the sizes of burst activities were not influenced by how the timing of saccades was determined. When we compared the perimovement burst activities between the memory saccade task and the self-timed saccade task, only a minority of neurons showed greater activity in the self-timed task than in the memory saccade task, and the population of neurons as a whole showed no systematic preference for saccades in either task. These results appear to be consistent with the previous findings showing that, for the whole population of neurons, the magnitudes of the transient, movement-related activities in the basal ganglia (Mink and Thach, 1991; Kimura et a., 1992; Lee and Assad, 2003; Turner and Anderson, 2005) and cerebral cortex (Okano and Tanji, 1987; Thaler et al., 1988) are comparable between externally triggered and self-timed limb movements. Because most burst neurons were equally active before saccades in both tasks, the loss of the presaccadic transient signals in the motor thalamus may not be responsible for the deficits in self-initiated saccades found in the previous inactivation experiments (Tanaka, 2006).
The results of this and previous inactivation experiments strongly suggest a causal role for the gradual buildup of signals in the motor thalamus in the triggering of self-timed saccades. Where do these signals come from? Unfortunately, we do not have any direct evidence showing the anatomical connections of these thalamic neurons. Most of them were recorded from the paralaminar part of the VL thalamus, including area X, whereas only a few neurons were located in the VA thalamus (Fig. 2). Anatomical studies have shown that these sites receive inputs from both the basal ganglia and the cerebellum, although the inputs from the latter appear to be dominant (DeVito and Anderson, 1982; Alexander et al., 1986; Anderson and Turner, 1991; Middleton and Strick, 2000). Nevertheless, we favor the hypothesis that the thalamic neurons reported here are located within the pathways from the basal ganglia to the cortex, because both the neuronal responses and the effects of inactivation were qualitatively similar to those reported previously in the basal ganglia. In terms of the neuronal response, a gradual elevation in firing rate preceding self-timed limb movements has been reported in multiple nuclei in the basal ganglia (Schultz and Romo, 1992; Lee and Assad, 2003). In terms of the effects of inactivation, damage to the basal ganglia causes difficulty in performing and a delay in the initiation of self-triggering of movements (Hore et al., 1977; Glickstein and Stein, 1991). Furthermore, several lines of evidence suggest that the basal ganglia is essential for the processing of interval timing in the range of seconds (Rao et al., 2001; Buhusi and Meck, 2005), which must be necessary to generate a saccade at the correct time in the self-timed saccade task used in this study, whereas the cerebellum plays roles in processing the timing of repetitive events over a shorter period of time (Lewis and Miall, 2003; Ivry and Spencer, 2004; Mauk and Buonomano, 2004).
Because there are projections from the VA/VL thalamus to the striatum (Haber and McFarland, 2001; Smith et al., 2004), the signals reported here could regulate neural processes within the basal ganglia. Alternatively, neuronal signals in the motor thalamus may also regulate saccade planning in the cerebral cortex through the massive thalamocortical projections (Alexander et al., 1986; Anderson and Turner, 1991; Shook et al., 1991; Tian and Lynch, 1997; Middleton and Strick, 2000; McFarland and Haber, 2002). Consistent with the latter possibility, previous studies showed a gradual elevation of the firing rate in the frontal (Okano and Tanji, 1987; Kurata and Wise, 1988; Romo and Schultz, 1992) and parietal (Maimon and Assad, 2006) cortices before self-timed movements; some of these neurons displayed anticipatory activity in the externally triggered task as well (Romo and Schultz, 1992). In addition, when human subjects expect the occurrence of an external event to trigger movements, an event-related scalp potential known as the “contingent negative variation” (CNV) develops over the medial frontal cortex, predicting the timing of the event (Walter et al., 1964; Pfeuty et al., 2005). Both the similarity of the time courses of neuronal activities and the anatomical connection from the VL thalamus to the medial frontal cortex imply that these thalamic neurons are within pathways that generate the cortical potential. Interestingly, CNV decreases significantly in patients with Parkinson's disease (Ikeda et al., 1997) who also have difficulty with the initiation of self-timed movements. Difficulty in the self-triggering of movements in these patients is possibly attributable to the loss of subcortical signals that gradually increase over time, like that in the neurons reported here.
Footnotes
This work was supported by grants from the Japan Science and Technology Agency and the Ministry of Education, Culture, Sports, Science and Technology of Japan. I thank A. Yoshida, J. Kunimatsu, and A. Matsushima for comments on a previous version of this manuscript, S. Hirano and T. Shiraishi for technical assistance, and M. Suzuki for administrative help. One animal was provided by the Primate Research Institute of Kyoto University.
References
- Alexander GE, DeLong MR, Strick PL. Parallel organization of functionally segregated circuits linking basal ganglia and cortex. Annu Rev Neurosci. 1986;9:357–381. doi: 10.1146/annurev.ne.09.030186.002041. [DOI] [PubMed] [Google Scholar]
- Anderson ME, Turner RS. Activity of neurons in cerebellar-receiving and pallidal-receiving areas of the thalamus of the behaving monkey. J Neurophysiol. 1991;66:879–893. doi: 10.1152/jn.1991.66.3.879. [DOI] [PubMed] [Google Scholar]
- Buhusi CV, Meck WH. What makes us tick? Functional and neural mechanisms of interval timing. Nat Rev Neurosci. 2005;6:755–765. doi: 10.1038/nrn1764. [DOI] [PubMed] [Google Scholar]
- Carpenter RH, Williams ML. Neural computation of log likelihood in control of saccadic eye movements. Nature. 1995;377:59–62. doi: 10.1038/377059a0. [DOI] [PubMed] [Google Scholar]
- DeVito JL, Anderson ME. An autoradiographic study of efferent connections of the globus pallidus in Macaca mulatta. Exp Brain Res. 1982;46:107–111. doi: 10.1007/BF00238104. [DOI] [PubMed] [Google Scholar]
- Glickstein M, Stein J. Paradoxical movement in Parkinson's disease. Trends Neurosci. 1991;14:480–482. doi: 10.1016/0166-2236(91)90055-y. [DOI] [PubMed] [Google Scholar]
- Haber S, McFarland NR. The place of the thalamus in frontal cortical-basal ganglia circuits. Neuroscientist. 2001;7:315–324. doi: 10.1177/107385840100700408. [DOI] [PubMed] [Google Scholar]
- Hanes DP, Schall JD. Neural control of voluntary movement initiation. Science. 1996;274:427–430. doi: 10.1126/science.274.5286.427. [DOI] [PubMed] [Google Scholar]
- Hikosaka O, Wurtz RH. Visual and oculomotor functions of monkey substantia nigra pars reticulata. III. Memory-contingent visual and saccade responses. J Neurophysiol. 1983;49:1268–1284. doi: 10.1152/jn.1983.49.5.1268. [DOI] [PubMed] [Google Scholar]
- Hore J, Meyer-Lohmann J, Brooks VB. Basal ganglia cooling disables learned arm movements of monkeys in the absence of visual guidance. Science. 1977;195:584–586. doi: 10.1126/science.402029. [DOI] [PubMed] [Google Scholar]
- Ikeda A, Shibasaki H, Kaji R, Terada K, Nagamine T, Honda M, Kimura J. Dissociation between contingent negative variation (CNV) and bereitschaftspotential (BP) in patients with parkinsonism. Electroencephalogr Clin Neurophysiol. 1997;102:142–151. doi: 10.1016/s0921-884x(96)95067-5. [DOI] [PubMed] [Google Scholar]
- Ivry RB, Spencer RM. The neural representation of time. Curr Opin Neurobiol. 2004;14:225–232. doi: 10.1016/j.conb.2004.03.013. [DOI] [PubMed] [Google Scholar]
- Janssen P, Shadlen MN. A representation of the hazard rate of elapsed time in macaque area LIP. Nat Neurosci. 2005;8:234–241. doi: 10.1038/nn1386. [DOI] [PubMed] [Google Scholar]
- Kim JN, Shadlen MN. Neural correlates of a decision in the dorsolateral prefrontal cortex of the macaque. Nat Neurosci. 1999;2:176–185. doi: 10.1038/5739. [DOI] [PubMed] [Google Scholar]
- Kimura M, Aosaki T, Hu Y, Ishida A, Watanabe K. Activity of primate putamen neurons is selective to the mode of voluntary movement: visually guided, self-initiated or memory-guided. Exp Brain Res. 1992;89:473–477. doi: 10.1007/BF00229870. [DOI] [PubMed] [Google Scholar]
- Kurata K, Wise SP. Premotor and supplementary motor cortex in rhesus monkeys: neuronal activity during externally- and internally-instructed motor tasks. Exp Brain Res. 1988;72:237–248. doi: 10.1007/BF00250247. [DOI] [PubMed] [Google Scholar]
- Lee IH, Assad JA. Putaminal activity for simple reactions or self-timed movements. J Neurophysiol. 2003;89:2528–2537. doi: 10.1152/jn.01055.2002. [DOI] [PubMed] [Google Scholar]
- Lewis PA, Miall RC. Distinct systems for automatic and cognitively controlled time measurement: evidence from neuroimaging. Curr Opin Neurobiol. 2003;13:250–255. doi: 10.1016/s0959-4388(03)00036-9. [DOI] [PubMed] [Google Scholar]
- Maimon G, Assad JA. A cognitive signal for the proactive timing of action in macaque LIP. Nat Neurosci. 2006;9:948–955. doi: 10.1038/nn1716. [DOI] [PubMed] [Google Scholar]
- Mauk MD, Buonomano DV. The neural basis of temporal processing. Annu Rev Neurosci. 2004;27:307–340. doi: 10.1146/annurev.neuro.27.070203.144247. [DOI] [PubMed] [Google Scholar]
- McFarland NR, Haber SN. Thalamic relay nuclei of the basal ganglia form both reciprocal and nonreciprocal cortical connections, linking multiple frontal cortical areas. J Neurosci. 2002;22:8117–8132. doi: 10.1523/JNEUROSCI.22-18-08117.2002. [DOI] [PMC free article] [PubMed] [Google Scholar]
- Middleton FA, Strick PL. Basal ganglia and cerebellar loops: motor and cognitive circuits. Brain Res Brain Res Rev. 2000;31:236–250. doi: 10.1016/s0165-0173(99)00040-5. [DOI] [PubMed] [Google Scholar]
- Mink JW, Thach WT. Basal ganglia motor control. I. Nonexclusive relation of pallidal discharge to five movement modes. J Neurophysiol. 1991;65:273–300. doi: 10.1152/jn.1991.65.2.273. [DOI] [PubMed] [Google Scholar]
- Mushiake H, Inase M, Tanji J. Neuronal activity in the primate premotor, supplementary, and precentral motor cortex during visually guided and internally determined sequential movements. J Neurophysiol. 1991;66:705–718. doi: 10.1152/jn.1991.66.3.705. [DOI] [PubMed] [Google Scholar]
- Okano K, Tanji J. Neuronal activities in the primate motor fields of the agranular frontal cortex preceding visually triggered and self-paced movement. Exp Brain Res. 1987;66:155–166. doi: 10.1007/BF00236211. [DOI] [PubMed] [Google Scholar]
- Pfeuty M, Ragot R, Poutha V. Relationship between CNV and timing of an upcoming event. Neurosci Lett. 2005;382:106–111. doi: 10.1016/j.neulet.2005.02.067. [DOI] [PubMed] [Google Scholar]
- Rao SM, Mayer AR, Harrington DL. The evolution of brain activation during temporal processing. Nat Neurosci. 2001;4:317–323. doi: 10.1038/85191. [DOI] [PubMed] [Google Scholar]
- Roitman JD, Shadlen MN. Response of neurons in the lateral intraparietal area during a combined visual discrimination reaction time task. J Neurosci. 2002;22:9475–9489. doi: 10.1523/JNEUROSCI.22-21-09475.2002. [DOI] [PMC free article] [PubMed] [Google Scholar]
- Romo R, Schultz W. Role of primate basal ganglia and frontal cortex in the internal generation of movements. III. Neuronal activity in the supplementary motor area. Exp Brain Res. 1992;91:396–407. doi: 10.1007/BF00227836. [DOI] [PubMed] [Google Scholar]
- Schlag J, Schlag-Rey M. Visuomotor functions of central thalamus in monkey. II. Unit activity related to visual events, targeting, and fixation. J Neurophysiol. 1984;51:1175–1195. doi: 10.1152/jn.1984.51.6.1175. [DOI] [PubMed] [Google Scholar]
- Schultz W, Romo R. Role of primate basal ganglia and frontal cortex in the internal generation of movements. I. Preparatory activity in the anterior striatum. Exp Brain Res. 1992;91:363–384. doi: 10.1007/BF00227834. [DOI] [PubMed] [Google Scholar]
- Shadlen MN, Newsome WT. Neural basis of a perceptual decision in the parietal cortex (area LIP) of the rhesus monkey. J Neurophysiol. 2001;86:1916–1936. doi: 10.1152/jn.2001.86.4.1916. [DOI] [PubMed] [Google Scholar]
- Shook BL, Schlag-Rey M, Schlag J. Primate supplementary eye field. II. Comparative aspects of connections with the thalamus, corpus striatum, and related forebrain nuclei. J Comp Neurol. 1991;307:562–583. doi: 10.1002/cne.903070405. [DOI] [PubMed] [Google Scholar]
- Smith PL, Ratcliff R. Psychology and neurobiology of simple decisions. Trends Neurosci. 2004;27:161–168. doi: 10.1016/j.tins.2004.01.006. [DOI] [PubMed] [Google Scholar]
- Smith Y, Raju DV, Pare JF, Sidibe M. The thalamostriatal system: a highly specific network of the basal ganglia circuitry. Trends Neurosci. 2004;27:520–527. doi: 10.1016/j.tins.2004.07.004. [DOI] [PubMed] [Google Scholar]
- Tanaka M. Involvement of the central thalamus in the control of smooth pursuit eye movements. J Neurosci. 2005;25:5866–5876. doi: 10.1523/JNEUROSCI.0676-05.2005. [DOI] [PMC free article] [PubMed] [Google Scholar]
- Tanaka M. Inactivation of the central thalamus delays self-timed saccades. Nat Neurosci. 2006;9:20–22. doi: 10.1038/nn1617. [DOI] [PubMed] [Google Scholar]
- Tanaka M. Spatiotemporal properties of eye position signals in the primate central thalamus. Cereb Cortex. 2007;17:1504–1515. doi: 10.1093/cercor/bhl061. [DOI] [PubMed] [Google Scholar]
- Tanibuchi I, Goldman-Rakic PS. Comparison of oculomotor neuronal activity in paralaminar and mediodorsal thalamus in the rhesus monkey. J Neurophysiol. 2005;93:614–619. doi: 10.1152/jn.00969.2003. [DOI] [PubMed] [Google Scholar]
- Thaler DE, Rolls ET, Passingham RE. Neuronal activity of the supplementary motor area (SMA) during internally and externally triggered wrist movements. Neurosci Lett. 1988;93:264–269. doi: 10.1016/0304-3940(88)90093-6. [DOI] [PubMed] [Google Scholar]
- Tian JR, Lynch CJ. Subcortical input to the smooth pursuit and saccadic eye movement subregions of the frontal eye field in Cebus monkey. J Neurosci. 1997;17:9233–9247. doi: 10.1523/JNEUROSCI.17-23-09233.1997. [DOI] [PMC free article] [PubMed] [Google Scholar]
- Turner RS, Anderson ME. Context-dependent modulation of movement-related discharge in the primate globus pallidus. J Neurosci. 2005;25:2965–2976. doi: 10.1523/JNEUROSCI.4036-04.2005. [DOI] [PMC free article] [PubMed] [Google Scholar]
- Usher M, McClelland JL. The time course of perceptual choice: the leaky, competing accumulator model. Psychol Rev. 2001;108:550–592. doi: 10.1037/0033-295x.108.3.550. [DOI] [PubMed] [Google Scholar]
- van Donkelaar P, Stein JF, Passingham RE, Miall RC. Neuronal activity in the primate motor thalamus during visually triggered and internally generated limb movements. J Neurophysiol. 1999;82:934–945. doi: 10.1152/jn.1999.82.2.934. [DOI] [PubMed] [Google Scholar]
- van Donkelaar P, Stein JF, Passingham RE, Miall RC. Temporary inactivation in the primate motor thalamus during visually triggered and internally generated limb movements. J Neurophysiol. 2000;83:2780–2790. doi: 10.1152/jn.2000.83.5.2780. [DOI] [PubMed] [Google Scholar]
- Walter WG, Cooper R, Aldridge VJ, McCallum WC, Winter AL. Contingent negative variation: an electrical sign of sensorimotor association and expectancy in the human brain. Nature. 1964;203:380–384. doi: 10.1038/203380a0. [DOI] [PubMed] [Google Scholar]
- Wyder MT, Massoglia DP, Stanford TR. Quantitative assessment of the timing and tuning of visual-related, saccade-related, and delay period activity in primate central thalamus. J Neurophysiol. 2003;90:2029–2052. doi: 10.1152/jn.00064.2003. [DOI] [PubMed] [Google Scholar]
- Wyder MT, Massoglia DP, Stanford TR. Contextual modulation of central thalamic delay-period activity: representation of visual and saccadic goals. J Neurophysiol. 2004;91:2628–2648. doi: 10.1152/jn.01221.2003. [DOI] [PubMed] [Google Scholar]