

Abstract
Brain-derived neurotrophic factor (BDNF) has been reported to play a critical role in modulating plasticity in developing sensory cortices. In the visual cortex, maturation of neuronal circuits involving GABAergic neurons has been shown to trigger a critical period. To date, several classes of GABAergic neurons are known, each of which are thought to play distinct functions. Of these, parvalbumin (PV)-containing, fast-spiking (FS) cells are suggested to be involved in the initiation of the critical period. Here, we report that BDNF plays an essential role in the normal development of PV–FS cells during a plastic period in the barrel cortex. We found that characteristic electrophysiological properties of PV–FS cells, such as low spike adaptation ratio, reduced voltage sags in response to hyperpolarization, started to develop around the second postnatal week and attained adult level in several days. We also found that immunoreactivity against PV was also acquired after the similar developmental time course. Then, using BDNF(−/−) mice, we found that these electrophysiological as well as chemical properties were underdeveloped or did not appear at all. We conclude BDNF regulates the development of electrophysiological and immunohistochemical characteristics in PV–FS cells. Because BDNF is suggested to regulate the initiation of plasticity, our results strongly indicate that BDNF is involved in the regulation of the critical period by promoting the functional development of PV–FS GABAergic neurons.
Keywords: BDNF, GABAergic neurons, parvalbumin, barrel cortex, fast spiking, critical period, local circuit
Introduction
The neurotrophin family of growth factors has been identified as being key regulatory factors for survival, neuronal differentiation, axonal as well as dendritic growth, and synaptic formation (Thoenen, 1995; Lewin and Barde, 1996). In addition to such classical roles, recent studies have revealed that neurotrophins also promote specific forms of synaptic plasticity during the postnatal period (Kovalchuk et al., 2004; Nagappan and Lu, 2005). In the visual cortex, where activity-dependent plasticity has been studied extensively, the overexpression of brain-derived neurotrophic factor (BDNF) has been shown to accelerate the critical period of plasticity (Huang et al., 1999; Fagiolini et al., 2004; Hensch, 2005). Recently, initiation of the critical period has been reported to be triggered by the maturation of the GABAergic neuronal network, especially those of parvalbumin (PV)-containing, fast-spiking (FS) GABAergic neurons that elicit α1 subunit-mediated responses in the postsynaptic membrane (Hensch, 2005). In fact, GABAergic neurons are highly heterogeneous groups of cells and are classified into subpopulations, each of which appear to be implicated in specific functional roles (Kawaguchi and Kubota, 1997; Markram et al., 2004). BDNF-overexpression mice have been reported to have increased numbers of PV cells, but it was not clear how physiological properties of PV cells develop normally and how they are regulated by BDNF, which seems to be quite relevant to the observed acceleration of the critical period by an excess of BDNF (Huang et al., 1999). Another sensory cortical area that also exhibits activity-dependent plasticity with the critical period is the rodent barrel cortex, where the early critical period for thalamocortical synapses lasts until the first postnatal week, which is then followed by another plastic period for intracortical synapses in layer 4 and/or layer 4–2/3 connections (Stern et al., 2001; Bender et al., 2003). Such “late” plasticity is primarily supposed to underlie the use-dependent change of cortical representation, or map plasticity for whiskers (Feldman and Brecht, 2005). Thus, it is of particular interest to understand whether BDNF has any regulatory effect on the maturation of FS neurons, specifically whether BDNF promotes the acquisition of electrophysiological and/or chemical characteristics and, if so, at what stage of development. Might this be related to known plastic periods? To answer these questions, we first identified the normal development of several properties of FS cells that are innervated from the thalamus in layer 4 and then compared them with BDNF(−/−) mice. We found that electrophysiological and chemical properties of thalamo-recipient FS cells attain maturation around the second postnatal week and BDNF is required for its maturation, thus providing evidence that BDNF regulates functional map plasticity throughout the maturation of FS GABAergic neurons.
Materials and Methods
Animals.
The experimental protocols were approved by the Ethics Review Committee for Animal Experimentation of the National Institute of Neuroscience. A line of BDNF(−/−) mice was maintained on a C57BL/6J genetic background by heterozygote males, which were backcrossed onto the C57BL/6J females continuously at least seven generations before homozygotes were produced. BDNF(+/+) littermate mice were used as controls for all experiments (histology and electrophysiology). All experiments using the BDNF(−/−) mice phenotype were analyzed under double-blind conditions with no knowledge of genotype. Data were analyzed by a colleague who had not been informed about the phenotype analysis.
Electrophysiology.
Brain slices (350–500 μm thickness) were prepared from BDNF(+/+) and BDNF(−/−) mice using a rotor slicer as described previously (Agmon and Connors, 1991; Itami et al., 2001). Mice (7–30 d old) were anesthetized deeply with Ethrane (0.9 ml/kg body weight; Abbott Labs, Abbott, IL) and decapitated. The brain was rapidly transferred to ice-cold oxygenated slicing artificial CSF (ACSF) consisting of the following (in mm): 230 sucrose, 3 KCl, 1.2 NaH2PO4, 10 MgSO4, 26 NaHCO3, and 10 glucose. Thalamocortical slices were immediately transferred to a holding chamber where they remained submerged in oxygenated recording ACSF consisting of the following (in mm): 124 NaCl, 3 KCl, 26 NaHCO3, 1.3 MgSO4, 2 CaCl2, 1.2 NaH2PO4, and 10 glucose, pH 7.4 (295–305 mOsm). Slices were preincubated for at least 1 h at room temperature, and each slice was transferred to a recording chamber placed on the stage of an upright microscope (27–30°C).
Whole-cell current-clamp recordings were obtained from visually identified layer 4 barrel neurons using infrared differential interference contrast optics. Micropipettes (5–7 MΩ) were pulled from borosilicate glass capillary tubings (Sutter Instruments, Novato, CA). Patch pipette solutions contained (in mm) 105 K-gluconate, 30 KCl, 10 HEPES, 0.5 EGTA, 0.5 MgCl2, 12 Na-phosphocreatine, 3 Mg-ATP, and 0.5 Na2-GTP, pH 7.3 (295 mOsm). Responses were recorded using an Axopatch 200B amplifier (Molecular Devices, Palo Alto, CA), low-pass filtered at 5 kHz (NF Corporation, Yokohama, Japan), digitally sampled at 10 kHz, and monitored with pClamp software (Molecular Devices) running on a Pentium personal computer. To isolate neurons innervated by the thalamus, a concentric bipolar stimulating electrode was placed on the ventrobasal nucleus of the thalamus, and only recordings from cells in which thalamic stimulation was able to elicit EPSPs were used for analysis. Resting potentials were measured just after the patched membranes were ruptured. Input resistances and time constants of cells were determined by passing hyperpolarizing current pulses (duration, 500 ms) inducing voltage shifts of 6–15 mV negative to the resting potentials.
Data analysis.
The spike frequency adaptation ratio was defined as the ratio of the first interspike interval divided by the average of the last three interspike intervals during a 500-ms-long spike train. Current–voltage (I–V) relationships were then examined at various membrane values by injecting a series of square current pulses (500 ms, −20 pA, 10 steps) to reach steady state. The amplitude of afterhyperpolarization (AHP) was measured as a voltage difference between the baseline and the first negative peak after the action potentials at the threshold, where only a single action potential was elicited by depolarizing current injection (Porter et al., 2001). Results are presented as mean ± SEM. In statistical tests, p < 0.05 was considered significant.
Immunohistochemistry.
Mouse pups [postnatal day 4 (P4) to P30] were anesthetized deeply with Ethrane. The brains were removed, cut into a thalamocortical block (∼1 cm thickness), and fixed for two overnight periods in 2% paraformaldehyde (PFA) in phosphate-buffered solution (PB; 0.2 m), followed by cryoprotection by immersion in 30% sucrose. The brains were mounted in Tissue-Tek Cryomold (Sakura Finetek Japan, Tokyo, Japan) and frozen rapidly on dry ice. Thalamocortical blocks were sectioned at a thickness of 40–50 μm on a cryostat (Leica, Wetzlar, Germany) and mounted on glass slides precoated with Vecta-Bond (Vector Laboratories, Burlingame, CA). The sections were washed in Tris-buffered saline (TBS; 30 mm Tris-HCl, pH 7.4, 150 mm NaCl, and 0.1% Tween 20), incubated in blocking solution (4% normal goat serum and 1% bovine serum albumin in TBS) for 90 min at room temperature, and incubated for two overnight periods at 4°C with the primary antibody. The antibodies used were rabbit anti-PV (1:5000; Swant, Bellinzona, Switzerland) and rabbit anti-calbindin D-28k (CB; 1:5000; Swant). After rinsing with TBS, the sections were incubated for 2 h at room temperature with a biotinylated secondary antibody (1:200, goat anti-rabbit; Vector Laboratories), which was then followed by the ABC procedure (ABC elite kit; Vector Laboratories). Every sixth section was stained for cytochrome oxidase activity by incubating the sections in a solution containing 0.01% cytochrome c (Sigma-Aldrich, St. Louis, MO) and 0.05% 3,3′-diaminobenzidine (Sigma-Aldrich) in 0.1 m PB, pH 7.4, to determine the anterior and posterior boundaries of the barrel cortex.
Cell counting.
To quantify the number of PV+ and CB+ cells in the somatosensory cortex, nonstereological count methods were used to compare the number of neuronal bodies stained with immunohistochemistry in BDNF(−/−) and BDNF(+/+) littermate mice. Counts were performed on digitized images obtained from thalamocortical slices as used for electrophysiology including the barrel area captured with an ORCA-ER digital camera (Hamamatsu Photonics, Hamamatsu, Japan) on an Axiophot 2 microscope (Zeiss, Jena, Germany). Immunopositive cells in the barrel cortex across all the layers were counted. Brains from three different mice for each genotype, four to five sections per animal, were analyzed. Because BDNF(−/−) mice hardly survive past P14, obtaining those animals older than P14 was quite difficult, but we had a single BDNF(−/−) mouse that survived until P19 in the past 2 years; thus, the data from that mouse were also included. Photomicrographs were obtained from randomly selected areas containing all layers of the somatosensory tissue, as well as from three different thalamocortical sections (45 μm thickness; areas used for electrophysiology), using a 40× objective. Labeled neurons were counted across all of the layers in BDNF(−/−) and BDNF(+/+) tissue at a different age. For CB counts, heavily labeled CB+ cells were quantified excluding cells in layer 2–3, because pyramidal cells also exhibit CB immunoreactivity in layer 2–3 (Alcantara et al., 1993).
Morphological identification.
For immunohistochemical and morphological characterization of recorded cells, 0.5% neurobiotin was included in the pipette solutions. After whole-cell recordings, the slices containing neurobiotin-loaded cells were fixed by immersion in 4% PFA containing 0.2% picric acid in 0.2 m PB for 1 h at room temperature. This was followed by incubation in PB containing 5% sucrose and Triton X-100 (Sigma-Aldrich) for 30 min. The tissue was frozen with dry ice and thawed in PB. The slices were again incubated in PB containing 0.5% Triton X-100, frozen with dry ice, and thawed in PB to help antibodies penetrate deeper into the slice. The slices were immersed in 4% normal goat serum for 90 min and incubated in a solution for 3 d at 4°C with the rabbit polyclonal antibody against PV (1:5000; Swant). After three rinses in TBS, the slices were incubated for two overnight periods with the following secondary antibodies: anti-rabbit IgG cyanine 5 (1:200; Chemicon, Temecula, CA) and streptavidin–fluorescein (RPN 1232, 1:200; Amersham Biosciences, Piscataway, NJ). After three rinses in TBS and PBS, the slices were then embedded with FluoroGuard antifade reagent (Bio-Rad, Hercules, CA), coverslipped, and sealed with Paper Bond (Kokuyo, Osaka, Japan).
Morphological analysis.
Images of the fluorescently labeled cells were obtained using a confocal laser-scanning microscope using a 60× objective (TCS-SP2; Leica). Confocal images were reconstructed by projection to an XY plane, which was then traced and exported to electronic files. The number of primary dendrites and the total number of dendritic branches were counted, which often extended out of layer 4 and reached layers 2/3 and 5 vertically (approximately <1000 mm) and neighboring barrel columns horizontally (approximately <700 mm). Total dendritic length and total axonal length were measured using NIH Image software. For statistical analysis, Student's t test was used. p < 0.05 was considered significant.
Results
Electrophysiological properties that characterize inhibitory and excitatory neurons
Our first aim was to distinguish inhibitory cells from excitatory ones based on morphology and electrophysiology. For this purpose, we performed whole-cell patch recording using biocytin- or neurobiotin-filled electrodes. Recorded cells were then determined as either excitatory or inhibitory by their morphological properties (Fig. 1A). Those cells having spines, either exhibiting a typical pyramidal-shaped soma with apical and basal dendrites or a small round-shaped cell body with rather symmetrical dendrites, were judged as pyramidal or spiny stellate cells and designated as being excitatory cells (Saint Marie and Peters, 1985; Schubert et al., 2003). The rest were judged as inhibitory cells, which consisted of a variety of cell types such as bitufted, basket, and bipolar cells (Woolsey et al., 1975). We injected currents (depolarizing and hyperpolarizing) into each cell, and three aspects of the cellular response to the injected currents were analyzed in detail with the aim of characterizing the development of intrinsic property in cortical neurons. We first focused on the spike number in response to an increasing amount of depolarizing currents for the duration of 500 ms. Data showed that the responses of inhibitory cells were clearly distinct from those of excitatory cells throughout the development period observed by us. As shown in Figure 1B, inhibitory cells increased spike numbers as the injected current increased throughout the development in the present study. In contrast, excitatory cells were characterized by a sudden decrease in the number of spikes in response to injections of increasing current steps. Such a sudden reduction in spike number is referred to as “spike adaptation” or “spike accommodation.” Previous studies have shown that certain kinds of K channels, such as KV3.1 and KV3.2, which are lacking or found in only small amounts in inhibitory cells, are involved in the generation of spike accommodation (Massengill et al., 1997; Martina et al., 1998). In mice older than 2 weeks of age, spike threshold and the number of spikes per injected current also helped to distinguish inhibitory from excitatory cells. Inhibitory cells needed consistently larger currents to reach spike threshold and exhibited a higher rate of spike number per injected current. This is closely related to the observation that inhibitory cells of that age had lower input resistance than those of excitatory cells (185 ± 16 and 115 ± 9 MΩ for excitatory and inhibitory cells, respectively). Second, we examined spike adaptation ratio that was also helpful in discriminating between excitatory and inhibitory cells. The inset in Figure 1C illustrates the definition of spike adaptation ratio. Because the higher value of this index indicates less adaptation, we call this “spike ratio” (SR) instead of “adaptation ratio” because it is more commonly referred to. Figure 1C plots the SR against age for both morphologically identified excitatory (n = 39) and inhibitory (n = 48) cells. This graph clearly shows that the ratio decreased [negatively correlated with age (slope, −0.041; r = 0.79; p < 0.05)] in excitatory cells but increased slightly [positively correlated with age (slope, 0.011; r = 0.50; p < 0.05)] in inhibitory cells beyond P10. Finally, we studied the amplitude of AHP. Excitatory and inhibitory cells were reported to exhibit characteristic AHPs. Inhibitory cells have a fast sharp AHP; some inhibitory cells have additional complex components, whereas excitatory cells have a slower AHP with smaller amplitude sometimes preceded by a fast AHP, but with smaller amplitude (Porter et al., 2001; Beierlein et al., 2003). We measured the amplitude of the largest negative peak (see Materials and Methods), which occurred at 3.5 ± 3.1 ms (n = 18) in inhibitory cells and at 21.0 ± 6.6 ms (n = 21) in excitatory cells. We found that AHP was substantially larger in inhibitory cells throughout development (Fig. 1D,E). This is consistent with previous work that was performed in slightly older animals (P9–P18) (Porter et al., 2001). In their study, cells with AHPs >10 mV were all inhibitory. In our experiments, of 48 inhibitory cells, only 4 cells exhibited an AHP <10 mV (6 mV at P8, 9 mV at P9, 9 mV at P11, and 9.5 mV at P12), and conversely, all of the excitatory cells exhibited an AHP <9 mV. In conclusion, we judged recorded cells as inhibitory when they met the following criteria: (1) the number of spikes increased without sudden drop over a range of up to 1000 pA of injected current (500 pA in mice younger than P10 because young cells are less tolerant to large current); and (2) AHP was >10 mV. Using such criteria, we identified 112 cells as inhibitory from a total of 153 cells.
Figure 1.

Morphologically identified excitatory and inhibitory cells exhibit distinct electrophysiological properties during development. A, Top, Confocal photomicrograph images of representative inhibitory and excitatory neurons labeled with neurobiotin and their corresponding voltage responses to current steps. Bottom, Subthreshold, threshold, and suprathreshold responses of cells to depolarizing and hyperpolarizing current steps are shown. The amounts of currents injected are indicated on the left; hyperpolarizing current steps started at −20 pA with 20 pA decrements (duration, 500 ms). B, The number of action potentials (AP) is plotted against currents injected, showing distinct profiles between excitatory (black) and inhibitory (red) cells. Excitatory cells exhibited strong adaptation, lower spike threshold, and shallower initial slopes. The latter two characteristics were remarkable especially in aged animals. C, Spike frequency adaptation ratios (SR) of morphologically identified inhibitory (red triangle), spiny stellate (cross), and pyramidal (open triangle) cells in response to depolarizing current (500 ms, 500 pA) plotted against age. The inset shows the definition of SR. D, E, Amplitudes of AHP were plotted against age (D) and SR (E). The inset shows how we measured the amplitude of AHP. Conventions are as in C. Note that all cells with an AHP amplitude >10 mV were morphologically identified as inhibitory cells. PND, Postnatal day.
Developmental changes in adaptation ratio in inhibitory cells
Inhibitory cells were further classified into two subclasses depending on the extent of adaptation (Fig. 2B): one exhibiting substantial adaptation (SR < 0.8) and the other exhibiting less or no adaptation (0.8 < SR). The former corresponds to regular-spiking nonpyramidal cells, and the latter corresponds to FS cells (Kawaguchi, 1995; Gibson et al., 1999; Porter et al., 2001). We next examined the development of the SR from P7 to P26. Figure 2A shows three examples from young animals (P7–P9), all of which exhibit more or less adapting responses. Detailed analysis revealed that before P10, none of the cells had an SR >0.8. Consequently, there are no FS cell (n = 32) at this age (Fig. 2C, left), as far as we could tell from the cell population studied. Nonadapting cells were first encountered at P14. The fraction of adapting cells increased thereafter (Fig. 2C). We also found that immature cells often showed voltage sag in response to a large hyperpolarizing current (Fig. 2A, arrowheads), the amplitude of which decreased with age. Figure 2D compares the amplitude of voltage sag in young (younger than P13; slope, 20 mV/300 pA; n = 15) and aged (older than P14; slope, 3 mV/300 pA; n = 15) animals. The same tendency can be clearly observed in Figure 2E, where amplitudes of voltage sag in individual cells were plotted against age.
Figure 2.

Developmental changes in the electrophysiological properties in inhibitory cells. A, B, Sample traces in response to injected currents. Three immature inhibitory cells (younger than P10) and two mature cells [regular-spiking nonpyramidal cells (RSNP), P22; FS, P15] with or without adaptation are shown. Arrowheads indicate voltage sags in response to large hyperpolarization. C, SR histogram constructed from cells at four different developmental stages, showing a developmental shift toward higher values with age. FS cells (>0.8) appeared only after the second postnatal week. D, I–V relationship of the amplitude of voltage sags in immature (younger than P13) and mature cells (older than P14). E, Individual values of the amplitude of voltage sags were plotted against age. PND, Postnatal day.
Developmental changes in the expressions of Ca-binding proteins
Cortical inhibitory neurons are subdivided into several groups according to the peptides contained (Hof et al., 1999; Markram et al., 2004). Of these, PV is reported to associate with the cells exhibiting a high SR value (Massengill et al., 1997; Rudy et al., 1999; Rudy and McBain, 2001). To confirm this, electrophysiological experiments were followed by immunohistochemical staining using an antibody against PV (Fig. 3A–F). We found that none of the PV-negative cells had an SR value >0.8 (Fig. 3G). As for the PV-positive cells, only 2 of 21 cells had SR values <0.8, and the difference was statistically significant (0.8 ± 0.03 and 0.62 ± 0.02 for PV-positive and -negative cells, respectively; p < 0.01, unpaired t test). Thus, we confirmed that a high SR and PV immunoreactivity were associated during development in the mouse layer 4 barrel cortex.
Figure 3.

PV immunoreactivity was associated with a high SR. A–F, Identification of PV immunoreactivity in the recorded cells. A–C, An example of neurobiotin image, stained by FITC-conjugated avidin (A), which turned out to be PV immunopositive (B), is shown by overlaying A and B (C). D–F, An example of a PV-immunonegative cell. Staining with neurobiotin (D) and PV antibody (E) and an overlay of D and E (F) are shown. G, SRs of PV-positive and -negative cells. PV-positive cells had significantly higher SRs than those of PV-negative cells. Each symbol represents a single cell (PV+, n = 21; PV−, n = 9). *p < 0.05, unpaired t test.
We then asked the question as to whether the fraction of PV-immunoreactive cells increases with age and, if so, whether it goes parallel with physiological development as observed above. To answer this question, we investigated the developmental change in PV immunoreactivity (Fig. 4A, left), which was performed in thinner thalamocortical sections including the barrel cortex as electrophysiological experiments were performed. PV-immunopositive cells were barely seen at P7; they started to appear around P10, but only weakly. At P13, strongly immunopositive cells could be seen mainly in layer 4, and afterward they were seen across all the layers. On the other hand, CB immunoreactivity exhibited a distinct developmental profile; calbindin-positive cells were abundant at neonate (P4), but then the number of immunoreactive cells dramatically reduced until the second postnatal week (Fig. 4A, right). From this point, it stayed almost constant throughout P30, as clearly seen in Figure 4B, where immunopositive cells were counted across the layers in the barrel cortex.
Figure 4.

Strong staining of PV started to appear at P13 in layer 4 somatosensory cortex. A, Three consecutive thalamocortical sections stained with cytochrome oxidase (CO), PV, or CB antibody at various stages of the development. The PV-positive cells first appeared in lower layer 4 at P9–P10. In contrast, heavily labeled CB-immunoreactive nonpyramidal cells are found even at P4 in all cortical layers but then dramatically decreased in number around the second postnatal week. Arabic numerals denote cortical layers. Squares show higher-magnification view. B, Histogram showing the density of PV+ (black bars) and CB+ (gray bars) cells in the BDNF(+/+) mice at different postnatal ages constructed from immunohistological staining of these chemical markers as shown in A.
Electrophysiological discrimination of excitatory and inhibitory cells in BDNF(−/−) mice
BDNF has been reported to have a crucial effect on the development of inhibitory neurons (Jones et al., 1994; Cellerino et al., 1996; Altar et al., 1997; Marty et al., 1997; Huang et al., 1999; Berghuis et al., 2004; Patz et al., 2004). Here, we attempted to investigate whether developmental aspects of electrophysiological properties, as we had seen so far, were also affected by BDNF. For this purpose, we first tested whether the criteria we used to discriminate between excitatory and inhibitory cells in BDNF(+/+) animals would still be appropriate in BDNF(−/−) mice. Thus, we basically repeated the same analysis as we showed in Figure 1, where we examined electrophysiological properties on morphologically identified excitatory and inhibitory cells in BDNF(−/−) mice. Figure 5A plots the number of action potentials in response to depolarizing current injection, as in Figure 1B, in BDNF(−/−) mice. As can be seen in this graph, we confirmed that morphologically identified excitatory cells again exhibited a sudden decrease in the number of action potentials while increasing depolarizing current injections in both age groups. Arrows in the abscissa indicate the threshold current for action potentials, which confirmed that inhibitory cells had higher thresholds in the older age group (P14–P16), as was the case in BDNF(+/+) mice (Fig. 1B). The SR in BDNF(−/−) mice also showed the similar tendency during development (Fig. 5B). There was a tendency that the ratio decreased or negatively correlated with age in excitatory cells (slope, −0.051; r = 0.69; p = 0.12), whereas it was rather unchanged in inhibitory cells (slope, −0.0046; r = 0.35; p = 0.63). We did not see a slight increase with age in the SR as seen in the inhibitory cells from BDNF(+/+) mice (Fig. 1C); this point is to be analyzed further in more detail later. AHP was also analyzed in BDNF(−/−) mice and confirmed that AHP was substantially larger in inhibitory cells as in BDNF(+/+) mice. As shown in Figure 5C, of the total of 22 morphologically identified inhibitory cells, only 3 cells exhibited an AHP with an amplitude of <10 mV, whereas none of the excitatory cells had an AHP >10 mV in amplitude. These experiments allowed us to conclude that the criteria used for discriminating excitatory and inhibitory cells in BDNF(+/+) mice could still be appropriate in BDNF(−/−) mice.
Figure 5.

Distinct electrophysiological properties between excitatory and inhibitory cells in BDNF(−/−) mice. A, The number of action potentials (AP) is plotted against currents injected, showing distinct profiles between excitatory (black) and inhibitory (red) cells. Excitatory cells exhibited strong adaptation and lower spike threshold. B, Spike frequency adaptation ratios (SR) of morphologically identified inhibitory (red triangle) and excitatory (black square) cells in response to depolarizing current (500 ms, 500 pA) plotted against age. The inset shows how we calculated the SR. C, D, Amplitudes of the AHP were plotted against age (C) and SR (D). The inset shows how we measured the amplitude of AHP. Conventions are as in B. PND, Postnatal day.
Delayed maturation of electrophysiological properties in BDNF(−/−) mice
Because in the BDNF(−/−) mice we failed to observe a slight increase in the SR (Fig. 5B) that was seen in BDNF(+/+) mice (Fig. 1C), we suspected that BDNF might have some effect on the development of the SR. As shown in Figure 6A, the overall shape of the distribution histogram of the SR obtained from BDNF(−/−) mice looked similar to that of the BDNF(+/+) animals. However, the cumulative histogram (Fig. 6A, right) indicated that a smaller fraction of cells showing higher values of the SR were in the BDNF(−/−) mice. A Kolmogorov–Smirnov test confirmed that the two distributions were significantly different (p < 0.05). Because cells with higher SR values started to appear around the second postnatal week (Fig. 2C), the difference may become apparent only after the second postnatal week. To test this, we compared cumulative curves of both BDNF(+/+) and BDNF(−/−) mice at three different developmental stages (P7–P10, P11–P14, and P15–P17). In BDNF(+/+) mice (Fig. 6B, left), we found that only the P15–P17 group was statistically different (Kolmogorov–Smirnov test, p < 0.05) from the remaining two groups, whereas in BDNF(−/−), the P15–P17 curve was not significantly different (Kolmogorov–Smirnov test, p > 0.05). An age-matched comparison between BDNF(+/+) and BDNF(−/−) also confirmed that the difference was only seen at P15–P17 (Fig. 6C). This result demonstrated that cells with higher SR values appeared after around the second postnatal week in BDNF(+/+)but not in BDNF(−/−) mice. Because BDNF(−/−) mice barely survive past the second postnatal week, we were unable to determine whether those cells were doomed not to appear or were only developmentally delayed.
Figure 6.

Immature electrophysiological characteristics in BDNF knock-outs in layer 4 inhibitory cells. A, Distribution histograms of SRs in inhibitory cells from P9–P17 BDNF(+/+) (left) and BDNF(−/−) (middle) mice. In the right panel, cumulative plots from BDNF(+/+) (thin line) and BDNF(−/−) (thick line) mice are superimposed. The Kolmogorov–Smirnov test indicated that the difference was significant (p < 0.05). B, Cumulative plots from BDNF(+/+) (left) and BDNF(−/−) (right) mice (Wright et al., 1997). In each graph, data were split into three age groups to show that the P15–P17 curve is shifted to the left in BDNF(+/+) animals, whereas such an age-dependent shift is not seen in BDNF(−/−) mice. C, For age-match comparison, the cumulative plot in B was further reconstructed at each age group, showing that only the P15–P17 curve is shifted to the left in BDNF(+/+) mice (left) and the rest of the two curves at P7–P10 and P11–P14 exhibited no difference. D, I–V relationship for voltage sags in BDNF(+/+) and BDNF(−/−) mice at P14–P16. E, Differential age-dependent changes between BDNF(+/+) and BDNF(−/−) mice in the amplitude of voltage sags in response to hyperpolarizing current (300 pA). Error bars indicate SEM. PND, Postnatal day. *p < 0.05, unpaired t test.
Subsequently, we examined whether BDNF had any effect on the development of the hyperpolarization-activated voltage sag. The amplitude of the voltage sag in cortical inhibitory neurons was larger in young animals (Fig. 2D), and analysis of the I–V relationship identified a slope of 20 mV/300 pA before P13, which dramatically decreased to 3 mV/300 pA after P14 (Fig. 2C). In BDNF(−/−) mice, voltage sag was still large at P14–P16 (slope, 15 mV/300 pA), which is almost comparable to that of BDNF(+/+) animals before P13 (Fig. 6D, see Fig. 2D). An age-matched comparison of the voltage sag in response to constant 400 pA hyperpolarizing current between BDNF(+/+) and BDNF(−/−) mice older than P7–P18 revealed that statistical significance was only seen at P15–P18, but not in age group P7–P10 or P11–P14 (Fig. 6E).
Delayed maturation of PV immunoreactivity in BDNF(−/−) mice
PV immunoreactivity was closely associated with a high SR (Fig. 3). Thus, we next examined whether BDNF may affect PV immunoreactivity itself (Huang et al., 1999). Figure 7A shows the result of immunohistological staining of PV in BDNF(−/−) mice at four representative ages. We found that PV-positive cells did not appear before P9, and only slightly detectable staining was first observed at P10. The indication that the loss of staining before P10 was not caused by an artificial failure of staining processes, but rather to a lack of immunoreactivity of barrel cells, was obtained by strong staining of thalamic reticular (RTN) cells in the same section (Fig. 7M). We found that staining in RTN cells was rather constant throughout the development. Thus, we counted RTN cells in the same section, too, as an internal control for staining quality when we counted immunopositive cells in the barrel cortex across the layers. At P16 and P19, cortical layers 1–3 seemed thinner than to be expected from younger slices. In fact, BDNF has been shown to predominantly affect the development of excitatory cells, including pyramidal cells, thus altering the entire neocortical microcircuit (McAllister et al., 1995, 1999). This is consistent with previous findings (Gorski et al., 2003) using forebrain-specific BDNF knock-out mice in which they found that cortical layer 2/3 became thinner from ∼3 weeks of age. They determined, however, that this was not attributable to the loss of any type of cortical cells but caused by a retraction of dendritic processes. Figure 7Q illustrates the quantified results of PV immunohistochemistry in the barrel cortex and RTN cells during development, where the number of positive cells in a fixed area in BDNF(−/−) mice was divided by the number of positive cells in the same fixed area in BDNF(+/+) mice in both layer 4 barrels and RTN cells. Thus, the value <1 represents a smaller number of PV-positive cells in each area in BDNF(−/−) mice. The graph clearly demonstrated that the number of PV-positive cells was smaller from P10 to P15 in BDNF(−/−) mice; or in other words, the appearance of PV-positive cells was delayed by several days, which seemed specific to the barrel area because no such delay was seen in RTN cells. A detailed comparison between BDNF(+/+) and BDNF(−/−) mice is also available in supplemental Figure 1 (available at www.jneurosci.org as supplemental material).
Figure 7.
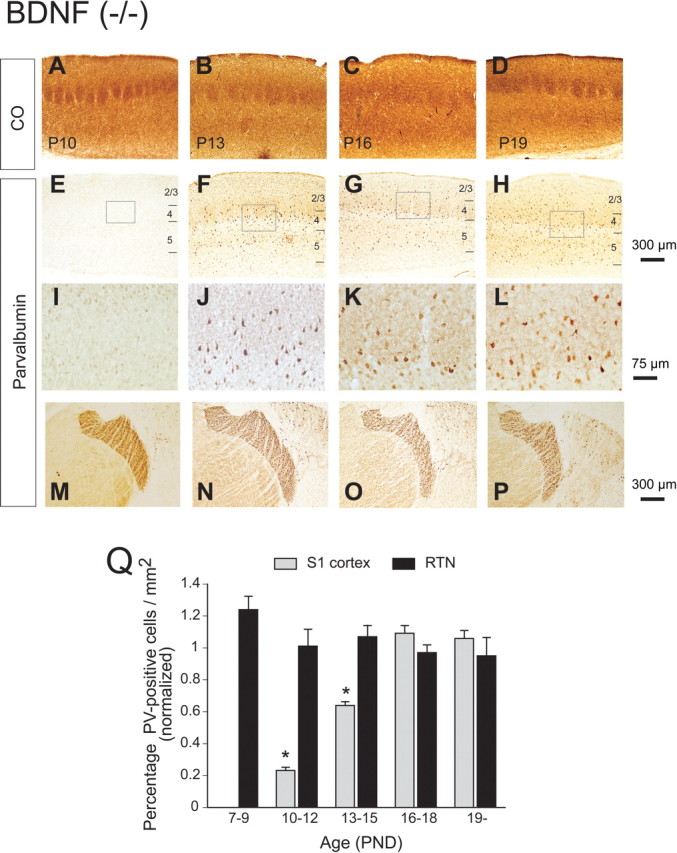
Delayed PV expression in BDNF knock-out mice. A–P, Consecutive thalamocortical sections from P10, P13, P16, and P19 mice. Sections were stained either with cytochrome oxidase (CO; A–D) or antibody against PV (E–P). E–H are the same magnification as A–D. Squares in E–H are shown in higher magnification in I–L. M–P, PV staining at RTN cells in the same section as above, where PV staining was relatively consistent; thus, this area serves as an internal control for the staining in the barrel cortex. Scale bars: A–H, M–P, 300 μm; I–L, 75 μm. Q, Quantitative analysis of PV-positive cells in barrel cortex and RTN cells during development. The value was normalized with the number of positive cells in BDNF(+/+) mice by calculating the cell count in BDNF(−/−) mice divided by that in BDNF(+/+) mice. Error bars indicate SEM. *p < 0.05, unpaired t test.
We have seen that the SR of BDNF(−/−) mice remained immature at P15–P17 (Fig. 6C, right; see also Fig. 5B). At this age, on the other hand, PV immunoreactivity reached levels seen in mature animals (supplemental Fig. 1, available at www.jneurosci.org as supplemental material). Such a small but clear disparity could imply that the development of SR and PV immunoreactivity proceeds independently. It would also predict that at least some of the PV-positive cells at this age might have an SR value <0.8. This prediction actually turned out to be the case, as demonstrated in Figure 8A–G, in which all of the PV-positive cells (n = 6) we examined so far had an SR <0.8, as summarized in Figure 8G. This result makes a clear difference from that of the BDNF(+/+) animals shown in Figure 3. Similarly, an increase in the SR and the disappearance of voltage sag seemed to develop independently, because in BDNF(−/−) mice, some cells with a high SR (>0.8) exhibited a large voltage sag (>5 mV) (Fig. 8H). Figure 8I illustrates the quantitative comparison of voltage sags in cells showing a high SR (>0.8) between BDNF(+/+) (n = 21) and BDNF(−/−) (n = 5) mice, and the difference was significant [2.7 ± 0.4 and 6.8 ± 1.8 for BDNF(+/+) and BDNF(−/−), respectively; p < 0.01, unpaired t test]. These results suggest that BDNF was involved in the development of PV immunoreactivity, the maturation of the SR, and the extinction of voltage sags in response to hyperpolarization but that these properties were controlled independently. We also examined whether other electrophysiological properties such as maximum spike frequency and spike threshold might be significantly different between BDNF(+/+) and BDNF(−/−) mice showing a high SR, but we did not find any significant differences in these properties (Fig. 8J,K).
Figure 8.

PV-positive cells in BDNF knock-out mice failed to show maturated electrophysiological property. A–F, Examples of neurobiotin-filled inhibitory cells from BDNF(−/−) mice showing PV-immunopositive (A–C) or PV-immunonegative (D–F) staining. Neurobiotin images (A, D), counterstaining with a PV antibody (B, E), and an overlay of both (C, F) are shown. G, Comparison of SRs between PV-positive and -negative cells in BDNF(−/−) mice after P14 (PV+, n = 6; PV−, n = 7). Each symbol represents individual cells. H, I, In BDNF(−/−) mice, some cells exhibited a high SR and large voltage sag at the same time, indicating these two properties develop independently. H, Examples of voltage responses to current injection in cells from BDNF(+/+) (left) and BDNF(−/−) (right) mice. Both cells had high SRs [0.91 and 0.83 for BDNF(+/+) and BDNF(−/−) mice, respectively], whereas the right cell [from BDNF(−/−) mice] showed prominent voltage sags to hyperpolarization. I, Quantitative comparison of voltage sags in nonadapting cells (SR > 0.8) between BDNF(+/+) (left) and BDNF(−/−) (right) mice. J, K, Similarly, the maximum frequency (J) and spike threshold current (K) were compared in the nonadapting cells between BDNF(+/+) and BDNF(−/−) mice. There were no significant differences in these parameters: the maximum frequency was 147.9 ± 7.0 and 122.2 ± 15.7 Hz/nA (p = 0.13, unpaired t test) for BDNF(+/+) and BDNF(−/−) mice, respectively; the spike threshold current was 0.40 ± 0.02 and 0.30 ± 0.04 nA (p = 0.063, unpaired t test) for BDNF(+/+) and BDNF(−/−) mice, respectively.
Effect of BDNF on the morphological properties of inhibitory neurons
The electrical behavior of a given neuron has been shown to be strongly correlated with the morphology of the neuron (Kawaguchi, 2001). Thus, we next studied the effect of BDNF on the morphological properties of PV-positive cells. For this purpose, electrophysiological recordings were followed by histological staining of neurobiotin that was filled in the cell from the patch electrode. We then compared any morphological differences between BDNF(+/+) and BDNF(−/−) mice. In total, 16 neurons from BDNF(+/+) mice and 13 neurons from BDNF(−/−) mice were successfully reconstructed, 16 of which [8 each from BDNF(+/+) and BDNF(−/−)] are presented in Figure 9A. We counted the number of primary dendrites and dendritic branches and measured total dendritic length and total axonal length throughout the layers in the barrel cortex. Statistical tests indicated that there were significant differences in the number of primary dendrites, total dendritic length, and the number of dendritic branches between the BDNF(+/+) and BDNF(−/−) mice (Student's t test, p < 0.05). In contrast, we failed to find a significant difference in total axonal length between the two strains.
Figure 9.

BDNF is required for the morphological maturation of layer 4 PV-immunoreactive cells in somatosensory barrel cortex. A, Neurobiotin staining of PV-positive inhibitory neurons from BDNF(+/+) and BDNF(−/−) mice. Dendrites are shown in black, and axons in are shown in red. Laminar boundaries are indicated by thin green dotted lines and labeled with arabic numerals. B, Quantitative analysis of the number of primary dendrites (left), total dendritic length (middle), and the number of dendritic branches (right) in BDNF(+/+) and BDNF(−/−) mice. C, Total axonal length was also examined but found no difference between BDNF(+/+) and BDNF(−/−) mice. Error bars indicate SEM.
Discussion
In the present study, we determined three main findings: (1) that electrophysiological and chemical properties of FS cells in the layer 4 barrel cortex reached nearly adult levels around the second postnatal week; (2) that these properties of FS cells were delayed in the absence of BDNF; (3) that BDNF promoted the development of dendritic arborization but not that of axons in the FS cells. Collectively, these findings indicated to us that BDNF has a pivotal role in the normal development of FS cells by acting on immature PV-positive cells. Before discussing the implications of our results, we will discuss the validity of the identification of the cell types concerned because this forms the basis of the current study.
Distinguishing inhibitory from excitatory cells by electrophysiological properties
To distinguish inhibitory interneurons from excitatory cells, we first relied on morphological characteristics. We then found that some electrophysiological features were closely associated with spike pattern as well as certain morphological characteristics. For example, morphologically identified excitatory neurons exhibited strong spike adaptation (McCormick et al., 1985; Chagnac-Amitai and Connors, 1989; Connors and Gutnick, 1990; Schubert et al., 2003), whereas inhibitory neurons were characterized by prominent AHP (Porter et al., 2001; Beierlein et al., 2003). Electrical properties such as spike adaptation and AHP are closely related to certain types of K channels expressed in each cell type (Massengill et al., 1997; Lau et al., 2000). Adaptation is dependent on a rapidly inactivating A-type K channel that is presumably encoded by the Kv4 superfamily (Kv 4.2/4.3) and is found to be abundant in excitatory cells (Martina et al., 1998). In contrast, single-cell reverse transcription-PCR experiments revealed that almost all (89%) inhibitory interneurons contained Kv3 (Kv3.1, Kv3.2) subunit transcripts that are thought to assemble together to make fast delayed rectifier K channels, which were reported to underlie less adapting spiking behavior (Rudy and McBain, 2001; Toledo-Rodriguez et al., 2005). These channels have been shown to be present in layer 4 FS cells in the barrel cortex (Massengill et al., 1997; Chow et al., 1999). In addition, Kv3.1/Kv3.2 is also responsible for prominent AHP (Erisir et al., 1999; Lau et al., 2000). Thus, such cell type-specific distribution of particular K channels that account for two major electrophysiological characteristics such as less adaptation and AHP provides a reasonably strong logical bases on which we could rely for identification of cells either excitatory or inhibitory.
What mechanism underlies the impairment of electrophysiological properties?
We have shown that in BDNF(−/−) mice, the emergence of cells with a high SR (>0.8) was strongly suppressed after the second postnatal week (Fig. 6B,C). Moreover, we did not see extinction of the voltage sag elicited by a hyperpolarizing current (Fig. 6D,E). Voltage sag was dependent on HCN1/2 channels (Santoro et al., 2000) and was also larger in BDNF(−/−) cells at this stage of development. BDNF may regulate the function of these K channels by either trafficking these channels to or from the membrane surface (Heusser and Schwappach, 2005) or by modulating them via phosphorylation or dephosphorylation (Moreno et al., 1995). In fact, recent studies have reported that BDNF is capable of modulating the function of K channels by tyrosine phosphorylation via TrkB receptors (Tucker and Fadool, 2002). Interestingly, further study also reported that such BDNF modulation of K channels is dependent on age and previous sensory experience in the olfactory bulb (Colley et al., 2004). We have previously shown that BDNF-dependent activation of silent synapses may occur through the regulation of glutamate receptor trafficking in the thalamocortical synapses (Itami et al., 2003). Although K channels are actually subject to trafficking, it would be of great interest to assess whether BDNF could modulate the trafficking of K channels.
Effects of BDNF on dendrites versus axon
We saw a significant reduction in the number of primary dendrites, total dendritic length, and the number of dendritic branches in BDNF(−/−) compared with BDNF(+/+) mice, in addition to the previous report that BDNF has a predominant effect on the development of pyramidal neurons (McAllister et al., 1995, 1999; Horch et al., 1999). In contrast, we did not see a significant difference in total axonal length between them. This seems to indicate that BDNF has more profound effects on the development of dendrites than axons, as suggested previously (Kohara et al., 2003). This may be apparently consistent with a previous study (Gorski et al., 2003) in which they found that cortical layer 1–3 became thinner because of shrinkage of dendrites in BDNF(−/−) mice whose BDNF was deleted only in forebrain. However, because we injected dye in slice preparation with limited thickness (350–500 mm), another possible explanation might be that BDNF has more profound effects on proximal rather than distal part of neurites. Then, we might have overlooked severe effects of BDNF on distal axonal ends, at least some of which occurred out of the slices.
BDNF, GABA maturation, and relevance to plasticity in the barrel cortex
In the visual cortex, the strength of synaptic transmission among neurons can be altered or can be very plastic in an activity-dependent manner at a certain period of time during development, or a critical period. Recent experiments have shown that maturation of cortical GABAergic networks triggers the start of the critical period (Fagiolini et al., 2004). Meanwhile, BDNF-overexpression mice have been found to exhibit accelerated maturation of the GABAergic network, in parallel with the critical period, or precocious start and early decline of plasticity (Huang et al., 1999). Of the diverse range of GABAergic neuron types, large basket cells eliciting a1 subunit-mediated synaptic responses, or FS cells, have been shown to be responsible for the expression of plasticity (Hensch, 2005). On the other hand, the rodent barrel cortex also exhibits activity-dependent plasticity within the critical period, where projections from layer 4–2/3, or connections within layer 2/3, were suggested to be important for plasticity to occur. We provide evidence that BDNF plays an essential role in the normal acquisition of electrophysiological and chemical properties in FS GABAergic neurons in layer IV. Under the condition that secretion of BDNF in the barrel cortex is dependent on sensory inputs, our findings could suggest a role for BDNF as a possible link between sensory inputs and the maturation of GABAergic network for plasticity to occur in the barrel cortex. By what mechanism does the maturation of GABAergic cells, especially FS cells, contribute to synaptic plasticity? In the barrel cortex, spike timings of presynaptic cells in layer 4, with regard to the excitatory postsynaptic response elicited in layer 2/3, have been shown to be important in determining the direction and strength of the plasticity (Celikel et al., 2004). FS cells in layer 4 were postulated to exert feedforward inhibition on postsynaptic excitatory relay cells in layer 4 that provide excitatory inputs to layer 2/3 cells. Thus, the maturation of FS cells could theoretically contribute to plasticity by providing improved regulation of spike timing in presynaptic layer 4 cells.
In conclusion, we have described the development of several properties associated with GABAergic neurons in layer 4 barrel cortex. We then provided evidence that BDNF was required for the normal development of FS cells. Because the maturation of GABAergic cells is thought to be essential for activity-dependent plasticity to begin, our findings provide a possible link between BDNF and plasticity in the cerebral cortex.
Footnotes
This work was supported by grants-in-aid for scientific research on priority areas (C.I., F.K.), for young scientists (C.I.), and for science research (S.N.); the Japan Society for the Promotion of Science (S.N.); The Ministry of Education, Culture, Sports, Science, and Technology (S.N.); and health science research grants (nano-1) (S.N.). We thank Drs. Yoshinori Sahara, Makoto Yokosuka, and Kanae Osaki for technical advice on the protocols for staining and members of the Nakamura laboratory for helpful discussions.
References
- Agmon A, Connors BW. Thalamocortical responses of mouse somatosensory (barrel) cortex in vitro. Neuroscience. 1991;41:365–379. doi: 10.1016/0306-4522(91)90333-j. [DOI] [PubMed] [Google Scholar]
- Alcantara S, Ferrer I, Soriano E. Postnatal development of parvalbumin and calbindin D28K immunoreactivities in the cerebral cortex of the rat. Anat Embryol (Berl) 1993;188:63–73. doi: 10.1007/BF00191452. [DOI] [PubMed] [Google Scholar]
- Altar CA, Cai N, Bliven T, Juhasz M, Conner JM, Acheson AL, Lindsay RM, Wiegand SJ. Anterograde transport of brain-derived neurotrophic factor and its role in the brain. Nature. 1997;389:856–860. doi: 10.1038/39885. [DOI] [PubMed] [Google Scholar]
- Beierlein M, Gibson JR, Connors BW. Two dynamically distinct inhibitory networks in layer 4 of the neocortex. J Neurophysiol. 2003;90:2987–3000. doi: 10.1152/jn.00283.2003. [DOI] [PubMed] [Google Scholar]
- Bender KJ, Rangel J, Feldman DE. Development of columnar topography in the excitatory layer 4 to layer 2/3 projection in rat barrel cortex. J Neurosci. 2003;23:8759–8770. doi: 10.1523/JNEUROSCI.23-25-08759.2003. [DOI] [PMC free article] [PubMed] [Google Scholar]
- Berghuis P, Dobszay MB, Sousa KM, Schulte G, Mager PP, Hartig W, Gorcs TJ, Zilberter Y, Ernfors P, Harkany T. Brain-derived neurotrophic factor controls functional differentiation and microcircuit formation of selectively isolated fast-spiking GABAergic interneurons. Eur J Neurosci. 2004;20:1290–1306. doi: 10.1111/j.1460-9568.2004.03561.x. [DOI] [PubMed] [Google Scholar]
- Celikel T, Szostak VA, Feldman DE. Modulation of spike timing by sensory deprivation during induction of cortical map plasticity. Nat Neurosci. 2004;7:534–541. doi: 10.1038/nn1222. [DOI] [PMC free article] [PubMed] [Google Scholar]
- Cellerino A, Maffei L, Domenici L. The distribution of brain-derived neurotrophic factor and its receptor trkB in parvalbumin-containing neurons of the rat visual cortex. Eur J Neurosci. 1996;8:1190–1197. doi: 10.1111/j.1460-9568.1996.tb01287.x. [DOI] [PubMed] [Google Scholar]
- Chagnac-Amitai Y, Connors BW. Synchronized excitation and inhibition driven by intrinsically bursting neurons in neocortex. J Neurophysiol. 1989;62:1149–1162. doi: 10.1152/jn.1989.62.5.1149. [DOI] [PubMed] [Google Scholar]
- Chow A, Erisir A, Farb C, Nadal MS, Ozaita A, Lau D, Welker E, Rudy B. K+ channel expression distinguishes subpopulations of parvalbumin- and somatostatin-containing neocortical interneurons. J Neurosci. 1999;19:9332–9345. doi: 10.1523/JNEUROSCI.19-21-09332.1999. [DOI] [PMC free article] [PubMed] [Google Scholar]
- Colley B, Tucker K, Fadool DA. Comparison of modulation of Kv1.3 channel by two receptor tyrosine kinases in olfactory bulb neurons of rodents. Receptors Channels. 2004;10:25–36. [PMC free article] [PubMed] [Google Scholar]
- Connors BW, Gutnick MJ. Intrinsic firing patterns of diverse neocortical neurons. Trends Neurosci. 1990;13:99–104. doi: 10.1016/0166-2236(90)90185-d. [DOI] [PubMed] [Google Scholar]
- Erisir A, Lau D, Rudy B, Leonard CS. Function of specific K(+) channels in sustained high-frequency firing of fast-spiking neocortical interneurons. J Neurophysiol. 1999;82:2476–2489. doi: 10.1152/jn.1999.82.5.2476. [DOI] [PubMed] [Google Scholar]
- Fagiolini M, Fritschy JM, Low K, Mohler H, Rudolph U, Hensch TK. Specific GABAA circuits for visual cortical plasticity. Science. 2004;303:1681–1683. doi: 10.1126/science.1091032. [DOI] [PubMed] [Google Scholar]
- Feldman DE, Brecht M. Map plasticity in somatosensory cortex. Science. 2005;310:810–815. doi: 10.1126/science.1115807. [DOI] [PubMed] [Google Scholar]
- Gibson JR, Beierlein M, Connors BW. Two networks of electrically coupled inhibitory neurons in neocortex. Nature. 1999;402:75–79. doi: 10.1038/47035. [DOI] [PubMed] [Google Scholar]
- Gorski JA, Zeiler SR, Tamowski S, Jones KR. Brain-derived neurotrophic factor is required for the maintenance of cortical dendrites. J Neurosci. 2003;23:6856–6865. doi: 10.1523/JNEUROSCI.23-17-06856.2003. [DOI] [PMC free article] [PubMed] [Google Scholar]
- Hensch TK. Critical period plasticity in local cortical circuits. Nat Rev Neurosci. 2005;6:877–888. doi: 10.1038/nrn1787. [DOI] [PubMed] [Google Scholar]
- Heusser K, Schwappach B. Trafficking of potassium channels. Curr Opin Neurobiol. 2005;15:364–369. doi: 10.1016/j.conb.2005.04.001. [DOI] [PubMed] [Google Scholar]
- Hof PR, Glezer II, Conde F, Flagg RA, Rubin MB, Nimchinsky EA, Vogt Weisenhorn DM. Cellular distribution of the calcium-binding proteins parvalbumin, calbindin, and calretinin in the neocortex of mammals: phylogenetic and developmental patterns. J Chem Neuroanat. 1999;16:77–116. doi: 10.1016/s0891-0618(98)00065-9. [DOI] [PubMed] [Google Scholar]
- Horch HW, Kruttgen A, Portbury SD, Katz LC. Destabilization of cortical dendrites and spines by BDNF. Neuron. 1999;23:353–364. doi: 10.1016/s0896-6273(00)80785-0. [DOI] [PubMed] [Google Scholar]
- Huang ZJ, Kirkwood A, Pizzorusso T, Porciatti V, Morales B, Bear MF, Maffei L, Tonegawa S. BDNF regulates the maturation of inhibition and the critical period of plasticity in mouse visual cortex. Cell. 1999;98:739–755. doi: 10.1016/s0092-8674(00)81509-3. [DOI] [PubMed] [Google Scholar]
- Itami C, Samejima K, Nakamura S. Improved data processing for optical imaging of developing neuronal connectivity in the neonatal mouse barrel cortex. Brain Res Brain Res Protoc. 2001;7:103–114. doi: 10.1016/s1385-299x(01)00048-4. [DOI] [PubMed] [Google Scholar]
- Itami C, Kimura F, Kohno T, Matsuoka M, Ichikawa M, Tsumoto T, Nakamura S. Brain-derived neurotrophic factor-dependent unmasking of “silent” synapses in the developing mouse barrel cortex. Proc Natl Acad Sci USA. 2003;100:13069–13074. doi: 10.1073/pnas.2131948100. [DOI] [PMC free article] [PubMed] [Google Scholar]
- Jones KR, Farinas I, Backus C, Reichardt LF. Targeted disruption of the BDNF gene perturbs brain and sensory neuron development but not motor neuron development. Cell. 1994;76:989–999. doi: 10.1016/0092-8674(94)90377-8. [DOI] [PMC free article] [PubMed] [Google Scholar]
- Kawaguchi Y. Physiological subgroups of nonpyramidal cells with specific morphological characteristics in layer II/III of rat frontal cortex. J Neurosci. 1995;15:2638–2655. doi: 10.1523/JNEUROSCI.15-04-02638.1995. [DOI] [PMC free article] [PubMed] [Google Scholar]
- Kawaguchi Y. Distinct firing patterns of neuronal subtypes in cortical synchronized activities. J Neurosci. 2001;21:7261–7272. doi: 10.1523/JNEUROSCI.21-18-07261.2001. [DOI] [PMC free article] [PubMed] [Google Scholar]
- Kawaguchi Y, Kubota Y. GABAergic cell subtypes and their synaptic connections in rat frontal cortex. Cereb Cortex. 1997;7:476–486. doi: 10.1093/cercor/7.6.476. [DOI] [PubMed] [Google Scholar]
- Kohara K, Kitamura A, Adachi N, Nishida M, Itami C, Nakamura S, Tsumoto T. Inhibitory but not excitatory cortical neurons require presynaptic brain-derived neurotrophic factor for dendritic development, as revealed by chimera cell culture. J Neurosci. 2003;23:6123–6131. doi: 10.1523/JNEUROSCI.23-14-06123.2003. [DOI] [PMC free article] [PubMed] [Google Scholar]
- Kovalchuk Y, Holthoff K, Konnerth A. Neurotrophin action on a rapid timescale. Curr Opin Neurobiol. 2004;14:558–563. doi: 10.1016/j.conb.2004.08.014. [DOI] [PubMed] [Google Scholar]
- Lau D, Vega-Saenz de Miera EC, Contreras D, Ozaita A, Harvey M, Chow A, Noebels JL, Paylor R, Morgan JI, Leonard CS, Rudy B. Impaired fast-spiking, suppressed cortical inhibition, and increased susceptibility to seizures in mice lacking Kv3.2 K+ channel proteins. J Neurosci. 2000;20:9071–9085. doi: 10.1523/JNEUROSCI.20-24-09071.2000. [DOI] [PMC free article] [PubMed] [Google Scholar]
- Lewin GR, Barde YA. Physiology of the neurotrophins. Annu Rev Neurosci. 1996;19:289–317. doi: 10.1146/annurev.ne.19.030196.001445. [DOI] [PubMed] [Google Scholar]
- Markram H, Toledo-Rodriguez M, Wang Y, Gupta A, Silberberg G, Wu C. Interneurons of the neocortical inhibitory system. Nat Rev Neurosci. 2004;5:793–807. doi: 10.1038/nrn1519. [DOI] [PubMed] [Google Scholar]
- Martina M, Schultz JH, Ehmke H, Monyer H, Jonas P. Functional and molecular differences between voltage-gated K+ channels of fast-spiking interneurons and pyramidal neurons of rat hippocampus. J Neurosci. 1998;18:8111–8125. doi: 10.1523/JNEUROSCI.18-20-08111.1998. [DOI] [PMC free article] [PubMed] [Google Scholar]
- Marty S, Berzaghi Mda P, Berninger B. Neurotrophins and activity-dependent plasticity of cortical interneurons. Trends Neurosci. 1997;20:198–202. doi: 10.1016/s0166-2236(96)01026-0. [DOI] [PubMed] [Google Scholar]
- Massengill JL, Smith MA, Son DI, O'Dowd DK. Differential expression of K4-AP currents and Kv3.1 potassium channel transcripts in cortical neurons that develop distinct firing phenotypes. J Neurosci. 1997;17:3136–3147. doi: 10.1523/JNEUROSCI.17-09-03136.1997. [DOI] [PMC free article] [PubMed] [Google Scholar]
- McAllister AK, Lo DC, Katz LC. Neurotrophins regulate dendritic growth in developing visual cortex. Neuron. 1995;15:791–803. doi: 10.1016/0896-6273(95)90171-x. [DOI] [PubMed] [Google Scholar]
- McAllister AK, Katz LC, Lo DC. Neurotrophins and synaptic plasticity. Annu Rev Neurosci. 1999;22:295–318. doi: 10.1146/annurev.neuro.22.1.295. [DOI] [PubMed] [Google Scholar]
- McCormick DA, Connors BW, Lighthall JW, Prince DA. Comparative electrophysiology of pyramidal and sparsely spiny stellate neurons of the neocortex. J Neurophysiol. 1985;54:782–806. doi: 10.1152/jn.1985.54.4.782. [DOI] [PubMed] [Google Scholar]
- Moreno H, Kentros C, Bueno E, Weiser M, Hernandez A, Vega-Saenz de Miera E, Ponce A, Thornhill W, Rudy B. Thalamocortical projections have a K+ channel that is phosphorylated and modulated by cAMP-dependent protein kinase. J Neurosci. 1995;15:5486–5501. doi: 10.1523/JNEUROSCI.15-08-05486.1995. [DOI] [PMC free article] [PubMed] [Google Scholar]
- Nagappan G, Lu B. Activity-dependent modulation of the BDNF receptor TrkB: mechanisms and implications. Trends Neurosci. 2005;28:464–471. doi: 10.1016/j.tins.2005.07.003. [DOI] [PubMed] [Google Scholar]
- Patz S, Grabert J, Gorba T, Wirth MJ, Wahle P. Parvalbumin expression in visual cortical interneurons depends on neuronal activity and TrkB ligands during an early period of postnatal development. Cereb Cortex. 2004;14:342–351. doi: 10.1093/cercor/bhg132. [DOI] [PubMed] [Google Scholar]
- Porter JT, Johnson CK, Agmon A. Diverse types of interneurons generate thalamus-evoked feedforward inhibition in the mouse barrel cortex. J Neurosci. 2001;21:2699–2710. doi: 10.1523/JNEUROSCI.21-08-02699.2001. [DOI] [PMC free article] [PubMed] [Google Scholar]
- Rudy B, McBain CJ. Kv3 channels: voltage-gated K+ channels designed for high-frequency repetitive firing. Trends Neurosci. 2001;24:517–526. doi: 10.1016/s0166-2236(00)01892-0. [DOI] [PubMed] [Google Scholar]
- Rudy B, Chow A, Lau D, Amarillo Y, Ozaita A, Saganich M, Moreno H, Nadal MS, Hernandez-Pineda R, Hernandez-Cruz A, Erisir A, Leonard C, Vega-Saenz de Miera E. Contributions of Kv3 channels to neuronal excitability. Ann NY Acad Sci. 1999;868:304–343. doi: 10.1111/j.1749-6632.1999.tb11295.x. [DOI] [PubMed] [Google Scholar]
- Saint Marie RL, Peters A. The morphology and synaptic connections of spiny stellate neurons in monkey visual cortex (area 17): a Golgi-electron microscopic study. J Comp Neurol. 1985;233:213–235. doi: 10.1002/cne.902330205. [DOI] [PubMed] [Google Scholar]
- Santoro B, Chen S, Luthi A, Pavlidis P, Shumyatsky GP, Tibbs GR, Siegelbaum SA. Molecular and functional heterogeneity of hyperpolarization-activated pacemaker channels in the mouse CNS. J Neurosci. 2000;20:5264–5275. doi: 10.1523/JNEUROSCI.20-14-05264.2000. [DOI] [PMC free article] [PubMed] [Google Scholar]
- Schubert D, Kotter R, Zilles K, Luhmann HJ, Staiger JF. Cell type-specific circuits of cortical layer IV spiny neurons. J Neurosci. 2003;23:2961–2970. doi: 10.1523/JNEUROSCI.23-07-02961.2003. [DOI] [PMC free article] [PubMed] [Google Scholar]
- Stern EA, Maravall M, Svoboda K. Rapid development and plasticity of layer 2/3 maps in rat barrel cortex in vivo. Neuron. 2001;31:305–315. doi: 10.1016/s0896-6273(01)00360-9. [DOI] [PubMed] [Google Scholar]
- Thoenen H. Neurotrophins and neuronal plasticity. Science. 1995;270:593–598. doi: 10.1126/science.270.5236.593. [DOI] [PubMed] [Google Scholar]
- Toledo-Rodriguez M, El Manira A, Wallen P, Svirskis G, Hounsgaard J. Cellular signalling properties in microcircuits. Trends Neurosci. 2005;28:534–540. doi: 10.1016/j.tins.2005.08.001. [DOI] [PubMed] [Google Scholar]
- Tucker K, Fadool DA. Neurotrophin modulation of voltage-gated potassium channels in rat through TrkB receptors is time and sensory experience dependent. J Physiol (Lond) 2002;542:413–429. doi: 10.1113/jphysiol.2002.017376. [DOI] [PMC free article] [PubMed] [Google Scholar]
- Woolsey TA, Dierker ML, Wann DF. Mouse SmI cortex: qualitative and quantitative classification of golgi-impregnated barrel neurons. Proc Natl Acad Sci USA. 1975;72:2165–2169. doi: 10.1073/pnas.72.6.2165. [DOI] [PMC free article] [PubMed] [Google Scholar]
- Wright BA, Lombardino LJ, King WM, Puranik CS, Leonard CM, Merzenich MM. Deficits in auditory temporal and spectral resolution in language-impaired children. Nature. 1997;387:176–178. doi: 10.1038/387176a0. [DOI] [PubMed] [Google Scholar]