

Abstract
We used a combined proteomic and functional biochemical approach to determine the overall impact of 17β-estradiol (E2) on mitochondrial protein expression and function. To elucidate mitochondrial pathways activated by E2 in brain, two-dimensional (2D) gel electrophoresis was conducted to screen the mitoproteome. Ovariectomized adult female rats were treated with a single injection of E2. After 24 h of E2 exposure, mitochondria were purified from brain and 2D analysis and liquid chromatography-tandem mass spectrometry protein identification were conducted. Results of proteomic analyses indicated that of the 499 protein spots detected by image analysis, a total of 66 protein spots had a twofold or greater change in expression. Of these, 28 proteins were increased in expression after E2 treatment whereas 38 proteins were decreased in expression relative to control. E2 regulated key metabolic enzymes including pyruvate dehydrogenase, aconitase, and ATP-synthase. To confirm that E2-inducible changes in protein expression translated into functional consequences, we determined the impact of E2 on the enzymatic activity of the mitochondrial electron transport chain. In vivo, E2 treatment enhanced brain mitochondrial efficiency as evidenced by increased respiratory control ratio, elevated cytochrome-c oxidase activity and expression while simultaneously reducing free radical generation in brain. Results of these analyses provide insights into E2 mechanisms of regulating brain mitochondria, which have the potential for sustaining neurological health and prevention of neurodegenerative diseases associated with mitochondrial dysfunction such as Alzheimer's disease.
Keywords: proteomics, Alzheimer's disease, mitochondria, biomarker, estrogen receptor, therapeutic development
Introduction
Basic science analyses indicate that estrogens induce protection of neurons against neurodegenerative insults both in vitro and in vivo (Brinton, 2005). Moreover, estrogen in the same model systems activated biochemical, genomic, cellular, and behavioral mechanisms of memory (Singh et al., 1994; Simpkins et al., 1997; Woolley, 1999; Toran-Allerand, 2000; Brinton, 2001; McEwen, 2002; Brinton, 2004). Estrogen's neuroprotective effects are multifaceted, encompassing chemical, biochemical, and genomic mechanisms and falling into three mechanistic categories: antioxidant, defense, and viability (Nilsen and Brinton, 2004; Morrison et al., 2006). Our findings demonstrate that a protein/protein interaction between estrogen receptor and the regulatory subunit p85 activates the phosphoinositide kinase-3 (PI3K) signaling cascade, simultaneously activating both the Akt and extracellular signal-regulated kinase (ERK) pathways which ultimately converge on mitochondria (Mannella and Brinton, 2006). Activation of this complex signaling cascade results in a proactive defense state conferring significant protection against Ca2+ dysregulation induced by neurodegenerative insults, leading to greater survival of E2 responsive neurons (Nilsen and Brinton, 2003; Brewer et al., 2006; Chen et al., 2006). E2 regulation of mitochondrial function is a pivotal convergence point on which estrogen neuroprotection depends.
Results of basic science, clinical, and epidemiological analyses demonstrate that E2 protects against age-related risk factors for developing Alzheimer's disease (AD) (Brinton, 2005). More recently, E2 has been found to regulate metabolic functions sustaining the energetic demands of neuronal activation (Bishop and Simpkins, 1995; Yang et al., 2004; Nilsen et al., 2006; Singh et al., 2006; Simpkins and Dykens, 2007). Mitochondria are the primary energy source for cells, converting nutrients into energy through cellular respiration via the electron transport chain (Murphy et al., 1996; Cadenas and Davies, 2000; Nicholls and Budd, 2000). In parallel, mitochondria are also the key regulators of the intrinsic apoptotic cascade (Lin and Beal, 2006). Many components of the mitochondrial bioenergetic network are vulnerable to oxidative stress, which can impair mitochondrial and cellular function as well as increasing apoptotic vulnerability (Nicholls and Budd, 2000; Lin and Beal, 2006).
Based on these findings and because mitochondria appear to be a convergence point for mechanisms underlying estrogen-induced neuroprotection (Nilsen and Brinton, 2003; Nilsen and Brinton, 2004; Nilsen et al., 2006), we sought to determine mechanisms whereby E2 promotes mitochondrial function. To address this issue, we conducted a proteomic analysis of brain-derived mitochondria from female rats treated with E2. Mitochondria, by some estimates, contain up to 1500 proteins (Lopez et al., 2000), a number that is amenable to examination by two-dimensional gel electrophoresis (2DE) coupled with liquid chromatography-tandem mass spectrometry (LC-MS/MS) protein identification. In this study, 2D gel electrophoresis was used to investigate the influence of E2 on the mitoproteome profile in brain tissue.
The results of the current investigation reveal that E2 significantly regulates the mitoproteome to promote enhanced function of metabolic pathways: pyruvate oxidation, the tricarboxylic acid (TCA) cycle, and mitochondrial respiration. To our knowledge, this is the first documentation of proteomic profiling of brain mitochondria after E2 treatment in vivo.
Materials and Methods
Chemicals.
Chemicals were from Sigma (St. Louis, MO) unless otherwise noted. 17β-estradiol (Steraloids, Newport, RI) was suspended in sesame oil vehicle. Deep Purple gel stain was from GE Healthcare Bio-Sciences (Piscataway, NJ). All other 2DE reagents were from Bio-Rad (Hercules, CA).
Animals.
Use of animals was approved by the Institutional Animal Care and Use Committee of University of Southern California (protocol number 10256). Four to 6 month ovariectomized female Sprague Dawley rats were purchased from Harlan (Indianapolis, IN) and housed under controlled conditions of temperature (22°C), humidity, and light (14/10 h light/dark cycle); water and food were available ad libitum until treatment. Pathogen-free rats were used 2 weeks after ovariectomy to allow for equilibration to hormone deprivation. Ovariectomized rats were treated subcutaneously with E2 (30 μg/kg) or sesame-oil vehicle control, and fasted 24 h before killing and dissection. The cerebellum, pineal gland, and brainstem were removed and forebrain was used for mitochondrial isolations. At time of killing, uteri were removed and weighed to confirm biological efficacy of E2-treatment. Previous studies demonstrated that E2 plasma and brain levels after a 30 μg/kg dose produced levels in ovariectomized rats of 42 pg/g brain tissue (wet weight) E2 in brain tissue and 44 pg/ml E2 in serum (Wang et al., 2006).
Mitochondrial isolation.
Nonsynaptosomal mitochondria were isolated in ice-cold mitochondria isolation buffer [MIB; pH 7.4, containing 320 mm sucrose, 1 mm EDTA, 10 mm Tris-HCl, Protease Inhibitor Cocktail Set I (Calbiochem, La Jolla, CA; containing 500 μm AEBSF-HCl, 150 nm aprotonin, 1 μm E-64, 500 μm EDTA disodium, and 1 μm leupeptin hemisulfate), and Phosphatase Inhibitor Cocktail Set I (containing (−)-p-bromotetramisoleoxalate 2.5 mm, cantharidin 500 μm, and microcystin LR 500 nm)] by discontinuous density gradient centrifugation consisting of 15, 23, and 40% percoll colloidal silica particles of 15–30 nm coated with polyvinylpyrrolidone (Sigma) as described previously (Schroeter et al., 2003). Briefly, one rat forebrain was homogenized into 5 ml MIB using a Dounce homogenizer. The homogenized brain was centrifuged at 1500 × g for 5 min. BSA was not added to the MIB to avoid spot interference with 2D gel and protein identification. The supernatant was collected and the pellet resuspended, rehomogenized in 2.5 ml MIB, and centrifuged at 1500 × g for 5 min. The supernatants were collected and combined and the pellet discarded. The resulting cytosolic homogenate was centrifuged at 21,000 × g for 10 min to yield the crude mitochondrial pellet. The crude pellet was resuspended in 15% Percoll and centrifuged at 21,000 × g for 10 min to remove excess myelin. The remaining crude mitochondria, in 15% Percoll, were layered onto a preformed 23/40% discontinuous Percoll gradient and centrifuged at 31,000 × g for 10 min. The purified mitochondria were extracted from the gradient and washed with 10 ml MIB at 16,700 × g for 13 min. The remaining loose pellet was collected and washed once more with 1 ml MIB in an Eppendorf tube at 10,000 × g for 8 min. The purified mitochondrial pellet was then stored at −80° until use.
Mitochondrial purity assessment.
During the mitochondrial purification process, aliquots were collected of crude homogenate, crude mitochondria, and highly purified mitochondria after density gradient centrifugation. Protein concentration was determined by bicinchoninic acid (BCA) protein assay (Pierce, Rockford, IL). Western blot analysis for several subcellular markers was performed to verify mitochondrial integrity and purity. Proteins were separated by 10% SDS-PAGE, electrotransferred to polyvinylidene difluoride membrane (Millipore, Billerica, MA), and probed with primary antibody followed by horseradish peroxidase-conjugated with either horse anti-mouse (1:20,000; Vector Laboratories, Burlingame, CA) or goat anti-rabbit IgG (1:20,000; Vector Laboratories) depending on the primary antibody. Bands were visualized by 3,3′,5,5′-tetramethylbenzidine peroxidase substrate kit (Vector Laboratories). Twenty micrograms of protein were loaded into each lane. Equal loading was confirmed by Coomassie Blue staining (data not shown). Antibodies raised against subcellular markers were used to detect mitochondrial anti-Vdac1/porin (1:500; MitoSciences, Eugene, OR), nuclear anti-histone H1 (1:250; AE-4; Santa Cruz Biotechnology, Santa Cruz, CA), endoplasmic reticulum anti-calnexin (1:2000; SPA 865; Assay Designs, Ann Arbor, MI), and myelin basic protein (1:500; clone 2; RDI, Concord, MA). Each membrane was stripped with stripping buffer containing β-mercaptoethanol and reprobed with each antibody sequentially.
Two-dimensional gel electrophoresis.
Four-hundred micrograms of protein from purified mitochondria were solubilized for 30 min with Bio-Rad ReadyPrep 2D rehydration/sample buffer (7 m urea, 2 m thiourea, 1% ASB-14, 40 mm Tris) and 2% Bio-Rad IPG buffer, pH 3–10. Bio-Rad 17 cm ReadyStrip pH 3–10NL IPG strips were used to separate proteins according to charge. Solubilized mitochondrial proteins were adsorbed into the gel strip overnight and were then focused according to their isoelectric point with the Bio-Rad Protean IEF System. The program used was the following: 250 V rapid voltage ramping for 30 min, 10,000 V slow voltage ramping for 60 min, and 10,000 V rapid voltage ramping for 50 kV hours. The strips were incubated first in Equilibration buffer I with 6 m urea, 20% glycerol, 2% SDS, 2% DTT, and 0.375 M Tris, pH 8.8, for 10 min at room temperature, then in Equilibration buffer II with 6 m urea, 20% glycerol, 2% SDS, 2% iodoacetamide, and 0.375 m Tris, pH 8.8. The strips were then loaded onto 12% SDS-PAGE gels and run at 50 V overnight to complete the second dimension of protein separation. ReadyPrep Overlay Agarose was added on top of the strip to secure it and included Bromophenol blue tracking dye. A molecular standard was used to estimate relative mass (Mr). Gels were fixed with 7.5% acetic acid, 10% methanol solution, washed with 200 mm sodium carbonate, then stained overnight with Deep Purple 1:200 diluted from stock as stated in manufacturers protocol. Gels were destained in 7.5% acetic acid, rinsed with water, and fluorescence scanned with the Typhoon 8600 system (Molecular Dynamics, Sunnyvale, CA). Gel image analyses were performed with PD Quest software (Bio-Rad).
Protein identification by mass spectrometry.
Protein spots were excised and tryptic digests were analyzed in the University of Southern California Proteomics Core Facility by LC-MS/MS as described previously (Gallaher et al., 2006). Briefly, protein spots from 2D gel were visualized with UV light, excised from the gels, and destained with 50% acetonitrile in 50 mm ammonium carbonate. In-gel tryptic digest was performed using reductively methylated trypsin (Promega, Madison, WI). Before digestion, samples were reduced with DTT (10 mm in 50 mm ammonium carbonate for 60 min at 56°C) and subsequently alkylated with iodoacetamide (55 mm in 50 mm ammonium carbonate for 45 min in the dark at room temperature). The digestion reaction was performed overnight at 37°C. Digestion products were extracted from the gel with a 5% formic acid/50% acetonitrile solution (2×) and one acetonitrile extraction followed by evaporation using an APD SpeedVac (ThermoSavant). The dried tryptic digest samples were cleaned with ZipTip (CB18B; Millipore) before analysis by tandem mass spectrometry for protein identification.
The digested sample was resuspended in 10 μl of 60% acetic acid, injected via autosample (Surveyor; ThermoFinnigan, San Jose, CA) and subjected to reverse phase liquid chromatography using ThermoFinnigan Surveyor MS-Pump in conjunction with a BioBasic-18 100 × 0.18 mm reverse-phase capillary column (ThermoFinnigan). Mass analysis was done using a ThermoFinnigan LCQ Deca XP Plus ion trap mass spectrometer equipped with a nanospray ion source using a 4.5 cm long metal needle (Hamilton; 950–00954) in a data-dependent acquisition mode. Electrical contact and voltage application to the probe tip took place via the nanoprobe assembly. Spray voltage of the mass spectrometer was set to 2.9 kV and heated capillary temperature at 190°C. The column was equilibrated for 5 min at 1.5 μl/min with 95% solution A and 5% solution B (A, 0.1% formic acid in water; B, 0.1% formic acid in acetonitrile) before sample injection. A linear gradient was initiated 5 min after sample injection ramping to 35% A and 65% B after 50 min and 20% A and 80% B after 60 min. Mass spectra were acquired in the mass-to-charge ratio 400–1800 range.
Protein identification was performed with the MS/MS search software Mascot 1.9 (Matrix Science, Boston, MA) with confirmatory or complementary analyses with TurboSequest as implemented in the Bioworks Browser 3.2, build 41 (ThermoFinnigan) (Gallaher et al., 2006).
Western blot analysis.
Equal amounts of mitochondrial protein (20 μg/well) were loaded in each well of a 10% SDS-PAGE gel, electrophoresed with a Tris/glycine running buffer, and transferred to a polyvinylidine difluoride membrane. The blots were probed with anti-Cytochrome c oxidase subunit IV (anti-COXIV; 1:1000; MitoSciences), anti-Peroxiredoxin-V (1:500; BD Biosciences, San Jose, CA), anti-Vdac1 (1:500; MitoSciences), anti-collapsin response mediator protein-1 (Crmp1; 1:1000; Exalpha Biologicals, Maynard, MA), and an HRP-conjugated horse anti-mouse secondary antibody (Vector Laboratories) as appropriate. Antigen-antibody complexes were visualized with the SuperSignal West Pico Chemiluminescent Substrate kit (Pierce). Band intensities were determined using the ChemiDoc XRS Gel documentation system and Quantity One software (Bio-Rad).
Respiratory measurements.
Mitochondrial oxygen consumption was measured polygraphically using a Clarke-type electrode. 100 μg of isolated mitochondria was placed in the respiration chamber at 37°C in respiratory buffer [(in mm) 25 sucrose, 75 mannitol, 5 KH2PO4, 100 KCl, 0.05 EDTA, 20 HEPES, 5 MgCl2, freshly added 0.5% BSA, protease inhibitor (Calbiochem), pH 7.4 with KOH] to yield a final concentration of 200 μg/ml. After 1 min baseline recording, mitochondria were energized by the addition of glutamate (5 mm) and malate (5 mm) as substrates. State 3 respiration was stimulated by the addition of ADP (410 μm). State 4o respiration was induced by the addition of the adenine nucleotide translocator inhibitor atractyloside (50 μm) to deplete ADP. The rate of oxygen consumption was calculated based on the slope of the response of isolated mitochondria to the successive administration of substrates. The respiratory control ratio (RCR) was determined by dividing the rate of oxygen consumption/min for state 3 (presence of ADP) by the rate of oxygen consumption/min for state 4o respiration (absence of ADP by addition of atractyloside).
Complex IV/cytochrome c oxidase activity.
Cytochrome c oxidase activity was measured spectrophometrically by monitoring change in absorbance (550 nm) of reduced cytochrome C by permeabilized mitochondria. Mitochondria were permeabilized in 0.2 ml of 75 mm potassium phosphate buffer, pH 7.5, at 25°C. The reaction was started by the addition of 0.05 ml of 5% cytochrome c previously reduced with sodium hydrosulfite. COX activity was calculated in nanomoles of oxidized cytochrome c per minute per mg protein and reported as rate relative to the mean rate from vehicle control-treated animals.
RNA isolation and RT-PCR.
Total RNA was isolated from rat brain tissue with TRIzol reagent (Invitrogen, Carlsbad, CA). Expression of mRNA for cytochrome c oxidase subunits I, II, III and IV (COXI, COXII, COXIII, and COXIV) were assessed by SYBR Green based real time reverse transcription (RT)-PCR. cDNA was synthesized from 10 μg total RNA by reverse transcription using SuperScriptII Reverse Transcription kit (Invitrogen). cDNA was amplified by PCR on a iCycler (Bio-Rad) using Bio-Rad iScript SYBR Green reaction buffer.
Statistics.
Statistically significant differences were determined by Student's t test.
Results
Before 2DE, the purity of the mitochondrial prep was assessed by Western blot analysis for expression of subcellular markers in crude homogenate, crude mitochondria, and highly purified mitochondria after density gradient centrifugation. The results of this analysis demonstrated that the Percoll purified mitochondria was not immunoreactive for the nuclear (histone H1), cytosolic (myelin basic protein), or endoplasmic reticulum (calnexin) markers (Fig. 1).
Figure 1.

Mitochondrial purity assessment. The purity of the mitochondrial sample was assessed by Western blot analysis for expression of subcellular markers in crude homogenate, crude mitochondria, and highly purified mitochondria (Mito.) after density gradient centrifugation. Antibodies raised against subcellular markers were used to detect mitochondrial anti-porin. nuclear anti-histone H1, endoplasmic reticulum anti-calnexin, and myelin basic protein. The same membrane was stripped with stripping buffer containing β-mercaptoethanol and reprobed with subsequent antibodies.
To facilitate quantitative detection and to maximize identification of changes in the proteome induced by 17β-estradiol (E2) treatment, isolated whole brain mitochondria were subjected to a 2D-gel electrophoresis LC-MS/MS proteomic analysis (Fig. 2). The mitoproteome is highly complex, with proteins encoded from both mitochondrial and genomic DNA that undergo post-transcriptional and post-translational modifications, creating a challenge for proteomic analyses. Furthermore, many of the proteins are membrane bound or transiently translocated to mitochondria. One limitation of 2D gels is that only proteins absorbed into the first dimension gel are detectable, which precludes profiling of all mitochondrial proteins and thus is limited to those soluble in the first dimension gel. Because it was not feasible to sequence all resolved proteins, the selection criteria for sequence was based on gel image quantitative analysis of the 2D analysis with the goal of obtaining a broad scope of the proteins regulated and unregulated by E2-treatment.
Figure 2.

Schematic overview of experimental design. Young adult female rats were injected with E2 or vehicle control 2 weeks after ovariectomy. Twenty-four hours later, whole-brain mitochondria were isolated and subjected to 2D electrophoresis. PD Quest software was used to match spots and identify expression patterns. Select protein spots were excised and sequenced by LC-MS/MS.
Of the 499 protein spots detected by gel image analyses, a total of 66 protein spots met the criterion for a twofold or greater change in expression relative to control. Of these, 28 proteins were increased in expression after E2 treatment as measured via fluorescent dye protein staining and imaging analyses. Conversely, 38 spots in the E2 group were identified as having decreased expression relative to control. For identification by LC-MS/MS peptide sequencing, 37 spots were selected from three categories: (1) E2-induced increased (18 spots), (2) E2-induced decreased (nine spots), and (3) no change in response to E2 (10 spots) (Fig. 3, Table 1). Of these proteins, several were identified as redundant and several spots did not result in successful protein identification. LC-MS/MS and Mascot database matching resulted in successful identification of 29 different proteins listed in Table 1. Of the detected proteins, nearly every protein identified localized to mitochondria, thus providing additional validation to the purity of isolated mitochondria used in these experiments. As a negative control, we identified a sampling of proteins unaffected by E2-treatment and performed MS analysis on 10 of the conserved spots, yielding the identity of five mitochondrial proteins unaffected by E2 treatment (Table 1). Overall, the mitoproteome profile of E2 treated brain encompassed multiple functional categories.
Figure 3.
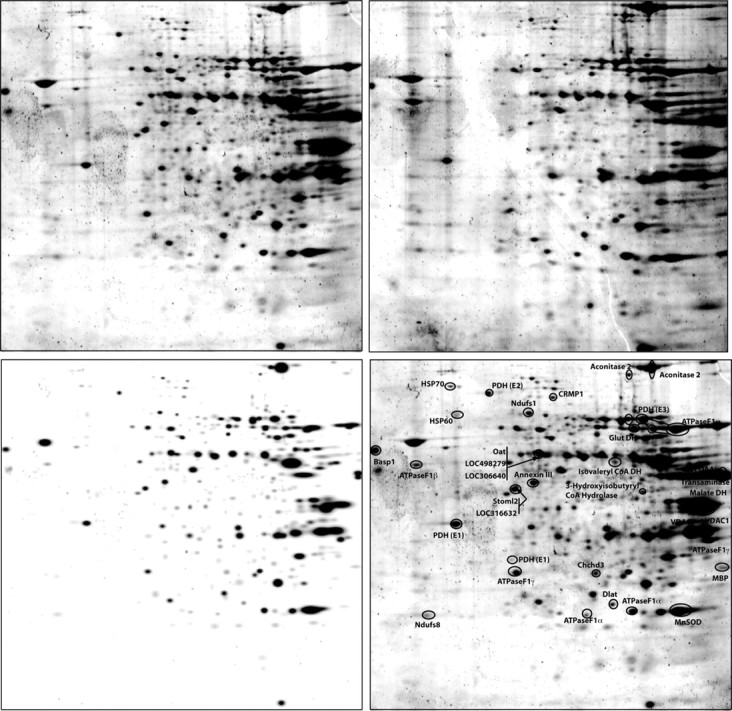
2D analysis of brain mitochondrial proteome. Isolated mitochondria from control (top left) and E2-treated (top right) rats were analyzed by 2D gel electrophoresis and spots were identified and matched (bottom left) with PD Quest software. After protein identification, selected protein spots were annotated (bottom right) for gel comparisons.
Table 1.
Mitochondrial proteome identification
| Protein ID by LC/MS/MS | gi | Gene name | Component | Primary function | Subfunction | Calculated MW | Percentage coverage | E2/C |
|---|---|---|---|---|---|---|---|---|
| Dihydrolipoamide dehydrogenase (E3 component of pyruvate dehydrogenase complex) | 40786469 | Dld | PDH complex | Energy | Glycolysis | 53,907 | 33 | ↑ |
| Dihydrolipoamide S-acetyltransferase (E2 component of pyruvate dehydrogenase complex)* | 34863356 | Dlat | PDH complex | Energy | Glycolysis | 67,035 | 10 | ↑ |
| Pyruvate dehydrogenase* | 34879653 | LOC306640 | PDH complex | Energy | Glycolysis | 43,144 | 5 | ↑ |
| Pyruvate dehydrogenase (lipoamide) β | 56090293 | Pdhb | PDH complex | Energy | Glycolysis | 38,851 | 28 | ↑ |
| Myelin basic protein | 8393759 | Mbp | Myelin sheath | Structure | Synaptic transmission | 14,080 | 7 | ≈ |
| Brain abundant, membrane attached signal protein 1 | 11560135 | Basp1 | Membrane; nucleus | Metabolism | Steroid biosynthesis | 21,659 | 12 | ≈ |
| 3-hydroxyisobutyryl-coenzyme A hydrolase | 62655032 | Hibch | Matrix | Metabolism | Amino acid metabolism | 34,394 | 9 | ↓ |
| Isovaleryl coenzyme A dehydrogenase | 6981112 | Ivd | Matrix | Metabolism | Amino acid metabolism | 46,862 | 21 | ↑ |
| Glutamate dehydrogenase 1 | 6980956 | Glud1 | Matrix | Metabolism | Amino acid metabolism | 61,285 | 45 | ↑ |
| Ornithine aminotransferase | 11968102 | Oat | Matrix | Metabolism | Amino acid metabolism | 48,535 | 2 | ↑ |
| Aconitase 2, mitochondrial | 40538860 | Aco2 | Matrix | Energy | TCA cycle | 85,425 | 33 | ↑ |
| Malate dehydrogenase, mitochondrial | 42476181 | Mor1 | Matrix | Energy | TCA cycle | 35,553 | 50 | ↓ |
| Peroxiredoxin 5 precursor | 16758404 | Prdx5 | Matrix | Energy | Redox | 22,048 | 12 | ↑ |
| Superoxide dismutase 2 | 8394331 | Sod2 | Matrix | Energy | Redox | 24,543 | 6 | ≈ |
| Voltage-dependent anion channel 1 | 13786200 | Vdac1 | Inner membrane; outer membrane | Energy | Transport of anions | 30,624 | 28 | ≈ |
| Heat shock 70 kDa protein 8 | 13242237 | Hspa8 | Inner membrane; outer membrane | Chaperone | Stress response | 70,740 | 8 | ↓ |
| Chaperonin GroEL (HSP60 family)* | 62655013 | LOC497838 | Inner membrane; outer membrane | Chaperone | Stress response | 61,055 | 25 | ↑ |
| Glutamate oxaloacetate transaminase 2 | 6980972 | Got2 | Inner membrane | Metabolism | Amino acid metabolism | 2806 | 14 | ↑ |
| Collapsin response mediator protein 1 | 25742751 | Crmp1 | Cytosol; mito? | Structure | Synaptic plasticity | 62,065 | 2 | ↓ |
| Annexin III (Lipocortin III) | 6978503 | Anxa3 | Cytosol; mito? | ? | ? | 36,191 | 21 | ↓ |
| ATP synthase, F1-α, isoform 1 | 40538742 | Atp5a1 | Complex V | Energy | OxPhos | 59,623 | 29 | ↑ |
| ATP synthase, F1-β | 54792127 | Atp5b | Complex V | Energy | OxPhos | 56,223 | 43 | ↑ |
| ATP synthase, F1-γ | 39930503 | Atp5c1 | Complex V | Energy | OxPhos | 32,865 | 10 | ≈ |
| NADH dehydrogenase 1 α subcomplex 10-like protein | 32996721 | LOC316632 | Complex I | Energy | OxPhos | 40,751 | 25 | ↓ |
| NADH dehydrogenase Fe-S protein-1 | 53850628 | Ndufs1 | Complex I | Energy | OxPhos | 79,282 | 12 | ↓ |
| NADH dehydrogenase Fe-S protein-8* | 27661165 | Ndufs8 | Complex I | Energy | OxPhos | 23,839 | 10 | ≈ |
| NADH dehydrogenase (ubiquinone) Fe-S protein 2* | 62659722 | LOC498279 | Complex I | Energy | OxPhos | 52,626 | 8 | ≈ |
| Coiled-coil-helix-coiled-coil-helix domain containing 3* | 62646993 | Chchd3 | ? | ? | ? | 42,036 | 11 | ↓ |
| Stomatin-like protein 2* | 34867290 | Stoml2 | ? | ? | ? | 38,283 | 4 | ↓ |
Proteins were identified by LC-MS/MS from 2D PAGE. All proteins were found to be from rat, and their function and process were identified in the NCBI database. Percentage of sequence coverage is listed. Proteins are also identified as increased by E2 (↑), decreased by E2 (↓), or a less than twofold change in quantity (≈).
*As predicted, Rattus norvegicus protein sequence identified is similar to known sequences from other species in NCBI database. MW, Molecular weight; gi, GenInfo protein accession number.
17β-Estradiol-induced regulation of mitochondrial proteins
The majority of the identified changes occurred in mitochondrial proteins that regulate cellular energetics represented by the TCA cycle and the electron transport chain (Fig. 4). Identified proteins involved in cellular energetics that were increased included three of the four subunits that comprise the multimeric pyruvate dehydrogenase complex, two enzymes of the TCA cycle, two oxidative phosphorylation complex I subunits and two ATP synthase F1 subunits. All three major components of pyruvate dehydrogenase (PDH) [lipoamide β (E1 component), dihyrolipoamide S-acetyltransferase (E2 component), and dihydrolipoamide dehydrogenase (E3 component)] were increased by E2-treatment (Fig. 4, Table 1). As an indicator of the selectivity of E2 regulation of the mitochondrial proteome, several identified proteins were unchanged by E2 including the voltage-dependent anion channel protein 1 (Vdac1/porin) (Fig. 5B, Table 1).
Figure 4.

Comparison of protein expression in 2D analysis. Individual protein spots are displayed in an expanded view for comparison of treatment groups. Subsets of identified spots are grouped by function category to represent protein expression patterns in the brain mitoproteome in response to E2 treatment.
Figure 5.

Quantitative analysis of brain mitoproteome expression patterns. A, Highly consistent protein spots were selected to quantitate expression changes. The characteristic spots representing aconitase (top) and peroxiredoxin-V (bottom) were identified in 2D gels from three separate animals for densitometric measurements. Bar graphs represent mean ± SEM (*p < 0.05 compared with control; n = 3). B, Peroxiredoxin-V, Vdac1, and Crmp1 were selected to represent upregulated, unchanged and downregulated proteins, respectively, for confirmation of 2DE expression analysis. C, Whole-brain mitochondria from control and E2-treated rats were assessed for protein expression by Western blot analysis (n = 4; *p < 0.05 compared with control).
Further implicating a regulatory role of E2 in mitochondrial energetics, the expression of the TCA cycle enzymes aconitase and malate dehydrogenase (MDH) were observed to be upregulated and downregulated, respectively, by E2 treatment (Fig. 4, Table 1). The increase in expression of a characteristic cluster of aconitase spots was found to be significant by quantitating the spot densities over three gels per condition (Fig. 5A) (p < 0.05).
In addition to the PDH complex and the TCA cycle enzymes, electron transport chain (ETC) enzymes were regulated by E2 (Fig. 4, Table 1). Nicotinamide adenine dinucleotide (NADH) dehydrogenase (ubiquinone) Fe-S protein-2 (Ndufs2) and NADH dehydrogenase 1-α subcomplex 10-like protein (Ndufs10) decreased in abundance, whereas NADH dehydrogenase Fe-S protein-1 (Ndufs1) and protein-8 (Ndufs8) were both unaltered (Table 1). Furthermore, of the subunits that comprise the F1 component of complex V (ATP synthase), both ATP synthase H+ transporting F1-α and ATP synthase F1-β, were increased by greater than a twofold change in expression by E2 treatment (Table 1). The E2 inducible increase in F1-α and β was specific for these subunits as the F1-γ subunit remained unchanged (Table 1). Several proteins on the gel were identified as redundant ATP synthase subunits although many were found at uncharacteristic migration distances and isoelectric points. Other researchers have encountered the same phenomenon, particularly for the highly abundant ATP synthase F1-α, by 2D gel electrophoresis (Yang et al., 2005).
Brain mitoproteome changes in response to E2 were not limited to proteins involved in bioenergetics. Changes in glutamate metabolism, reactive oxygen species defense, and chaperone and structural proteins were also detected (Fig. 4, Table 1). In the glutamate metabolic pathway, glutamate oxaloacetate transaminase-2 and glutamate dehydrogenase expression were both elevated in E2 rat brain mitochondria (Fig. 4, Table 1). Other proteins of this metabolic pathway were not identified in the current analysis; thus, it remains unknown whether they were coordinately regulated along with these two proteins.
Of the numerous proteins regulating the oxidative balance of the mitochondria, peroxiredoxin-V and manganese superoxide dismutase (MnSOD) were identified in the 2D gel (Fig. 4). E2 induced a significant increase in peroxiredoxin-V to 2.5-fold relative expression, as determined by quantitating the spot densities over three gels per condition (Fig. 5A) (p < 0.05). In contrast, expression of MnSOD, the other antioxidant enzyme identified in this analysis, was unaffected by E2 treatment (Fig. 4, Table 1). The changes in peroxiredoxin-V expression were subsequently verified by Western blot analyses of isolated mitochondria (Fig. 5C).
E2 treatment altered expression of three chaperone and structural proteins (Fig. 4). Two spots revealed an increase in heat shock protein 60 (Hsp60) greater than a twofold change in expression, whereas one spot indicated decreased Hsp70 levels after E2 exposure (Fig. 4, Table 1). The current analysis demonstrated that E2-treatment induced a decreased mitochondrial expression of Crmp1, a member of a family of cytosolic phosphoproteins expressed exclusively in the nervous system (NCBI Entrez gene; gene ID, 1400).
The remainder of the identified changes occurred in four proteins with differing functions. E2 increased isovaleryl CoA dehydrogenase and decreased 3-hydroxyisobutyryl-coenzyme A hydrolase (Fig. 4, Table 1). The implications of changes in these two proteins associated with valine catabolism and two other proteins, stomatin (decreased) and coiled-coil-helix-coiled-coil-helix domain containing protein (decreased), represent novel E2 mechanistic avenues to pursue. Very few proteins identified indicated extramitochondrial contamination. Only two proteins, brain abundant membrane attached signal protein-1 and myelin basic protein, were found to be likely contaminants and both were found in equal quantities between treatment groups (Table 1).
To validate the expression changes identified by the 2DE LC-MS/MS analysis, we used Western blot analysis to assess the expression of three identified proteins. The proteins for confirmation included one upregulated, one downregulated, and one unchanged to represent the three expression patterns identified. Consistent with the 2DE analysis (Fig. 5B), we demonstrated an increased expression of peroxiredoxin-V, decreased expression of Crmp1, and no change in expression of porin/Vdac1 (Fig. 5C).
17β-Estradiol-induced mitochondrial functional responses
To confirm that the above-identified changes in protein expression were indicative of changes in functional activity, we conducted corresponding functional analyses. Because many of the proteins altered by E2-treatment are involved in regulation of cellular energetics, we assessed the respiratory activity representative of the ETC.
We first determined the respiratory rate of isolated whole brain mitochondria using glutamate (5 mm) and malate (5 mm) as respiratory substrates. ADP addition to the mitochondrial suspension initiated state 3 respiration. Addition of the adenine nucleotide transporter inhibitor, atractyloside, reduced the rate of O2 consumption to that of state 4o respiration, limited by proton permeability of the inner membrane. In vivo treatment with E2 resulted in a significant increase (35.6%) in the RCR of isolated brain mitochondria (Fig. 6, Table 2) (p < 0.05 compared with control; n = 6). There was a significant increase in rate of state 3 respiration and no significant difference in the rate of state 4o respiration in the E2 group (Fig. 6, Table 2). These data indicate an increased efficiency of mitochondrial respiration rather than an alteration in the coupling of the electron transport chain.
Figure 6.

17β-estradiol enhances mitochondrial respiratory activity. Oxygen electrode measurements of respiration using isolated rat brain mitochondria. A, Representative traces of mitochondrial oxygen consumption with or without in vivo 17β-estradiol (E2, 30 μg/kg) or sesame oil vehicle control treatment in the presence of l-malate (5 mm), l-glutamate (5 mm), or ADP (410 μm) to initiate state 3 respiration, and atractyloside to induce state 4o respiration. The traces are representative of six separate experiments. B, State 3 and state 4o respiration and respiratory control ratio of control and E2-mitochondria. The data represents mean ± SEM of six separate experiments (*p < 0.05 compared with control; n = 6).
Table 2.
Mitochondrial respiration
| State 4o | State 3 | RCR | |
|---|---|---|---|
| Control | 5.23 ± 0.63 | 31.86 ± 3.22 | 6.34 ± 0.48 |
| Estradiol | 6.02 ± 0.64 | 48.22 ± 3.69* | 8.60 ± 0.79* |
Respiratory rates of whole-brain mitochondria isolated from rats with or without in vivo 17β-estradiol (E2, 30 μg/kg) or sesame oil vehicle control treatment in the presence of l-malate (5 mm), l-glutamate (5 mm), ADP (410 μm) to initiate state 3 respiration, and atractyloside to induce state 4o respiration. The RCR was calculated as the ratio of state 3/state 4o. The data represents mean ± SEM of six separate experiments (*p < 0.05 as compared with control; n = 6).
The accelerated movement of electrons down the electron transport chain would be expected to alter the activity of the terminal complex, COX (complex IV). To test this hypothesis, we examined the enzymatic activity of COX. Brain mitochondria isolated from E2-treated rats displayed a significant 1.5-fold activity of COX (Fig. 7B) (p < 0.01 compared with control; n = 6). The increased COX activity could be the result of modulation of enzymatic activity or to an alteration in expression levels of COX holoenzyme proteins. To determine whether E2 induced a change in COX subunit expression, we assessed the expression of COX mRNA and protein by real-time RT-PCR and Western blot analysis, respectively. Because the proteomic analysis indicated that E2 regulated both nuclear and mitochondrial encoded gene products, we assessed the expression of both mitochondrial and nuclear encoded COX subunit mRNAs. The mitochondrially encoded subunits COXI, COXII and COXIII were all significantly upregulated to approximately threefold relative expression in the E2-treatment group (Fig. 7A) (*p < 0.05 compared with control; n = 6). Likewise the expression of the nuclear encoded subunit COXIV was significantly increased to ∼2.5-fold relative expression in the E2-treatment group (Fig. 7A) (*p < 0.05 compared with control; n = 6). Consistent with the increased COXIV mRNA expression, E2 induced a significant increase in COXIV protein expression (Fig. 7B) (*p < 0.05 compared with control; n = 6).
Figure 7.

17β-Estradiol enhances cytochrome c oxidase activity and expression. A, Relative expression of COXI-IV mRNA. Total RNA was isolated from brain after 24 h exposure to 17β-estradiol (E2, 30 μg/kg) or sesame oil vehicle control. Expression of COXI, COXII, COXIII, and COXIV mRNA was assessed by real-time RT-PCR. Bars represent mean relative expression ± SEM from six animals per group (*p < 0.05 compared with control; n = 6). B, Relative expression of COXIV protein and relative rate of cytochrome C oxidase activity. Tissue homogenates were isolated from brain after 24 h exposure to 17β-estradiol (E2, 30 μg/kg) or sesame oil vehicle control. Expression of COXIV protein was assessed by Western blot analysis. Bars represent mean relative expression ± SEM from six animals per group (*p < 0.05 compared with control; n = 6).
Discussion
We investigated the impact of E2 on the mitoproteome in brain using 2D electrophoresis with subsequent protein identification by mass spectrometry. Identified changes in mitochondrial protein expression were then correlated with biochemical analyses of mitochondrial enzymatic function. Based on our criteria of a twofold or more change in expression, the results indicated that E2 significantly regulated key domains of cellular energetics, metabolism, free radical maintenance, and stress responses.
E2 regulation of cellular energetic pathways was evidenced by increased expression of multiple subunits of the PDH enzyme complex. PDH is a key regulatory enzyme linking the glycolytic metabolism to the TCA cycle by transforming pyruvate into acetyl CoA, which can, in turn, be used as a substrate for the TCA cycle. In brain, PDH is further responsible for directing acetyl CoA to either the TCA cycle or to acetylcholine synthesis (Holmquist et al., 2007). The mitoproteome profile induced by E2 is reflective of enhanced glycolytic activity (increased aconitase and decreased MDH) coupled with increased glutamatergic turnover (increased glutamate dehydrogenase and glutamate oxaloacetate transaminase-2). The latter can impact generation of neurotoxic free ammonium, as well as direct reduction of excitotoxic free glutamate (Parihar and Brewer, 2007). Consistent with this finding, E2 has been reported to increase activity of the key glycolytic enzymes hexokinase, phosphofructokinase, and phosphoglycerate kinase in rodent brain (Kostanyan and Nazaryan, 1992). Together, these findings indicate that E2 promotes enhanced utilization of glucose, the main energy source for the brain.
Oxidative phosphorylation and proteins within the electron transport chain were increased in expression and activity, a result that was consistent with increases in the glycolytic metabolic pathway. E2 induced significant increases in both protein expression and activity of complex IV subunits I–IV, a finding consistent with previous reports (Bettini and Maggi, 1992; Stirone et al., 2005). This E2-induced increase is particularly relevant given that reduction in complex IV is an early marker of Alzheimer's (Lin and Beal, 2006). E2 also increased expression of ATP synthase F1 subunits α and β, which is consistent with our previous report of estrogen-induced increases in ATP levels in primary neuronal cultures (Brinton et al., 2000). F0 subunits of ATP synthase were not identified, a finding expected because of limitations of 2D gel resolution of integral membrane proteins. In contrast to the increase in complex IV and V subunit expression, E2 induced downregulation of two subunits of complex I, Ndufs2, and Ndufs10. Complex I is composed of ∼ 60 proteins and downregulation of two subunits with no change in the two other complex I subunits identified in our analysis represents a small proportion of the large enzyme complex and the functional significance remains undetermined. The decrease in complex I subunits notwithstanding, E2-induced regulation of proteins composing the ETC corresponds to shifts in mitochondrial function. Increased mitochondrial respiration coupled with increased glycolytic balance is reflective of an enhanced energetic efficiency of brain mitochondria derived from E2 treated rats.
E2-induced enhancement of energetic efficiency is further strengthened by the changes in the free radical defense systems identified in the current proteomic analysis. Increased expression of peroxiredoxin-V is consistent with the well documented antioxidant effects of estrogens (Behl et al., 1995; Ejima et al., 1999; Urata et al., 2006), including increased glutaredoxin expression (Ejima et al., 1999; Diwakar et al., 2006; Urata et al., 2006). In contrast to the reported E2-induced increase in expression of MnSOD (Pejic et al., 2003; Strehlow et al., 2003), we did not observe significant changes in the MnSOD protein spot identified in the current 2D proteomic analysis. This may be because of multiple distributions within the gel caused by posttranslational modifications or to selective regulation by E2 during brain development (Pejic et al., 2003) or selective E2 regulation within the vasculature (Strehlow et al., 2003). Selective regulation of different antioxidant proteins could indicate protection against different oxidative stresses. Free radical balance is maintained by reduction of the superoxide anion to hydrogen peroxidase by superoxide dimutases. The resulting hydrogen peroxide can then be neutralized by various peroxidases, including peroxiredoxin-V (Banmeyer et al., 2005). Reduction in reactive oxygen species contributes to neuroprotection and can reduce the overall stress response. In this context, we identified significant alterations in the expression of two mitochondrial heat shock proteins, Hsp70 and Hsp60, which are important in the proper import of nascent proteins to the mitochondrial matrix.
E2 regulated both mitochondrial and nuclear encoded gene products, requiring coordinated control of mitochondrial and nuclear encoded gene transcription. Estrogen receptors have been detected in mitochondria (Chen et al., 2004; Yang et al., 2004; Stirone et al., 2005; Yager and Chen, 2007) as well as in the nucleus of neurons (McEwen et al., 2001). In addition to classical ERs, membrane sites of estrogen action, which activate the PI3K/PKC/Src/MEK/ERK signaling pathway, activating CREB (cAMP response element-binding protein), have been identified as required for E2-inducible neuroprotection (Zhao et al., 2004; Wu et al., 2005; Mannella and Brinton, 2006). Although the mechanisms whereby ERs coordinate the complex signaling pathway between three signaling compartments, membrane, mitochondria, and nucleus, remains to be determined, it is striking that ERs are perfectly positioned to coordinate events at the membrane with events in the mitochondria and nucleus. Coordinated action of E2 and activation of ERs leads to regulation of mitochondrial function and ultimately neural defense and survival.
Overall, the identified mitoproteome profile induced by E2 in the rodent brain reflects a mitochondrial state that could act as a buffer against mitochondrial functional decline. E2 increased expression of key components of the PDH complex and aconitase while simultaneously decreasing MDH. This would be expected to result in enhanced coupling between glycolysis and the TCA cycle combined with decreased MDH diverting excess malate outside the mitochondria thereby preventing oxaloacetate buildup. In the cytosol, malate is converted to pyruvate by cytosolic malic enzyme, which re-enters the TCA cycle by PDH conversion to acetyl CoA. We propose that this enzymatic buffer includes a shift toward enhanced glycolytic energy production and a reduction in β-oxidation.
In conclusion, within 24 h of exposure in vivo, E2 significantly shifted the mitochondrial proteome to a profile consistent with a glycolytic driven TCA cycle: increased oxidative phosphorylation, increased ATP synthase, and decreased β-oxidation. The mitoproteome profile induced by E2 was validated by enhanced functional efficiency of the brain mitochondria. Collectively, these data provide a plausible mechanistic rationale for estrogen therapy reduction in risk of Alzheimer's disease and suggest that the E2-inducible changes in the mitoproteome or mitochondrial function could serve as potential biomarkers of therapeutic efficacy. Furthermore, E2-induced regulation of mitochondrial protein expression and function provides insights into targets and mechanistic strategies to prevent neurodegenerative diseases.
Footnotes
This work was supported by National Institutes of Health Grant 1RO1 MH67159-01 (R.D.B., J.N.), the Kenneth T. and Eileen L. Norris Foundation (R.D.B.), and the L. K. Whittier Foundation (R.D.B.). R.W.I. is supported by National Institute on Aging training Grant T32-AG000093-24/25 (C. E. Finch). We thank Dr. Enrique Cadenas for helpful suggestions and critique of this work as it progressed.
References
- Banmeyer I, Marchand C, Clippe A, Knoops B. Human mitochondrial peroxiredoxin 5 protects from mitochondrial DNA damages induced by hydrogen peroxide. FEBS Lett. 2005;579:2327–2333. doi: 10.1016/j.febslet.2005.03.027. [DOI] [PubMed] [Google Scholar]
- Behl C, Widmann M, Trapp T, Holsboer F. 17-beta estradiol protects neurons from oxidative stress-induced cell death in vitro. Biochem Biophys Res Commun. 1995;216:473–482. doi: 10.1006/bbrc.1995.2647. [DOI] [PubMed] [Google Scholar]
- Bettini E, Maggi A. Estrogen induction of cytochrome c oxidase subunit III in rat hippocampus. J Neurochem. 1992;58:1923–1929. doi: 10.1111/j.1471-4159.1992.tb10070.x. [DOI] [PubMed] [Google Scholar]
- Bishop J, Simpkins JW. Estradiol enhances brain glucose uptake in ovariectomized rats. Brain Res Bull. 1995;36:315–320. doi: 10.1016/0361-9230(94)00208-i. [DOI] [PubMed] [Google Scholar]
- Brewer GJ, Reichensperger JD, Brinton RD. Prevention of age-related dysregulation of calcium dynamics by estrogen in neurons. Neurobiol Aging. 2006;27:306–317. doi: 10.1016/j.neurobiolaging.2005.01.019. [DOI] [PubMed] [Google Scholar]
- Brinton RD. Cellular and molecular mechanisms of estrogen regulation of memory function and neuroprotection against Alzheimer's disease: recent insights and remaining challenges. Learn Mem. 2001;8:121–133. doi: 10.1101/lm.39601. [DOI] [PubMed] [Google Scholar]
- Brinton RD. Impact of estrogen therapy on Alzheimer's disease: a fork in the road? CNS Drugs. 2004;18:405–422. doi: 10.2165/00023210-200418070-00001. [DOI] [PubMed] [Google Scholar]
- Brinton RD. Investigative models for determining hormone therapy-induced outcomes in brain: evidence in support of a healthy cell bias of estrogen action. Ann NY Acad Sci. 2005;1052:57–74. doi: 10.1196/annals.1347.005. [DOI] [PubMed] [Google Scholar]
- Brinton RD, Chen S, Montoya M, Hsieh D, Minaya J, Kim J, Chu HP. The women's health initiative estrogen replacement therapy is neurotrophic and neuroprotective. Neurobiol Aging. 2000;21:475–496. doi: 10.1016/s0197-4580(00)00109-3. [DOI] [PubMed] [Google Scholar]
- Cadenas E, Davies KJ. Mitochondrial free radical generation, oxidative stress, and aging. Free Radic Biol Med. 2000;29:222–230. doi: 10.1016/s0891-5849(00)00317-8. [DOI] [PubMed] [Google Scholar]
- Chen JQ, Delannoy M, Cooke C, Yager JD. Mitochondrial localization of ERα and ERβ in human MCF7 cells. Am J Physiol Endocrinol Metab. 2004;286:E1011–E1022. doi: 10.1152/ajpendo.00508.2003. [DOI] [PubMed] [Google Scholar]
- Chen S, Nilsen J, Brinton RD. Dose and temporal pattern of estrogen exposure determines neuroprotective outcome in hippocampal neurons: therapeutic implications. Endocrinology. 2006;147:5303–5313. doi: 10.1210/en.2006-0495. [DOI] [PubMed] [Google Scholar]
- Diwakar L, Kenchappa RS, Annepu J, Saeed U, Sujanitha R, Ravindranath V. Down-regulation of glutaredoxin by estrogen receptor antagonist renders female mice susceptible to excitatory amino acid mediated complex I inhibition in CNS. Brain Res. 2006;1125:176–184. doi: 10.1016/j.brainres.2006.10.015. [DOI] [PubMed] [Google Scholar]
- Ejima K, Nanri H, Araki M, Uchida K, Kashimura M, Ikeda M. 17beta-estradiol induces protein thiol/disulfide oxidoreductases and protects cultured bovine aortic endothelial cells from oxidative stress. Eur J Endocrinol. 1999;140:608–613. doi: 10.1530/eje.0.1400608. [DOI] [PubMed] [Google Scholar]
- Gallaher TK, Wu S, Webster P, Aguilera R. Identification of biofilm proteins in non-typeable Haemophilus Influenzae. BMC Microbiol. 2006;6:65. doi: 10.1186/1471-2180-6-65. [DOI] [PMC free article] [PubMed] [Google Scholar]
- Holmquist L, Stuchbury G, Berbaum K, Muscat S, Young S, Hager K, Engel J, Munch G. Lipoic acid as a novel treatment for Alzheimer's disease and related dementias. Pharmacol Ther. 2007;113:154–164. doi: 10.1016/j.pharmthera.2006.07.001. [DOI] [PubMed] [Google Scholar]
- Kostanyan A, Nazaryan K. Rat brain glycolysis regulation by estradiol-17 beta. Biochim Biophys Acta. 1992;1133:301–306. doi: 10.1016/0167-4889(92)90051-c. [DOI] [PubMed] [Google Scholar]
- Lin MT, Beal MF. Mitochondrial dysfunction and oxidative stress in neurodegenerative diseases. Nature. 2006;443:787–795. doi: 10.1038/nature05292. [DOI] [PubMed] [Google Scholar]
- Lopez MF, Kristal BS, Chernokalskaya E, Lazarev A, Shestopalov AI, Bogdanova A, Robinson M. High-throughput profiling of the mitochondrial proteome using affinity fractionation and automation. Electrophoresis. 2000;21:3427–3440. doi: 10.1002/1522-2683(20001001)21:16<3427::AID-ELPS3427>3.0.CO;2-L. [DOI] [PubMed] [Google Scholar]
- Mannella P, Brinton RD. Estrogen receptor protein interaction with phosphatidylinositol 3-kinase leads to activation of phosphorylated Akt and extracellular signal-regulated kinase 1/2 in the same population of cortical neurons: a unified mechanism of estrogen action. J Neurosci. 2006;26:9439–9447. doi: 10.1523/JNEUROSCI.1443-06.2006. [DOI] [PMC free article] [PubMed] [Google Scholar]
- McEwen B. Estrogen actions throughout the brain. Recent Prog Horm Res. 2002;57:357–384. doi: 10.1210/rp.57.1.357. [DOI] [PubMed] [Google Scholar]
- McEwen B, Akama K, Alves S, Brake WG, Bulloch K, Lee S, Li C, Yuen G, Milner TA. Tracking the estrogen receptor in neurons: implications for estrogen-induced synapse formation. Proc Natl Acad Sci USA. 2001;98:7093–7100. doi: 10.1073/pnas.121146898. [DOI] [PMC free article] [PubMed] [Google Scholar]
- Morrison JH, Brinton RD, Schmidt PJ, Gore AC. Estrogen, menopause, and the aging brain: how basic neuroscience can inform hormone therapy in women. J Neurosci. 2006;26:10332–10348. doi: 10.1523/JNEUROSCI.3369-06.2006. [DOI] [PMC free article] [PubMed] [Google Scholar]
- Murphy AN, Bredesen DE, Cortopassi G, Wang E, Fiskum G. Bcl-2 potentiates the maximal calcium uptake capacity of neural cell mitochondria. Proc Natl Acad Sci USA. 1996;93:9893–9898. doi: 10.1073/pnas.93.18.9893. [DOI] [PMC free article] [PubMed] [Google Scholar]
- Nicholls DG, Budd SL. Mitochondria and neuronal survival. Physiol Rev. 2000;80:315–360. doi: 10.1152/physrev.2000.80.1.315. [DOI] [PubMed] [Google Scholar]
- Nilsen J, Brinton RD. Mechanism of estrogen-mediated neuroprotection: regulation of mitochondrial calcium and Bcl-2 expression. Proc Natl Acad Sci USA. 2003;100:2842–2847. doi: 10.1073/pnas.0438041100. [DOI] [PMC free article] [PubMed] [Google Scholar]
- Nilsen J, Brinton RD. Mitochondria as therapeutic targets of estrogen action in the central nervous system. Curr Drug Targets CNS Neurol Disord. 2004;3:297–313. doi: 10.2174/1568007043337193. [DOI] [PubMed] [Google Scholar]
- Nilsen J, Chen S, Irwin RW, Iwamoto S, Brinton RD. Estrogen protects neuronal cells from amyloid beta-induced apoptosis via regulation of mitochondrial proteins and function. BMC Neurosci. 2006;7:74. doi: 10.1186/1471-2202-7-74. [DOI] [PMC free article] [PubMed] [Google Scholar]
- Parihar MS, Brewer GJ. Mitoenergetic failure in Alzheimer disease. Am J Physiol Cell Physiol. 2007;292:C8–C23. doi: 10.1152/ajpcell.00232.2006. [DOI] [PubMed] [Google Scholar]
- Pejic S, Kasapovic J, Cvetkovic D, Pajovic SB. The modulatory effect of estradiol benzoate on superoxide dismutase activity in the developing rat brain. Braz J Med Biol Res. 2003;36:579–586. doi: 10.1590/s0100-879x2003000500004. [DOI] [PubMed] [Google Scholar]
- Schroeter H, Boyd CS, Ahmed R, Spencer JP, Duncan RF, Rice-Evans C, Cadenas E. c-Jun N-terminal kinase (JNK)-mediated modulation of brain mitochondria function: new target proteins for JNK signalling in mitochondrion-dependent apoptosis. Biochem J. 2003;372:359–369. doi: 10.1042/BJ20030201. [DOI] [PMC free article] [PubMed] [Google Scholar]
- Simpkins JW, Dykens JA. Mitochondrial mechanisms of estrogen neuroprotection. Brain Res Rev. 2007 doi: 10.1016/j.brainresrev.2007.04.007. in press. [DOI] [PubMed] [Google Scholar]
- Simpkins JW, Rajakumar G, Zhang YQ, Simpkins CE, Greenwald D, Yu CJ, Bodor N, Day AL. Estrogens may reduce mortality and ischemic damage caused by middle cerebral artery occlusion in the female rat. J Neurosurg. 1997;87:724–730. doi: 10.3171/jns.1997.87.5.0724. [DOI] [PubMed] [Google Scholar]
- Singh M, Meyer EM, Millard WJ, Simpkins JW. Ovarian steroid deprivation results in a reversible learning impairment and compromised cholinergic function in female Sprague-Dawley rats. Brain Res. 1994;644:305–312. doi: 10.1016/0006-8993(94)91694-2. [DOI] [PubMed] [Google Scholar]
- Singh M, Dykens JA, Simpkins JW. Novel mechanisms for estrogen-induced neuroprotection. Exp Biol Med (Maywood) 2006;231:514–521. doi: 10.1177/153537020623100505. [DOI] [PubMed] [Google Scholar]
- Stirone C, Duckles SP, Krause DN, Procaccio V. Estrogen increases mitochondrial efficiency and reduces oxidative stress in cerebral blood vessels. Mol Pharmacol. 2005;68:959–965. doi: 10.1124/mol.105.014662. [DOI] [PubMed] [Google Scholar]
- Strehlow K, Rotter S, Wassmann S, Adam O, Grohe C, Laufs K, Bohm M, Nickenig G. Modulation of antioxidant enzyme expression and function by estrogen. Circ Res. 2003;93:170–177. doi: 10.1161/01.RES.0000082334.17947.11. [DOI] [PubMed] [Google Scholar]
- Toran-Allerand CD. Novel sites and mechanisms of oestrogen action in the brain. Novartis Found Symp. 2000;230:56–69. doi: 10.1002/0470870818.ch6. [DOI] [PubMed] [Google Scholar]
- Urata Y, Ihara Y, Murata H, Goto S, Koji T, Yodoi J, Inoue S, Kondo T. 17β-estradiol protects against oxidative stress-induced cell death through the glutathione/glutaredoxin-dependent redox regulation of Akt in myocardiac H9c2 cells. J Biol Chem. 2006;281:13092–13102. doi: 10.1074/jbc.M601984200. [DOI] [PubMed] [Google Scholar]
- Wang JM, Irwin RW, Brinton RD. Activation of estrogen receptor alpha increases and estrogen receptor beta decreases apolipoprotein E expression in hippocampus in vitro and in vivo. Proc Natl Acad Sci USA. 2006;103:16983–16988. doi: 10.1073/pnas.0608128103. [DOI] [PMC free article] [PubMed] [Google Scholar]
- Woolley CS. Electrophysiological and cellular effects of estrogen on neuronal function. Crit Rev Neurobiol. 1999;13:1–20. doi: 10.1615/critrevneurobiol.v13.i1.10. [DOI] [PubMed] [Google Scholar]
- Wu TW, Wang JM, Chen S, Brinton RD. 17β-estradiol induced Ca2+ influx via L-type calcium channels activates the Src/ERK/cyclic-AMP response element binding protein signal pathway and BCL-2 expression in rat hippocampal neurons: a potential initiation mechanism for estrogen-induced neuroprotection. Neuroscience. 2005;135:59–72. doi: 10.1016/j.neuroscience.2004.12.027. [DOI] [PubMed] [Google Scholar]
- Yager JD, Chen JQ. Mitochondrial estrogen receptors—new insights into specific functions. Trends Endocrinol Metab. 2007;18:89–91. doi: 10.1016/j.tem.2007.02.006. [DOI] [PubMed] [Google Scholar]
- Yang JW, Juranville JF, Hoger H, Fountoulakis M, Lubec G. Molecular diversity of rat brain proteins as revealed by proteomic analysis. Mol Divers. 2005;9:385–396. doi: 10.1007/s11030-005-6359-3. [DOI] [PubMed] [Google Scholar]
- Yang SH, Liu R, Perez EJ, Wen Y, Stevens SM, Jr, Valencia T, Brun-Zinkernagel AM, Prokai L, Will Y, Dykens J, Koulen P, Simpkins JW. Mitochondrial localization of estrogen receptor beta. Proc Natl Acad Sci USA. 2004;101:4130–4135. doi: 10.1073/pnas.0306948101. [DOI] [PMC free article] [PubMed] [Google Scholar]
- Zhao L, Chen S, Ming Wang J, Brinton RD. 17Beta-estradiol induced nuclear and dendritic Ca2+ rise and subsequent CREB activation in hippocampal neurons: a potential initiation mechanism for estrogen neurotrophism. Neuroscience. 2005;132:299–311. doi: 10.1016/j.neuroscience.2004.11.054. [DOI] [PubMed] [Google Scholar]