

Abstract
A unifying principle of sensory system organization is feature extraction by modality-specific neuronal maps in which arrays of neurons show systematically varied response properties and receptive fields. Only beginning to be understood, however, are the mechanisms by which these graded systems are established. In the peripheral auditory system, we have shown previously that the intrinsic firing features of spiral ganglion neurons are influenced by brain-derived neurotrophic factor (BDNF) and neurotrophin-3 (NT-3). We now show that is but a part of a coordinated package of neurotrophin actions that also includes effects on presynaptic and postsynaptic proteins, thus encompassing the input, transmission, and output functions of the spiral ganglion neurons. Using immunocytochemical methods, we determined that proteins targeted to opposite ends of the neuron were organized and regulated in a reciprocal manner. AMPA receptor subunits GluR2 and GluR3 were enriched in base neurons compared with their apex counterparts. This distribution pattern was enhanced by exposure to BDNF but reduced by NT-3. SNAP-25 and synaptophysin were distributed and regulated in the mirror image: enriched in the apex, enhanced by NT-3 and reduced by BDNF. Moreover, we used a novel coculture to identify potential endogenous sources of neurotrophins by showing that sensory receptors from different cochlear regions were capable of altering presynaptic and postsynaptic protein levels in these neurons. From these studies, we suggest that BDNF and NT-3, which are systematically distributed in complementary gradients, are responsible for orchestrating a comprehensive set of electrophysiological specializations along the frequency contour of the cochlea.
Keywords: NT-3, BDNF, neurotrophin, spiral ganglion, auditory nerve, cochlea, synaptophysin, SNAP-25, GluR3, GluR2, AMPA, glutamate receptor
Introduction
Spiral ganglion neurons, which are responsible for conveying auditory signals into the brain, must do so with remarkable precision to retain the timing and intensity information necessary to represent accurately features of the stimulus and its location (Carr, 2004). In addition to myriad specializations that typify the complex cochlear end organ (Rubel and Fritzsch, 2002; Raphael and Altschuler, 2003), previous studies from our laboratory established that the speed with which neurons are capable of responding to stimuli, along with their level of accommodation, vary systematically along the cochlear frequency map (Adamson et al., 2002b). This suggests that ion channels which determine neuronal firing patterns are specifically tailored to the frequency and timing of the signals that they receive.
One mechanism that accounts, in part, for this specification of electrophysiological phenotype is regulation by neurotrophins. In the cochlea, two neurotrophins are released by the specialized cells of the organ of Corti: brain-derived neurotrophic factor (BDNF) and neurotrophin-3 (NT-3) (Ernfors et al., 1992; Pirvola et al., 1994, 1997; Farinas et al., 2001). In addition to exerting a powerful effect on survival (Pirvola et al., 1992; Zheng et al., 1995; Mou et al., 1998; Hossain et al., 2002), BDNF and NT-3 have opposing actions on the firing features of spiral ganglion neurons. BDNF is responsible for fast firing characteristics that typify the basal neurons which transmit high frequency sound signals into the brain; NT-3, however, mediates slower and more heterogeneous firing patterns that characterize the apical neurons which convey low frequency sound information (Davis, 2003).
It is currently unknown, however, whether the intrinsic firing features are the only target of this regulation by neurotrophins. To explore this issue we chose to evaluate the immunocytochemical distribution of GluR2 and GluR3, two postsynaptic AMPA receptor (AMPAR) α-subunits found in spiral ganglion neurons (Altschuler et al., 1989; Parks, 2000; Puyal et al., 2002), along with two different presynaptically localized proteins, synaptophysin and the t-SNARE [target-membrane-associated-soluble N-ethylmaleimide fusion protein attachment protein (SNAP) receptor] SNAP-25, which are also expressed in the spiral ganglion (Safieddine and Wenthold, 1999; Sokolowski and Cunningham, 1999; Lee et al., 2002; Khalifa et al., 2003).
We found that the AMPARs as well as synaptophysin and SNAP-25 showed levels of expression that varied according to cochlear location. Interestingly, and unexpectedly, we observed that the distributions of the presynaptic and postsynaptic proteins were oriented in opposite directions with mirror image regulation by neurotrophins. To begin to identify the endogenous source of the neurotrophins, we developed a novel in vitro system in which spiral ganglion neurons re-formed connections with hair cells isolated separately from different regions of the cochlea. The results showed that the sensory end organ has a direct and powerful impact on a broad spectrum of electrophysiologically relevant proteins within spiral ganglion neurons, thus supporting a model that binding of neurotrophins to their receptors engages a comprehensive cellular response that dictates the properties of the neurons and places them in a functional context.
Materials and Methods
Tissue culture.
We used three separate preparations to investigate protein distribution in spiral ganglion neurons. The first was a neuronal culture in which the apical and basal one-fifth of the spiral ganglion were isolated from postnatal day 7 (P7) CBA/CaJ mice and plated in separate culture dishes; then used after 6 d in vitro (div). This preparation was used to compare new data directly with previous investigations in which electrophysiological parameters have been fully characterized along with extensive immunocytochemical, pharmacological, and molecular studies of the underlying voltage-gated ion channel contributions (Adamson et al., 2002a,b; Reid et al., 2004; Zhou et al., 2005; Chen and Davis, 2006). In all cultures, cells were maintained in growth medium: DMEM (Sigma D6171) supplemented with 10% fetal bovine serum, 4 mm l-glutamine, and 0.1% penicillin–streptomycin. Neurons were maintained in culture at 37°C in a humidified incubator with 5% CO2. In some experiments the media was supplemented with 5 ng/ml NT-3 (PeproTech, Rocky Hill, NJ) or 5 ng/ml BDNF (PeproTech) at the time of tissue isolation and plating.
The second preparation was a standard whole mount, in which the organ of Corti and innervating spiral ganglion neurons were stained immediately on removal from the mouse (P7). The advantage of this preparation was that the in situ patterns of protein expression and synaptic contacts between the spiral ganglion neurons and their receptor cells were retained. We chose to analyze tissue at the same postnatal stage as that isolated for our tissue culture preparations.
The third preparation was a novel spiral ganglion neuron–hair cell coculture preparation developed specifically for this study, which we refer to as a synapse culture. For these preparations, micro-isolates of inner and outer hair cells were carefully dissected along with their surrounding satellite cells and positioned next to spiral ganglion neuron somata clusters. In many cases, the hair cells were removed as an intact strip, such that the alignment of a single row of inner hair cells and three rows of outer hair cells was preserved. Furthermore, we were able to distinguish the peripheral from the central side of the spiral ganglion so that their peripheral processes could be routinely positioned toward the inner hair cell side of the micro-isolates. By separating the tissues in this way we were able to coculture hair cell micro-isolates from different apical or basal regions of the cochlea with clusters of neuronal somata isolated from either the apex or base. Because neurotrophins are released by the hair cells and organ of Corti satellite cells, this preparation was used as a biological assay for their effects on the spiral ganglion. Furthermore, by plating spiral ganglion neuron explants separately from the hair cell micro-isolates, we were able to mix-and-match hair cells with spiral ganglion neurons from different cochlear locations. These cultures were used at 17 div to allow the appropriate amount of time for neuronal processes to grow to the explant and re-form connections. In a limited set of experiments, function blocking anti-NT-3 antibody (R & D Systems; AF-267-NA; 2 μg/ml) or anti-BDNF antibody (Promega, G1641; 4 μg/ml) was added to the media at the time of tissue isolation and at 4 d intervals. Procedures performed on CBA/CaJ mice were approved by The Rutgers University Institutional Review Board for the Use and Care of Animals (IRB-UCA), protocol 90-073.
Cell culture and transfections.
Neuroblastoma cells (N2a) were grown in 5 ml flasks at 37°C in 5% CO2 in DMEM supplemented with 10% fetal bovine serum (FBS; Sigma F2442), 1% glutamine (Sigma G6392) and 0.1% penicillin–streptomycin (Sigma P0781). Before transfection, cells were replated into 35 × 10 mm poly-d-lysine (Sigma P0899) coated dishes. Cells were transfected within 24 h using the Lipofectamine2000 method (Invitrogen, Carlsbad, CA; catalog #11668-027) at a concentration of 2 μg of DNA per 35 × 10 mm dish. Immunocytochemical experiments with transfected N2a cells expressing GluR1–GFP, GluR2–GFP, GluR3–GFP or GluR4–GFP subunits were made 3 d after plating, whereas experiments with N2a cells expressing SY–GFP and SNAP25–GFP were made 24 h after transfection.
Plasmid constructs.
The GluR1–GFP, GluR2–GFP, GluR3–GFP, GluR4–GFP constructs (Shi et al., 2001) were kindly provided by Dr. Robert Malinow (Cold Spring Harbor Laboratory, Cold Spring Harbor, NY), synaptophysin–GFP (Scalettar et al., 2002) was generously provided by Dr. Bethe Scalettar (Department of Physics, Lewis and Clark College, Portland, OR), and the SNAP-25–GFP plasmid (Loranger and Linder, 2002) was a generous gift from Dr. Maurine Linder (Washington University School of Medicine, St. Louis, MO). The plasmid DNA was amplified in DH5α Escherichia coli, selected with the appropriate antibiotics, and subsequently purified using the Qiagen QIAprep Spin Miniprep Kit (catalog # 27106).
Immunofluorescence.
For double-immunofluorescence staining, tissues were fixed with 100% methanol at −20°C or with 4% paraformaldehyde at RT for 6 min, followed by 0.1% Triton X-100 for tissue permeabilization. Cultures were then rinsed thoroughly and incubated at RT for 1 h in 5% normal goat serum (NGS) or 5% nonfat dry milk. Primary antibodies were applied and incubated for 1 h at RT or 24 h at 4°C.
After rinsing three times for 5 min with 0.01 m PBS; pH 7.4, tissues were incubated with one of the following fluorescent-conjugated secondary antibodies for 1 h at RT, all of which were used at a 1:100 dilution; Alexa Fluor 488-conjugated anti-rabbit secondary antibody (Invitrogen, A-11008), Alexa-Fluor 594-conjugated anti-mouse secondary antibody (Invitrogen, 11005), Alexa-Fluor 488-conjugated anti-mouse secondary antibody (Invitrogen, A-11017), Alexa-Flour 594-conjugated anti-rabbit secondary antibody (Invitrogen, A-11012), and/or Alexa Fluor 488-donkey conjugated anti-goat secondary antibody (Invitrogen, A-11055). Finally, after three rinses, tissues were covered with DABCO and coverslipped for additional observation.
Antibody specificity.
Polyclonal and monoclonal class III β-tubulin antibodies (TUJ1; Covance; PRB-435P and MMS-435P, respectively) were used to discriminate neurons from surrounding satellite cells. At appropriate concentrations neuron-specific labeling was uniform for both the polyclonal and monoclonal antibodies (1:200 and 1:350, respectively). Anti-calbindin antibody (Swant, CB-38a, 1:100) was used to label the hair cells in micro-isolates derived from different regions of the organ of Corti.
Antibodies against the postsynaptic glutamatergic AMPA receptor subunits, GluR2 (Chemicon, MAB397, amino acids 175–430), GluR3 (Chemicon, MAB5416; N terminus), and GluR2/3 (Chemicon, AB1506, amino acids 850–862), have been extensively characterized. Western blot analysis on transfected cell lines showed that each antibody specifically recognized their respective subunits (Wenthold et al., 1992; Vissavajjhala et al., 1996; Moga et al., 2003). Immunocytochemical tests of specificity were confirmed on monoclonal anti-GluR3 and polyclonal anti-GluR2/3 antibodies, the main antibodies used to investigate the distribution of AMPA receptors in this study. These antibodies were used at relatively high dilutions (anti-GluR2/3 at 1:500 and anti-GluR3 antibody at 1:8000) because of the extremely high protein expression levels in transfected N2a cells compared with the low levels in spiral ganglion neurons. As shown in supplemental Figure 1 (available at www.jneurosci.org as supplemental material), we observed that GluR2/3 was specific for GluR2 and GluR3 subunits (supplemental Fig. 1a–f, available at www.jneurosci.org as supplemental material). Anti-GluR3 antibody however, specifically stained cells transfected with the GluR3–GFP constructs (supplemental Fig. 1g–l, available at www.jneurosci.org as supplemental material); although at higher antibody concentrations there was some limited cross-reactivity with GluR2 expressing cells. Furthermore, in the transfected N2a cells and neuronal tissues there was minimal or no staining with the secondary antibodies alone.
Despite the obvious differences noted in transfected cells we found that the staining patterns in spiral ganglion neurons were identical. Therefore the use of multiple anti-AMPA receptor antibodies not only showed that there was no apparent difference between GluR2 and GluR3 distributions in spiral ganglion neurons, but it further confirmed each of our observations throughout the study. Furthermore, the likelihood that any of these three antibodies were nonspecific when they stained identically, having the same patterns within the ganglion and equivalent responses to neurotrophins is small. Thus, the use of multiple antibodies was important to determine that our results were not dependent on a particular antibody, but instead indicative of the actual AMPA receptor distribution.
Antibodies against the presynaptic vesicle associated protein, synaptophysin, and SNAP-25 have also been characterized extensively and found to be specific to their respective subunits (Graff et al., 2001; Wheeler et al., 2002; Morris et al., 2005; Shi and Ethell, 2006; Tafoya et al., 2006). Our immunocytochemical examination of monoclonal anti-synaptophysin antibody (Sigma-Aldrich: S5768; clone SVP-38) and polyclonal anti-SNAP-25 antibody (Chemicon: AB5871P) confirmed these observations. The anti-synaptophysin (supplemental Fig. 1m–p, available at www.jneurosci.org as supplemental material) (1:16,000) and anti-SNAP25 (supplemental Fig. 1q–t, available at www.jneurosci.org as supplemental material) (1:500) specifically labeled N2a cells expressing the appropriate full-length protein tagged with GFP. We also evaluated a monoclonal anti-SNAP-25 antibody (Covance, SMI-81R) and found that it had the same staining patterns as the polyclonal antibody in spiral ganglion neuronal cultures. Again, control cultures of N2a cells and spiral ganglion neurons using secondary antibodies alone displayed little or no labeling.
Image acquisition and quantitative analysis.
Images were acquired with a Hamamatsu 1394 Orca-ER camera using IPLab Scientific Imaging Software (BD Biosciences), saved in Tiff format, and analyzed with Adobe Photoshop v7.0 (Adobe Systems, San Jose, CA). For all conditions within each experiment antibody concentrations, incubation times, photographic exposures, and photographic adjustments were identical to make accurate comparisons between relative staining levels within each experiment. All luminance measurements were made from nonadjusted, unsaturated images; those that were photographically adjusted for presentation were adjusted identically for each figure. Because by far the greatest amount of protein is localized to the cell soma, antibody luminance was measured from this region of the spiral ganglion neurons. This approach allows one to attain robust measurements of proteins that are known to localized to specific presynaptic (synaptophysin and SNAP-25) or postsynaptic (GluR2 and GluR3) regions of these bipolar neurons, reflecting either altered transport or protein levels. In either case, however, it should be noted that there is not a direct relationship between antibody luminance and protein levels. Overall luminance levels for each neuron were obtained by subtracting the average of four background measurements from the average of three soma measurements taken from the brightest areas in cell body. In some cases, measurements were made from the entire somata, rather than the brightest area, to determine whether alterations in absolute protein levels or protein distribution could account for our findings. Statistical comparisons were made using Student's two-tailed paired t test. SEM is indicated in the figures by error bars and in the text after the ± symbol.
Western blots.
Protein was isolated from one-fifth of the apical and basal spiral ganglion (P6—P7), which were acutely removed and stored at −80°C. Samples were homogenized in 10 mm Tris, pH8.8, 5% SDS, and protein dye (0.2% Bromophenol Blue in 100 mm Tris buffer, with 4% SDS and 3% glycerol). Samples were then boiled at 100°C for 3–5 min, sonicated for 20 m and centrifuged for 10 m at 10,000RPM. Before loading, 1 mm dithiothreitol (DTT; Invitrogen, Y00147) was applied to selected samples. Approximately equal amounts of protein were loaded on 10% SDS-PAGE polyacrylamide gels (Bio-Rad, Hercules, CA) with subsequent transfer to polyvinylidene difluoride membrane (PVDF; Bio-Rad). For visualization of total protein loaded, PVDF membranes were stained and subsequently destained with the MemCode Reversible Protein Staining Kit (Pierce: 24585). Membranes were then probed overnight at 4°C with primary antibodies and subsequently visualized either by chemiluminescence (ECL-SuperSignal West Pico Chemiluminescence Substrate; Pierce; 34077) or colorimetric methods. Western blots were analyzed with Adobe Photoshop v7.0 (Adobe Systems, San Jose, CA).
The anti-synaptophysin (1:300) and anti-GluR2/3 (1:200) antibodies described above were also used for Western blot analysis of presynaptic and postsynaptic proteins, respectively. For normalization to overall protein levels, we used polyclonal anti-tubulin antibody (Sigma, T-3526; 1:1000) and monoclonal anti-α-tubulin antibody (Invitrogen, A-11126; 1:1000) in conjunction with the monoclonal anti-synaptophysin and polyclonal anti-GluR2/3 antibody, respectively. The polyclonal anti-tubulin antibody recognized multiple tubulin isotypes, which have been detected in the spiral ganglion (Hallworth and Luduena, 2000).
Results
Our approach in this study was to use a number of different preparations to examine the ganglionic distribution and regulation of synaptic proteins in spiral ganglion neurons. Using immunocytochemical quantification, we evaluated protein levels in neuronal somata to use a single cellular location rather than having to normalize for differential subcellular distributions. This approach was particularly critical for spiral ganglion neurons cultures because antibody labeling at terminal endings, although present, was too sparse for accurate, repeatable measurement above the background.
An example AMPA receptor distribution in the spiral ganglion was evident with anti-GluR3 antibody labeling, which revealed an obvious difference between apical and basal neurons (Fig. 1a,b) equivalently stained with anti-β-tubulin antibody (Fig. 1c,d). Antibody labeling intensity differences were quantified with luminance measurements from 158 basal and 94 apical neurons in this single preparation (Fig. 1e). We constructed frequency histograms from these measurements which were then fit with single or the sum of multiple Gaussians. In these plots, the amplitude represents the number of measurements obtained, which depended on factors such as cell density and overlap and therefore the number of measurements included in each condition did not necessarily reflect cell survival. The position of the peak in each histogram represents the average luminance of the population. As can be seen from the fits, the average anti-GluR3 antibody luminance measured from basal neurons was shifted to higher values when compared with measurements made from apical neurons. The difference in the means of the basal and apical neurons in this single preparation (26.5 and 15.1, respectively) reflect our overall results when the means of 6 or more preparations were averaged for each anti-AMPAR antibody (Fig. 1f). The average luminance measured from 8 experiments using anti-GluR3 antibody was significantly higher in the base than in the apex (25.0 ± 2.8 vs 13.9 ± 1.3, respectively; p < 0.01). With measurements from the entire cell soma, rather than from the area with the highest luminance, we also established that basal neurons possessed significantly higher anti-GluR3 levels (22.5 ± 0.24) than apex neurons (9.5 ± 0.09; p < 0.01; n = 8), indicating that the differences that we observed were most likely not attributable to protein redistribution, but, rather to overall protein increases. Labeling apex and base spiral ganglion neurons with anti-GluR2/3 (19.0 ± 1.5 and 35.9 ± 3.8, respectively; n = 6) or anti-GluR2 (24.7 ± 4.8 and 32.0 ± 3.9, respectively; n = 6) antibodies also showed significant differences (p < 0.01 and p < 0.05, respectively).
Figure 1.

The postsynaptic AMPA receptor subunits GluR2 and GluR3 were enriched in basal spiral ganglion neurons. a, b, Spiral ganglion neurons isolated from the apical and basal cochlear region, respectively, labeled with anti-GluR3 antibody (1:50; green). c, d, Spiral ganglion neurons shown in a and b labeled with anti-β-tubulin (α-β-Tub) antibody (red). e, Frequency histogram of anti-GluR3 antibody luminance measurements from a single experiment; apical and basal measurements were each well fitted with a single Gaussian. f, An average of six or more experiments confirmed the increased luminance of three anti-AMPAR antibodies in basal spiral ganglion neurons. For this and subsequent figures, experiment numbers are indicated in the average columns; error bars represent the SEM. Significance of the paired Student's t test, *p < 0.05; **p < 0.01. Scale in d applies to a–d.
AMPA receptor proteins reflect characteristics of postsynaptic membrane at peripheral synapses made by hair cells onto spiral ganglion neurons. To make a parallel inference about the features of central synapses made by spiral ganglion neurons onto cochlear nucleus neurons, we used well characterized antibodies to the presynaptic vesicle-associated protein, synaptophysin, and to the t-SNARE, SNAP-25. The distribution of these two presynaptic proteins was distinctly different from the postsynaptic AMPARs. In this case, it was the apical neurons in which the proteins were enriched, as shown for anti-synaptophysin antibody labeling (Fig. 2a,b) in neurons with equivalent anti-β-tubulin antibody staining (Fig. 2c,d). Frequency histograms from a single experiment showed that the population of apical neurons possessed the highest luminance of anti-synaptophysin antibody staining in neuronal cultures (Fig. 2e), and revealed that the distribution was relatively heterogeneous, with the sum of two Gaussians being required to fit the data (Fig. 2e, arrows). In contrast, anti-synaptophysin antibody luminance in the basal spiral ganglion neurons was uniformly low and well fitted by a single Gaussian (Fig. 2e). Quantification of 5 experiments in which we compared the average luminance of anti-synaptophysin antibody in the apical and basal spiral ganglion neurons showed a significant increase in the former relative to the latter (22.7 ± 1.7 vs 13.4 ± 2.2; p < 0.01) (Fig. 2f). Measurements from the entire cell soma, rather than from the area with the highest luminance, further substantiated that anti-synaptophysin was enriched in apical neurons (13.9 ± 0.08) compared with their basal counterparts (7.7 ± 0.05; p < 0.01; n = 5), indicating that the differences that we observed were most likely not attributable to protein redistribution, but, rather to altered protein levels.
Figure 2.

Synaptophysin and SNAP-25 were enriched in apical spiral ganglion neurons. a, b, Spiral ganglion neurons isolated from the apical and basal cochlear region, respectively, labeled with anti-synaptophysin antibody (α-SY, 1:50; green). c, d, Spiral ganglion neurons shown in a and b labeled with anti-β-tubulin antibody (α-β-Tub; red). e, Anti-synaptophysin antibody luminance measurements from a single experiment; basal measurements were well fitted with a single Gaussian; apical measurements were well fitted with a sum of two Gaussians (arrows denote the 2 peaks). f, An average of three or more experiments confirmed the increased luminance of anti-synaptophysin and anti-SNAP-25 (1:30) antibody labeling in apical spiral ganglion neurons. Scale bar in d applies to a–d.
In previous studies, we found relatively few proteins that exhibit greater levels in the apex relative to the base. Of all the electrophysiologically relevant proteins that we reported on to date, only an A-type K+ channel α-subunit, Kv4.2, was preferentially distributed in the apical spiral ganglion (Adamson et al., 2002b). Conversely, we have noted that BK, Kv3.1, Kv1.1 (Adamson et al., 2002b), as well as the GluR2 and GluR3 subunits reported herein, are enriched in basal neurons. Therefore, to determine whether the relatively greater amount of synaptophysin in apical neurons was unique to this protein, or whether it was potentially indicative of a more general relationship, we examined the distribution of another presynaptic protein, SNAP-25. Although functionally distinct, SNAP-25 not only displayed the same apical–basal distribution as synaptophysin (Fig. 2f) but showed the same heterogeneous pattern as well (data not shown). Quantitative analysis of 3 experiments using anti-SNAP-25 antibody confirmed that average luminance in apical neurons was significantly greater than that in basal neurons (30.7 ± 2.0 vs 11.1 ± 2.0; p < 0.05) (Fig. 2f).
The differential distributions of presynaptic and postsynaptic proteins were further investigated with acutely dissected whole mounts of the cochlea, which reflect the in vivo condition. Anti-GluR3 antibody was enriched in the basal neurons (Fig. 3b,f) compared with their apical counterparts (Fig. 3a,e). Averaged values obtained from three separate experiments confirmed that these differences were indeed significant. The average anti-GluR3 antibody luminance of basal neurons (15.0 ± 1.6) was significantly higher than their apical counterparts (5.3 ± 0.6) at the p < 0.05 level (Fig. 3i, left). Again, the opposite distribution was noted for anti-synaptophysin antibody, such that the highest luminance was observed in the apical modiolus (Fig. 3c,g) compared with the basal region (Fig. 3d,h). Averaged values obtained from three separate experiments also confirmed that these differences were significant. The average anti-synaptophysin antibody luminance of apical neurons (17.9 ± 1.2) was significantly higher than their basal counterparts (7.9 ± 0.4) at the p < 0.05 level (Fig. 3i, right).
Figure 3.
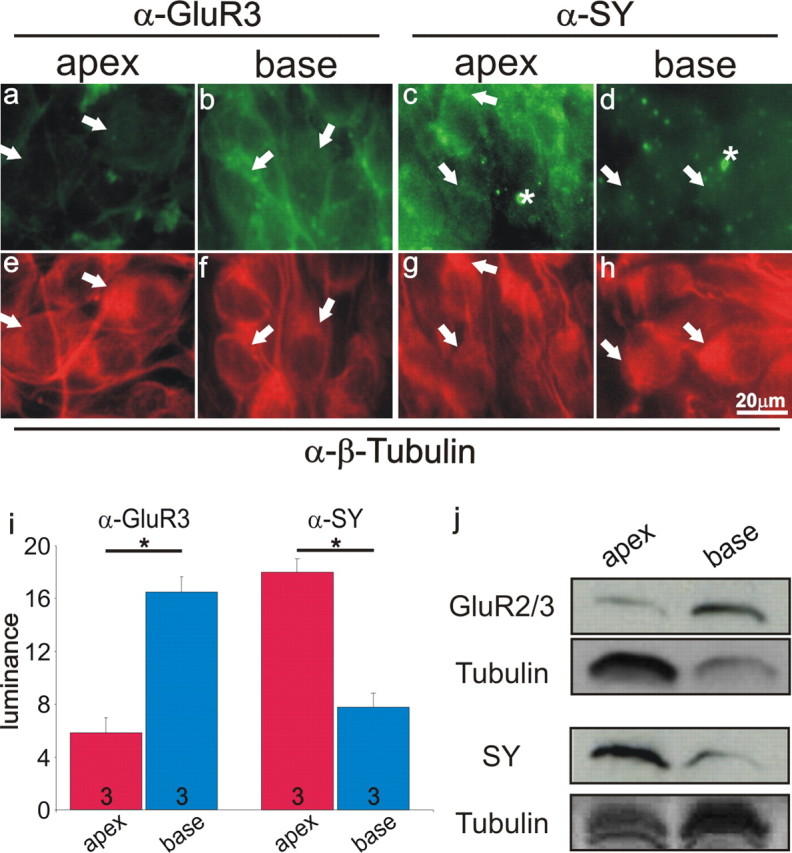
Anti-GluR3 and anti-synaptophysin antibodies were differentially distributed in acutely isolated spiral ganglion whole mounts and tissues. a, b, Greater anti-GluR3 antibody (1:50) labeling of basal than apical neurons in a whole mount (P7) having similar anti-β-tubulin antibody staining intensities (e, f). c, d, Greater anti-synaptophysin (α-SY, 1:50) antibody labeling of apical than basal neurons in a whole mount with similar anti-β-tubulin antibody staining (g, h). Enhanced nonspecific labeling (i.e., asterisks in c, d) was most likely attributable to the increased thickness of the tissue. Scale bar in h applies to all panels. Arrows indicate the neuronal somata for comparison between panels. i, Average anti-GluR3 antibody labeling (left; n = 3) and average anti-synaptophysin labeling (right; n = 3) for multiple whole mount preparations indicate a significant difference at the p < 0.05 level for both sets of experiments. j, Western blots from acutely isolated spiral ganglion tissues (P6–P7) were consistent with our immunocytochemical findings. Top two panels show the enhancement of GluR2/3 in the base compared the apex using tubulin as a control. More apical spiral ganglion sample was loaded to bring anti-GluR2/3 antibody labeling to detectable levels. The bottom two panels show the enhancement of anti-synaptophysin antibody labeling in the apex compared with the base using tubulin as a control. More basal spiral ganglion sample was loaded to bring the anti-synaptophysin antibody labeling to detectable levels. With the polyclonal anti-tubulin antibody, multiple bands were observed (bottom-most panel), whereas with the monoclonal anti-tubulin antibody a single dark band was observed (second panel from the top).
These findings were further confirmed with Western blot analysis of proteins isolated from acutely prepared spiral ganglion tissues. To compensate for low anti-GluR2/3 antibody levels in the apex, larger sample volumes were used for tissue from apex than for base, and this difference was measured with anti-tubulin antibody labeling. When normalized against anti-tubulin labeling, anti-GluR2/3 antibody staining was over threefold greater in the base than in the apex (Fig. 3j, top two panels). For anti-synaptophysin labeling, the sample volumes were adjusted in the opposite direction to observe detectible levels in the base. When normalized against anti-tubulin labeling, anti-synaptophysin antibody staining in the apex was over twofold greater than that in the base (Fig. 3j, bottom two panels). It is clear, therefore, from the analysis of these acute preparations that the distinctive patterns of presynaptic and postsynaptic protein distribution are also present in vivo, at developmental times after which the synaptic contacts between the hair cells and spiral ganglion neurons have been established (Echteler, 1992; Despres and Romand, 1994).
A key feature of the spiral ganglion neurons is that their electrophysiological properties are regulated by neurotrophins. We have shown previously that exposure to BDNF engages coordinated changes that causes neurons to exhibit uniformly rapid and accommodating responses to depolarizing current injection. NT-3 has the opposite action and causes neurons to display slower and more heterogeneous firing patterns. If the AMPAR distribution described above is part of this same cellular response, then we should expect that anti-GluR2 and anti-GluR3 antibody labeling of basal neurons would also be enhanced by BDNF and either unaffected or downregulated by NT-3. To test this hypothesis, neuronal cultures were prepared with spiral ganglion neurons isolated separately from the apex or base and maintained in normal growth medium (Control) or growth medium supplemented with either 5 ng/ml NT-3 or 5 ng/ml BDNF. All experiments included the 6 conditions so that the relative luminance could be compared within each experimental replication. Consistent with our prediction, anti-GluR3 antibody labeling in apex neurons was enriched by exposure to BDNF (Fig. 4a,e), whereas base neurons were unaffected (Fig. 4b,f). Also consistent was the effect of NT-3. It had little impact on anti-GluR3 antibody labeling in apical neurons, with already low staining levels (Fig. 4c), but in basal neurons, with high control staining levels, anti-GluR3 labeling was reduced (Fig. 4d). Therefore, much like the voltage-gated ion channels that are preferentially localized to the basal neurons, BDNF and NT-3 have reciprocal actions on AMPAR density.
Figure 4.

BDNF increases, whereas NT-3 reduces, anti-GluR3 antibody labeling in spiral ganglion neurons. Spiral ganglion neurons were double labeled with anti-GluR3 antibody (a–f; green) and anti-β-tubulin (α-β-Tub) antibody (g–l; red). Neuronal labeling was assessed under control conditions (no added neurotrophin; a,b and g,h), exposure to media supplemented with 5 ng/ml NT-3 (c,d, and i,j), or media supplemented with 5 ng/ml BDNF (e,f and k,l). m, Frequency histograms and Gaussian fits to measurements made from apical neurons in control media (red) compared with neurons in NT-3-supplemented (green) and BDNF-supplemented (light blue) media from a single experiment. Despite the differences in peak amplitude, the mean luminance (dotted line/arrow) is clearly shifted to the right when BDNF is added to the culture medium. n, Frequency histograms and Gaussian fits to measurements made from basal neurons in control media (blue) compared with neurons in NT-3-supplemented (purple) and BDNF-supplemented (orange) media from a single experiment. The mean luminance (dotted line) is shifted to the left when NT-3 is added to the culture medium. o, Normalized Gaussian fits for histograms shown in m and n. p, An average of seven separate experiments shows that the differences in anti-GluR3 antibody labeling in the presence of BDNF and NT-3 are statistically significant. Scale bar in l applies to a–l.
These staining patterns were quantified with frequency histograms constructed from the measurements made from apical (Fig. 4m) and basal (Fig. 4n) neurons as part of a single experiment. The amplitude of the histograms in this and other experiments typically reflected the neurons that could be successfully measured, rather than being indicative of overall neuronal survival. It should be noted that, although the greatest neuron survival was routinely observed with BDNF supplementation (Mou et al., 1997), less measurements were often made in this condition because of the extensive overlap of neurons. Therefore, to compare each condition directly, Gaussians were normalized to the peak value. The resultant normalized Gaussians of these data show that neurons exposed to BDNF, whether from the apex or base, are clearly similar to the base control neurons (Fig. 4o). Conversely, neurons exposed to NT-3, independent of their original innervation of the cochlea, showed similar anti-GluR3 antibody luminance levels to the apical control neurons (Fig. 4o). Quantitative analysis of seven separate experiments confirmed that compared with controls the upregulation of GluR3 in apical neurons by BDNF is significant (14.1 ± 1.5 vs 20.5 ± 2.1; p < 0.01); as is the downregulation of GluR3 in basal neurons with NT-3 (23.3 ± 2.5 vs 14.5 ± 2.4; p < 0.01) (Fig. 4p). We also observed the same pattern of distribution with anti-GluR2 antibody labeling. The average luminance values obtained and number of measurement made for each condition in a single experiment are as follows: apex control = 13.8 (n = 95); apex NT-3 = 12.0 (n = 63); apex BDNF = 18.4 (n = 44); base control = 23.7 (n = 114); base NT-3 = 11.6 (n = 210); base BDNF = 27.8 (n = 197).
If the presynaptic proteins synaptophysin and SNAP-25 are also part of the comprehensive neurotrophin response, then they should exhibit regulation that is the mirror image of the postsynaptic receptors. Experiments designed to test this hypothesis showed that both apical and basal neurons supplemented with NT-3 (Fig. 5c,d) had enriched anti-synaptophysin antibody labeling, similar to apical control neurons (Fig. 5a). Furthermore, the heterogeneity observed for the apical control condition was also evident when cultures were supplemented with NT-3; one can observe intensely stained neurons next to those that are only lightly stained with anti-synaptophysin antibody (Fig. 5a,c,d). Conversely, BDNF had little effect on the already low staining levels of anti-synaptophysin antibody in basal neurons (Fig. 5f), whereas it reduced the amount of staining in the apical neurons (Fig. 5e) causing the cells to have lower, more uniform luminance levels. Therefore, much like the voltage-gated K+ channel 4.2 α-subunits, which are preferentially localized to the apical neurons (Adamson et al., 2002b), NT-3 enhances and BDNF reduces the presynaptic protein, synaptophysin.
Figure 5.

NT-3 increases, whereas BDNF reduces, anti-synaptophysin antibody labeling in spiral ganglion neurons. Spiral ganglion neurons were double labeled with anti-synaptophysin (α-SY) antibody (a–f; green) and anti-β-tubulin (α-β-Tub) antibody (g–l; red). Neuronal labeling was assessed under control conditions (no added neurotrophin; a,b and g,h); arrowheads in a indicate a process stained with anti-synaptophysin antibody; exposure to media supplemented with 5 ng/ml NT-3 (c,d and i,j), or media supplemented with 5 ng/ml BDNF (e,f and k,l). m, Frequency histograms and Gaussian fits to measurements made from apical neurons in control media (red) compared with neurons in NT-3-supplemented (green) and BDNF-supplemented (light blue) media from a single experiment. n, Frequency histograms and Gaussian fits to measurements made from basal neurons in control media (blue) compared with neurons in NT-3-supplemented (purple) and BDNF-supplemented (orange) media from a single experiment. o, Normalized Gaussian fits for histograms shown in m and n. Note that a sum of Gaussians were required to fit the apical control and NT-3-supplemented conditions. p, An average of five separate experiments shows that the differences in anti-synaptophysin antibody labeling in the presence of BDNF and NT-3 are statistically significant. Scale bar in l applies to a–l.
These patterns can also be seen in the frequency histograms constructed from the measurements made from apical (Fig. 5m) and basal (Fig. 5n) neurons as part of a single experiment. Normalized Gaussians fitted to the data clearly show that neurons exposed to NT-3, whether they are from the apex or base, possess relatively high levels of anti-synaptophysin antibody luminance, which could be fitted with two or three Gaussians, similar to that observed in apex control neurons (Fig. 5o). Conversely, neurons exposed to BDNF, independent of their original cochlea innervation, showed similar low luminance levels, which were fitted with a single Gaussian, as observed in base control neurons (Fig. 5o). Quantitative analysis of the overall mean of 5 separate experiments showed that when compared with control the upregulation of synaptophysin in basal neurons by NT-3 was significant (13.4 ± 2.2 vs 22.7 ± 3.3; p < 0.05), as was the downregulation of synaptophysin in apical neurons by BDNF (22.7 ± 1.7 vs 17.5 ± 2.9; p < 0.05) (Fig. 5p). The same pattern was also found for anti-SNAP-25 antibody luminance; NT-3 raised antibody luminance levels in basal neurons, whereas BDNF lowered it in apical neurons. The average luminance values obtained and number of measurement made for each condition in a single experiment are as follows: apex control = 31.7 (n = 37); apex NT-3 = 36.9 (n = 130); apex BDNF = 9.7 (n = 93); base control = 10.9 (n = 64); base NT-3 = 30.9 (n = 19); base BDNF = 10.4 (n = 184).
Application of exogenous neurotrophins demonstrates the powerful regulation that they exert, but does not provide insight into potential endogenous sources. To assess the contribution of the specialized cells of the cochlea on the spiral ganglion, we created a culture system (synapse cultures; see Materials and Methods) in which neurons from defined regions of the ganglion were combined with hair cell receptors and associated support cells isolated from different regions of the cochlea. Clusters of spiral ganglion neurons (SGNs, labeled with anti-β-tubulin antibody, red) regenerate processes that project to the region in which micro-isolates had been placed on the culture dish (Fig. 6a, dotted line). At closer inspection one can observe that neuronal processes (red) appear to terminate on the single row of inner hair cells (ihc, green; arrow) which were oriented in culture toward the peripheral projections of the spiral ganglion neurons (Fig. 6b, SGNs). Only very few fibers project into the outer hair cell region (Fig. 6b, ohc, green, double arrowhead). Processes on the opposite side of the ganglion (red, arrows) form a bundle that projects away from the hair cell micro-isolates (Fig. 6a). After 17 div, we routinely observed anti-synaptophysin antibody labeled puncta (green/yellow) within the hair cells stained with anti-calbindin (blue) in regions that directly abut anti-β-tubulin stained neuronal fibers (Fig. 6c, red). We assume that these synaptic specializations within the hair cell are enlarged, in part, because of the relative dearth of innervating fibers when compared with the 20–30 fibers that normally innervate a single hair cell in vivo.
Figure 6.

Synapse cultures consist of hair cell micro-isolates cocultured with spiral ganglion neurons. a, Low magnification of a synapse culture showing a cluster of spiral ganglion neurons (SGNs) labeled with anti-β-tubulin polyclonal antibody (red). Neuronal processes were typically observed extending toward the region in which the hair cell micro-isolates were placed (dotted line). b, Intermediate magnification reveals the innervation patterns typically observed in synapse cultures. Anti-β-tubulin antibody-labeled spiral ganglion neurons (red) extend their processes predominately to the inner hair cell (ihc) region of the micro-isolates (green, anti-calbindin, arrow); only rarely were projections detected that extended to the outer hair cell (ohc) region (double arrowhead). c, High-magnification view of the inner hair cell region of a micro-isolate stained with anti-synaptophysin antibody (green), anti-calbindin (blue), and anti-β-tubulin. Profiles indicative of presynaptic specializations were observed (yellow and green puncta; i.e., arrow) when the spiral ganglion processes (red) directly contact the hair cells (blue). Large putative presynaptic labeling could be attributable in part to the limited competition between spiral ganglion neuron terminals in these cultures.
This culture system enabled us to pair spiral ganglion neurons with hair cell micro-isolates from different cochlear locations. For example, this allowed us to test whether the low luminance levels of anti-AMPA receptor antibody labeling in apical spiral ganglion neurons were increased when neurons were paired with micro-isolates derived from the basal cochlea. When apical neurons were combined with apically derived micro-isolates, we observed the expected low levels of anti-GluR2/3 antibody labeling (Fig. 7Ac,Ag); yet, when apical spiral ganglion neurons were cocultured with basal micro-isolates, we saw a dramatic increase in the anti-GluR2/3 antibody staining (Fig. 7Aa,Ae). Averaged values compared between the apical neurons cocultured with apical hair cell micro-isolates (15.4 ± 2.4) and apical neurons cocultured with basal hair cell micro-isolates (32.4 ± 4.5) were significantly different (p < 0.05) (Fig. 7Ai) and were consistent with our previous observations of control apical neuronal cultures supplemented with BDNF.
Figure 7.

The differential effects of apically and basally derived organ of Corti micro-isolates on spiral ganglion neurons observed in synaptic cultures were blocked by neurotrophin function blocking antibodies. Aa–Ad, Anti-GluR2/3 antibody staining of apical neurons cocultured with basal (a, b) or apical (c, d) hair cell (HC) micro-isolates, with (b, d) or without (a, c) added anti-BDNF function blocking antibody. Because neurons were relatively dispersed, neurons from two regions are shown in Aa. Ae–Ah, Anti-β-tubulin (α-β-Tub) antibody staining of spiral ganglion neurons (SGNs); same conditions as above. Scale bar in Ah applies to Aa–Ah. Ai, Average anti-GluR2/3 antibody luminance measurements made from three separate experiments. Ba–Bd, Anti-synaptophysin (α-SY) antibody staining of basal neurons cocultured with apical (a, b) or basal (c, d) hair cell micro-isolates, with (b, d) or without (a, c) added anti-NT-3 function blocking antibody. Be–Bh, Anti-β-tubulin antibody staining of spiral ganglion neurons; same conditions as above. Scale bar in Bh applies to Ba–Bh. Bi, Average anti-synaptophysin antibody luminance measurements made from three separate experiments.
To begin to identify the factors that mediate the actions of the hair cell micro-isolates on spiral ganglion neurons, we used function blocking anti-BDNF antibody for this set of experiments. Because the organ of Corti micro-isolates most likely continuously release neurotrophins, although function blocking antibodies were necessarily applied at specific intervals over 17 div, we hypothesized that antibody luminance levels would most likely not return to baseline because of incomplete block. However, if there was an observable effect we argued that it would be indicative of a definitive action of a particular neurotrophin, regardless of whether additional factors released by the micro-isolates also contributed to regulating spiral ganglion phenotype.
We established two additional conditions to examine the effects of the basal-derived micro-isolates on AMPA levels in apical spiral ganglion neurons: apical neurons + basal micro-isolates + anti-BDNF (Fig. 7Ab,Af) and apical neurons + apical micro-isolates + anti-BDNF (Fig. 7Ad,Ah). Consistent with our hypothesis anti-BDNF function blocking antibody primarily prevented the full effect of basal micro-isolates on anti-GluR2/3 antibody luminance levels (Fig. 7Ab,Af), but was without effect on luminance levels of apical neurons cocultured with apical hair cell micro-isolates (Fig. 7Ad,Ah). The effect of anti-BDNF function blocking antibody on the basal hair cell cultures (19.1 ± 2.5) were significant at the p < 0.05 level when compared with the control condition: apical spiral ganglion neurons + basal hair cell micro-isolates (Fig. 7Ai). This suggests that micro-isolates dissected from the basal organ of Corti are not only capable of reiterating the actions of exogenously applied BDNF and therefore directly responsible for enrichment of AMPA receptors, but that BDNF is preferentially released from the basal compared with the apical region.
We also examined whether apical hair cell micro-isolates could affect the characteristics of the presynaptic protein synaptophysin in spiral ganglion neurons. For this approach we first determined that a high proportion of the basal neurons when cocultured with basal hair cell micro-isolates showed low levels of anti-synaptophysin antibody labeling (Fig. 7Bc,Bg), as expected from evaluations of basal-derived neuronal cultures. When basal neurons were cocultured with apical hair cell micro-isolates, however, we found a robust enhancement of anti-synaptophysin antibody labeling (Fig. 7Ba,Be). Averaged values compared between the basal neurons cocultured with basal hair cell micro-isolates (22.7 ± 2.5) and basal neurons cocultured apical hair cell micro-isolates (49.4 ± 8.5), were significantly different (p < 0.05) (Fig. 7Bi) and showed an increase that was consistent with our previous observations of basal neuronal cultures supplemented with NT-3.
We next tested the hypothesis that apical tissue preferentially releases NT-3 by treating neuron/micro-isolate cocultures with anti-NT-3 function blocking antibody. For these experiments we also established two additional conditions: basal neurons + apical micro-isolates + anti-NT-3 (Fig. 7Bb,Bf), and basal neurons + basal micro-isolates + anti-NT-3 (Fig. 7Bd,Bh). Consistent with our hypothesis, anti-NT-3 primarily prevented the full effect of apical micro-isolates on anti-synaptophysin antibody luminance levels (33.9 ± 4.8; p < 0.01) (Fig. 7Bi). As expected, anti-NT-3 function blocking antibody was without effect on luminance levels in basal neurons cocultured with base hair cell micro-isolates (19.3 ± 1.3) (Fig. 7Bi). This result is consistent with the idea that micro-isolates dissected from the apical organ of Corti are capable of reiterating the actions of exogenously applied NT-3 and therefore directly responsible for enrichment of the presynaptic proteins synaptophysin and SNAP-25. Furthermore, this result confirms previous studies of graded apical to basal NT-3 promoter expression levels in newborn, postnatal, and adult mouse cochleae (Fritzsch et al., 1997; Sugawara et al., 2007) by showing functionally that NT-3 is preferentially released by the specialized cells in the apical cochlear region.
Discussion
The distinctive regulatory pattern observed in this study shows that neurotrophins released by cells in the organ of Corti have a powerful effect on the spiral ganglion. Not only do they influence the apparent presynaptic and postsynaptic protein composition along the tonotopic gradient, but they also appear to control the phenotype along the length of an individual spiral ganglion neuron: from the neurotransmitter receptors, through action potential transmission, to neurotransmitter release. This suggests that neurotrophins received from synaptic connections made in the periphery could impact signal processing at several stages in the peripheral auditory circuitry, from synaptic connection with hair cells to innervation of multiple targets in the cochlear nucleus.
As signaling molecules, neurotrophins regulate myriad cellular events that range from enhanced survival, proliferation, and neuronal differentiation to synaptic plasticity (Huang and Reichardt, 2001; Cohen-Cory, 2002; Lu, 2004; Reichardt, 2006). Multiple intracellular pathways mediate these diverse responses which can have a profound impact on many aspects of neuronal connectivity (Chao, 2003; Huang and Reichardt, 2003; Reichardt, 2006). Beyond the broad range of effects that have been documented extensively for individual neurotrophins, characterizing interactions between neurotrophins is increasingly being recognized as essential for a complete understanding of their role in development and differentiation (Huang and Reichardt, 2003). Nowhere is it more apt to study neurotrophin interactions than in spiral ganglion neurons, a class of precisely arranged, relatively uniform cells expressing two types of high affinity Trk receptors that are exposed to apparently graded levels of BDNF and NT-3 depending on their cochlear location (Fritzsch et al., 1997; Schimmang et al., 2003; Sugawara et al., 2007). This organization suggests that the two specific neurotrophins contribute differentially to neuronal phenotype within the spiral ganglion.
Presynaptic and postsynaptic proteins are differentially distributed within the spiral ganglion
Previous studies have shown that although 95% of the neurons within the spiral ganglion are of one class, they display clear differences in their ion channel composition and resulting firing patterns (Mo and Davis, 1997; Adamson et al., 2002b; Reid et al., 2004; Zhou et al., 2005). Neurons that innervate high frequency sensory receptors at the basal end of the cochlea possess voltage-gated ion channel types that mediate abbreviated and rapidly accommodating responses to prolonged step depolarizations. Conversely, neurons that innervate low frequency sensory receptors at the apical end of the cochlea have lower densities of the same voltage-gated ion channels with the exception of a higher apparent density of A-type channels. In addition to showing overall prolongation and slowly accommodating responses to step depolarizations, this population of neurons also displays a significant amount of heterogeneity.
By considering a spiral ganglion neuron in its entirety, we determined that synaptic-related proteins targeted to either end of the cell were also regulated relative to innervation frequency, analogous to voltage-dependent ion channels (Table 1). The presynaptic proteins SNAP-25 and synaptophysin are relatively high in apical neurons when compared with basal spiral ganglion neurons, whereas the postsynaptic GluR2 and GluR3 AMPA receptor subunits have the opposite distribution. The overarching finding, therefore, is that many aspects of neuronal phenotype appear to be coordinated to ensure that the cellular machinery to receive, transmit, and deliver a signal is tonotopically organized.
Table 1.
Regulation and relative distribution of electrophysiologically relevant proteins
| Protein | Relative distribution |
Regulation |
||
|---|---|---|---|---|
| Apex | Base | NT-3 | BDNF | |
| GluR3 | + | +++ | ↓ | ↑ |
| GluR2 | + | ++ | ↓ | ↑ |
| BKa,b | + | +++ | ↓ | ↑ |
| Kv3.1a,b | + | +++ | ↓ | ↑ |
| Kv1.1a,b | + | +++ | — | ↑ |
| Kv4.2a,b | ++ | + | ↑ | — |
| SNAP-25 | ++ | + | ↑ | ↓ |
| Synaptophysin | +++ | + | ↑ | ↓ |
BK, Large-conductance Ca2+-activated K+ channel. Lowest (+) to highest (+++) relative antibody staining. ↓, Downregulation; ↑, upregulation; —, no change.
Auditory-specific specializations are not unexpected when considering the demands of conveying rapidly occurring sound signals into the brain (Gan and Kaczmarek, 1998; Oertel, 1999; Trussell, 1999), especially for the high frequency spiral ganglion neurons. The functional significance of a presumptive increase in AMPAR density in the postsynaptic membrane of basal spiral ganglion neurons may be compensatory; to counteract the greater density of voltage-gated ion channels that they possess and the resultant decrease in input resistance during depolarization. This could be critical for retaining the rapid membrane response of basal neurons to synaptic stimuli while increasing the probability of reaching threshold (Glowatzki and Fuchs, 2002; Fuchs et al., 2003).
The functional significance of the patterns of presynaptic protein levels in the spiral ganglion would, conversely, pertain to specializations formed with their synaptic partners in the cochlear nucleus. The morphology of the central processes of the spiral ganglion neurons have been well characterized and show distinct differences in branching and synapse size associated with innervation frequency and spontaneous rate (Cant, 1992; Ryugo, 1992). One type of synapse made by the spiral ganglion in the anterior ventral cochlear nucleus is the end bulb of Held, which mediates secure transmission for accurate sound localization (Ryugo, 1992; Oertel, 1999). Interestingly, the end bulb of Held synapses in the low frequency regions of the AVCN show larger and more elaborate synaptic specializations than synapses in the high frequency region (Rouiller et al., 1986), a feature that correlates with our observation that presynaptic proteins are selectively enriched in apical spiral ganglion neurons. Additional studies are necessary to determine whether levels of SNAP-25 and synaptophysin are increased exclusively for this purpose and whether the heterogeneity that we observe may be related to differences in the synaptic connections made for high and low spontaneous rate neurons (Sento and Ryugo, 1989).
Neurotrophins exert reciprocal regulatory effects on coordinated sets of electrophysiologically relevant proteins
Based on our previous observations of voltage-gated ion channels, we were not surprised to find that proteins enriched in basal spiral ganglion neurons were upregulated by BDNF, whereas proteins enriched in apical spiral ganglion neurons were upregulated by NT-3 (Table 1). These observations are significant in that they are consistent with the graded distributions of these neurotrophins in the postnatal and adult cochlea (higher expression levels of NT-3 in the apex, BDNF in the base; (Fritzsch et al., 1997; Schimmang et al., 2003; Sugawara et al., 2007) and again highlight the BDNF/NT-3 reciprocity that we originally described in earlier studies (Adamson et al., 2002a). Moreover, the results reported herein from synaptic cultures, which serve as a bioassay to show directly the effects of regional-specific differential neurotrophin gradients, further strengthen these findings. Whether the staining patterns that we observed are attributable to specific synaptic connections or to general release mechanisms will be explored in future experiments.
In addition to the generally opposing effects of BDNF and NT-3, it is important to appreciate that their actions include protein downregulation as well as upregulation when compared with the control conditions. For the presynaptic proteins SNAP-25 and synaptophysin, levels were increased by NT-3, but decreased by BDNF. Conversely, GluR2 and GluR3 AMPA receptor subunits, enriched in basal neurons, were upregulated by BDNF but downregulated by NT-3. This exemplifies the coordinated manner in which BDNF and NT-3 work together to adjust synaptic proteins to appropriate levels within each neuron depending on its position and ultimately its exposure to different neurotrophin concentrations. Another aspect of this reciprocal regulation is the apparent homogeneity in the neuronal population exposed to BDNF compared with the heterogeneity observed with NT-3. These differences have also been observed with previous electrophysiological analysis (Adamson et al., 2002b; Zhou et al., 2005); the functional significance, however, has yet to be explored directly.
Pursuant to these observations is the concept that relevant classes of proteins designed to perform coordinated yet different functions within a particular neuron are controlled as a unit. From the perspective of a single spiral ganglion neuron, a basal neuron for example, the higher concentrations of BDNF relative to NT-3 will orchestrate an increase in GluR2, GluR3, Kv1.1, Kv3.1, and BK α-subunits but lower levels of synaptophysin, SNAP-25, and Kv4.2 α-subunits. This entire set of electrophysiologically relevant proteins defines, in part, the phenotype of a neuron which appears to be exquisitely designed to carry out its specific function within the ganglion. Interestingly, experiments in which spiral ganglion neurons are combined with hair cell micro-isolates from different regions of the organ of Corti suggest that this elaborate control of the entire neuron can be initiated by ligand binding to the peripheral regions alone.
Complementary and/or antagonistic effects of neurotrophins have been found to regulate growth, survival, and synapse morphology in different classes of neurons, which could vary during development (McAllister et al., 1997; Mou et al., 1998; Giehl et al., 2001; Wang et al., 2003). Recent studies attributed some of these antagonistic effects to neurotrophin uptake and processing in differing regions of the cell (Heerssen and Segal, 2002; Wang et al., 2003). In contrast, the experiments reported here, along with previous reports from our laboratory (Adamson et al., 2002a,b; Zhou et al., 2005) are not consistent with differential localization of neurotrophin support, because both BDNF and NT-3 are located within the peripheral hair cell receptors and both types of cognate receptors are found in the neurons. Moreover, the effects have been reproduced from a single source in our cocultures. Therefore, our data support the idea that distinct intracellular signaling mechanisms via TrkB and TrkC high affinity receptors mediate the mirror image responses of BDNF and NT-3 in the spiral ganglion. These observations show how critical it is to understand better the underlying signaling cascades that mediate the responses from differentially activated Trk receptors (Chao, 2003; Huang and Reichardt, 2003; Arevalo et al., 2004).
Footnotes
This work was supported by National Institutes of Health Grant RO1 DC01856 (R.L.D.) and a Gates Millennium Scholarship (J.F.-O.). We thank Dr. Mark R. Plummer for discussions and critical reading of this manuscript. Expert technical support was provided by Yun Hsu.
References
- Adamson CL, Reid MA, Davis RL. Opposite actions of brain-derived neurotrophic factor and neurotrophin-3 on firing features and ion channel composition of murine spiral ganglion neurons. J Neurosci. 2002a;22:1385–1396. doi: 10.1523/JNEUROSCI.22-04-01385.2002. [DOI] [PMC free article] [PubMed] [Google Scholar]
- Adamson CL, Reid MA, Mo ZL, Bowne-English J, Davis RL. Firing features and potassium channel content of murine spiral ganglion neurons vary with cochlear location. J Comp Neurol. 2002b;447:331–350. doi: 10.1002/cne.10244. [DOI] [PubMed] [Google Scholar]
- Altschuler RA, Sheridan CE, Horn JW, Wenthold RJ. Immunocytochemical localization of glutamate immunoreactivity in the guinea pig cochlea. Hear Res. 1989;42:167–173. doi: 10.1016/0378-5955(89)90142-1. [DOI] [PubMed] [Google Scholar]
- Arevalo JC, Yano H, Teng KK, Chao MV. A unique pathway for sustained neurotrophin signaling through an ankyrin-rich membrane-spanning protein. EMBO J. 2004;23:2358–2368. doi: 10.1038/sj.emboj.7600253. [DOI] [PMC free article] [PubMed] [Google Scholar]
- Cant NB. The cochlear nucleus: neuronal types and their synaptic organization. In: Webster DB, Popper AN, Fay RR, editors. The mammalian auditory pathway: neuroanatomy. New York: Springer; 1992. pp. 66–116. [Google Scholar]
- Carr CE. Timing is everything: organization of timing circuits in auditory and electrical sensory systems. J Comp Neurol. 2004;472:131–133. doi: 10.1002/cne.20072. [DOI] [PMC free article] [PubMed] [Google Scholar]
- Chao MV. Neurotrophins and their receptors: a convergence point for many signalling pathways. Nat Rev Neurosci. 2003;4:299–309. doi: 10.1038/nrn1078. [DOI] [PubMed] [Google Scholar]
- Chen WC, Davis RL. Voltage-gated and two-pore-domain potassium channels in murine spiral ganglion neurons. Hear Res. 2006;222:89–99. doi: 10.1016/j.heares.2006.09.002. [DOI] [PubMed] [Google Scholar]
- Cohen-Cory S. The developing synapse: construction and modulation of synaptic structures and circuits. Science. 2002;298:770–776. doi: 10.1126/science.1075510. [DOI] [PubMed] [Google Scholar]
- Davis RL. Gradients of neurotrophins, ion channels, and tuning in the cochlea. The Neuroscientist. 2003;9:311–316. doi: 10.1177/1073858403251986. [DOI] [PubMed] [Google Scholar]
- Despres G, Romand R. Neurotrophins and the development of cochlear innervation. Life Sci. 1994;54:1291–1297. doi: 10.1016/0024-3205(94)00506-0. [DOI] [PubMed] [Google Scholar]
- Echteler SM. Developmental segregation in the afferent projections to mammalian auditory hair cells. Proc Natl Acad Sci USA. 1992;89:6324–6327. doi: 10.1073/pnas.89.14.6324. [DOI] [PMC free article] [PubMed] [Google Scholar]
- Ernfors P, Merlio J-P, Persson H. Cells expressing mRNA for neurotrophins and their receptors during embryonic rat development. Eur J Neurosci. 1992;4:1140–1158. doi: 10.1111/j.1460-9568.1992.tb00141.x. [DOI] [PubMed] [Google Scholar]
- Farinas I, Jones KR, Tessarollo L, Vigers AJ, Huang E, Kirstein M, de Caprona DC, Coppola V, Backus C, Reichardt LF, Fritzsch B. Spatial shaping of cochlear innervation by temporally regulated neurotrophin expression. J Neurosci. 2001;21:6170–6180. doi: 10.1523/JNEUROSCI.21-16-06170.2001. [DOI] [PMC free article] [PubMed] [Google Scholar]
- Fritzsch B, Farinas I, Reichardt LF. Lack of neurotrophin 3 causes losses of both classes of spiral ganglion neurons in the cochlea in a region-specific fashion. J Neurosci. 1997;17:6213–6225. doi: 10.1523/JNEUROSCI.17-16-06213.1997. [DOI] [PMC free article] [PubMed] [Google Scholar]
- Fuchs PA, Glowatzki E, Moser T. The afferent synapse of cochlear hair cells. Curr Opin Neurobiol. 2003;13:452–458. doi: 10.1016/s0959-4388(03)00098-9. [DOI] [PubMed] [Google Scholar]
- Gan L, Kaczmarek LK. When, where, and how much? Expression of the Kv3.1 potassium channel in high-frequency firing neurons. J Neurobiol. 1998;37:69–79. doi: 10.1002/(sici)1097-4695(199810)37:1<69::aid-neu6>3.0.co;2-6. [DOI] [PubMed] [Google Scholar]
- Giehl KM, Rohrig S, Bonatz H, Gutjahr M, Leiner B, Bartke I, Yan Q, Reichardt LF, Backus C, Welcher AA, Dethleffsen K, Mestres P, Meyer M. Endogenous brain-derived neurotrophic factor and neurotrophin-3 antagonistically regulate survival of axotomized corticospinal neurons in vivo. J Neurosci. 2001;21:3492–3502. doi: 10.1523/JNEUROSCI.21-10-03492.2001. [DOI] [PMC free article] [PubMed] [Google Scholar]
- Glowatzki E, Fuchs PA. Transmitter release at the hair cell ribbon synapse. Nat Neurosci. 2002;5:147–154. doi: 10.1038/nn796. [DOI] [PubMed] [Google Scholar]
- Graff L, Castrop F, Bauer M, Hofler H, Gratzl M. Expression of vesicular monoamine transporters, synaptosomal-associated protein 25 and syntaxin1: a signature of human small cell lung carcinoma. Cancer Res. 2001;61:2138–2144. [PubMed] [Google Scholar]
- Hallworth R, Luduena RF. Differential expression of beta tubulin isotypes in the adult gerbil cochlea. Hear Res. 2000;148:161–172. doi: 10.1016/s0378-5955(00)00149-0. [DOI] [PubMed] [Google Scholar]
- Heerssen HM, Segal RA. Location, location, location: a spatial view of neurotrophin signal transduction. Trends Neurosci. 2002;25:160–165. doi: 10.1016/s0166-2236(02)02144-6. [DOI] [PubMed] [Google Scholar]
- Hossain WA, Brumwell CL, Morest DK. Sequential interactions of fibroblast growth factor-2, brain-derived neurotrophic factor, neurotrophin-3, and their receptors define critical periods in the development of cochlear ganglion cells. Exp Neurol. 2002;175:138–151. doi: 10.1006/exnr.2002.7872. [DOI] [PubMed] [Google Scholar]
- Huang EJ, Reichardt LF. Neurotrophins: roles in neuronal development and function. Annu Rev Neurosci. 2001;24:677–736. doi: 10.1146/annurev.neuro.24.1.677. [DOI] [PMC free article] [PubMed] [Google Scholar]
- Huang EJ, Reichardt LF. Trk receptors: roles in neuronal signal transduction. Annu Rev Biochem. 2003;72:609–642. doi: 10.1146/annurev.biochem.72.121801.161629. [DOI] [PubMed] [Google Scholar]
- Khalifa SA, Friberg U, Illing RB, Rask-Andersen H. Synaptophysin immunohistochemistry in the human cochlea. Hear Res. 2003;185:35–42. doi: 10.1016/s0378-5955(03)00228-4. [DOI] [PubMed] [Google Scholar]
- Lee HK, Safieddine S, Petralia RS, Wenthold RJ. Identification of a novel SNAP25 interacting protein (SIP30) J Neurochem. 2002;81:1338–1347. doi: 10.1046/j.1471-4159.2002.00937.x. [DOI] [PubMed] [Google Scholar]
- Loranger SS, Linder ME. SNAP-25 traffics to the plasma membrane by a syntaxin-independent mechanism. J Biol Chem. 2002;277:34303–34309. doi: 10.1074/jbc.M202125200. [DOI] [PubMed] [Google Scholar]
- Lu B. Acute and long-term synaptic modulation by neurotrophins. Prog Brain Res. 2004;146:137–150. doi: 10.1016/s0079-6123(03)46010-x. [DOI] [PubMed] [Google Scholar]
- McAllister AK, Katz LC, Lo DC. Opposing roles for endogenous BDNF and NT-3 in regulating cortical dendritic growth. Neuron. 1997;18:767–778. doi: 10.1016/s0896-6273(00)80316-5. [DOI] [PubMed] [Google Scholar]
- Mo Z-L, Davis RL. Endogenous firing patterns of murine spiral ganglion neurons. J Neurophysiol. 1997;77:1294–1305. doi: 10.1152/jn.1997.77.3.1294. [DOI] [PubMed] [Google Scholar]
- Moga DE, Janssen WG, Vissavajjhala P, Czelusniak SM, Moran TM, Hof PR, Morrison JH. Glutamate receptor subunit 3 (GluR3) immunoreactivity delineates a subpopulation of parvalbumin-containing interneurons in the rat hippocampus. J Comp Neurol. 2003;462:15–28. doi: 10.1002/cne.10710. [DOI] [PubMed] [Google Scholar]
- Morris JL, Konig P, Shimizu T, Jobling P, Gibbins IL. Most peptide-containing sensory neurons lack proteins for exocytotic release and vesicular transport of glutamate. J Comp Neurol. 2005;483:1–16. doi: 10.1002/cne.20399. [DOI] [PubMed] [Google Scholar]
- Mou K, Hunsberger CL, Cleary JM, Davis RL. Synergistic effects of BDNF and NT-3 on postnatal spiral ganglion neurons. J Comp Neurol. 1997;386:529–539. [PubMed] [Google Scholar]
- Mou K, Adamson CL, Davis RL. Time-dependence and cell-type specificity of synergistic neurotrophin actions on spiral ganglion neurons. J Comp Neurol. 1998;402:129–139. [PubMed] [Google Scholar]
- Oertel D. The role of timing in the brain stem auditory nuclei of vertebrates. Annu Rev Physiol. 1999;61:497–519. doi: 10.1146/annurev.physiol.61.1.497. [DOI] [PubMed] [Google Scholar]
- Parks TN. The AMPA receptors of auditory neurons. Hear Res. 2000;147:77–91. doi: 10.1016/s0378-5955(00)00122-2. [DOI] [PubMed] [Google Scholar]
- Pirvola U, Ylikoski J, Palgi J, Lehtonen E, Arumae U, Saarma M. Brain-derived neurotrophic factor and neurotrophin 3 mRNAs in the peripheral target fields of developing inner ear ganglia. Proc Natl Acad Sci USA. 1992;89:9915–9919. doi: 10.1073/pnas.89.20.9915. [DOI] [PMC free article] [PubMed] [Google Scholar]
- Pirvola U, Arumae U, Moshnyakov M, Palgi J, Saarma M, Ylikoski J. Coordinated expression and function of neurotrophins and their receptors in the rat inner ear during target innervation. Hear Res. 1994;75:131–144. doi: 10.1016/0378-5955(94)90064-7. [DOI] [PubMed] [Google Scholar]
- Pirvola U, Hallbook F, Xing-Qun L, Virkkala J, Saarma M, Ylikoski J. Expression of neurotrophins and Trk receptors in the developing, adult, and regenerating avian cochlea. J Neurobiol. 1997;33:1019–1033. doi: 10.1002/(sici)1097-4695(199712)33:7<1019::aid-neu11>3.0.co;2-a. [DOI] [PubMed] [Google Scholar]
- Puyal J, Sage C, Dememes D, Dechesne CJ. Distribution of alpha-amino-3-hydroxy-5-methyl-4 isoazolepropionic acid and N-methyl-d-aspartate receptor subunits in the vestibular and spiral ganglia of the mouse during early development. Brain Res Dev Brain Res. 2002;139:51–57. doi: 10.1016/s0165-3806(02)00535-7. [DOI] [PubMed] [Google Scholar]
- Raphael Y, Altschuler RA. Structure and innervation of the cochlea. Brain Res Bull. 2003;60:397–422. doi: 10.1016/s0361-9230(03)00047-9. [DOI] [PubMed] [Google Scholar]
- Reichardt LF. Neurotrophin-regulated signalling pathways. Philos Trans R Soc Lond B Biol Sci. 2006;361:1545–1564. doi: 10.1098/rstb.2006.1894. [DOI] [PMC free article] [PubMed] [Google Scholar]
- Reid MA, Flores-Otero J, Davis RL. Firing patterns of type II spiral ganglion neurons in vitro. J Neurosci. 2004;24:733–742. doi: 10.1523/JNEUROSCI.3923-03.2004. [DOI] [PMC free article] [PubMed] [Google Scholar]
- Rouiller EM, Cronin-Schreiber R, Fekete DM, Ryugo DK. The central projections of intracellularly labeled auditory nerve fibers in cats: an analysis of terminal morphology. J Comp Neurol. 1986;249:261–278. doi: 10.1002/cne.902490210. [DOI] [PubMed] [Google Scholar]
- Rubel EW, Fritzsch B. Auditory system development: primary auditory neurons and their targets. Annu Rev Neurosci. 2002;25:51–101. doi: 10.1146/annurev.neuro.25.112701.142849. [DOI] [PubMed] [Google Scholar]
- Ryugo DK. The auditory nerve: peripheral innervation cell body morphology, and central projections. In: Webster DB, Popper AN, Fay RR, editors. The mammalian auditory pathway: neuroanatomy. New York: Springer; 1992. pp. 23–65. [Google Scholar]
- Safieddine S, Wenthold RJ. SNARE complex at the ribbon synapses of cochlear hair cells: analysis of synaptic vesicle- and synaptic membrane-associated proteins. Eur J Neurosci. 1999;11:803–812. doi: 10.1046/j.1460-9568.1999.00487.x. [DOI] [PubMed] [Google Scholar]
- Scalettar BA, Rosa P, Taverna E, Francolini M, Tsuboi T, Terakawa S, Koizumi S, Roder J, Jeromin A. Neuronal calcium sensor-1 binds to regulated secretory organelles and functions in basal and stimulated exocytosis in PC12 cells. J Cell Sci. 2002;115:2399–2412. doi: 10.1242/jcs.115.11.2399. [DOI] [PubMed] [Google Scholar]
- Schimmang T, Tan J, Muller M, Zimmermann U, Rohbock K, Kopschall I, Limberger A, Minichiello L, Knipper M. Lack of Bdnf and TrkB signalling in the postnatal cochlea leads to a spatial reshaping of innervation along the tonotopic axis and hearing loss. Development. 2003;130:4741–4750. doi: 10.1242/dev.00676. [DOI] [PubMed] [Google Scholar]
- Sento S, Ryugo DK. Endbulbs of held and spherical bushy cells in cats: morphological correlates with physiological properties. J Comp Neurol. 1989;280:553–562. doi: 10.1002/cne.902800406. [DOI] [PubMed] [Google Scholar]
- Shi S, Hayashi Y, Esteban JA, Malinow R. Subunit-specific rules governing AMPA receptor trafficking to synapses in hippocampal pyramidal neurons. Cell. 2001;105:331–343. doi: 10.1016/s0092-8674(01)00321-x. [DOI] [PubMed] [Google Scholar]
- Shi Y, Ethell IM. Integrins control dendritic spine plasticity in hippocampal neurons through NMDA receptor and Ca2+/calmodulin-dependent protein kinase II-mediated actin reorganization. J Neurosci. 2006;26:1813–1822. doi: 10.1523/JNEUROSCI.4091-05.2006. [DOI] [PMC free article] [PubMed] [Google Scholar]
- Sokolowski BH, Cunningham AM. Patterns of synaptophysin expression during development of the inner ear in the chick. J Neurobiol. 1999;38:46–64. doi: 10.1002/(sici)1097-4695(199901)38:1<46::aid-neu4>3.0.co;2-s. [DOI] [PubMed] [Google Scholar]
- Sugawara M, Murtie JC, Stankovic KM, Liberman MC, Corfas G. Dynamic patterns of neurotrophin 3 expression in the postnatal mouse inner ear. J Comp Neurol. 2007;501:30–37. doi: 10.1002/cne.21227. [DOI] [PubMed] [Google Scholar]
- Tafoya LC, Mameli M, Miyashita T, Guzowski JF, Valenzuela CF, Wilson MC. Expression and function of SNAP-25 as a universal SNARE component in GABAergic neurons. J Neurosci. 2006;26:7826–7838. doi: 10.1523/JNEUROSCI.1866-06.2006. [DOI] [PMC free article] [PubMed] [Google Scholar]
- Trussell LO. Synaptic mechanisms for coding timing in auditory neurons. Annu Rev Physiol. 1999;61:477–496. doi: 10.1146/annurev.physiol.61.1.477. [DOI] [PubMed] [Google Scholar]
- Vissavajjhala P, Janssen WG, Hu Y, Gazzaley AH, Moran T, Hof PR, Morrison JH. Synaptic distribution of the AMPA-GluR2 subunit and its colocalization with calcium-binding proteins in rat cerebral cortex: an immunohistochemical study using a GluR2-specific monoclonal antibody. Exp Neurol. 1996;142:296–312. doi: 10.1006/exnr.1996.0199. [DOI] [PubMed] [Google Scholar]
- Wang X, Butowt R, von Bartheld CS. Presynaptic neurotrophin-3 increases the number of tectal synapses, vesicle density, and number of docked vesicles in chick embryos. J Comp Neurol. 2003;458:62–77. doi: 10.1002/cne.10558. [DOI] [PubMed] [Google Scholar]
- Wenthold RJ, Yokotani N, Doi K, Wada K. Immunochemical characterization of the non-NMDA glutamate receptor using subunit-specific antibodies. Evidence for a hetero-oligomeric structure in rat brain. J Biol Chem. 1992;267:501–507. [PubMed] [Google Scholar]
- Wheeler TC, Chin LS, Li Y, Roudabush FL, Li L. Regulation of synaptophysin degradation by mammalian homologues of seven in absentia. J Biol Chem. 2002;277:10273–10282. doi: 10.1074/jbc.M107857200. [DOI] [PubMed] [Google Scholar]
- Zheng JL, Stewart RR, Gao WQ. Neurotrophin-4/5 enhances survival of cultured spiral ganglion neurons and protects them from cisplatin neurotoxicity. J Neurosci. 1995;15:5079–5087. doi: 10.1523/JNEUROSCI.15-07-05079.1995. [DOI] [PMC free article] [PubMed] [Google Scholar]
- Zhou Z, Liu Q, Davis RL. Complex regulation of spiral ganglion neuron firing patterns by neurotrophin-3. J Neurosci. 2005;25:7558–7566. doi: 10.1523/JNEUROSCI.1735-05.2005. [DOI] [PMC free article] [PubMed] [Google Scholar]