

Abstract
Merging the information from different senses is essential for successful interaction with real-life situations. Indeed, sensory integration can reduce perceptual ambiguity, speed reactions, or change the qualitative sensory experience. It is widely held that integration occurs at later processing stages and mostly in higher association cortices; however, recent studies suggest that sensory convergence can occur in primary sensory cortex. A good model for early convergence proved to be the auditory cortex, which can be modulated by visual and tactile stimulation; however, given the large number and small size of auditory fields, neither human imaging nor microelectrode recordings have systematically identified which fields are susceptible to multisensory influences. To reconcile findings from human imaging with anatomical knowledge from nonhuman primates, we exploited high-resolution imaging (functional magnetic resonance imaging) of the macaque monkey to study the modulation of auditory processing by visual stimulation. Using a functional parcellation of auditory cortex, we localized modulations to individual fields. Our results demonstrate that both primary (core) and nonprimary (belt) auditory fields can be activated by the mere presentation of visual scenes. Audiovisual convergence was restricted to caudal fields [prominently the core field (primary auditory cortex) and belt fields (caudomedial field, caudolateral field, and mediomedial field)] and continued in the auditory parabelt and the superior temporal sulcus. The same fields exhibited enhancement of auditory activation by visual stimulation and showed stronger enhancement for less effective stimuli, two characteristics of sensory integration. Together, these findings reveal multisensory modulation of auditory processing prominently in caudal fields but also at the lowest stages of auditory cortical processing.
Keywords: fMRI, macaque monkey, multisensory integration, cross-modal, perception, auditory cortex
Introduction
Under natural conditions, we commonly perceive our environment by integrating information from most of our senses. To accomplish this, our brain merges spatially overlapping representations from different sensory channels (Stein and Meredith, 1993). Classically, it is thought that neurons in sensory areas respond to stimulation in one modality only, whereas neurons in higher association areas prefer specific combinations of stimuli (Benevento et al., 1977; Hyvarinen and Shelepin, 1979; Bruce et al., 1981; Pandya and Yeterian, 1985). These association areas then send multisensory signals back to lower areas and (subcortical) regions involved in perception and in planning and executing actions (Stein et al., 1993). According to this hypothesis, sensory integration occurs only after unisensory information has been processed along its specific sensory hierarchy (Jones and Powell, 1970).
Recent studies differ from this view and suggest that multisensory processing already occurs in areas that are classically regarded as unisensory (Macaluso and Driver, 2005; Schroeder and Foxe, 2005; Ghazanfar and Schroeder, 2006). Of our senses, the auditory system is proving to be a particularly valuable model for studying sensory integration. Several studies demonstrated that visual stimulation alone activates auditory cortex (Calvert et al., 1997; Calvert and Campbell, 2003) and that visual stimuli enhance auditory activations (van Atteveldt et al., 2004; Pekkola et al., 2005; van Wassenhove et al., 2005; Lehmann et al., 2006; Martuzzi et al., 2006). In addition, similar effects have been observed for combinations of auditory and tactile stimulation (Foxe et al., 2002; Kayser et al., 2005; Murray et al., 2005) and as a result of multisensory attention (Jancke et al., 1999; Macaluso et al., 2000b).
Most of these findings were obtained by using imaging methods; however, given the intricate anatomical structure of auditory cortex, which consists of many small and proximal fields (Pandya, 1995; Kaas and Hackett, 2000; Hackett et al., 2001), most functional magnetic resonance imaging (fMRI) studies cannot localize multisensory processes to individual fields. In particular, human fMRI studies often lack the resolution required to disentangle, or cannot functionally localize, individual auditory fields. Other methods, which allow fine spatial localization of multisensory processing, are available in animal models. Electrophysiological studies revealed nonauditory modulations in several auditory fields of the macaque monkey, but they were restricted by the difficulty in sampling broad regions of cortex (Schroeder et al., 2001; Schroeder and Foxe, 2002; Fu et al., 2003, 2004; Werner-Reiss et al., 2003; Brosch et al., 2005; Ghazanfar et al., 2005). Anatomical studies, however, have good resolution and spatial coverage but cannot demonstrate whether a revealed connection is functionally important (Pandya and Yeterian, 1985; Hackett et al., 1998a; Rockland and Ojima, 2003). Altogether, this prohibits our efforts to understand the human imaging results pertaining to multisensory processing on the basis of detailed anatomical knowledge and electrophysiological results available in other primate species.
The present study was designed to bridge this gap by exploiting high-resolution fMRI of the macaque monkey and using a recently described technique (Petkov et al., 2006) to localize numerous fields in auditory cortex. Studying both the anesthetized and alert preparation, we observed visual activations and nonlinear enhancement of auditory activity specifically in caudal auditory fields.
Materials and Methods
This study presents data from fMRI experiments with macaque monkeys (Macaca mulatta). All procedures were approved by the local authorities (Regierungspräsidium) and are in full compliance with the guidelines of the European Community (EUVD 86/609/EEC) for the care and use of laboratory animals.
Animal preparation.
Data from anesthetized animals were obtained by using the following protocol. After premedication with glycopyrolate (0.01 mg/kg, i.m.) and ketamine (15 mg/kg, i.m.), an intravenous catheter was inserted into the saphenous vein. Anesthesia was induced with fentanyl (3 μg/kg), thiopental (5 mg/kg), and succinyl-choline chloride (3 mg/kg); the animal was intubated, and anesthesia was maintained with remifentanyl (0.5–2 μg · kg−1 · min−1). Muscle relaxation was induced with mivacurium chloride (5 mg · kg−1 · h−1). Physiological parameters (heart rate, blood pressure, body temperature, blood oxygenation, and expiratory CO2) were monitored and kept in the desired range. Intravascular volume was maintained by continuous administration of lactated Ringer's solution (10 ml · kg−1 · h−1) or injections of colloids (hydroxyethyl starch; 10–50 ml over 1–2 min as needed). Headphones (MR Confon, Magdeburg, Germany) for sound presentation were positioned over the ears and covered with foam (Tempur-Pedic, Lexington, KY) to attenuate outside sounds. The eyes were dilated with cyclopentolate, and contact lenses with the appropriate dioptic power were used to focus the visual stimulus. A super video graphics array fiber-optic system (Silent Vision; Avotec, Stuart, FL) for the presentation of visual stimuli was aligned with the fovea of each eye by means of a fundus camera.
Data from the behaving animal were obtained by using the following protocol. The animal was trained to complete trials of visual fixation in combination with minimal jaw and body movements. Training proceeded in a mock environment with operant conditioning procedures and juice rewards. Visual stimuli were presented through a super video graphics array fiber-optic system (Silent Vision; Avotec) that was aligned with each eye. Eye movements were measured with a custom-made optical infrared eye tracker attached to the fiber-optic system. Headphones (MR Confon) for sound presentation were positioned over the ears and covered with foam (Tempur-Pedic) to attenuate outside sounds.
Stimulus presentation.
Visual stimuli were movies stored as audio video interleave files and presented at 60 Hz and a resolution of 640 × 480 pixels, covering a field of view of 30 × 23°. The movies clips were taken from commercially available documentaries of animal wildlife and showed different animals in their natural settings, such as grassland and coppice. The effectiveness of the visual stimulation was verified by activity in the occipital lobe.
Auditory stimuli were stored as waveform audio format files, amplified with a Yamaha amplifier (AX-496), and delivered with MR-compatible headphones at an average intensity range of ∼85 dB sound pressure level (SPL). The sound presentation was calibrated with an MR-compatible condenser microphone [Brüel & Kjær (Stuttgart, Germany) 4188 and a 2238 Mediator sound level meter] to ensure a linear transfer function. The headphone cups together with the foam placed around them were measured to attenuate the scanner noise (peak intensity, 105 dB SPL) by ∼30 dB SPL. Importantly, with the sparse scanning sequences used, imaging data acquisition occurs for 1.5–2 s only every 10 s, leaving time for the presentation of sound stimuli in the absence of scanner noise. Sound stimuli consisted of natural sounds matching the movie clips. Synthesized noise and tone stimuli were used as localizer stimuli to delineate the different auditory cortical fields. Single-frequency tones and one-octave noise bursts of 50 ms duration were presented at a repetition rate of 8 Hz, with an interstimulus interval of 75 ms and peak intensities between 75 and 85 dB SPL. These sounds covered a range from 0.250 to 16 kHz in steps of one octave and were used to construct the functional parcellation of auditory cortex used for localizing many fields (see Fig. 2).
Figure 2.

Functional organization of auditory cortex: localizing auditory cortical fields. A, Schematic of auditory cortex, which can be separated into core (primary auditory cortex), belt, and parabelt regions, adapted from Hackett et al. (1998a). The preference for sound frequencies changes in the rostrocaudal direction and shows multiple reversals. In the orthogonal direction, the preference for sound bandwidth changes from core to belt. Abbreviations of the auditory cortical fields are shown (see below). B–D, The differential preferences for sound frequency and bandwidth can be used to obtain a functional parcellation of numerous auditory fields (for details, see Materials and Methods). Borders were delineated between regions with opposing frequency gradients at the point of mirror reversal and between regions selective to narrow or broadband sounds. B, First, the main frequency-selective regions are approximated by using low- and high-frequency sounds (500 Hz and 8 kHz), as shown by the activation map on the left (p values are color-coded on an anatomical image). Then, a more detailed frequency preference map was obtained by using multiple frequency bands (6 frequencies, equally spaced between 250 Hz and 16 kHz), as shown on the right. C, A gradient analysis (computed along the rostrocaudal direction) results in an alternating pattern of regions with progressively increasing or decreasing frequency selectivity and separates the regions with mirror reversed-frequency gradients. Based on the gradient analysis, borders can be delineated from the points at which the sign of the frequency gradient changes. The same gradient analysis is done for sound bandwidth (tone vs noise preference maps) along the mediolateral direction (right image). D, A functional parcellation of auditory cortex into 11 core and belt fields is obtained by combining bandwidth and frequency maps. As additional ROIs, the caudal and rostral parabelt (CPB and RPB) were defined; these extend rostrocaudally on the superior temporal plane and laterally on the superior temporal gyrus. RT, Rostrotemporal; AL, anterolateral; AM, anteromedial; RM, rostromedial; RTL, rostrotemporal-lateral; RTM, rostrotemporal-medial field.
Combined audiovisual stimuli were obtained by presenting the movie clip and corresponding sound simultaneously. Degraded stimuli were created based on three natural scenes by decreasing the signal-to-noise ratio in the auditory and visual domain (see Fig. 6 A). For the visual stimuli, random pixel noise was introduced as follows. For each frame of the movie, a random subset of 80% of the pixels was chosen uniformly across the frame, and the color values of these pixels were randomly permuted (i.e., the value of one of theses pixels was assigned to another of these pixels). For the auditory stimulus, pink noise (relative amplitude −10 dB relative to the average intensity of the sound clips) was added to the auditory waveform.
Figure 6.

Principle of inverse effectiveness: responses to degraded audiovisual stimuli. A, Examples from the original auditory and visual stimuli (left) and degraded versions of these (right). The degraded stimuli were obtained by adding noise to both the movie and sound. B, Activation strength for auditory and visual conditions, enhancement and fraction of voxels exhibiting significant nonlinear enhancement, separately for original and degraded stimuli (n = 6 experiments; data pooled from the caudal belt fields CM and CL). Visual activations are significantly reduced, demonstrating the reduced effectiveness of the degraded stimulus. In contrast, the activation enhancement is increased, as is the fraction of voxels exhibiting significant nonlinear enhancement, demonstrating stronger multisensory enhancement. Paired t test: *p < 0.05; ***p < 0.001.
Different stimulus paradigms were used for the anesthetized and behaving animals. For the former, stimuli were presented in a pseudorandom order, with each stimulus lasting 40 s. A 40 s baseline period flanked each stimulation period (see Fig. 1 B). During each stimulus or baseline period, four data volumes were acquired (≤2 s acquisition time; see below), and the scanner remained silent during the remaining time (≥ 8 s between successive volumes), allowing the presentation of auditory stimuli in the absence of scanner noise (Belin et al., 1999; Hall et al., 1999; Maeder et al., 2001; Jancke et al., 2002; van Atteveldt et al., 2004). At least 36 repeats of each condition were obtained per experiment.
Figure 1.
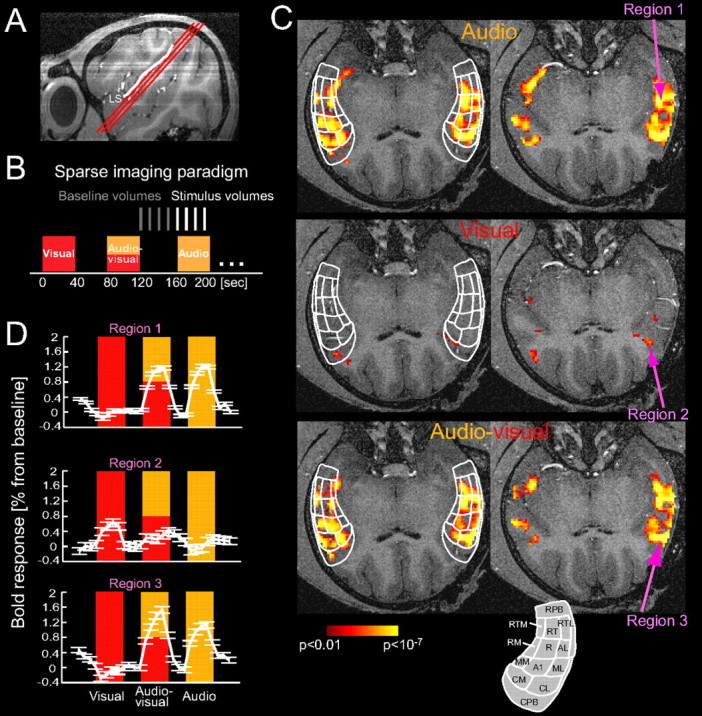
Example experiment with auditory, visual, and combined activations. A, Sagittal image showing the alignment of image slices with auditory cortex, which lies on the lower bank of the lateral sulcus (LS). B, Stimulus conditions (auditory only, visual only, and combined audiovisual) were randomly presented within a scanning block. Functional data were acquired with a sparse imaging sequence that allows auditory stimulation in the absence of the scanner noise (notice the 8 s silent gap between successive acquisition of the imaged volumes). C, Example data (two slices covering auditory cortex) from one session with an anesthetized animal. Individual panels display the activation maps (p values) superimposed on anatomical images. White outlines show the functional parcellation of auditory cortex into individual fields (for clarity, shown only on the left slice). The parcellation at the bottom indicates the names of individual fields (compare Fig. 2 for details). Arrows indicate locations for which the time course is shown in D. D, Time course of the BOLD signal change of three locations from C (mean, SEM from 36 repeats). Region 1 shows activations to auditory and audiovisual stimulation, whereas region 2 shows visual activations. Region 3 exhibits auditory activations that are enhanced during audiovisual stimulation (multisensory enhancement).
For the behaving animal, we relied on a trial-based paradigm (see above, Animal preparation). Across trials, auditory, visual, and audiovisual stimuli were presented in a pseudorandom order. During each experiment, at least 36 repeats of each condition were obtained. A trial began with a period of minimal body movement (4 s), after which the animal engaged a visual fixation point. During this fixation period, a baseline volume was acquired, followed by an 8 s stimulation interval, at the end of which a stimulus-related volume was acquired; hence, two volumes (one baseline and one stimulus) were acquired per trial. Data acquisition started only after the animal successfully engaged in the fixation and made only minimal body movements. Eye movements outside the fixation window (3° radius) or any body movements aborted the trial, and only correctly completed trials were analyzed.
Data collection.
Measurements with anesthetized animals were made on a vertical 4.7 T scanner equipped with a 40-cm-diameter bore (Biospec 47/40v; Bruker Medical, Ettlingen, Germany) and a 50 mT/m actively shielded gradient coil (B-GA 26; Bruker Medical) of 26 cm inner diameter. Measurements with the behaving animal were made on a vertical 7 T scanner equipped with a 60-cm-diameter bore (Biospec 7/60v; Bruker Medical) and an 80 mT/m actively shielded gradient coil (B-GA 38; Bruker Medical) of 38 cm inner diameter. During the experiment, the animal's head was positioned with a custom-made plastic head post (Tecapeek; Ensinger, Nufringen, Germany). Signals were acquired by placing surface coils over the auditory cortex of one hemisphere to maximize signal-to-noise and resolution over this area or by using whole-head volume coils. The image slices were oriented parallel to the lateral sulcus to capture auditory cortex within a small number of slices (see Fig. 1 A). In fact, in many experiments, auditory activations were essentially captured by two slices (see Fig. 1 C).
For the anesthetized animals, functional data were acquired with a multishot (four segments) gradient-recalled echo planar imaging sequence with typical parameters [echo time (TE), 20 ms; volume acquisition time (TA), 1.5 s; volume repetition time (TR), 10 s; flip angle, 30; spectral width, 100 kHz; on a grid of 128 × 128 voxels; 2 mm slice thickness; 9–12 slices]. The field of view was adjusted for each animal and was typically 6.4 × 6.4 cm for the surface coil and between 9.6 × 9.6 and 12.8 × 12.8 cm for the volume coil, resulting in voxel sizes of 0.5–2 mm3. Anatomical images (T1-weighted) were acquired with an eight-segment, three-dimensional, modified-driven equilibrium with Fourier transform pulse sequence with the following parameters: TE, 4 ms; TR, 22 ms; flip angle, 20; spectral width, 75 kHz; 384 × 384 voxels; and with five averages.
For the behaving animal, functional data were acquired with a multishot (two segments) gradient-recalled echo planar imaging sequence with typical parameters (TE, 9 ms; volume TA, 1.5 s; volume TR, 10 s; flip angle, 45; spectral width, 158 kHz; on a grid of 96 × 80 voxels; 2 mm slice thickness; 9–12 slices). The field of view was 9.6 × 8.0 cm. Anatomical images were acquired with a fast low-angle shot sequence with the following parameters: TE, 10 ms; TR, 750 ms; flip angle, 45; spectral width, 25 kHz; 192 × 160 voxels.
All anatomical images were acquired on the same field of view as the functional data, but they covered a larger extent in the z-direction. Hence, despite different absolute resolutions, functional and anatomical images were acquired in register, alleviating the problem of post hoc alignment. Although functional and anatomical data can show relative distortions at high fields, this was not a problem for us because we restricted our analysis to a region of interest (ROI) around the lateral and superior temporal sulcus. Within this region, optimal adjustment of parameters ensured a good register of functional and anatomical data. For each scan, an autoshim algorithm was used to optimize the linear and higher-order shim coils.
Data analysis.
In total, we scanned six different animals. One animal was used for the alert preparation experiments and was scanned on 7 different days (each day was a separate experiment). Five other animals were used for the anesthetized preparation experiments (two of these were scanned twice; the other animals were scanned once). The results pertaining to the alert animal (see Fig. 4) were obtained by statistically testing the seven experiments with this animal for the respective effects. The results pertaining to the anesthetized animals (see Fig. 3) were obtained by pooling all seven experiments from this preparation; hence, two animals contributed two experiments, and the remaining animals contributed one experiment each. This pooling of experiments seemed reasonable because the variability within animals was similar to the variability across animals.
Figure 4.

Activations and multisensory enhancement in the alert animal. A, Example data (two slices covering auditory cortex) from one session with the alert animal. Individual panels display the activation maps for each condition (p values) superimposed on an anatomical image. B, Schematic of core and belt fields showing the activation strength in individual conditions for all experiments with the alert animal (n = 7). Activations are quantified as the relative response (Fig. 3). The bottom right panel displays the percentage enhancement of signal change from auditory to audiovisual conditions. C, Fraction of responsive voxels within individual fields that showed significant nonlinear enhancement. In all panels, color-coding indicates the mean across experiments, and only fields with significant activation or enhancement are colored: t test across experiments; *p < 0.05; **p < 0.01; ***p < 0.001 or higher.
Figure 3.

Activations and multisensory enhancement. A, Schematic of core and belt fields summarizing the activation for all experiments with anesthetized animals (n = 7). Activations are quantified within each field as relative response (signal change for the respective condition as a fraction of the summed signal change across all three conditions). The bottom right panel displays the percentage enhancement of signal change from auditory to audiovisual conditions. B, Multisensory enhancement of individual voxels. Voxels exhibiting significant nonlinear enhancement of responses to combined audiovisual stimulation are shown color-coded on the same slices as used in Figure 1. The inset summarizes the fraction of sensory responsive voxels within individual fields that exhibited significant nonlinear enhancement. In all panels, color-coding indicates the mean across experiments, and only fields with significant activation or enhancement are colored: t test across experiments; *p < 0.05; **p < 0.01; ***p < 0.001 or higher.
As described above, some experiments used a surface coil (to maximize resolution over auditory cortex), whereas others used a volume coil (to increase coverage outside auditory cortex). As a result, we either quantified activations only in one hemisphere or pooled data from both hemispheres, so that each experiment contributed equally to the final statistics (e.g., for the ROI analysis, the activations in individual conditions were averaged between hemispheres).
Unimodal activations and multisensory enhancement.
The data were analyzed off-line in Matlab (Mathworks, Natick, MA). Multislice data (volumes) were converted into time points, linear drifts were removed, and the data were normalized to units of signal change compared with baseline. To quantify responses, the data were averaged across repeats of the same condition within each experiment (i.e., all repeats of the same condition were averaged). Functional maps were computed with a randomization procedure, taking into account both voxel value and spatial cluster extent (Nichols and Holmes, 2002; Hayasaka and Nichols, 2004). For each voxel, the activation in a given condition was computed as the summed signal change in a spatial neighborhood of 3 × 3 voxels in the same slice. The significance of this activation was derived from a distribution of values obtained after randomizing the time series of all voxels within the brain. Voxels reaching a significant activation (p < 0.05) in at least one condition were termed “sensory responsive voxels,” and the following analysis was restricted to this set of voxels.
The activation strength for individual conditions was quantified as the signal change of the blood oxygenation level-dependent (BOLD) response (see Fig. 1 D). The signal change was averaged across the sensory responsive voxels within each ROI (i.e., each auditory field). To compare the activation strength across experiments, we used a normalization procedure. To account for variations in the total activation across experiments, a relative response measure was obtained by dividing the signal change in individual conditions by the sum of the signal change of all three conditions. This relative response was then expressed in units of percent (see Figs. 3 A, 4 B). Such a relative response measure is advantageous, because the total responsiveness (hence, the average signal change) varies from experiment to experiment, both within and across animals. By normalizing for this difference, the relative response measure allows a more accurate quantification of the balance among auditory, visual, and combined activations.
Multisensory modulations were quantified with an ROI approach and at the level of individual voxels. First, an ROI analysis was conducted within individual auditory fields. The (un-normalized) signal change was computed for each ROI and condition as above. To detect enhancement (or suppression) of auditory activations (condition A) by a simultaneous visual stimulus (condition AV), the difference between the respective signal changes was quantified in units of percent: the contrast (AV − A)/A × 100 was computed for individual fields and compared with zero across experiments (see Figs. 3 A, 4 B).
Second, the enhancement of individual voxels was quantified by using a stringent criterion frequently used in imaging studies. This criterion assumes multisensory enhancement if the activation to the multisensory stimulus is larger than the sum of the activations for the two unisensory stimuli (Giard and Peronnet, 1999; Calvert, 2001; Calvert et al., 2001; Beauchamp, 2005; Kayser et al., 2005). The signal change in the audiovisual condition was compared with the sum of signal changes in auditory and visual conditions; a voxel was identified as significantly enhanced if the contrast [AV − (A + V)] was significantly positive. Statistically, this was implemented with the same randomization procedure as used above [i.e., the contrast AV − (A + V) was summed across neighboring voxels and its significance determined with a randomization procedure]. To detect multisensory enhancement, only voxels reaching a level of p < 0.01 were considered.
Analysis of response patterns.
As a complementary analysis to the activation strength, we compared the spatial pattern of activation among conditions (Haxby et al., 2001; Cox and Savoy, 2003; Haynes and Rees, 2006). For each experiment, the set of sensory responsive voxels was determined on the basis of the responses to all three conditions (see above). Then, for each condition the activation pattern was defined as the vector containing the signal change (for this condition) of all sensory responsive voxels within an ROI (here defined by one or several auditory fields). Because this set of voxels is the same for each condition, all three vectors have the same length. To compare the similarity of the activation pattern within and across conditions, we used a split-dataset approach, similar to that of Haxby et al. (2001): the dataset for each condition was split into even and odd runs, and the activation pattern was computed across each half. The similarity within a condition was computed as the Pearson correlation coefficient of the pattern obtained from even and odd runs, whereas the similarity across conditions was obtained by correlating both patterns from both conditions with each other (and averaging all four combinations). If the activation pattern differs between two conditions, then the similarity within a condition should be higher compared with the similarity across conditions; hence, comparing the difference between the two similarity values with zero is a sensitive measure for changes in the activation pattern among conditions. In the present case, we used this approach to test whether an additional visual stimulus alters the auditory activation pattern in different ROIs along the rostrocaudal axis (see Fig. 5). For each region, the similarity within the auditory condition was compared with the similarity between auditory and audiovisual conditions.
Figure 5.

Dissimilarity of auditory and audiovisual response patterns. The similarity of the BOLD response pattern between auditory and audiovisual conditions was quantified within individual fields. For each experiment, the data for auditory and audiovisual conditions were split in half, and the similarity (correlation) was computed within and across conditions (the top left inset shows the similarity values for the caudal parabelt for individual experiments. A/A, Similarity within auditory; A/AV, similarity between auditory and audiovisual conditions. This analysis was done separately for each field, and the results were averaged for fields with similar rostrocaudal positions (see color code). The main graph (large boxes) shows the difference between the similarity within auditory conditions minus the similarity of auditory to audiovisual response patterns (boxes indicate the median and 25th and 75th percentile; lines indicate the full data range; data from all 14 experiments). The small boxes display the same result for a control in which the 15% most active voxels were omitted from each condition. Wilcoxon rank-sum test: **p < 0.01; ***p < 0.0001).
A dissimilarity of activation patterns either can reflect a difference in spatial pattern or can be the result of a simple scaling of activity for certain conditions and voxels. We used two strategies to rule out the possibility that simple differences in activation strength are the main cause of the dissimilarity of auditory and audiovisual activation patterns. First, if the most active voxels dominate the dissimilarity, then the activation patterns should become more similar when those voxels are omitted. Thus, we replicated the same analysis while skipping 15% of the most active voxels [as was done by Haxby et al. (2001)]. The set of the 15% most active voxels was defined as follows. For each condition, those 15% voxels with the strongest activation were identified and removed from all conditions; then the set of “sensory responsive voxels” was recalculated for each experiment; and, finally, the activation pattern was then defined based on this reduced set of sensory responsive voxels. This analysis resulted in the same rostrocaudal pattern as the previous analysis, ruling out a dominance of the strongly active voxels (see Fig. 5, small boxes). Second, instead of using the Pearson correlation coefficient, which is sensitive to both the sign and magnitude of the difference between individual pairs of numbers, to compare activation patterns, we used the Spearman-rank correlation, which considers only the sign. The pattern similarity analysis based on the Spearman-rank correlation also confirmed the results reported in Figure 5.
Functional parcellation of auditory cortex and ROIs.
The primate auditory cortex consists of a number of functional fields that can be distinguished on the basis of their anatomical and functional properties (Pandya, 1995; Kosaki et al., 1997; Rauschecker, 1998; Kaas and Hackett, 2000; Hackett et al., 2001; Hackett, 2002). Three auditory fields [labeled primary auditory cortex (A1), rostral field (R), and rostrotemporal field] receive strong input from the ventral division of the medial geniculate nucleus and are considered to be primary auditory cortex (see Fig. 2 A, the core). The remaining regions receive projections from the core (and also from the thalamus), are regarded as auditory association cortex, and are separated into belt and parabelt fields. Many of these fields can be distinguished on the basis of their cytoarchitecture. In addition, these fields can be functionally distinguished on the basis of their response selectivity to sounds of different frequency content, bandwidth, and temporal envelope (Merzenich and Brugge, 1973; Rauschecker et al., 1995; Kosaki et al., 1997; Recanzone et al., 2000; Tian and Rauschecker, 2004). Importantly, the selectivity to sound frequency and bandwidth is topographically organized, and many fields contain ordered maps representing different sound frequencies along the rostrocaudal axis (see Fig. 2 A). A functional parcellation of auditory cortex can be obtained by using extensive electrophysiological mappings (Kosaki et al., 1997; Rauschecker et al., 1997; Recanzone et al., 1999) and also by using fMRI–BOLD measurements, as shown by recent studies (Wessinger et al., 1997, 2001; Formisano et al., 2003; Talavage et al., 2004; Petkov et al., 2006).
Different auditory fields were defined on the basis of their response preferences to sound frequency and bandwidth. The preference for sound frequencies changes in the rostrocaudal direction and shows multiple reversals. For example, the caudal portion of A1 prefers high frequencies, and its rostral portion prefers low frequencies. Similarly, the preference for sound bandwidth changes from core to belt: the former prefers narrow bandwidth sounds, and the latter prefers broadband sounds (Merzenich and Brugge, 1973; Rauschecker et al., 1995; Recanzone et al., 2000). These differential preferences for sound frequency and bandwidth were used to obtain a functional parcellation of auditory cortex; for details see Petkov et al. (2006). In short, sounds of different frequencies (250 Hz to 16 kHz) and bandwidth (single-frequency tones and one-octave band-pass noise) were used to establish a frequency preference map in which each voxel was assigned the frequency causing the strongest response (see Fig. 2 B). Based on a smoothed version of this, a frequency gradient map is computed, the reversals of which define borders between neighboring regions. Figure 2 C shows the sign of this frequency gradient map. In an analogous way, a bandwidth preference map is computed, the gradient of which defines regions preferring narrow and broadband sounds. Based on a combination of these, a full parcellation of auditory cortex into 11 fields is obtained (3 core and 8 belt fields). Such a functional division of auditory cortex was derived for each animal in the present study.
These functional ROIs were extended by adding two other regions of the auditory cortex that surround the belt, the so-called “parabelt.” The caudal parabelt was defined as the region on the temporal plane caudal and lateral to the caudal belt, including the area known as the temporal-parietal area (Leinonen et al., 1980; Preuss and Goldman-Rakic, 1991). The rostral parabelt was defined as the region rostral to the belt and lateral to the rostral belt, including the area known as Ts2 (Pandya and Sanides, 1973; Hackett et al., 1998a). In addition to the parabelt, we also analyzed a region from the middle of the upper bank of the superior temporal sulcus, corresponding to the multisensory area rostral polysensory area in the superior temporal sulcus (TPOr) (Seltzer et al., 1996; Padberg et al., 2003); this region was defined as the middle half of the upper bank of the sulcus. The exact extent of these anatomically defined areas cannot currently be obtained from functional activations; hence, the areas localized from the anatomical scans by using landmarks described by previous histological studies might not fully cover the respective area in each individual animal.
Results
Unimodal and multisensory activations in auditory cortex
Images of the BOLD response were acquired during stimulation with naturalistic auditory only, visual only, and combined audiovisual stimulation. The data acquisition proceeded by using a sparse imaging sequence that allows the presentation of auditory stimuli in the absence of scanner noise (Fig. 1 B). To obtain high-resolution images of the auditory cortex, we positioned the image slices parallel to the lateral sulcus (Fig. 1 A), the lower bank of which is covered by auditory cortex.
Figure 1 C displays activation maps obtained from one experiment with an anesthetized animal. Auditory stimulation led to activity throughout auditory cortex. The activated voxels were distributed in both rostrocaudal and mediolateral directions. This broad strip of activity is in agreement with neurophysiological findings that neurons in both primary and hierarchically higher auditory areas respond to natural and complex sounds (Rauschecker et al., 1995; Kosaki et al., 1997; Poremba et al., 2004; Rauschecker and Tian, 2004). A time-course example of a region (region 1) responding well to auditory (but not to visual) stimulation is shown in Figure 1 D. Visual stimulation alone, however, also led to activity in some parts of auditory cortex. In the example, a few clusters of voxels occurred in auditory cortex, and these were located mostly at its caudal end (region 2). Combining auditory and visual stimulation led to robust responses throughout auditory cortex, and in some regions (region 3) this led to an enhancement of the response compared with the auditory-alone condition. The localization of regions showing such enhancement of activation was the goal of the present study. To determine which parts of auditory cortex were modulated by the visual stimulus, we localized individual auditory fields for each animal, as described next.
The primate auditory cortex consists of a number of fields that are defined on the basis of their anatomical and functional properties (Pandya, 1995; Rauschecker, 1998; Hackett et al., 2001). Functionally, several auditory fields can be distinguished on the basis of a topographical pattern of response selectivity to sounds of different frequency and bandwidth (Merzenich and Brugge, 1973; Rauschecker et al., 1995; Kosaki et al., 1997; Recanzone et al., 2000; Tian and Rauschecker, 2004). For example, many fields contain ordered maps representing different sound frequencies along the rostrocaudal axis (Fig. 2 A). For the present study, we used sounds of varying frequency and bandwidth to functionally segregate core and belt fields, as well as anatomical constraints to add ROIs in the parabelt (Fig. 2 C,D) [for details, see Materials and Methods and Petkov et al. (2006)]. For the example experiment in Figure 1 C, we indicated the parcellation of auditory cortex on the left slice (Fig. 1 C, white outlines). In a series of separate experiments, we obtained a functional parcellation of auditory cortex for each animal participating in the present study.
Audiovisual activations in individual auditory fields in core and belt
Using an ROI analysis, with individual core and belt fields as ROIs, we quantified the activation to auditory, visual, and combined audiovisual stimulation (Fig. 3 A). Across experiments with anesthetized animals (five animals; seven experiments), we found significant auditory activation in each of the 11 fields (Fig. 3 A) (p values are indicated), which demonstrated the effectiveness of the natural auditory sounds in driving both primary and higher auditory areas. Interestingly, activations to just visual stimulation were significant as well: both caudal belt fields [caudomedial (CM) and caudolateral (CL)] exhibited weak but significant activations (7.3 ± 3.1 and 3.0 ± 1.4% of the total response; mean and SEM across experiments; t test; p < 0.05 in both fields). This demonstrates that some auditory fields can be activated by visual simulation alone and reveals regions in auditory cortex with an overlap of visual and auditory representations. Such convergence of sensory information is a necessary first step for the integration of multisensory information (Stein and Meredith, 1993; Calvert, 2001).
In addition to convergence, a second characteristic of sensory integration is a modulation of activity induced by one sense in conjunction with stimulation of another sense. Figure 3 A (top right panel) shows the activation to combined audiovisual stimulation, which on average was stronger compared with the auditory-only condition (57 ± 8.7 compared with 33 ± 10.3% of the total response; mean and SD across all fields). To quantify this systematically, we computed the enhancement of audiovisual compared with auditory activations in units of percent (Fig. 3 A, bottom right panel). Across experiments, significant enhancement was found in three caudal fields: the belt fields, CL and mediomedial (MM), as well as the primary field, A1 (38 ± 10, 46 ± 16, and 40 ± 15% enhancement, respectively). Although theoretically possible, no field showed a significant suppression. These findings demonstrate that caudal auditory fields are susceptible to both activation and enhancement by a visual stimulus.
The analysis of enhancement at the level of ROIs might be problematic, because the total enhancement is pooled across all voxels within the ROI and hence might depend on the number of ROIs (Laurienti et al., 2005). Indeed, across all ROIs, including those with nonsignificant enhancement, the enhancement effect was anti-correlated to the number of voxels (r = −0.47; p = 0.13). This suggests that the quantitative effect at the ROI level might indeed depend on the size of the ROI. As a result, the numbers of the enhancement as such have to be treated with caution, but the consistency across experiments demonstrates that the caudal fields indeed show an enhanced response during combined multisensory stimulation.
To investigate multisensory enhancement at a fine spatial resolution, i.e., at the level of individual voxels, we tested individual voxels for supralinear enhancement. This criterion of nonlinear facilitation of responses is frequently used in imaging studies and has been derived from criteria used in electrophysiological experiments (Stein and Meredith, 1993; Calvert, 2001; Beauchamp, 2005; Kayser et al., 2005). It requires that the activation to the combined audiovisual stimulus must be larger than the sum of the activations to the two unisensory stimuli. Figure 3 B shows the enhancement map for the example experiment from Figure 1 C. Clearly, several groups of voxels clustered along the lateral and caudal edge of auditory cortex exhibit supralinear response facilitation. A systematic analysis across experiments revealed that three caudal belt fields contain a significant fraction of nonlinearly enhanced voxels (fields CM, CL, and MM; 2.4 ± 1.1, 0.8 ± 0.3, and 4.8 ± 2.1%, respectively, of the sensory responsive voxels within these fields). In individual experiments, like the one shown Figure 3 B, other fields could contain voxels with significant enhancement, but these were not consistent across experiments. Together, these results demonstrate that several, but mostly caudal, auditory fields are susceptible to both activation and modulation by a visual stimulus and hence display characteristics of sensory integration.
Audiovisual activations in the alert animal
The above experiments investigated data obtained from the anesthetized preparation. Experiments with anesthetized animals are advantageous because they allow us to acquire data more quickly. In addition, cognitive and modulatory feedback from higher association regions to lower sensory areas is eliminated as a result of anesthesia; in particular, attention effects are absent in the anesthetized preparation. Results obtained from anesthetized animals, however, might not generalize to real-life situations in a straightforward manner. In experiments with one alert animal, we confirmed our findings from the anesthetized preparation and found that visual stimuli enhance auditory activations in the caudal belt as well as in primary fields.
Figure 4 A shows activation maps obtained from the alert animal in one experiment. Here, auditory and audiovisual activations covered a broad region along the rostrocaudal axis, and visual activations were strongest at the caudal end of auditory cortex. Comparable results were obtained in a total of seven experiments with this animal. Figure 4 B summarizes the data for individual fields. Both auditory and audiovisual activations were significant in all fields (Fig. 4, p values). Significant activations to visual stimulation occurred in several caudal fields in the belt (fields CL, CM, and MM; 10.8 ± 3.2, 19.2 ± 4.1, and 18.6 ± 4.8%, respectively, of the total response; mean and SEM across experiments), in one rostral belt field (rostromedial; 10.3 ± 4.0%), and in primary auditory cortex (fields A1 and R; 10.4 ± 2.7 and 6.1 ± 2.3%). This confirms the overlap of visual and auditory activation seen in the anesthetized preparation and demonstrates that visual activations can also occur in primary auditory cortex (the auditory core).
Enhancement of auditory activation by a simultaneous visual stimulus was seen in several fields. By using an ROI-based analysis, significant enhancement was found in both the belt and primary auditory cortex (Fig. 4 B, bottom right panel) (fields CL, CM, and A1; 27.2 ± 13.8, 52.1 ± 24.3, and 205 ± 54% enhancement, respectively). At the level of individual voxels, many fields consistently exhibited voxels with significant nonlinear enhancement (Fig. 4 C) (with values ranging from 6.8 to 29% of all active voxels in the belt, and from 10.7 to 12.9% in the core). These findings unequivocally demonstrate that a visual stimulus can significantly enhance auditory activations in the belt as well as in primary auditory cortex.
Both the alert and anesthetized preparation exhibit similar patterns of audiovisual enhancement. In both cases, the influence of the visual stimulus was most pronounced in the caudal part of auditory cortex, yet visual activations encompassed a larger number of fields in the alert animal and were quantitatively stronger in this preparation (two-sample t test pooling fields with significant visual activation in both preparations; p < 0.01). In addition, the fraction of voxels with significant enhancement was larger in the alert animal as well (p < 0.01). This suggests that multisensory audiovisual enhancement is more pronounced in the alert animal but does not depend on the conscious state of the animal.
Visual influences in the parabelt and superior temporal sulcus
Extending the above analysis, we quantified the effect of visual stimulation on auditory activation in the parabelt. For this analysis, we pooled alert and anesthetized preparations because they exhibited qualitatively similar effects. Across experiments, we found highly significant visual activation in the caudal parabelt (19.1 ± 3.9% of the total response; p < 0.001) and weaker visual activation in the rostral parabelt (6.8 ± 2.5% of the total response; p < 0.05). Similarly, the fraction of voxels exhibiting significant nonlinear enhancement was larger in the caudal compared with the rostral parabelt (15.1 ± 3.6 and 10.7 ± 4.9% of all active voxels; p < 0.001 and p < 0.05). This demonstrates that visual activations and audiovisual enhancement affect the entire parabelt but are more pronounced in its caudal part.
In the multisensory area TPO, which lies on the upper bank of the superior temporal sulcus, visual activations were considerably stronger compared with auditory cortex (42 ± 5.3% of the total response; p < 10−6). The fraction of voxels showing significant nonlinear enhancement reached similar levels as in auditory cortex (11.5 ± 3.5% of all active voxels; p < 0.01). These results show that audiovisual activations extend outside auditory cortex and confirm the expectation that the overlap of auditory and visual representations is larger in regions of the brain that are known to be multisensory, such as in the upper bank of the superior temporal sulcus.
Visual influences on auditory activation patterns
Imaging studies commonly use changes of BOLD signal amplitude or activity time course to localize and quantify multisensory integration (Calvert, 2001; Martuzzi et al., 2006). These quantities are usually sampled at individual voxels or averaged across ROIs, yet in many cases sensory integration might be a spatially distributed process that changes large-scale activation patterns more than the signal amplitude of individual voxels (Laurienti et al., 2005). In this case, one could expect a change in the spatial pattern of the BOLD response that might not be accompanied by a significant alternation of the signal change at individual voxels. We used a method to quantify differences in activity patterns to asses whether a visual stimulus affects the pattern of auditory responses in auditory cortex (Haxby et al., 2001; Cox and Savoy, 2003; Haynes and Rees, 2006).
Activation patterns of a group of voxels can be compared across conditions. Using a split-dataset approach, we compared the similarity of the BOLD activation pattern between auditory only and audiovisual stimulation (Fig. 5): The (spatial) cross-correlation of the BOLD response was computed for two patterns of auditory activation and pairs of auditory and audiovisual activation, yielding one similarity value for auditory patterns and one for auditory versus audiovisual patterns. The difference between these similarity values is shown in Figure 5 (large boxes), pooled across all experiments with anesthetized and alert animals (n = 14). This difference along the rostrocaudal axis demonstrates that the effect of a visual stimulus is restricted to the caudal parabelt, the caudal belt, and fields A1, MM, and mediolateral (ML) (Wilcoxon sign-rank tests; p < 0.001 and p < 0.01, respectively). For more rostral fields, the pattern of activation is indistinguishable between auditory only and audiovisual stimulation.
It seems unlikely that the differences in activation patterns between auditory and audiovisual conditions are only the result of a difference in activation strength between these conditions. To substantiate this quantitatively, we used two controls (see Materials and Methods). First, we omitted those voxels with the strongest response from the activation pattern [as has been done previously (Haxby et al., 2001)]. This yielded the same result as obtained with all voxels (Fig. 5, small boxes). Second, we used a metric for comparison that is sensitive only to the sign of a difference between pairs of voxels but not the magnitude (Spearman-rank correlation instead of Pearson correlation). The result was again similar to that displayed in Figure 5 [median values for the caudal parabelt (CM, CL) and (ML, A1, MM): 0.12, 0.05, and 0.07; p < 0.001, p < 0.05, and p < 0.01, respectively; other regions were not significantly different]. This analysis demonstrates that the visual stimulus alters the auditory activation pattern not only by scaling the signal amplitude of individual voxels; instead, the visual stimulus introduces a spatially distinct pattern in the auditory response. Hence, these findings extend the results from the analysis of activation strength and demonstrate that the visual stimulus alters activation patterns in the caudal half of the auditory cortex, where the visual influences are strongest.
The principle of inverse effectiveness
A prime function of integrating information across senses is to improve our perception of the environment. Hence, the benefit of multisensory processing should be strongest when unisensory stimuli are least effective. For example, our perception of speech profits mostly from simultaneous visual cues when the auditory signal is corrupted by background noise (Sumby and Polack, 1954). Reflecting this, sensory integration at the neuronal level exhibits what is known as the principle of inverse effectiveness (Stein and Meredith, 1993); i.e., the effect of integration is highest when both unisensory stimuli are minimally effective. In a separate set of experiments (n = 6; three scans of the alert animal and three scans of two anesthetized animals), we used degraded audiovisual stimuli to show that the observed enhancement in auditory cortex follows the principle of inverse effectiveness (Fig. 6). The auditory and visual stimuli were degraded by adding noise, and their activity was compared with that for the response to the original stimuli within the caudal belt fields, which were previously shown to be most prone to audiovisual enhancement.
The reduced effectiveness of degraded stimuli is demonstrated by a reduction of visual activation (20.4 ± 2.6 vs 11.8 ± 2.3% of the total response for the original and degraded stimulus; t test; p < 0.001) and an insignificant change of auditory activation strength (36.0 ± 3.4 vs 37.5 ± 4.1% of the total response; p = 0.69). Indeed, degraded stimuli led to stronger enhancement of audiovisual activation in the ROI (57 ± 22 vs 91 ± 19% enhancement; p < 0.05) as well as an increased fraction of voxels showing significant nonlinear enhancement (15.1 ± 3.1 vs 28.1 ± 6.4% of the sensory responsive voxels in this region; p < 0.05). This demonstrates that degraded audiovisual stimuli were less effective in driving auditory cortex but caused stronger multisensory enhancement, hence obeying the principle of inverse effectiveness.
Discussion
Our results demonstrate that the processing of sound in auditory cortex can be modulated by visual stimulation. This is consistent with previous human imaging studies that used both audiovisual speech and artificial stimuli (Giard and Peronnet, 1999; Molholm et al., 2002; Olson et al., 2002; Calvert and Campbell, 2003; Laurienti, 2004; Ojanen et al., 2005; Pekkola et al., 2005; Teder-Salejarvi et al., 2005; van Wassenhove et al., 2005). Although many studies could not localize the multisensory interactions to particular auditory fields, some attributed these to primary (Calvert et al., 1997; Lehmann et al., 2006; Martuzzi et al., 2006) or caudal regions (van Atteveldt et al., 2004; Lehmann et al., 2006).
Our results support and clarify that work, and we can now relate the human imaging work to the detailed anatomical and electrophysiological knowledge available from the monkey. Anatomically, many auditory fields are thought to be homologous in humans and monkeys (Hackett et al., 2001), yet human imaging studies often have difficulties in functionally distinguishing auditory fields (Wessinger et al., 1997; Formisano et al., 2003). One notable reason for this could be the use of group averaging and anatomical landmark-based techniques to localize activations (Desai et al., 2005), especially given the intersubject variability with regard to the exact position of functional areas within the brain (Rademacher et al., 1993; Van Essen and Drury, 1997). As a result, the human imaging literature provides good insight into multisensory integration in various behavioral paradigms, but often cannot faithfully localize effects to particular fields. Here we combined high-resolution imaging with a functional approach to localize auditory fields and demonstrate that audiovisual integration is strongest in the caudal belt and parabelt but can extend into primary auditory cortex, especially in the alert animal. This suggests the interesting possibility that some of the described influences in auditory cortex could be cognitive in nature, whereas others are independent of cognitive or attentional mechanisms.
Function of early multisensory convergence
One possibility is that multisensory enhancement reflects enhanced sensory processing resulting from focused attention. Both sensory integration and attention serve to enhance perception by increasing the sensitivity to particular sensory events. Hence, it is likely that attentional and multisensory processes are mediated by similar mechanisms. Indeed, imaging studies demonstrated that focused attention to one modality can enhance the processing and activity of colocalized stimuli in another modality (Driver and Spence, 1998; Macaluso et al., 2000a,b; Weissman et al., 2004), can suppress activity in the unattended system (Johnson and Zatorre, 2005), and can interact with multisensory enhancement (Talsma et al., 2006).
There are several reasons, however, why we believe that attention is not the only source of visual modulation of auditory cortex. In the present study, we found similar audiovisual enhancement in alert and anesthetized animals. In the alert animal, which was performing a fixation task, we cannot be sure about the balance of attention between visual and auditory stimuli. Neither can we exclude small eye movement or position effects, although the task aimed to control for these (Werner-Reiss et al., 2003; Fu et al., 2004). For the anesthetized preparation, however, anesthesia reduces activity in association areas more than activity in sensory regions and prevents cognitive and attentive mechanisms (Heinke and Schwarzbauer, 2001). Hence, the results from the anesthetized preparation cannot be explained by attentional modulation. Because the findings from both preparations were in good agreement, we conclude that the existence of audiovisual integration in auditory cortex does not depend on the animal's conscious state.
It may well be that the largely feed-forward multisensory interactions, as present in the anesthetized preparation, are further enhanced by attentive or other cognitive mechanisms. Indeed, at the quantitative level, we found a number of differences between both preparations. The alert animal showed stronger, purely visual activations, more voxels with nonlinear enhancement, and stronger effects within primary auditory cortex. It is unclear whether these differences are caused only by the effects of anesthesia on the hemodynamic response or whether they have a different source. Previous studies, for example, identified attention, expectation, learned associations, or eye movements as possible mediators of multisensory influences in auditory cortex (Werner-Reiss et al., 2003; Fu et al., 2004; Brosch et al., 2005; Tanabe et al., 2005; Baier et al., 2006; Talsma et al., 2006).
With regard to multisensory integration within the caudal auditory cortex, an additional hypothesis can be formulated: multisensory convergence could improve the spatial localization of external events. The caudal auditory areas are supposedly involved in spatial localization, belonging to an auditory “where” processing stream (Rauschecker and Tian, 2000; Zatorre et al., 2002), and could help to bring auditory and visual information into register. The finding that multisensory enhancement occurs prominently in caudal fields supports this hypothesis (Schroeder and Foxe, 2005); however, this does not rule out additional influences of multisensory object processing (Amedi et al., 2005) or the integration of face–voice information, which has been observed in electrophysiological studies (Ghazanfar et al., 2005).
Pathways of multisensory enhancement of auditory cortex
The anatomical knowledge available for the monkey brain can suggest pathways of visual influence on early processing in auditory cortex. The visual signals could directly come from the thalamus. Several multisensory nuclei such as the suprageniculate, the limitans, and the posterior nuclei, and also the medial pulvinar, have been shown to project to the auditory belt and parabelt areas (Fitzpatrick and Imig, 1978; Morel and Kaas, 1992; Pandya et al., 1994; Hackett et al., 1998b; de la Mothe et al., 2006) [also see Budinger et al. (2006) for a study in the gerbil]. All of these structures are responsive to visual stimulation. In addition, recent studies revealed that supposedly unisensory thalamic nuclei can modulate each other via the thalamic reticular nucleus (Crabtree et al., 1998; Crabtree and Isaac, 2002). It is likely that such subcortical exchange of multisensory information occurs between visual and auditory modalities, yet this hypothesis has not been tested.
Another source of visual input to auditory cortex could be direct projections from other early sensory areas. Projections from auditory to visual cortex have been demonstrated in the macaque monkey (Falchier et al., 2002; Rockland and Ojima, 2003). Although the reverse direction has not been reported in this species, it has been shown that the primary auditory cortex of the gerbil receives projections from secondary visual areas (Budinger et al., 2006).
Last, feedback projections from higher association areas could mediate visual modulations. Particularly, auditory cortex projects to various regions in the frontal lobe, such as the frontal eye fields and the principal sulcus, which could send reciprocal connections to auditory fields (Romanski et al., 1999a,b). The same argument also applies to areas in the intraparietal sulcus (Lewis and Van Essen, 2000a,b). Similarly, auditory cortex has strong interconnectivity with visual and multisensory areas in the superior temporal sulcus (Hackett et al., 1998a; Cappe and Barone, 2005), which project back to auditory cortex (Barnes and Pandya, 1992). This suggests many different pathways, of both the feed-forward and feed-back type, that could mediate the visual modulation of auditory processing.
The neuronal basis of integration in auditory cortex
There is abundant evidence for multisensory convergence in auditory cortex from measurements of the fMRI–BOLD response. Because the BOLD signal indirectly reflects changes in neuronal activity, similar observations should be possible at the level of neuronal activity (Logothetis et al., 2001); however, because the BOLD signal arises from a population of neurons, it is not easy to predict the responses of individual neurons on the basis of imaging data. It might be that multisensory influences are mostly a subthreshold phenomenon with little effect on the firing rates of individual neurons or with an effect on only a few of them. In this case, they might easily be missed by studies focusing on single neurons. Indeed, only a few studies have reported multisensory modulations at the level of individual neurons (Fu et al., 2003; Brosch et al., 2005); yet if multisensory influences are subthreshold processes and most prominent at the level of synaptic activity or somatic potentials, they should be detectable in local field potentials, which represent exactly this form of neuronal activity (Mitzdorf, 1985, 1987). As a matter of fact, recent studies have demonstrated audiovisual enhancement at the level of local field potentials (Ghazanfar et al., 2005) and current source densities (Schroeder and Foxe, 2002). Given the prominent link between the BOLD signal and local field potentials, this might explain why multisensory influences are often detected in imaging but not in electrophysiological studies (Logothetis et al., 2001); however, it could also be that multisensory responses are more prevalent at the single neuron level than previously thought and only partly visible in the fMRI–BOLD responses because of a spatial pooling of different neuronal populations (Laurienti et al., 2005). Further electrophysiological studies are needed to finally resolve the question of whether multisensory influences on auditory cortex are a subthreshold phenomenon, existing only at the population level, or whether individual auditory neurons are able to fuse multisensory information. The present results can guide future studies by revealing caudal auditory fields as a promising area for future work.
Footnotes
This work was supported by the Max Planck Society, the German Research Foundation (KA 2661/1), and the Alexander von Humboldt Foundation.
References
- Amedi A, von Kriegstein K, van Atteveldt NM, Beauchamp MS, Naumer MJ. Functional imaging of human crossmodal identification and object recognition. Exp Brain Res. 2005;166:559–571. doi: 10.1007/s00221-005-2396-5. [DOI] [PubMed] [Google Scholar]
- Baier B, Kleinschmidt A, Muller NG. Cross-modal processing in early visual and auditory cortices depends on expected statistical relationship of multisensory information. J Neurosci. 2006;26:12260–12265. doi: 10.1523/JNEUROSCI.1457-06.2006. [DOI] [PMC free article] [PubMed] [Google Scholar]
- Barnes CL, Pandya DN. Efferent cortical connections of multimodal cortex of the superior temporal sulcus in the rhesus monkey. J Comp Neurol. 1992;318:222–244. doi: 10.1002/cne.903180207. [DOI] [PubMed] [Google Scholar]
- Beauchamp MS. Statistical criteria in FMRI studies of multisensory integration. Neuroinformatics. 2005;3:93–114. doi: 10.1385/NI:3:2:093. [DOI] [PMC free article] [PubMed] [Google Scholar]
- Belin P, Zatorre RJ, Hoge R, Evans AC, Pike B. Event-related fMRI of the auditory cortex. NeuroImage. 1999;10:417–429. doi: 10.1006/nimg.1999.0480. [DOI] [PubMed] [Google Scholar]
- Benevento LA, Fallon J, Davis BJ, Rezak M. Auditory–visual interaction in single cells in the cortex of the superior temporal sulcus and the orbital frontal cortex of the macaque monkey. Exp Neurol. 1977;57:849–872. doi: 10.1016/0014-4886(77)90112-1. [DOI] [PubMed] [Google Scholar]
- Brosch M, Selezneva E, Scheich H. Nonauditory events of a behavioral procedure activate auditory cortex of highly trained monkeys. J Neurosci. 2005;25:6797–6806. doi: 10.1523/JNEUROSCI.1571-05.2005. [DOI] [PMC free article] [PubMed] [Google Scholar]
- Bruce C, Desimone R, Gross CG. Visual properties of neurons in a polysensory area in superior temporal sulcus of the macaque. J Neurophysiol. 1981;46:369–384. doi: 10.1152/jn.1981.46.2.369. [DOI] [PubMed] [Google Scholar]
- Budinger E, Heil P, Hess A, Scheich H. Multisensory processing via early cortical stages: connections of the primary auditory cortical field with other sensory systems. Neuroscience. 2006;143:1065–1083. doi: 10.1016/j.neuroscience.2006.08.035. [DOI] [PubMed] [Google Scholar]
- Calvert GA. Crossmodal processing in the human brain: insights from functional neuroimaging studies. Cereb Cortex. 2001;11:1110–1123. doi: 10.1093/cercor/11.12.1110. [DOI] [PubMed] [Google Scholar]
- Calvert GA, Campbell R. Reading speech from still and moving faces: the neural substrates of visible speech. J Cogn Neurosci. 2003;15:57–70. doi: 10.1162/089892903321107828. [DOI] [PubMed] [Google Scholar]
- Calvert GA, Bullmore ET, Brammer MJ, Campbell R, Williams SC, McGuire PK, Woodruff PW, Iversen SD, David AS. Activation of auditory cortex during silent lipreading. Science. 1997;276:593–596. doi: 10.1126/science.276.5312.593. [DOI] [PubMed] [Google Scholar]
- Calvert GA, Hansen PC, Iversen SD, Brammer MJ. Detection of audio-visual integration sites in humans by application of electrophysiological criteria to the BOLD effect. NeuroImage. 2001;14:427–438. doi: 10.1006/nimg.2001.0812. [DOI] [PubMed] [Google Scholar]
- Cappe C, Barone P. Heteromodal connections supporting multisensory integration at low levels of cortical processing in the monkey. Eur J Neurosci. 2005;22:2886–2902. doi: 10.1111/j.1460-9568.2005.04462.x. [DOI] [PubMed] [Google Scholar]
- Cox DD, Savoy RL. Functional magnetic resonance imaging (fMRI) “brain reading”: detecting and classifying distributed patterns of fMRI activity in human visual cortex. NeuroImage. 2003;19:261–270. doi: 10.1016/s1053-8119(03)00049-1. [DOI] [PubMed] [Google Scholar]
- Crabtree JW, Isaac JT. New intrathalamic pathways allowing modality-related and cross-modality switching in the dorsal thalamus. J Neurosci. 2002;22:8754–8761. doi: 10.1523/JNEUROSCI.22-19-08754.2002. [DOI] [PMC free article] [PubMed] [Google Scholar]
- Crabtree JW, Collingridge GL, Isaac JT. A new intrathalamic pathway linking modality-related nuclei in the dorsal thalamus. Nat Neurosci. 1998;1:389–394. doi: 10.1038/1603. [DOI] [PubMed] [Google Scholar]
- de la Mothe LA, Blumell S, Kajikawa Y, Hackett TA. Thalamic connections of the auditory cortex in marmoset monkeys: core and medial belt regions. J Comp Neurol. 2006;496:72–96. doi: 10.1002/cne.20924. [DOI] [PMC free article] [PubMed] [Google Scholar]
- Desai R, Liebenthal E, Possing ET, Waldron E, Binder JR. Volumetric vs. surface-based alignment for localization of auditory cortex activation. NeuroImage. 2005;26:1019–1029. doi: 10.1016/j.neuroimage.2005.03.024. [DOI] [PubMed] [Google Scholar]
- Driver J, Spence C. Crossmodal attention. Curr Opin Neurobiol. 1998;8:245–253. doi: 10.1016/s0959-4388(98)80147-5. [DOI] [PubMed] [Google Scholar]
- Falchier A, Clavagnier S, Barone P, Kennedy H. Anatomical evidence of multimodal integration in primate striate cortex. J Neurosci. 2002;22:5749–5759. doi: 10.1523/JNEUROSCI.22-13-05749.2002. [DOI] [PMC free article] [PubMed] [Google Scholar]
- Fitzpatrick KA, Imig TJ. Projections of auditory cortex upon the thalamus and midbrain in the owl monkey. J Comp Neurol. 1978;177:555–575. doi: 10.1002/cne.901770402. [DOI] [PubMed] [Google Scholar]
- Formisano E, Kim DS, Di Salle F, van de Moortele PF, Ugurbil K, Goebel R. Mirror-symmetric tonotopic maps in human primary auditory cortex. Neuron. 2003;40:859–869. doi: 10.1016/s0896-6273(03)00669-x. [DOI] [PubMed] [Google Scholar]
- Foxe JJ, Wylie GR, Martinez A, Schroeder CE, Javitt DC, Guilfoyle D, Ritter W, Murray MM. Auditory-somatosensory multisensory processing in auditory association cortex: an fMRI study. J Neurophysiol. 2002;88:540–543. doi: 10.1152/jn.2002.88.1.540. [DOI] [PubMed] [Google Scholar]
- Fu KM, Johnston TA, Shah AS, Arnold L, Smiley J, Hackett TA, Garraghty PE, Schroeder CE. Auditory cortical neurons respond to somatosensory stimulation. J Neurosci. 2003;23:7510–7515. doi: 10.1523/JNEUROSCI.23-20-07510.2003. [DOI] [PMC free article] [PubMed] [Google Scholar]
- Fu KM, Shah AS, O'Connell MN, McGinnis T, Eckholdt H, Lakatos P, Smiley J, Schroeder CE. Timing and laminar profile of eye-position effects on auditory responses in primate auditory cortex. J Neurophysiol. 2004;92:3522–3531. doi: 10.1152/jn.01228.2003. [DOI] [PubMed] [Google Scholar]
- Ghazanfar AA, Schroeder CE. Is neocortex essentially multisensory? Trends Cogn Sci. 2006;10:278–285. doi: 10.1016/j.tics.2006.04.008. [DOI] [PubMed] [Google Scholar]
- Ghazanfar AA, Maier JX, Hoffman KL, Logothetis NK. Multisensory integration of dynamic faces and voices in rhesus monkey auditory cortex. J Neurosci. 2005;25:5004–5012. doi: 10.1523/JNEUROSCI.0799-05.2005. [DOI] [PMC free article] [PubMed] [Google Scholar]
- Giard MH, Peronnet F. Auditory-visual integration during multimodal object recognition in humans: a behavioral and electrophysiological study. J Cogn Neurosci. 1999;11:473–490. doi: 10.1162/089892999563544. [DOI] [PubMed] [Google Scholar]
- Hackett TA. The comparative anatomy of the primate auditory cortex. In: Ghazanfar AA, editor. Primate audition: behavior and neurobiology. Boca Raton, FL: CRC; 2002. pp. 199–226. [Google Scholar]
- Hackett TA, Stepniewska I, Kaas JH. Subdivisions of auditory cortex and ipsilateral cortical connections of the parabelt auditory cortex in macaque monkeys. J Comp Neurol. 1998a;394:475–495. doi: 10.1002/(sici)1096-9861(19980518)394:4<475::aid-cne6>3.0.co;2-z. [DOI] [PubMed] [Google Scholar]
- Hackett TA, Stepniewska I, Kaas JH. Thalamocortical connections of the parabelt auditory cortex in macaque monkeys. J Comp Neurol. 1998b;400:271–286. doi: 10.1002/(sici)1096-9861(19981019)400:2<271::aid-cne8>3.0.co;2-6. [DOI] [PubMed] [Google Scholar]
- Hackett TA, Preuss TM, Kaas JH. Architectonic identification of the core region in auditory cortex of macaques, chimpanzees, and humans. J Comp Neurol. 2001;441:197–222. doi: 10.1002/cne.1407. [DOI] [PubMed] [Google Scholar]
- Hall DA, Haggard MP, Akeroyd MA, Palmer AR, Summerfield AQ, Elliott MR, Gurney EM, Bowtell RW. “Sparse” temporal sampling in auditory fMRI. Hum Brain Mapp. 1999;7:213–223. doi: 10.1002/(SICI)1097-0193(1999)7:3<213::AID-HBM5>3.0.CO;2-N. [DOI] [PMC free article] [PubMed] [Google Scholar]
- Haxby JV, Gobbini MI, Furey ML, Ishai A, Schouten JL, Pietrini P. Distributed and overlapping representations of faces and objects in ventral temporal cortex. Science. 2001;293:2425–2430. doi: 10.1126/science.1063736. [DOI] [PubMed] [Google Scholar]
- Hayasaka S, Nichols TE. Combining voxel intensity and cluster extent with permutation test framework. NeuroImage. 2004;23:54–63. doi: 10.1016/j.neuroimage.2004.04.035. [DOI] [PubMed] [Google Scholar]
- Haynes JD, Rees G. Decoding mental states from brain activity in humans. Nat Rev Neurosci. 2006;7:523–534. doi: 10.1038/nrn1931. [DOI] [PubMed] [Google Scholar]
- Heinke W, Schwarzbauer C. Subanesthetic isoflurane affects task-induced brain activation in a highly specific manner: a functional magnetic resonance imaging study. Anesthesiology. 2001;94:973–981. doi: 10.1097/00000542-200106000-00010. [DOI] [PubMed] [Google Scholar]
- Hyvarinen J, Shelepin Y. Distribution of visual and somatic functions in the parietal associative area 7 of the monkey. Brain Res. 1979;169:561–564. doi: 10.1016/0006-8993(79)90404-9. [DOI] [PubMed] [Google Scholar]
- Jancke L, Mirzazade S, Shah NJ. Attention modulates activity in the primary and the secondary auditory cortex: a functional magnetic resonance imaging study in human subjects. Neurosci Lett. 1999;266:125–128. doi: 10.1016/s0304-3940(99)00288-8. [DOI] [PubMed] [Google Scholar]
- Jancke L, Wustenberg T, Scheich H, Heinze HJ. Phonetic perception and the temporal cortex. NeuroImage. 2002;15:733–746. doi: 10.1006/nimg.2001.1027. [DOI] [PubMed] [Google Scholar]
- Johnson JA, Zatorre RJ. Attention to simultaneous unrelated auditory and visual events: behavioral and neural correlates. Cereb Cortex. 2005;15:1609–1620. doi: 10.1093/cercor/bhi039. [DOI] [PubMed] [Google Scholar]
- Jones EG, Powell TP. An anatomical study of converging sensory pathways within the cerebral cortex of the monkey. Brain. 1970;93:793–820. doi: 10.1093/brain/93.4.793. [DOI] [PubMed] [Google Scholar]
- Kaas JH, Hackett TA. Subdivisions of auditory cortex and processing streams in primates. Proc Natl Acad Sci USA. 2000;97:11793–11799. doi: 10.1073/pnas.97.22.11793. [DOI] [PMC free article] [PubMed] [Google Scholar]
- Kayser C, Petkov CI, Augath M, Logothetis NK. Integration of touch and sound in auditory cortex. Neuron. 2005;48:373–384. doi: 10.1016/j.neuron.2005.09.018. [DOI] [PubMed] [Google Scholar]
- Kosaki H, Hashikawa T, He J, Jones EG. Tonotopic organization of auditory cortical fields delineated by parvalbumin immunoreactivity in macaque monkeys. J Comp Neurol. 1997;386:304–316. [PubMed] [Google Scholar]
- Laurienti PJ. Deactivations, global signal, and the default mode of brain function. J Cogn Neurosci. 2004;16:1481–1483. doi: 10.1162/0898929042568596. [DOI] [PubMed] [Google Scholar]
- Laurienti PJ, Perrault TJ, Stanford TR, Wallace MT, Stein BE. On the use of superadditivity as a metric for characterizing multisensory integration in functional neuroimaging studies. Exp Brain Res. 2005;166:289–297. doi: 10.1007/s00221-005-2370-2. [DOI] [PubMed] [Google Scholar]
- Lehmann C, Herdener M, Esposito F, Hubl D, di Salle F, Scheffler K, Bach DR, Federspiel A, Kretz R, Dierks T, Seifritz E. Differential patterns of multisensory interactions in core and belt areas of human auditory cortex. NeuroImage. 2006;31:294–300. doi: 10.1016/j.neuroimage.2005.12.038. [DOI] [PubMed] [Google Scholar]
- Leinonen L, Hyvarinen J, Sovijarvi AR. Functional properties of neurons in the temporo-parietal association cortex of awake monkey. Exp Brain Res. 1980;39:203–215. doi: 10.1007/BF00237551. [DOI] [PubMed] [Google Scholar]
- Lewis JW, Van Essen DC. Mapping of architectonic subdivisions in the macaque monkey, with emphasis on parieto-occipital cortex. J Comp Neurol. 2000a;428:79–111. doi: 10.1002/1096-9861(20001204)428:1<79::aid-cne7>3.0.co;2-q. [DOI] [PubMed] [Google Scholar]
- Lewis JW, Van Essen DC. Corticocortical connections of visual, sensorimotor, and multimodal processing areas in the parietal lobe of the macaque monkey. J Comp Neurol. 2000b;428:112–137. doi: 10.1002/1096-9861(20001204)428:1<112::aid-cne8>3.0.co;2-9. [DOI] [PubMed] [Google Scholar]
- Logothetis NK, Pauls J, Augath M, Trinath T, Oeltermann A. Neurophysiological investigation of the basis of the fMRI signal. Nature. 2001;412:150–157. doi: 10.1038/35084005. [DOI] [PubMed] [Google Scholar]
- Macaluso E, Driver J. Multisensory spatial interactions: a window onto functional integration in the human brain. Trends Neurosci. 2005;28:264–271. doi: 10.1016/j.tins.2005.03.008. [DOI] [PubMed] [Google Scholar]
- Macaluso E, Frith CD, Driver J. Modulation of human visual cortex by crossmodal spatial attention. Science. 2000a;289:1206–1208. doi: 10.1126/science.289.5482.1206. [DOI] [PubMed] [Google Scholar]
- Macaluso E, Frith C, Driver J. Selective spatial attention in vision and touch: unimodal and multimodal mechanisms revealed by PET. J Neurophysiol. 2000b;83:3062–3075. doi: 10.1152/jn.2000.83.5.3062. [DOI] [PubMed] [Google Scholar]
- Maeder PP, Meuli RA, Adriani M, Bellmann A, Fornari E, Thiran JP, Pittet A, Clarke S. Distinct pathways involved in sound recognition and localization: a human fMRI study. NeuroImage. 2001;14:802–816. doi: 10.1006/nimg.2001.0888. [DOI] [PubMed] [Google Scholar]
- Martuzzi R, Murray MM, Michel CM, Thiran JP, Maeder PP, Clarke S, Meuli RA. Multisensory interactions within human primary cortices revealed by BOLD dynamics. Cereb Cortex. 2007 doi: 10.1093/cercor/bhl077. in press. [DOI] [PubMed] [Google Scholar]
- Merzenich MM, Brugge JF. Representation of the cochlear partition of the superior temporal plane of the macaque monkey. Brain Res. 1973;50:275–296. doi: 10.1016/0006-8993(73)90731-2. [DOI] [PubMed] [Google Scholar]
- Mitzdorf U. Current source-density method and application in cat cerebral cortex: investigation of evoked potentials and EEG phenomena. Physiol Rev. 1985;65:37–100. doi: 10.1152/physrev.1985.65.1.37. [DOI] [PubMed] [Google Scholar]
- Mitzdorf U. Properties of the evoked potential generators: current source-density analysis of visually evoked potentials in the cat cortex. Int J Neurosci. 1987;33:33–59. doi: 10.3109/00207458708985928. [DOI] [PubMed] [Google Scholar]
- Molholm S, Ritter W, Murray MM, Javitt DC, Schroeder CE, Foxe JJ. Multisensory auditory-visual interactions during early sensory processing in humans: a high-density electrical mapping study. Brain Res Cogn Brain Res. 2002;14:115–128. doi: 10.1016/s0926-6410(02)00066-6. [DOI] [PubMed] [Google Scholar]
- Morel A, Kaas JH. Subdivisions and connections of auditory cortex in owl monkeys. J Comp Neurol. 1992;318:27–63. doi: 10.1002/cne.903180104. [DOI] [PubMed] [Google Scholar]
- Murray MM, Molholm S, Michel CM, Heslenfeld DJ, Ritter W, Javitt DC, Schroeder CE, Foxe JJ. Grabbing your ear: rapid auditory-somatosensory multisensory interactions in low-level sensory cortices are not constrained by stimulus alignment. Cereb Cortex. 2005;15:963–974. doi: 10.1093/cercor/bhh197. [DOI] [PubMed] [Google Scholar]
- Nichols TE, Holmes AP. Nonparametric permutation tests for functional neuroimaging: a primer with examples. Hum Brain Mapp. 2002;15:1–25. doi: 10.1002/hbm.1058. [DOI] [PMC free article] [PubMed] [Google Scholar]
- Ojanen V, Mottonen R, Pekkola J, Jaaskelainen IP, Joensuu R, Autti T, Sams M. Processing of audiovisual speech in Broca's area. NeuroImage. 2005;25:333–338. doi: 10.1016/j.neuroimage.2004.12.001. [DOI] [PubMed] [Google Scholar]
- Olson IR, Gatenby JC, Gore JC. A comparison of bound and unbound audio-visual information processing in the human cerebral cortex. Brain Res Cogn Brain Res. 2002;14:129–138. doi: 10.1016/s0926-6410(02)00067-8. [DOI] [PubMed] [Google Scholar]
- Padberg J, Seltzer B, Cusick CG. Architectonics and cortical connections of the upper bank of the superior temporal sulcus in the rhesus monkey: an analysis in the tangential plane. J Comp Neurol. 2003;467:418–434. doi: 10.1002/cne.10932. [DOI] [PubMed] [Google Scholar]
- Pandya DN. Anatomy of the auditory cortex. Rev Neurol (Paris) 1995;151:486–494. [PubMed] [Google Scholar]
- Pandya DN, Sanides F. Architectonic parcellation of the temporal operculum in rhesus monkey and its projection pattern. Z Anat Entwicklungsgesch. 1973;139:127–161. doi: 10.1007/BF00523634. [DOI] [PubMed] [Google Scholar]
- Pandya DN, Yeterian EH. Architecture and connections of cortical association areas. In: Peters A, Jones EG, editors. Cerebral cortex: association and auditory cortices. New York: Plenum; 1985. pp. 3–61. [Google Scholar]
- Pandya DN, Rosene DL, Doolittle AM. Corticothalamic connections of auditory-related areas of the temporal lobe in the rhesus monkey. J Comp Neurol. 1994;345:447–471. doi: 10.1002/cne.903450311. [DOI] [PubMed] [Google Scholar]
- Pekkola J, Ojanen V, Autti T, Jaaskelainen IP, Mottonen R, Tarkiainen A, Sams M. Primary auditory cortex activation by visual speech: an fMRI study at 3 T. NeuroReport. 2005;16:125–128. doi: 10.1097/00001756-200502080-00010. [DOI] [PubMed] [Google Scholar]
- Petkov CI, Kayser C, Augath M, Logothetis NK. Functional imaging reveals numerous fields in the monkey auditory cortex. PLoS Biol. 2006;4:e215. doi: 10.1371/journal.pbio.0040215. [DOI] [PMC free article] [PubMed] [Google Scholar]
- Poremba A, Malloy M, Saunders RC, Carson RE, Herscovitch P, Mishkin M. Species-specific calls evoke asymmetric activity in the monkey's temporal poles. Nature. 2004;427:448–451. doi: 10.1038/nature02268. [DOI] [PubMed] [Google Scholar]
- Preuss TM, Goldman-Rakic PS. Architectonics of the parietal and temporal association cortex in the strepsirhine primate Galago compared to the anthropoid primate Macaca. J Comp Neurol. 1991;310:475–506. doi: 10.1002/cne.903100403. [DOI] [PubMed] [Google Scholar]
- Rademacher J, Caviness VS, Jr, Steinmetz H, Galaburda AM. Topographical variation of the human primary cortices: implications for neuroimaging, brain mapping, and neurobiology. Cereb Cortex. 1993;3:313–329. doi: 10.1093/cercor/3.4.313. [DOI] [PubMed] [Google Scholar]
- Rauschecker JP. Parallel processing in the auditory cortex of primates. Audiol Neurootol. 1998;3:86–103. doi: 10.1159/000013784. [DOI] [PubMed] [Google Scholar]
- Rauschecker JP, Tian B. Mechanisms and streams for processing of what and where in auditory cortex. Proc Natl Acad Sci USA. 2000;97:11800–11806. doi: 10.1073/pnas.97.22.11800. [DOI] [PMC free article] [PubMed] [Google Scholar]
- Rauschecker JP, Tian B. Processing of band-passed noise in the lateral auditory belt cortex of the rhesus monkey. J Neurophysiol. 2004;91:2578–2589. doi: 10.1152/jn.00834.2003. [DOI] [PubMed] [Google Scholar]
- Rauschecker JP, Tian B, Hauser M. Processing of complex sounds in the macaque nonprimary auditory cortex. Science. 1995;268:111–114. doi: 10.1126/science.7701330. [DOI] [PubMed] [Google Scholar]
- Rauschecker JP, Tian B, Pons T, Mishkin M. Serial and parallel processing in rhesus monkey auditory cortex. J Comp Neurol. 1997;382:89–103. [PubMed] [Google Scholar]
- Recanzone GH, Schreiner CE, Sutter ML, Beitel RE, Merzenich MM. Functional organization of spectral receptive fields in the primary auditory cortex of the owl monkey. J Comp Neurol. 1999;415:460–481. doi: 10.1002/(sici)1096-9861(19991227)415:4<460::aid-cne4>3.0.co;2-f. [DOI] [PubMed] [Google Scholar]
- Recanzone GH, Guard DC, Phan ML. Frequency and intensity response properties of single neurons in the auditory cortex of the behaving macaque monkey. J Neurophysiol. 2000;83:2315–2331. doi: 10.1152/jn.2000.83.4.2315. [DOI] [PubMed] [Google Scholar]
- Rockland KS, Ojima H. Multisensory convergence in calcarine visual areas in macaque monkey. Int J Psychophysiol. 2003;50:19–26. doi: 10.1016/s0167-8760(03)00121-1. [DOI] [PubMed] [Google Scholar]
- Romanski LM, Bates JF, Goldman-Rakic PS. Auditory belt and parabelt projections to the prefrontal cortex in the rhesus monkey. J Comp Neurol. 1999a;403:141–157. doi: 10.1002/(sici)1096-9861(19990111)403:2<141::aid-cne1>3.0.co;2-v. [DOI] [PubMed] [Google Scholar]
- Romanski LM, Tian B, Fritz J, Mishkin M, Goldman-Rakic PS, Rauschecker JP. Dual streams of auditory afferents target multiple domains in the primate prefrontal cortex. Nat Neurosci. 1999b;2:1131–1136. doi: 10.1038/16056. [DOI] [PMC free article] [PubMed] [Google Scholar]
- Schroeder CE, Foxe JJ. The timing and laminar profile of converging inputs to multisensory areas of the macaque neocortex. Brain Res Cogn Brain Res. 2002;14:187–198. doi: 10.1016/s0926-6410(02)00073-3. [DOI] [PubMed] [Google Scholar]
- Schroeder CE, Foxe JJ. Multisensory contributions to low-level, “unisensory” processing. Curr Opin Neurobiol. 2005;15:454–458. doi: 10.1016/j.conb.2005.06.008. [DOI] [PubMed] [Google Scholar]
- Schroeder CE, Lindsley RW, Specht C, Marcovici A, Smiley JF, Javitt DC. Somatosensory input to auditory association cortex in the macaque monkey. J Neurophysiol. 2001;85:1322–1327. doi: 10.1152/jn.2001.85.3.1322. [DOI] [PubMed] [Google Scholar]
- Seltzer B, Cola MG, Gutierrez C, Massee M, Weldon C, Cusick CG. Overlapping and nonoverlapping cortical projections to cortex of the superior temporal sulcus in the rhesus monkey: double anterograde tracer studies. J Comp Neurol. 1996;370:173–190. doi: 10.1002/(SICI)1096-9861(19960624)370:2<173::AID-CNE4>3.0.CO;2-#. [DOI] [PubMed] [Google Scholar]
- Stein BE, Meredith MA. Merging of the senses. Cambridge, MA: MIT; 1993. [Google Scholar]
- Stein BE, Meredith MA, Wallace MT. The visually responsive neuron and beyond: multisensory integration in cat and monkey. Prog Brain Res. 1993;95:79–90. doi: 10.1016/s0079-6123(08)60359-3. [DOI] [PubMed] [Google Scholar]
- Sumby WH, Polack I. Visual contribution to speech intelligibility in noise. J Acoust Soc Am. 1954;26:212–215. [Google Scholar]
- Talavage TM, Sereno MI, Melcher JR, Ledden PJ, Rosen BR, Dale AM. Tonotopic organization in human auditory cortex revealed by progressions of frequency sensitivity. J Neurophysiol. 2004;91:1282–1296. doi: 10.1152/jn.01125.2002. [DOI] [PubMed] [Google Scholar]
- Talsma D, Doty TJ, Woldorff MG. Selective attention and audiovisual integration: is attending to both modalities a prerequisite for early integration? Cereb Cortex. 2007 doi: 10.1093/cercor/bhk016. in press. [DOI] [PubMed] [Google Scholar]
- Tanabe HC, Honda M, Sadato N. Functionally segregated neural substrates for arbitrary audiovisual paired-association learning. J Neurosci. 2005;25:6409–6418. doi: 10.1523/JNEUROSCI.0636-05.2005. [DOI] [PMC free article] [PubMed] [Google Scholar]
- Teder-Salejarvi WA, Di Russo F, McDonald JJ, Hillyard SA. Effects of spatial congruity on audio-visual multimodal integration. J Cogn Neurosci. 2005;17:1396–1409. doi: 10.1162/0898929054985383. [DOI] [PubMed] [Google Scholar]
- Tian B, Rauschecker JP. Processing of frequency-modulated sounds in the lateral auditory belt cortex of the rhesus monkey. J Neurophysiol. 2004;92:2993–3013. doi: 10.1152/jn.00472.2003. [DOI] [PubMed] [Google Scholar]
- van Atteveldt N, Formisano E, Goebel R, Blomert L. Integration of letters and speech sounds in the human brain. Neuron. 2004;43:271–282. doi: 10.1016/j.neuron.2004.06.025. [DOI] [PubMed] [Google Scholar]
- Van Essen DC, Drury HA. Structural and functional analyses of human cerebral cortex using a surface-based atlas. J Neurosci. 1997;17:7079–7102. doi: 10.1523/JNEUROSCI.17-18-07079.1997. [DOI] [PMC free article] [PubMed] [Google Scholar]
- van Wassenhove V, Grant KW, Poeppel D. Visual speech speeds up the neural processing of auditory speech. Proc Natl Acad Sci USA. 2005;102:1181–1186. doi: 10.1073/pnas.0408949102. [DOI] [PMC free article] [PubMed] [Google Scholar]
- Weissman DH, Warner LM, Woldorff MG. The neural mechanisms for minimizing cross-modal distraction. J Neurosci. 2004;24:10941–10949. doi: 10.1523/JNEUROSCI.3669-04.2004. [DOI] [PMC free article] [PubMed] [Google Scholar]
- Werner-Reiss U, Kelly KA, Trause AS, Underhill AM, Groh JM. Eye position affects activity in primary auditory cortex of primates. Curr Biol. 2003;13:554–562. doi: 10.1016/s0960-9822(03)00168-4. [DOI] [PubMed] [Google Scholar]
- Wessinger CM, Buonocore MH, Kussmaul CL, Mangun GR. Tonotopy in human auditory cortex examined with functional magnetic resonance imaging. NeuroImage. 1997;5:18–25. doi: 10.1002/(SICI)1097-0193(1997)5:1<18::AID-HBM3>3.0.CO;2-Q. [DOI] [PubMed] [Google Scholar]
- Wessinger CM, VanMeter J, Tian B, Van Lare J, Pekar J, Rauschecker JP. Hierarchical organization of the human auditory cortex revealed by functional magnetic resonance imaging. J Cogn Neurosci. 2001;13:1–7. doi: 10.1162/089892901564108. [DOI] [PubMed] [Google Scholar]
- Zatorre RJ, Bouffard M, Ahad P, Belin P. Where is “where” in the human auditory cortex? Nat Neurosci. 2002;5:905–909. doi: 10.1038/nn904. [DOI] [PubMed] [Google Scholar]