

Abstract
Limbic and cortical neurocircuits profoundly influence hypothalamic–pituitary–adrenal (HPA) axis responses to stress yet have little or no direct projections to the hypothalamic paraventricular nucleus (PVN). Numerous lines of evidence suggest that the bed nucleus of the stria terminalis (BST) is well positioned to relay limbic information to the PVN. The BST comprises multiple anatomically distinct nuclei, of which some are known to receive direct limbic and/or cortical input and to heavily innervate the PVN. Our studies test the hypothesis that subregions of the BST differentially regulate HPA axis responses to acute stress. Male Sprague Dawley rats received bilateral ibotenate lesions, targeting either the principal nucleus in the posterior BST or the dorsomedial/fusiform nuclei in the anteroventral BST. Posterior BST lesions elevated plasma ACTH and corticosterone in response to acute restraint stress, increased stress-induced PVN c-fos mRNA, and elevated PVN corticotropin-releasing hormone (CRH) and parvocellular arginine vasopressin (AVP) mRNA expression relative to sham-lesion animals. In contrast, anterior BST lesions attenuated the plasma corticosterone response and decreased c-fos mRNA induction in the PVN but did not affect CRH and parvocellular AVP mRNA expression in the PVN. These data suggest that posterior BST nuclei are involved in inhibition of the HPA axis, whereas the anteroventral BST nuclei are involved in HPA axis excitation. The results indicate that the BST contains functional subdomains that play different roles in integrating and processing limbic information in response to stress and further suggest that excitatory as well as inhibitory limbic information is funneled through these important cell groups.
Keywords: BST, corticotropin-releasing hormone, vasopressin, paraventricular nucleus of the hypothalamus, corticosterone, ACTH
Introduction
Activation of the hypothalamic–pituitary–adrenal (HPA) axis is a primary mechanism for maintaining homeostasis in response to stress. Hypophysiotrophic neurons in the hypothalamic medial parvocellular paraventricular nucleus (PVNmp) synthesize the primary ACTH secretagogues corticotropin-releasing hormone (CRH) and arginine vasopressin (AVP), which are released into the hypophysial portal system and trigger adrenocorticotropin (ACTH) secretion from the anterior pituitary. ACTH drives the secretion of corticosterone from the adrenals into the circulation to mobilize energy stores, maintain blood pressure, and exert negative feedback at the HPA brain and pituitary sites (Herman et al., 2003).
Forebrain limbic regions such as the amygdala, hippocampus, and medial prefrontal cortex have substantial influence on the HPA axis (for review, see Herman et al., 2005). Moreover, dysfunction in these regions is highly implicated in the etiology of stress-related disorders, such as posttraumatic stress disorder and depression, which often exhibit HPA axis abnormalities (McEwen, 1998; Kasckow et al., 2001). Therefore, it is critical to better understand the pathways by which these forebrain regions regulate HPA responses.
Notably, these limbic regions have little or no direct projections to the PVNmp (Sawchenko et al., 1983; Gray et al., 1989; Cullinan et al., 1993; Prewitt and Herman, 1998) and instead relay information to the PVN via basal forebrain and hypothalamic structures. One of the primary potential relay sites is the bed nucleus of the stria terminalis (BST), which receives direct limbic input and has abundant projections to the PVN (Sawchenko and Swanson, 1983; Cullinan et al., 1993; Dong et al., 2001; Gu et al., 2003; Dong and Swanson, 2004, 2006). The BST can be subdivided into many cytoarchitecturally distinct subregions (Swanson, 1998). Within the anterior BST, the dorsomedial and fusiform nuclei express CRH (Phelix and Paull, 1990) and send the heaviest BST projections to the PVNmp (Dong et al., 2001; Dong and Swanson, 2006). Within the posterior BST, the principal nucleus (BSTpr) contains a GABAergic neuronal population (Ju et al., 1989; Cullinan et al., 1993) that also heavily innervates the PVNmp (Gu et al., 2003; Dong and Swanson, 2004).
Stimulating the BST can either excite or inhibit HPA activity (Dunn, 1987; Feldman et al., 1990; Casada and Dafny, 1991; Zhu et al., 2001), depending on the region targeted. In addition, large anterior (Crane et al., 2003) or lateral BST lesions appear to decrease responses to stress, whereas medial BST lesions are ineffective (Gray et al., 1993). In addition, large anterior BST lesions reduce PVN CRH mRNA, whereas large posterior lesions increase resting CRH mRNA expression (Herman et al., 1994). However, these studies targeted sizable portions of the BST, and thus cytoarchitecturally distinct populations of BST neurons responsible for HPA axis inhibition and excitation remain unknown. Collectively, these findings suggest that distinct nuclei of the BST may differentially regulate HPA activity. Therefore, this study uses selective lesions targeting the CRH-expressing dorsomedial/fusiform nuclei (anterior BST) and GAD-expressing principal nucleus (posterior BST) to test the hypotheses that the dorsomedial/fusiform nuclei primarily excite the HPA axis, whereas the principal nucleus inhibits HPA responses to stress.
Materials and Methods
Animals.
Thirty-six adult male Sprague Dawley rats (275–300 g; Harlan Sprague Dawley, Indianapolis, IN) were used for this study. All rats were housed three per cage in conventional shoebox rat cages with food and water available ad libitum in a temperature- and humidity-controlled vivarium on a 12 h light/dark cycle (lights on at 6:00 A.M.). Animals were maintained in accordance with the National Institutes of Health Guide for the Care and Use of Laboratory Animals (1996). All animal protocols were approved by the Institutional Animal Care and Use Committee at the University of Cincinnati.
Ibotenate lesions.
Rats were anesthetized by intraperitoneal injections of 87 mg/kg ketamine–13 mg/kg xylazine mixture. Preemptive analgesia was administered by subcutaneous injections of 60 μl of butorphanol (Torbugesic). Each rat was placed in a David Kopf Instruments (Tujunga, CA) stereotaxic apparatus on which skulls were exposed, and burr holes were drilled at the calculated coordinates. Afterward, each rat received bilateral microinjections of ibotenate (0.5 μl per side, 4.0 μg/μl) in sterile PBS, pH 7.4, or 0.9% sterile saline into either the anterior BST [anteroposterior (AP), −0.25 mm; mediolateral (ML), ±1.7 mm; dorsoventral (DV) (dura), −7.4 mm] or the posterior BST (AP, −0.8 mm; ML, ±1.4 mm; DV (dura), −7.0 mm], with coordinates calculated from bregma (Paxinos and Watson, 1998). Each microinjection used a 26 gauge 1 μl Hamilton injection syringe, mounted on the stereotaxic apparatus. Injectors were slowly lowered to the DV coordinate over a 1 min period and left in place for 1 min before injection. The ibotenate or saline was manually infused over a total of 5 min at a rate of 0.05 μl/30 s, followed by another 5 min waiting period to allow diffusion and minimize dorsal spread of injection back up the needle track. The syringes were raised over a 1 min period. Skull burr holes were sealed with sterile bone wax, and the skin was closed with wound clips. Animals recovered for at least 7 d after surgery before restraint stress challenge. Body weights were measured on the day of surgery, 4 d after surgery, 8 d after surgery, 12 d after surgery, and on the last day of the experiment.
Acute restraint stress protocol.
All rats received restraint stress between 9:00 A.M. and 10:30 A.M. during lights on. Animals were placed in well ventilated Plexiglas restraint tubes, and a blood sample was immediately collected. Blood samples (250–300 μl) were collected by tail clip for the determination of plasma ACTH and corticosterone levels. All rats remained in the restrainers for 30 min, at which point another blood sample was collected. Animals were released back into their home cages to recover. Additional blood samples were taken at 60 and 120 min from the onset of the restraint stress. After 7 d of nonhandled recovery in their home cages, all animals received a second 30 min restraint stress challenge and were immediately killed by decapitation for optimal measures of c-fos mRNA induction by in situ hybridization. Brains were removed, flash frozen in isopentane on dry ice (−45°C), and stored at −80°C. Adrenal and thymus glands were collected and weighed as indirect indices of HPA tone.
Radioimmunoassay.
Plasma corticosterone levels were measured by radioimmunoassay (RIA) using 125I RIA kits from MP Biomedicals (Orangeburg, NY); plasma ACTH levels were measured by RIA using an antiserum donated by Dr. William Engeland (University of Minnesota, Minneapolis, MN) using 125I-labeled ACTH (Amersham Biosciences, Piscataway, NJ) as tracer (Jasper and Engeland, 1991). For each assay, all plasma samples were analyzed within the same RIA.
Lesion verification by neuronal-specific nuclear protein immunohistochemistry and Nissl stain.
Brains were serially sectioned at 14 μm using a Microm (Heidelberg, Germany) cryostat, mounted onto charged glass slides, and stored at −20°C. Lesion sites were verified by both Nissl staining of cells and by immunolabeling with neuronal-specific nuclear protein (NeuN) as a neuronal marker. For Nissl stain, sections were fixed in 4% paraformaldehyde and stained with cresyl violet, dehydrated through an ascending ethanol series and xylene, and coverslipped using DPX mountant. For NeuN immunohistochemistry, the tissue sections were fixed in 4% paraformaldehyde and washed extensively with 50 mm potassium PBS (KPBS) between each step. Sections were incubated in 1% H2O2 for 10 min and blocked in incubation solution (4% normal goat serum and 0.3% Triton X-100 in KPBS) for 1 h. Sections were incubated overnight with a monoclonal antibody against NeuN (1:1000; Chemicon, Temecula, CA) with Parafilm coverslips, followed by 1 h incubation in biotinylated goat anti-mouse IgG (1:500; Vector Laboratories, Burlingame, CA) and 1 h incubation in avidin–horseradish peroxidase complex (1:500; ABC Elite kit; Vector Laboratories), in which each step was in incubation solution. Finally sections were incubated for 5 min in 0.02% diaminobenzidine (Sigma, St. Louis, MO). Slides were dehydrated through an ascending ethanol series, cleared in xylene, and coverslipped using DPX mountant.
Lesions were identified by the location of the needle track, loss of neurons, and gliosis. Lesions targeting the anterior division of the BST were confirmed as “hits” when the primary damage included the fusiform and dorsomedial nuclei of the BST, with some occasional damage extending into the adjacent subcommissural zone of the BST, the ventral pallidum, and the parastrial nucleus. Lesions targeting the posterior division of the BST were confirmed as hits when the primary damage included the principal nucleus of the BST, with some damage extending into the adjacent interfascicular (BSTif) and transverse (BSTtr) nuclei of the BST. Lesions that focused outside of the primary target nuclei in the BST were considered missed lesions. Rats with bilateral damage were included in the study, whereas rats with only partial unilateral lesions or missed lesions were removed from the analysis.
In situ hybridization.
Antisense rat AVP, CRH, c-fos, and GAD 65 riboprobes were generated by in vitro transcription using 35S-labeled UTP. The AVP (exon C) DNA construct is a 161 bp insert in a pCR4 TOPO vector, which was linearized with NotI restriction enzyme, and transcribed using T3 RNA polymerase. The c-fos DNA construct (courtesy of Dr. T. Curran, St. Jude Children's Research Hospital, Memphis, TN) is a 587 bp fragment cloned into pGEM4Z vector, which was linearized with HindIII and transcribed with SP6 RNA polymerase. The CRH DNA construct is a 765 bp fragment cloned into pGEM3 vector (courtesy of Dr. Robert Thompson, University of Michigan, Ann Arbor, MI), which was linearized with HindIII and transcribed using T7 RNA polymerase. The GAD 65 DNA construct (courtesy of Dr. Allan Tobin, University of California, Los Angeles, Los Angeles, CA) is a 913 bp insert in Bluescript SK vector, which was linearized with StuI restriction enzyme and transcribed with T7 RNA polymerase. Each 15 μl riboprobe transcription reaction was made from 1.0–2.5 μg of linearized DNA fragment, 62.5 μCi of [35S]UTP, 330 μm ATP, 330 μm GTP, 330 μm CTP, 10 μm cold UTP, 1× transcription buffer, 66.6 mm dithiothreitol (DTT), 40 U of RNase Inhibitor, and 20 U of the appropriate RNA polymerase.
Before hybridization, tissue slides were pretreated with 4% paraformaldehyde, washed in potassium PBS, acetylated, delipidized in chloroform, and dehydrated through a graded ethanol series. Each riboprobe was diluted (1.0 × 10⁶ cpm/50 μl buffer) in hybridization buffer (50% formamide, 1× Denhardt's solution, 10% dextran sulfate, 200 μg/ml fish sperm single-stranded DNA, 100 μg/ml yeast tRNA, and 20 mm DTT) and applied to a 1-in-10 series of slides containing the mounted brain sections cut on the cryostat. Coverslipped slides were placed in hybridization chambers over blotting paper soaked in 50% formamide and incubated overnight at 55°C. The next day, coverslips were removed, and slides were washed in 2× SSC. Slides were subsequently incubated in 100 μg/ml RNase A for 30 min at 37°C, washed numerous times in 0.2× SSC, once in 0.2× SSC for 1 h at 65°C, and finally dehydrated through a graded ethanol series.
Image analysis.
Hybridized slides were exposed on Eastman Kodak (Rochester, NY) Biomax MR film (6 h for AVP, 7 d for GAD 65, 7 d for CRH, and 14 d for c-fos). Film images of brain sections were captured by a digital video camera. Anatomical brain regions were identified using Swanson (1998) and Paxinos and Watson (1998) rat brain atlases. Brain sections were matched for rostrocaudal level between rats for analyses. All brain regions and nuclei were clearly distinguishable by their specificity and intensity of AVP, CRH, c-fos, and GAD 65 expression patterns. The parvocellular and magnocellular aspects of the PVN could also be easily identified with reference to the brain maps and Nissl-stained sections from a parallel series of tissue as a guide. Semiquantitative analyses of autoradiograph images were performed using Scion (Frederick, MD) Image software, and hybridization signal was expressed as gray level units. The gray level signal of a hybridized tissue region of interest was corrected by subtracting the gray level signal over a nonhybridized area of tissue (white matter and corpus callosum) and expressed as corrected gray level (CGL). 14C standards were also measured using Scion Image and transferred to Assay Zap [Biosoft (Cambridge, UK) and P. L. Taylor (West Markham, East Lothian, Scotland)] to generate a standard curve to verify that all measured gray levels were on the linear range of the film.
Statistical analysis.
Data are expressed as mean ± SEM. Sham rats injected with saline vehicle in the anterior and posterior BST were compared for any statistical differences. Because minimal surgery damage was observed in the sham rats and no statistical differences were found between the two sham groups for all analyses, the two sham groups were pooled for statistical comparisons. To take into account the changes in body weight, adjusted thymus and adrenal gland weights were calculated as organ weight divided by final body weight and multiplied by 100. AVP, CRH, c-fos, and GAD 65 mRNA expression were expressed as CGL. The total integrated ACTH and corticosterone responses were expressed as area under the curve (AUC). Organ weights, integrated hormone responses, and in situ hybridization data were analyzed by one-way factorial ANOVA (lesion), and significant main effects were further analyzed by Fisher's least significant difference (LSD) post hoc test. Body weight, plasma ACTH, and plasma corticosterone data were analyzed by two-way ANOVA (lesion, time) with repeated measures (time), and significant main effects were further analyzed by Fisher's LSD post hoc tests. Correlations between integrated ACTH and c-fos mRNA and between integrated corticosterone and c-fos mRNA were analyzed by linear regression tests. Hormone and body weight data were analyzed using GBStat (Dynamic Microsystems Silver Spring, MD), whereas organ weight and mRNA data were analyzed using Statview (SAS Institute, Cary, NC). Statistical significance was set at p < 0.05. Tests for homogeneity of variance were performed, and, when necessary, log transformations were used. Detection of outliers was performed using the Dixon–Massey method, and, when necessary, data were reanalyzed after outlier removal and/or transformations.
Results
Anterior and posterior BST lesions
The role of specific nuclei in the BST in HPA axis regulation was assessed after bilateral ibotenate lesions targeting specific nuclei in either the anterior or posterior divisions of the BST (Fig. 1). Lesion location and extent was verified by NeuN immunolabeling of neurons and Nissl stain of cells as analyses of neuronal loss, gliosis, and injector trajectory. GAD 65 mRNA expression in the lesion-targeted BST nuclei and CRH mRNA expression in the fusiform/dorsomedial nuclei of the BST were used to establish specificity of the lesions.
Figure 1.
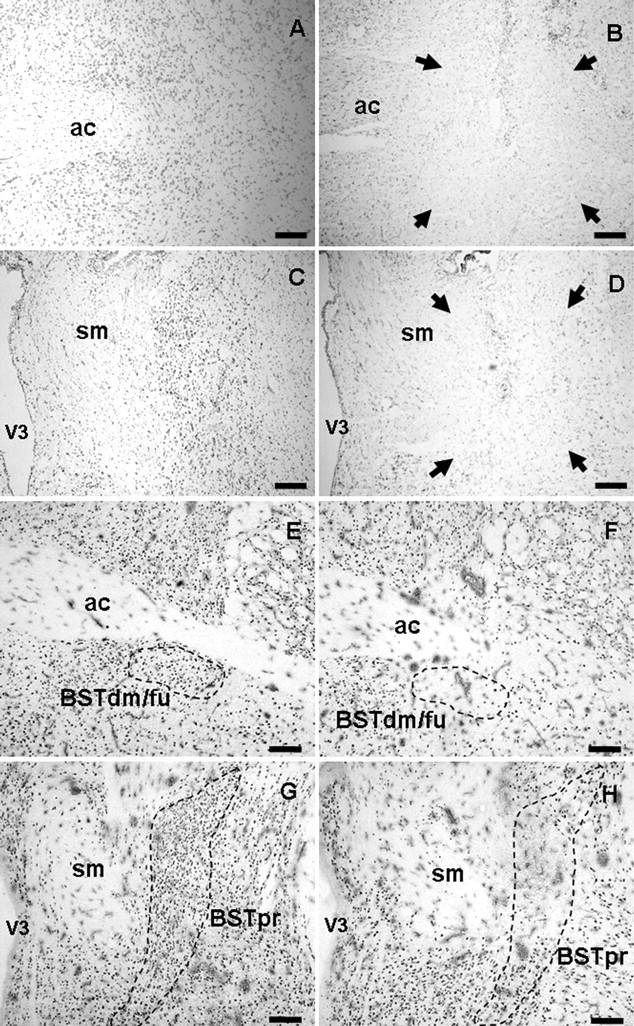
Brain tissue sections were immunolabeled for NeuN (E–H) and Nissl stained with cresyl violet (A–D) for analysis of the extent of lesions (surrounded by arrows). Sham injection sites targeting the anterior BST (A, E) and posterior BST (C, G) have intact neurons, minimal gliosis, and minimal needle track damage most noticeable only in the cortex in which the needle entered the brain. Anterior BST lesions (B, F) were identified by damage ventral to the anterior commissure at approximately AP −0.15 to −0.3 mm from bregma. Posterior BST lesions (D, H) were identified by damage lateral to the stria medularis at approximately AP −0.7 to −0.9 mm from bregma. ac, Anterior commissure; BSTdm/fu, dorsomedial/fusiform nuclei of the BST; sm, stria medularis; V3, third ventricle. Scale bars, 300 μm.
Confirmed anterior BST lesions were centered at the level of the crossing of the anterior commissure at approximately AP −0.25 mm from bregma and were relatively consistent in extent of damage (Fig. 2A). The anterior BST lesions were confirmed as hits when the damage localized to the ventral aspects of the anterior division, including the fusiform and dorsomedial nuclei of the BST, with limited damage extending into the adjacent subcommissural zone. The majority of damage in the anterior BST nuclei remained ventral to the anterior commissure, with minimal needle track or lesion damage dorsal to the anterior commissure. All confirmed anterior BST lesions had minimal dorsal damage in the oval nucleus of the BST, minimal ventral damage in the medial preoptic area, and spared any caudal damage in the posterior division of the BST.
Figure 2.
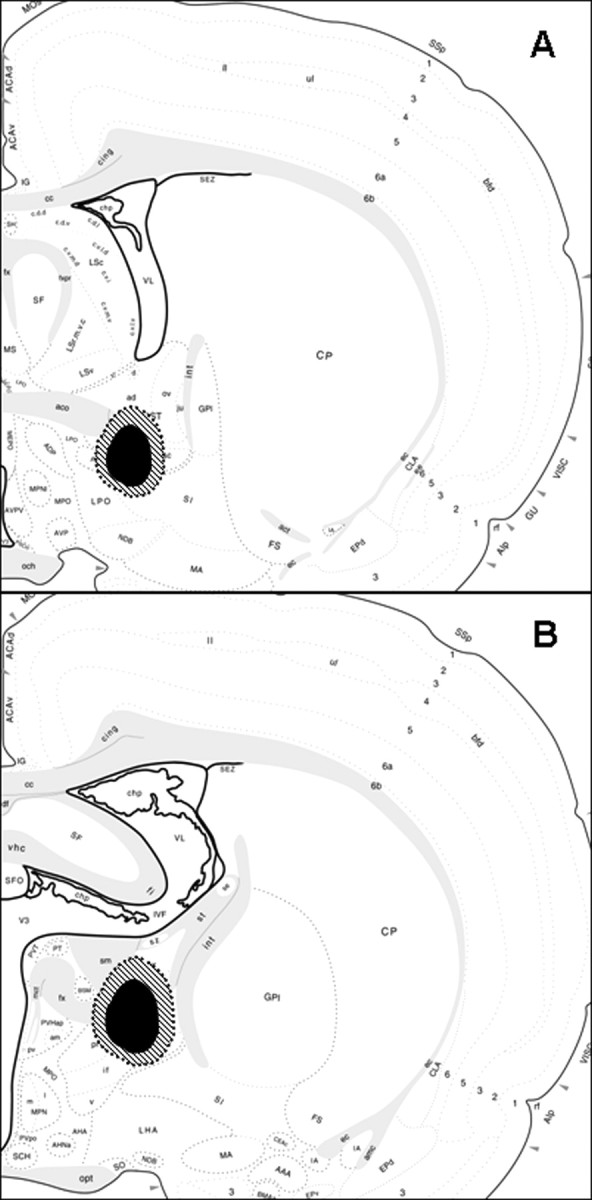
Schematic diagrams illustrate the extent of the spread of damage of the smallest (black shaded area) to the largest lesions (cross-hatched shaded area) confirmed as hits of either the anterior BST (A) or posterior BST (B). The images are adapted from the brain maps of Swanson (1998).
Confirmed posterior BST lesions were centered ∼0.8 mm posterior to bregma, according to the Paxinos and Watson (1998 atlas. Lesions targeting the posterior division of the BST were confirmed as hits when the damage included primarily the center of the BSTpr, with moderate damage extending into the adjacent BSTif and BSTtr nuclei (Fig. 1C). The overall size of the lesions was relatively consistent but was not large enough to destroy the entire principal nucleus, usually sparing the ventral tip (Fig. 2B). All confirmed posterior BST lesions had minimal damage laterally into the striatum and spared any rostral damage into the anterior division of the BST.
c-fos, CRH, and GAD 65 mRNA expression in the BST
Expression of c-fos mRNA was analyzed in the BST nuclei to determine the effects of lesions on transcriptional activity in the BST. There was a significant main effect of lesion on c-fos mRNA in the dorsomedial/fusiform BST (F(2,29) = 43.78; p < 0.05) (Table 1). Post hoc analyses revealed that c-fos expression was significantly attenuated in anterior lesion rats compared with shams (p < 0.05), whereas c-fos expression was not different in posterior lesion rats compared with shams. These data indicate that c-fos was significantly decreased only within the dorsomedial/fusiform nuclei when targeted by the lesions. Additionally, there was insufficient c-fos induction above background in the principal nucleus of the BST to allow for statistical analyses.
Table 1.
Semiquantitative analyses of c-fos, CRH, and GAD 65 mRNA expression were expressed as corrected gray levels
| mRNA | Sham | Anterior BST lesion | Posterior BST lesion |
|---|---|---|---|
| c-fos, BSTdm/fu | 45.46 ± 3.00 | 10.76 ± 1.35* | 42.77 ± 2.33 |
| CRH, BSTdm/fu | 29.67 ± 2.00 | 6.57 ± 2.65* | 30.68 ± 1.41 |
| GAD 65, BSTdm/fu | 42.35 ± 2.07 | 11.72 ± 3.94* | 44.39 ± 2.26 |
| GAD 65, BSTpr | 59.09 ± 1.76 | 65.53 ± 4.98 | 33.23 ± 4.96* |
c-fos, CRH, and GAD 65 mRNA were decreased in the dorsomedial/fusiform nuclei of the BST (BSTdm/fu) of anterior BST lesion rats compared with shams. GAD 65 mRNA was also decreased in the principal nucleus of the BST of posterior BST lesion rats compared with shams. Data are shown as mean ± SEM; n = 8–12 per group.
*p < 0.05 versus sham.
Corticotropin-releasing hormone mRNA was heavily expressed in the oval and fusiform nuclei of the anterior division of the BST (Fig. 3). From analysis of CRH expression, it is clear that BST lesions targeting the anterior division destroyed the majority of CRH-expressing neurons ventrally in the fusiform and dorsomedial nucleus, while sparing the more dorsally located oval nucleus of the BST. There was a main effect of lesion on CRH expression in the dorsomedial/fusiform nuclei of the BST (F(2,29) = 38.82; p < 0.05) (Table 1). Post hoc analyses revealed that CRH mRNA in the dorsomedial/fusiform nuclei was significantly decreased in the anterior lesion rats compared with shams (p < 0.05), whereas CRH expression was not affected by posterior BST lesions.
Figure 3.

CRH mRNA was expressed at the level of the anterior division of the bed nucleus of the stria terminalis in the oval and the fusiform nuclei of sham injected rats (A). In comparison, CRH mRNA expression was absent in the fusiform and dorsomedial nuclei of BST of anterior BST lesion rats (B), whereas CRH in the oval nucleus of the BST was intact. ac, Anterior commissure; BSTdm/fu, dorsomedial/fusiform nuclei; BSTov, oval nucleus. Scale bars, 250 μm.
GAD 65 mRNA was expressed in many PVN-projecting regions, including the medial preoptic nucleus of hypothalamus and multiple nuclei in the anterior division of the BST (Fig. 4A,B). GAD 65 mRNA was quantified to measure the extent of variability of GABAergic neuronal loss in the lesion-targeted BST nuclei or to determine whether lesions affected GAD 65 expression in other BST nuclei outside of the lesion-targeted nuclei. Anterior BST lesions destroyed the majority of GAD 65-expressing neurons in the fusiform and dorsomedial nuclei. In addition, GAD 65 expression provides additional evidence that the lesion damage remained mostly ventral to the anterior commissure, sparing the oval nucleus and anterodorsal nucleus of the BST with minimal damage. There was a main effect of lesion on GAD 65 mRNA in the dorsomedial/fusiform nuclei of the BST (F(2,29) = 40.92; p < 0.05) (Table 1). GAD 65 expression in the dorsomedial/fusiform nuclei of the BST was attenuated in anterior BST lesion rats compared with shams and posterior BST lesion rats (p < 0.05), whereas GAD 65 mRNA in posterior lesions rats were not significantly different from shams.
Figure 4.

GAD 65 mRNA was expressed at the level of the dorsomedial/fusiform nuclei of the bed nucleus of the stria terminalis in anterior BST sham rats (A) and in the BSTif/BSTtr and BSTpr nuclei of the BST (C) in posterior BST sham rats. In comparison, GAD 65 mRNA expression was absent in the fusiform and dorsomedial BST of anterior BST lesion rats (B) and in the BSTpr and BSTif/BSTtr of posterior BST lesion rats (D). ac, Anterior commissure; BSTdm/fu, dorsomedial/fusiform nuclei; BSTif/tr, interfascicular/transverse nuclei; BSTov, oval nucleus; VL, lateral ventricle. Scale bars, 500 μm.
More caudally, the posterior division of the BST robustly expresses GAD 65 mRNA, with the highest expression in the principal nucleus of the BST and more moderate expression in the interfascicular/transverse nuclei of the BST (Fig. 4C,D). Lesions targeting the posterior division nuclei destroyed primarily the dorsal and central parts of the principal and interfascicular/transverse nuclei of the BST. Portions of the most ventral aspects of the BST in the posterior division were spared from lesion damage. There was a main effect of lesion on GAD 65 mRNA in the principal nucleus of the BST (F(2,29) = 27.68; p < 0.05) (Table 1). GAD 65 expression was diminished in posterior BST lesion rats compared with shams and anterior BST lesion rats (p < 0.05), whereas expression in anterior lesions rats was not significantly different from shams in the principal nucleus.
Body and organ weights
All groups recovered to presurgery body weights by 4 d after surgery. By 8 d after surgery, all rat groups gained additional body weight and continued to gain body weight throughout the rest of the experiment. Moreover, there was no effect on body weight by lesion or by lesion × time interaction (body weight data not shown).
Adjusted adrenal weights were not different among lesion groups (Fig. 5B), but there were differences in adjusted thymus weights among lesion groups (F(2,27) = 8.83; p < 0.05) (Fig. 5A). More specifically, anterior and posterior BST lesions had decreased thymus weights compared with sham rats (p < 0.05). Effects on raw organ weights were the same as those of adjusted weights (data not shown).
Figure 5.

Adjusted thymus weight was decreased in anterior and posterior lesion rats compared with sham rats (A). There were no statistical differences in adjusted adrenal weight among groups (B). Data are shown as mean ± SEM; n = 7–12 per group. *p < 0.05 versus sham. BW, Body weight; Ant, anterior; Post, posterior.
Plasma ACTH
Exposure to a 30 min restraint stress elicited an ACTH response in all experimental groups (Fig. 6). There were main effects of time (F(3,127) = 147.53; p < 0.05) and lesion (F(2,127) = 11.04; p < 0.05), as well as a lesion × time interaction (F(6,127) = 9.46; p < 0.05). All experimental groups had elevated plasma ACTH at the 30 and 60 min time points compared with the 0 min (p < 0.05). Post hoc analyses indicated that the posterior BST lesions elevated plasma ACTH levels at the 30 and 60 min time points compared with shams (p < 0.05). In contrast, the anterior BST lesions did not alter plasma ACTH secretion after an acute stressor. Plasma ACTH levels were not different among any experimental groups at either the 0 or 120 min time points. The total integrated plasma ACTH responses expressed as mean ± SEM ACTH area under the curve were 6700.07 ± 802 in shams, 5703 ± 702 in anterior lesion rats, and 16021.70 ± 1917 in posterior lesion rats. There was a main effect of lesion (F(2,29) = 17.42; p < 0.05) for total integrated plasma ACTH response as measured by area under the curve (data not shown). Post hoc analyses indicated that the posterior BST lesions elevated the total integrated plasma ACTH response to restraint compared with shams (p < 0.05).
Figure 6.

Plasma ACTH response to an acute 30 min restraint stress of posterior BST lesion rats were elevated at the 30 and 60 min time points compared with sham rats at their respective time points (p < 0.05), whereas plasma ACTH levels of anterior BST lesion rats were not different compared with shams. Data are shown as mean ± SEM; n = 7–12. *p < 0.05 versus sham.
Plasma corticosterone
All experimental groups exhibited increased plasma corticosterone in response to the 30 min novel restraint, with main effects of lesion (F(2,127) = 4.13; p < 0.05) and time (F(3,127) = 302.19; p < 0.05) and a lesion × time interaction (F(6,127) = 5.15; p < 0.05) (Fig. 7). At the 30 min time point, anterior BST lesions decreased plasma corticosterone levels compared with sham rats (p < 0.05), whereas posterior BST lesions were not different from shams. Posterior lesions elevated plasma corticosterone levels at 60 min compared with sham control rats (p < 0.05), whereas anterior BST lesions were not different from shams. By 120 min after the onset of restraint stress, all rats had decreased plasma corticosterone levels compared with their respective levels at the 60 min time point (p < 0.05). There were no significant differences in plasma corticosterone levels at 120 min time point among the lesion groups. The total integrated plasma corticosterone responses expressed as mean ± SEM corticosterone area under the curve were 35912 ± 2556 in shams, 30810 ± 1398 in anterior lesion rats, and 44031 ± 2425 in posterior lesion rats. There was a main effect of lesion (F(2,29) = 6.88; p < 0.05) for total integrated plasma corticosterone response as measured by area under the curve (data not shown). Post hoc analyses indicated that the posterior BST lesions elevated the total integrated plasma corticosterone response to restraint compared with shams (p < 0.05).
Figure 7.

Plasma corticosterone response to an acute 30 min restraint stress challenge of anterior BST lesion rats was attenuated at 30 min compared with sham rats (p < 0.05), whereas plasma corticosterone levels of posterior BST lesion rats were elevated at 60 min compared with sham rats (p < 0.05). Data are shown as mean ± SEM; n = 7–12. *p < 0.05 versus sham.
c-fos mRNA expression in the PVN
The induction of c-fos mRNA was assessed as a measure of PVN neuronal activation in response to a 30 min restraint stress (Fig. 8A). There was a main effect of lesion on c-fos mRNA expression in the PVN (F(2,28) = 20.56; p < 0.05) (Fig. 8B). Post hoc analyses revealed that posterior BST lesions potentiated PVN c-fos mRNA induction above the levels observed in shams (p < 0.05). In contrast, the anterior BST lesions attenuated PVN c-fos expression relative to shams (p < 0.05). Additionally, there was a significant correlation between c-fos mRNA in the PVN and integrated ACTH response (c-fos, 62.49 + 0.0019 × ACTH AUC; r = 0.59; p < 0.05) (data not shown), suggesting there are proportional differences in c-fos induction and plasma ACTH response to restraint stress affected by lesions. Finally, there was also a significant correlation between c-fos mRNA in the PVN and integrated corticosterone response (c-fos, 40.91 + 0.0011 × corticosterone AUC; r = 0.47; p < 0.05) (data not shown), suggesting that there are proportional differences in c-fos induction and plasma corticosterone response to restraint stress affected by lesions.
Figure 8.

Representative image of c-fos mRNA expression in the PVN of the hypothalamus (A). Semiquantitative analysis (B) revealed that c-fos mRNA expression was elevated in the PVN of the posterior (Post) BST lesion rats compared with sham rats. In contrast, c-fos mRNA expression was attenuated in the PVN of the anterior (Ant) BST lesion rats compared with sham rats. Data are shown as mean ± SEM; n = 7–12. *p < 0.05 versus sham. Scale bar, 500 μm.
CRH and vasopressin mRNA expression in the PVN
CRH mRNA expression in the PVN (Fig. 9) was affected by lesion (F(2,29) = 10.69; p < 0.05). Post hoc analyses revealed that posterior BST lesions elevated CRH mRNA in the PVN compared with shams (p < 0.05), whereas CRH expression was not affected by anterior BST lesions.
Figure 9.

Representative image of CRH mRNA expression (A) in the PVN. Semiquantitative analysis (B) revealed that CRH mRNA expression was elevated in the PVN of the posterior (Post) lesion rats compared with shams, whereas anterior (Ant) BST lesion rats were not different compared with shams. Data are shown as mean ± SEM; n = 7–12. *p < 0.05 versus sham. Scale bar, 500 μm.
Arginine vasopressin mRNA is highly expressed in the magnocellular aspect of the PVN and the supraoptic nucleus of the hypothalamus, with more moderate expression in the parvocellular aspect of the PVN (Fig. 10B). There was a main effect of lesion on AVP mRNA expression in the parvocellular PVN (Fig. 10A) (F(2,29) = 10.70; p < 0.05). Post hoc analyses revealed that posterior BST lesions elevated AVP mRNA in the parvocellular PVN compared with shams (p < 0.05). For AVP expression in the magnocellular PVN (Fig. 10C), there was an effect of lesion (F(2,29) = 11.84; p < 0.05). Post hoc analysis revealed that anterior BST lesions attenuated AVP mRNA in the magnocellular PVN compared with shams (p < 0.05). There were no significant differences among lesion groups for AVP mRNA expression in the supraoptic nucleus of the hypothalamus (Fig. 10D).
Figure 10.

Representative image of AVP mRNA expression (B) in the PVN and supraoptic nucleus (SON) of the hypothalamus. Semiquantitative analyses revealed that AVP mRNA expression was elevated in the parvocellular PVN of posterior BST lesion rats compared with shams (A) and attenuated in the magnocellular PVN of the anterior BST lesion rats compared with shams (C). No statistical differences in AVP expression were observed in the SON among lesion groups (D). Data are shown as mean ± SEM; n = 7–12. *p < 0.05 versus sham. PVNpm, Posterior magnocellular PVN; SON, supraoptic nucleus of the hypothalamus. Scale bar, 500 μm.
Discussion
The results of this study are consistent with compartmentalized roles of specific BST nuclei in HPA axis regulation. In particular, the data indicate that the CRH-rich anteroventral BST modulates PVN excitation and promotes corticosterone secretion. In contrast, the posterior BST, encompassing the principal nucleus, inhibits stress-induced PVN excitation, ACTH release, and plasma corticosterone responses. In conjunction with the known limbic connections of the BST, the data suggest that the BST acts as a “clearinghouse” for stress regulatory information from upstream limbic pathways, serving to regulate HPA reactivity in accordance with afferent drive.
This study provides a detailed assessment of PVN-projecting regions of the BST in central and peripheral HPA axis integration. Our conclusions are supported by previous studies using larger BST lesions, which focused on either hormone secretion (Gray et al., 1993) or steady-state PVN gene expression (Herman et al., 1994). Together with the present detailed phenotypic assessment of targeted cell groups in the current study, a compelling case can be made for involvement of BST CRHergic and GABAergic cell groups in HPA activation and inhibition, respectively.
Posterior BST and the HPA axis
Our data provide evidence that the posterior BST inhibits HPA axis responses to restraint stress. Lesions encompassing the principal nucleus of the BST augmented stress-induced secretion of ACTH and corticosterone, increased stress-induced c-fos mRNA, and elevated CRH and AVP mRNA in the parvocellular PVN. Together, these data provide compelling evidence that the posterior BST inhibits the HPA axis response to stress through modulation of PVN excitation.
The time the animals were killed at 30 min after the onset of restraint was designed to approximate the peak of c-fos mRNA induction, as a marker of neuronal activation (Cullinan et al., 1995). Restraint robustly induced c-fos expression in the PVN, and this increase was enhanced by posterior BST lesions. This elevation in cellular activity suggests that the primary PVN-projecting cell group in this area, the principal nucleus, is a major component of the circuitry responsible for inhibition of HPA axis activity.
Posterior BST lesions augmented both CRH and parvocellular AVP mRNA expression in the PVN and occurred in the absence of basal HPA hyperactivity in the circadian nadir (morning). This suggests that enhanced parvocellular PVN CRH and AVP mRNA may alter HPA response capacity but not basal secretion. Changes in CRH and AVP mRNA are unlikely to be related to the recent restraint stress, because increases in parvocellular PVN CRH and AVP mRNA are not observed for 60–120 min after onset to restraint stress (Herman et al., 1991; Imaki et al., 1992; Kovacs and Sawchenko, 1996). Thus, the differences in CRH and AVP expression are likely attributable to changes in resting CRH and AVP mRNA, as reported previously using larger BST lesions targeting the entire posterior division (Herman et al., 1994).
Although posterior lesions destroyed the majority of the principal nucleus, considerable damage was also observed in the more laterally situated interfascicular/transverse nuclei. These regions have little direct input to the PVN (Dong and Swanson, 2004); however, we cannot rule out an indirect influence of the interfascicular/transverse nuclei on the PVN, perhaps by projecting to excitatory targets in the hypothalamus, midbrain, brainstem, or neighboring BST nuclei.
The principal nucleus of the BST contains PVNmp-projecting neurons (Dong and Swanson, 2004), with the majority expressing the GABAergic marker GAD 65, supporting the notion that the principal nucleus inhibits the PVNmp. This BST region receives extensive projections from two known limbic HPA axis regulatory sites, the medial amygdala (Allen and Allen, 1974; Beaulieu et al., 1986; Feldman et al., 1994; Canteras et al., 1995) and hippocampus via the ventral subiculum (Sapolsky et al., 1984; Herman et al., 1989; Canteras and Swanson, 1992) (Fig. 11). For the medial amygdala, the vast majority of HPA modulation is excitatory likely via GABA–GABA transsynaptic disinhibition of the PVN (Bowers et al., 1998; Prewitt and Herman, 1998), with the principal nucleus as one of the major GABAergic relays. In contrast, the hippocampus may inhibit the HPA axis via stimulating the PVN-inhibiting principal nucleus (Zhu et al., 2001; Herman et al., 2004). This suggests the principal nucleus of the BST to be a major candidate for integrating stress-regulating information from multiple limbic sites to regulate HPA activity.
Figure 11.

Schematic diagram illustrates potential, main circuitry of limbic regions sending HPA-regulating information to the PVN via the principal and dorsomedial/fusiform nuclei in the BST (not all of the known connections between these brain regions are listed). IL, Infralimbic cortex; CEA, central nucleus of the amygdala; MEA, medial nucleus of the amygdala; vSUB, ventral subiculum; BSTdm/fu, dorsomedial/fusiform nuclei of the BST.
Anterior BST and the HPA axis
Lesions of the dorsomedial/fusiform nuclei in the anterior BST attenuated HPA axis activation, as noted by decreased corticosterone and PVN c-fos mRNA responses to acute stress. These data are consistent with previous studies using larger lesions that targeted either the lateral BST or the entire anterior division of the BST (Gray et al., 1993; Herman et al., 1994). However, the anterior lesions in the present study indicate that HPA regulatory neurons are located in a specific neuronal population ventral to the anterior commissure, which spared the majority of PVN-projecting cell groups in the anterodorsal and oval nuclei of the BST. Anterior BST lesions did not affect basal ACTH or corticosterone levels, or adrenal weights, suggesting that this region primarily regulates HPA responses to stress rather than basal HPA tone.
Although levels of plasma corticosterone were attenuated in anterior BST lesion rats, plasma ACTH was not affected. This dissociation between the corticosterone and ACTH responses has several potential underlying causes. First, the failure to see alterations in ACTH secretion may be associated with the timing of blood sampling, which may have missed the post-stress peak in ACTH secretion (Ostrander et al., 2006). Alternatively, the anterior BST is known to innervate the preautonomic regions of the PVN (Dong et al., 2001). Emerging data strongly support a role for the sympathetic nervous system in regulation of adrenal responses to ACTH (Ulrich-Lai et al., 2006). Thus, lesion-induced increases in corticosterone may be mediated via neural amplification of adrenal responsiveness to ACTH.
Anterior BST lesions did not alter CRH and AVP mRNA expression in the parvocellular PVN, suggesting that the tonic influence of the fusiform/dorsomedial nuclei on the HPA axis is insufficient to modulate basal PVN tone. This finding contrasts with attenuated PVN CRH mRNA (but not AVP) expression seen after larger anterior BST lesions (Herman et al., 1994), suggesting that other BST nuclei may also influence HPA activity centrally. It is yet to be determined whether the modest decrease in magnocellular AVP expression in the PVN (not observed in the supraoptic nucleus of the hypothalamus) by anterior lesions may have a functional role in influencing HPA activity.
We hypothesize that the stimulatory influence of the dorsomedial/fusiform nuclei of the BST may be mediated by CRH-expressing BST neurons (Champagne et al., 1998). Administration of CRH into the third ventricle or the PVN activates the HPA axis (Imaki et al., 1993; Parkes et al., 1993). Additionally, glutamate (Glu) expressed in these anterior BST nuclei may also stimulate the HPA axis (Forray and Gysling, 2004). Thus, CRH-expressing central amygdalar neurons (Champagne et al., 1998) may activate the HPA axis by connecting with the dorsomedial/fusiform BST nuclei (Prewitt and Herman, 1998) that express CRH/Glu to form an excitatory, bisynaptic CRH–CRH/Glu signal to the PVNmp (Paull and Gibbs, 1983; Silverman et al., 1989). Alternatively, the central nucleus of the amygdala may stimulate HPA activation (Van de Kar et al., 1991; Buller and Day, 2002) via GABA–GABA transsynaptic disinhibition (Cullinan et al., 1993) (Fig. 11). The dorsomedial/fusiform nuclei also receive moderate projections from the infralimbic cortex (Dong et al., 2001; Vertes, 2004). Recent evidence indicates that the infralimbic cortex activates the HPA axis (Radley et al., 2006) and may do so potentially through a bisynaptic glutamate–CRH/glutamate signal via the dorsomedial/fusiform BST nuclei (Fig. 11). Together, the data suggest that activation of PVN neurons by the dorsomedial/fusiform nuclei may involve either direct excitation (by CRH/glutamate-expressing neurons) or disinhibition (through inhibition of PVN-projecting GABAergic neurons).
Perspectives
Functional evidence from this study demonstrates that the BST is a major modulator of HPA stress responses, presumably via integration of forebrain and limbic information communicated after exposure to stress. Some of the possible, main BST pathways mediating this integration are summarized in a simplified diagram (Fig. 11). There is a compelling case to be made that the posterior BST mediates GABAergic inhibition of HPA responses. Lesion-induced disinhibition is observed at all levels of the HPA axis, including secretagogue mRNA synthesis. The preferential innervation of this damaged region by the medial amygdala and ventral subiculum suggests that the principal nucleus is associated with anticipatory stress responses keyed by activation of limbic structures by stressful stimuli. In contrast, the dorsomedial/fusiform nuclei of the BST stimulate stress-induced HPA activation, perhaps via CRH/glutamate projections to the PVN. In combination with the rich innervation of these regions by limbic–autonomic regulatory structures, such as the central amygdala and infralimbic cortex, it is possible that this excitation may be at least in part attributable to peripheral sympathetic activation of the adrenal. Overall, the data support a marked heterogeneity of BST nuclei in stress integration and underscore the need to understand the role of the BST in normal and abnormal stress regulatory processes.
Footnotes
This study was supported by National Institutes of Health Grants MH49698 (J.P.H.), DA16466 (M.M.O.), DK67820 (Y.M.U.-L.), NS07453 (N.K.E.), and DK59803 (A.R.F.). Special thanks to Charles Dolgas, Jenny Gibson, Kenny Jones, Dr. Nancy Mueller, Mary Nguyen, Ben Packard, Dr. Kellie Tamashiro, Dr. Miyuki Tauchi, Ingrid Thomas, and Daniella Van Hooren for their technical assistance in this study. We also thank Dr. Michael Behbehani for the use of microscopic and surgical equipment.
References
- Allen JP, Allen CF. Role of the amygdaloid complexes in the stress-induced release of ACTH in the rat. Neuroendocrinology. 1974;15:220–230. doi: 10.1159/000122310. [DOI] [PubMed] [Google Scholar]
- Beaulieu S, Di Paolo T, Barden N. Control of ACTH secretion by the central nucleus of the amygdala: implication of the serotoninergic system and its relevance to the glucocorticoid delayed negative feedback mechanism. Neuroendocrinology. 1986;44:247–254. doi: 10.1159/000124652. [DOI] [PubMed] [Google Scholar]
- Bowers G, Cullinan WE, Herman JP. Region-specific regulation of glutamic acid decarboxylase (GAD) mRNA expression in central stress circuits. J Neurosci. 1998;18:5938–5947. doi: 10.1523/JNEUROSCI.18-15-05938.1998. [DOI] [PMC free article] [PubMed] [Google Scholar]
- Buller KM, Day TA. Systemic administration of interleukin-1beta activates select populations of central amygdala afferents. J Comp Neurol. 2002;452:288–296. doi: 10.1002/cne.10389. [DOI] [PubMed] [Google Scholar]
- Canteras NS, Swanson LW. Projections of the ventral subiculum to the amygdala, septum, and hypothalamus: a PHAL anterograde tract-tracing study in the rat. J Comp Neurol. 1992;324:180–194. doi: 10.1002/cne.903240204. [DOI] [PubMed] [Google Scholar]
- Canteras NS, Simerly RB, Swanson LW. Organization of projections from the medial nucleus of the amygdala: a PHAL study in the rat. J Comp Neurol. 1995;360:213–245. doi: 10.1002/cne.903600203. [DOI] [PubMed] [Google Scholar]
- Casada JH, Dafny N. Restraint and stimulation of the bed nucleus of the stria terminalis produce similar stress-like behaviors. Brain Res Bull. 1991;27:207–212. doi: 10.1016/0361-9230(91)90069-v. [DOI] [PubMed] [Google Scholar]
- Champagne D, Beaulieu J, Drolet G. CRFergic innervation of the paraventricular nucleus of the rat hypothalamus: a tract-tracing study. J Neuroendocrinol. 1998;10:119–131. doi: 10.1046/j.1365-2826.1998.00179.x. [DOI] [PubMed] [Google Scholar]
- Crane JW, Buller KM, Day TA. Evidence that the bed nucleus of the stria terminalis contributes to the modulation of hypophysiotropic corticotropin-releasing factor cell responses to systemic interleukin-1beta. J Comp Neurol. 2003;467:232–242. doi: 10.1002/cne.10918. [DOI] [PubMed] [Google Scholar]
- Cullinan WE, Herman JP, Watson SJ. Ventral subicular interaction with the hypothalamic paraventricular nucleus: evidence for a relay in the bed nucleus of the stria terminalis. J Comp Neurol. 1993;332:1–20. doi: 10.1002/cne.903320102. [DOI] [PubMed] [Google Scholar]
- Cullinan WE, Herman JP, Battaglia DF, Akil H, Watson SJ. Pattern and time course of immediate early gene expression in rat brain following acute stress. Neuroscience. 1995;64:477–505. doi: 10.1016/0306-4522(94)00355-9. [DOI] [PubMed] [Google Scholar]
- Dong HW, Swanson LW. Projections from bed nuclei of the stria terminalis, posterior division: implications for cerebral hemisphere regulation of defensive and reproductive behaviors. J Comp Neurol. 2004;471:396–433. doi: 10.1002/cne.20002. [DOI] [PubMed] [Google Scholar]
- Dong HW, Swanson LW. Projections from bed nuclei of the stria terminalis, dorsomedial nucleus: implications for cerebral hemisphere integration of neuroendocrine, autonomic, and drinking responses. J Comp Neurol. 2006;494:75–107. doi: 10.1002/cne.20790. [DOI] [PMC free article] [PubMed] [Google Scholar]
- Dong HW, Petrovich GD, Watts AG, Swanson LW. Basic organization of projections from the oval and fusiform nuclei of the bed nuclei of the stria terminalis in adult rat brain. J Comp Neurol. 2001;436:430–455. doi: 10.1002/cne.1079. [DOI] [PubMed] [Google Scholar]
- Dunn JD. Plasma corticosterone responses to electrical stimulation of the bed nucleus of the stria terminalis. Brain Res. 1987;407:327–331. doi: 10.1016/0006-8993(87)91111-5. [DOI] [PubMed] [Google Scholar]
- Feldman S, Conforti N, Saphier D. The preoptic area and bed nucleus of the stria terminalis are involved in the effects of the amygdala on adrenocortical secretion. Neuroscience. 1990;37:775–779. doi: 10.1016/0306-4522(90)90107-f. [DOI] [PubMed] [Google Scholar]
- Feldman S, Conforti N, Itzik A, Weidenfeld J. Differential effect of amygdaloid lesions on CRF-41, ACTH and corticosterone responses following neural stimuli. Brain Res. 1994;658:21–26. doi: 10.1016/s0006-8993(09)90005-1. [DOI] [PubMed] [Google Scholar]
- Forray MI, Gysling K. Role of noradrenergic projections to the bed nucleus of the stria terminalis in the regulation of the hypothalamic-pituitary-adrenal axis. Brain Res Brain Res Rev. 2004;47:145–160. doi: 10.1016/j.brainresrev.2004.07.011. [DOI] [PubMed] [Google Scholar]
- Gray TS, Carney ME, Magnuson DJ. Direct projections from the central amygdaloid nucleus to the hypothalamic paraventricular nucleus: possible role in stress-induced adrenocorticotropin release. Neuroendocrinology. 1989;50:433–446. doi: 10.1159/000125260. [DOI] [PubMed] [Google Scholar]
- Gray TS, Piechowski RA, Yracheta JM, Rittenhouse PA, Bethea CL, Van de Kar LD. Ibotenic acid lesions in the bed nucleus of the stria terminalis attenuate conditioned stress-induced increases in prolactin, ACTH and corticosterone. Neuroendocrinology. 1993;57:517–524. doi: 10.1159/000126400. [DOI] [PubMed] [Google Scholar]
- Gu G, Cornea A, Simerly RB. Sexual differentiation of projections from the principal nucleus of the bed nuclei of the stria terminalis. J Comp Neurol. 2003;460:542–562. doi: 10.1002/cne.10677. [DOI] [PubMed] [Google Scholar]
- Herman JP, Schafer MK, Young EA, Thompson R, Douglass J, Akil H, Watson SJ. Evidence for hippocampal regulation of neuroendocrine neurons of the hypothalamo-pituitary-adrenocortical axis. J Neurosci. 1989;9:3072–3082. doi: 10.1523/JNEUROSCI.09-09-03072.1989. [DOI] [PMC free article] [PubMed] [Google Scholar]
- Herman JP, Schafer MK, Watson SJ, Sherman TG. In situ hybridization analysis of arginine vasopressin gene transcription using intron-specific probes. Mol Endocrinol. 1991;5:1447–1456. doi: 10.1210/mend-5-10-1447. [DOI] [PubMed] [Google Scholar]
- Herman JP, Cullinan WE, Watson SJ. Involvement of the bed nucleus of the stria terminalis in tonic regulation of paraventricular hypothalamic CRH and AVP mRNA expression. J Neuroendocrinol. 1994;6:433–442. doi: 10.1111/j.1365-2826.1994.tb00604.x. [DOI] [PubMed] [Google Scholar]
- Herman JP, Figueiredo H, Mueller NK, Ulrich-Lai Y, Ostrander MM, Choi DC, Cullinan WE. Central mechanisms of stress integration: hierarchical circuitry controlling hypothalamo-pituitary-adrenocortical responsiveness. Front Neuroendocrinol. 2003;24:151–180. doi: 10.1016/j.yfrne.2003.07.001. [DOI] [PubMed] [Google Scholar]
- Herman JP, Mueller NK, Figueiredo H. Role of GABA and glutamate circuitry in hypothalamo-pituitary-adrenocortical stress integration. Ann NY Acad Sci. 2004;1018:35–45. doi: 10.1196/annals.1296.004. [DOI] [PubMed] [Google Scholar]
- Herman JP, Ostrander MM, Mueller NK, Figueiredo H. Limbic system mechanisms of stress regulation: hypothalamo-pituitary-adrenocortical axis. Prog Neuropsychopharmacol Biol Psychiatry. 2005;29:1201–1213. doi: 10.1016/j.pnpbp.2005.08.006. [DOI] [PubMed] [Google Scholar]
- Imaki T, Shibasaki T, Hotta M, Demura H. Early induction of c-fos precedes increased expression of corticotropin-releasing factor messenger ribonucleic acid in the paraventricular nucleus after immobilization stress. Endocrinology. 1992;131:240–246. doi: 10.1210/endo.131.1.1612001. [DOI] [PubMed] [Google Scholar]
- Imaki T, Shibasaki T, Hotta M, Demura H. Intracerebroventricular administration of corticotropin-releasing factor induces c-fos mRNA expression in brain regions related to stress responses: comparison with pattern of c-fos mRNA induction after stress. Brain Res. 1993;616:114–125. doi: 10.1016/0006-8993(93)90199-w. [DOI] [PubMed] [Google Scholar]
- Jasper MS, Engeland WC. Synchronous ultradian rhythms in adrenocortical secretion detected by microdialysis in awake rats. Am J Physiol. 1991;261:R1257–R1268. doi: 10.1152/ajpregu.1991.261.5.R1257. [DOI] [PubMed] [Google Scholar]
- Ju G, Swanson LW, Simerly RB. Studies on the cellular architecture of the bed nuclei of the stria terminalis in the rat. II. Chemoarchitecture. J Comp Neurol. 1989;280:603–621. doi: 10.1002/cne.902800410. [DOI] [PubMed] [Google Scholar]
- Kasckow JW, Baker D, Geracioti TD., Jr Corticotropin-releasing hormone in depression and post-traumatic stress disorder. Peptides. 2001;22:845–851. doi: 10.1016/s0196-9781(01)00399-0. [DOI] [PubMed] [Google Scholar]
- Kovacs KJ, Sawchenko PE. Sequence of stress-induced alterations in indices of synaptic and transcriptional activation in parvocellular neurosecretory neurons. J Neurosci. 1996;16:262–273. doi: 10.1523/JNEUROSCI.16-01-00262.1996. [DOI] [PMC free article] [PubMed] [Google Scholar]
- McEwen BS. Stress, adaptation, and disease. Allostasis and allostatic load. Ann NY Acad Sci. 1998;840:33–44. doi: 10.1111/j.1749-6632.1998.tb09546.x. [DOI] [PubMed] [Google Scholar]
- Ostrander MM, Ulrich-Lai YM, Choi DC, Richtand NM, Herman JP. Hypoactivity of the hypothalamo-pituitary-adrenocortical axis during recovery from chronic variable stress. Endocrinology. 2006;147:2008–2017. doi: 10.1210/en.2005-1041. [DOI] [PMC free article] [PubMed] [Google Scholar]
- Parkes D, Rivest S, Lee S, Rivier C, Vale W. Corticotropin-releasing factor activates c-fos, NGFI-B, and corticotropin-releasing factor gene expression within the paraventricular nucleus of the rat hypothalamus. Mol Endocrinol. 1993;7:1357–1367. doi: 10.1210/mend.7.10.8264665. [DOI] [PubMed] [Google Scholar]
- Paull WK, Gibbs FP. The corticotropin releasing factor (CRF) neurosecretory system in intact, adrenalectomized, and adrenalectomized-dexamethasone treated rats. An immunocytochemical analysis. Histochemistry. 1983;78:303–316. doi: 10.1007/BF00496618. [DOI] [PubMed] [Google Scholar]
- Paxinos G, Watson C. Ed 4. San Diego: Academic; 1998. The rat brain in stereotaxic coordinates. [DOI] [PubMed] [Google Scholar]
- Phelix CF, Paull WK. Demonstration of distinct corticotropin releasing factor-containing neuron populations in the bed nucleus of the stria terminalis. A light and electron microscopic immunocytochemical study in the rat. Histochemistry. 1990;94:345–364. doi: 10.1007/BF00266441. [DOI] [PubMed] [Google Scholar]
- Prewitt CM, Herman JP. Anatomical interactions between the central amygdaloid nucleus and the hypothalamic paraventricular nucleus of the rat: a dual tract-tracing analysis. J Chem Neuroanat. 1998;15:173–185. doi: 10.1016/s0891-0618(98)00045-3. [DOI] [PubMed] [Google Scholar]
- Radley JJ, Arias CM, Sawchenko PE. Regional differentiation of the medial prefrontal cortex in regulating adaptive responses to acute emotional stress. J Neurosci. 2006;26:12967–12976. doi: 10.1523/JNEUROSCI.4297-06.2006. [DOI] [PMC free article] [PubMed] [Google Scholar]
- Sapolsky RM, Krey LC, McEwen BS. Glucocorticoid-sensitive hippocampal neurons are involved in terminating the adrenocortical stress response. Proc Natl Acad Sci USA. 1984;81:6174–6177. doi: 10.1073/pnas.81.19.6174. [DOI] [PMC free article] [PubMed] [Google Scholar]
- Sawchenko PE, Swanson LW. The organization of forebrain afferents to the paraventricular and supraoptic nuclei of the rat. J Comp Neurol. 1983;218:121–144. doi: 10.1002/cne.902180202. [DOI] [PubMed] [Google Scholar]
- Sawchenko PE, Swanson LW, Steinbusch HW, Verhofstad AA. The distribution and cells of origin of serotonergic inputs to the paraventricular and supraoptic nuclei of the rat. Brain Res. 1983;277:355–360. doi: 10.1016/0006-8993(83)90945-9. [DOI] [PubMed] [Google Scholar]
- Silverman AJ, Hou-Yu A, Chen WP. Corticotropin-releasing factor synapses within the paraventricular nucleus of the hypothalamus. Neuroendocrinology. 1989;49:291–299. doi: 10.1159/000125131. [DOI] [PubMed] [Google Scholar]
- Swanson LW. Ed 2. Amsterdam: Elsevier; 1998. Brain maps: structure of the rat brain. [Google Scholar]
- Ulrich-Lai YM, Arnhold MM, Engeland WC. Adrenal splanchnic innervation contributes to the diurnal rhythm of plasma corticosterone in rats by modulating adrenal sensitivity to ACTH. Am J Physiol Regul Integr Comp Physiol. 2006;290:R1128–R1135. doi: 10.1152/ajpregu.00042.2003. [DOI] [PubMed] [Google Scholar]
- Van de Kar LD, Piechowski RA, Rittenhouse PA, Gray TS. Amygdaloid lesions: differential effect on conditioned stress and immobilization-induced increases in corticosterone and renin secretion. Neuroendocrinology. 1991;54:89–95. doi: 10.1159/000125856. [DOI] [PubMed] [Google Scholar]
- Vertes RP. Differential projections of the infralimbic and prelimbic cortex in the rat. Synapse. 2004;51:32–58. doi: 10.1002/syn.10279. [DOI] [PubMed] [Google Scholar]
- Zhu W, Umegaki H, Suzuki Y, Miura H, Iguchi A. Involvement of the bed nucleus of the stria terminalis in hippocampal cholinergic system-mediated activation of the hypothalamo–pituitary–adrenocortical axis in rats. Brain Res. 2001;916:101–106. doi: 10.1016/s0006-8993(01)02871-2. [DOI] [PubMed] [Google Scholar]