

Abstract
Developmental processes mediating the initiation of lineage commitment from self-renewing neural stem cells (NSCs) remain mostly unclear because of the persisting ambiguity in identifying true NSCs from proliferative lineage-restricted progenitors (LRPs), which are directly or indirectly derived from NSCs. Our multilineage immunohistochemical analyses of early embryonic rat telencephalon at the onset of neurogenesis revealed clear dorsoventral gradients in the emergence of two types of neuronal progenitors (NPs) from multilineage-negative NSCs. Enumeration of NSCs using comprehensive flow cytometric analysis demonstrated that their precipitous decline in vivo involved both active differentiation into NPs and an increased propensity toward apoptosis. Both processes paralleled the dorsoventral changes in fibroblast growth factor receptor (FGFR) expressions. NSCs residing in the dorsal telencephalon coexpressed FGFR1 and FGFR3, whereas those residing in the ventral telencephalon also expressed FGFR2. NSCs exposed to basic fibroblast growth factor (bFGF) in vitro generated four stereotypical clonal expansion states: efficiently self-renewing, inefficiently self-renewing limited by apoptosis, exclusively neurogenic, and multipotential, generating up to five types of LRPs. The plasticity among these expansion states depended on ambient [bFGF], telencephalic developmental stage, and differential activation/inactivation of specific FGFRs. Coactivation of FGFR1 and FGFR3 promoted symmetrical divisions of NSCs (self-renewal), whereas inactivation of either triggered asymmetrical divisions and neurogenesis from these cells. Developmental upregulation of FGFR2 expression correlated with a shift of NSCs into a multipotential state or apoptosis. These results provide new insights regarding the roles of FGFRs in diversification of NSC properties and initiation of neural lineage-restricted differentiation.
Keywords: rat, cortical, development, neural stem cells, progenitors, flow cytometry
Introduction
The complex biology of neurogenesis in the cerebral cortex deduced from lineage tracing in vivo and from time-lapse imaging of tissue slices and clonal cell cultures in vitro has been reviewed extensively (Gotz and Huttner, 2005; Guillemot, 2005; Huttner and Kosodo, 2005; Mori et al., 2005). Simplified neurogenic lineage progressions have been proposed from neuroepithelial precursors (NEPs), which are presumed to be neural stem cells (NSCs) capable of self-renewal via symmetrical divisions and either unipotent or multipotent differentiation via asymmetrical divisions. According to these models, NSCs first generate neurons directly, then indirectly via basal progenitors (BPs), and subsequently via radial glial progeny, which themselves either self-renew or divide asymmetrically to generate neurons or BPs. Neurogenesis from BPs and radial glia has been demonstrated experimentally, but the initiation of direct and indirect neurogenic progressions from NSCs, the lineal relationships between them and the underlying cellular and molecular mechanisms remain to be elucidated.
One proposed mechanism critical to NSC biology involves the activity of basic fibroblast growth factor (bFGF) because transgenic mice devoid of bFGF are missing half the NEP population when neurogenesis begins, subsequently leading to a dramatic decrease of glutamatergic cortical neurons in the adult brain (Vaccarino et al., 1999; Raballo et al., 2000; Korada et al., 2002). A similar phenotype occurs when NEPs conditionally over-express a tyrosine kinase domain-deficient FGF receptor (Fgfr1) gene (Shin et al., 2004), thus implicating bFGF/FGFR1-mediated signaling in NEP expansion and, in time, generation of glutamatergic neurons. Other studies have shown that NEPs in the murine cortex express FGFRs 1–3 and that bFGF differentially regulates NEP commitment to neuronal and oligodendroglial lineages in vitro (Qian et al., 1997). However, the NEP preparations used in these studies were unpurified and intrinsically heterogeneous, composed not only of NSCs, but also of their differentiating progeny, the lineage-restricted progenitors (LRPs), so it remains unclear which FGFRs are expressed by NSCs, and whether their activation/inactivation regulates NSC self-renewal and/or neurogenic differentiation.
Elucidating the roles of bFGF/FGFRs in developmental potentials of NSCs necessarily requires the prospective identification and isolation of these cells from different types of LRPs. However, unique marker(s) for NSCs have not yet been identified. Our working hypothesis has been that the NSCs do not express any of the markers identifying their lineage-restricted progeny and are, thus, multilineage-negative. Therefore, we have combined a comprehensive nine-marker lineage-identification strategy and fluorescence-activated cell sorting to isolate multilineage-negative NSCs from the embryonic rat telencephalon at the onset of cortical neurogenesis. These NSCs, exhaustively depleted of endogenous neural and non-neural LRPs and their postmitotic counterparts, exhibited four stereotypical clonal expansion states in vitro that included (1) efficiently self-renewing, without differentiation or apoptosis, (2) inefficiently self-renewing limited by frequent apoptosis, (3) exclusively neurogenic, and (4) multipotential with sequential production of up to five lineage-restricted neural phenotypes. These seminal properties of NSCs depended on telencephalic developmental stage, ambient bFGF concentration, and activation/inactivation of specific FGFRs. The results reveal an intriguing and unexpected complexity in the seminal biology of NSCs at the onset of cortical neurogenesis.
Materials and Methods
Animal, tissue, and cell preparations
The research was performed in compliance with the Animal Welfare Act and the Public Health Service Policy on Humane Care and Use of Laboratory Animals, and was approved by the National Institute of Neurological Disorders and Stroke Animal Care and Use Committee.
Tissue preparation.
Telencephalic tissues microdissected from embryonic day 13 (E13) Sprague Dawley rat embryos (Taconic Farms, Germantown, NY) were used as a primary source of NSCs for fluorescence-activated cell sorting (FACS) and for organotypic cultures and immunohistochemistry. Before processing for immunohistochemistry, the embryos were fixed in 4% paraformaldehyde (PF) for 2 h, cryoprotected in 30% sucrose for 3–5 d at 4°C, and frozen in liquid nitrogen-cooled isopentane (Fisher Scientific, Fair Lawn, NJ). Eight-micrometer-thick sagittal sections of the telencephalon were cut using an outsourced vendor (Histoserv, Germantown, MD). The sections were stored at −20°C and air dried at room temperature (RT) for 1 h before multiepitope, multicolor staining.
Cell preparation.
Fresh telencephalic tissues were first microdissected along a dorsoventral plane into dorsal telencephalic (DTC) and ventral telencephalic (VTC) preparations. Cells were dissociated using a brief papain-digestion protocol, which was previously optimized for maximum cell recovery (Maric et al., 1997, 1998). During FACS analysis and sorting, the cells were maintained in a normal physiological medium (NPM) supplemented with 1 mg/ml bovine serum albumin. NPM consisted of the following (in mm): 145 NaCl, 5 KC1, 1.8 CaCl2, 0.8 MgCl2, 10 glucose, and 10 HEPES (all from Sigma, St. Louis, MO), with pH and osmolarity adjusted to 7.3 and 290 mOsm, respectively.
Cell and tissue culture conditions
Clonal cell cultures.
NSCs were plated at clonal cell densities (1 × 10³ cells/cm2) on poly-d-lysine (Sigma)-coated and bovine plasma fibronectin (Life Technologies, Frederick, MD)-coated coverslips, which were photo-etched with an α-numeric grid (Bellco Glass, Vineland, NJ) and preglued to 35 mm tissue culture dishes (MatTek, Ashland, MA). The α-numeric grid facilitated repeated relocation of the same fields of interest during sequential rounds of multiepitope staining and photobleaching protocols (see below) (Table 1) and was instrumental in the subsequent identification and enumeration of cell progeny derived from each clonally expanded NSC, using an all-inclusive epitope expression matrix code (Table 2). NSCs were cultured for 7 d in neurobasal medium supplemented with 1× working stock of B27 additives (Life Technologies) and 10 ng/ml human recombinant bFGF (Intergen, Purchase, NY). In some experiments, the concentration of bFGF in the culture medium was varied from low (0.01–2 ng/ml) to high (5–200 ng/ml) levels to investigate possible differential effects on the developmental potentials of individual NSCs. Clonal expansion of individual NSCs was followed on a daily basis using phase-contrast optics of an Axiovert 200 inverted microscope (Carl Zeiss, Thornwood, NY).
Table 1.
Primary and secondary reagents/reactions used to identify neural and non-neural cell phenotypes in the developing rat telencephalon
| Cell phenotype | Primary reagent/reaction | Secondary reagent/reaction |
|---|---|---|
| NSCs/LRPs | Ms IgG1 anti-Nestina | Gt anti-Ms IgG1-FITCi |
| Ms IgG1 anti-Vimentinb | Gt anti-Ms IgG1-AF 488i | |
| Ckn IgY anti-Vimentinb | Dnk anti-Ckn IgY-Cy5k | |
| Gp IgG anti-GLASTb | Dnk anti-Gp IgG-AMCAk | |
| NGPs/NPs | Ms IgM anti-A2B5-PEf | |
| Ms IgM anti-A2B5b | Gt anti-Ms IgM-PEk | |
| Ms IgM anti-JONESc | Gt anti-Ms IgM-PEk | |
| NPs/neurons | ChTx-FITCc | |
| ChTx-Biotinc | SA-PE/Cy5l | |
| TnTxd/Ms IgG1 anti-TnTxd | Gt anti-Ms IgG1-AF 647i | |
| TnTxd/Ms IgG2b anti-TnTxe | Gt anti-Ms IgG2b-PE/Cy5l | |
| Ms IgG2b anti-TUJ1c | Gt anti-Ms IgG2b-AF 647i | |
| Oligodendrocytes | Ms IgM anti-O4-FITCf | |
| Ms IgM anti-O4b | Gt anti-Ms IgM-PEk | |
| Ms IgG3 anti-GalCb | Gt anti-Ms IgG3-FITCl | |
| Astrocytes | Ms IgG2a anti-rat CD44g | Gt anti-Ms IgG2a-PE/TRl |
| Rb IgG anti-GFAPb | Gt anti-Rb-IgG-AF 750i | |
| Microglia | Ms IgG2a anti-rat CD11bg | Gt anti-Ms IgG2a-PE/TRl |
| Fibroblasts | Ms IgG2a anti-rat CD44g | Gt anti-Ms IgG2a-PE/TRl |
| Endothelial cells | Ms IgG1 anti-rat CD31-FITCg | |
| Ms IgG1 anti-rat CD31-PEh | ||
| Ms igG1 anti-rat CD31b | Gt anti-Ms IgG1-AF 488i | |
| Proliferating cells | Ms IgG2a anti-PCNAb | Gt anti-Ms IgG2a-biotink/SA-AF 750i |
| Ms IgG2a anti-PCNAb | Gt anti-Ms IgG2a-AF 488i | |
| Apoptotic/necrotic | Annexin V-AF 350i | |
| TdTj/dNTP-biotinj | TUNELl/SA-PEl |
Abbreviations are defined as follows (in alphabetical order): A2B5, an antibody selective for GQ1c, GT3, and GD3 gangliosides; AF, Alexa Fluor; CD11b, cluster differentiation antigen 11b (clone OX42); Ckn, chicken; ChTx, cholera toxin B subunit that binds to GM1 gangliosides; dNTP-biotin, biotinylated nucleotides; Dnk, donkey; FITC, fluoresceinisothiocyanate; Gt, goat; Gp, guinea pig; Ms, mouse; O4 antigen, a marker of pro-oligodendrocytes; PE, Phycoerythrin; PE/Cy5, Phycoerythrin/Carbocyanine dye 5 tandem conjugate; PE/TR, Phycoerythrin/Texas Red tandem conjugate; Rb, rabbit; TnTx, recombinant tetanus toxin fragment C that binds to GT1b gangliosides.
Sources of antibodies/reagents
aDepartment of Biological Sciences, University of Iowa, Iowa City, IA
bMillipore, Temecula, CA
cSigma
dRoche Diagnostics, Indianapolis, IN
eDr. William Habig, Food and Drug Administration, Bethesda, MD
fDr. Rick I. Cohen, Coriell Institute for Medical Research, Camden, NJ
gSerotec, Raleigh, NC
hBecton Dickinson Biosciences
iInvitrogen
jTrevigen, Gaithersburg, MD
kJackson ImmunoResearch Laboratories, West Grove, PA
lCaltag Laboratories, Burlingame, CA.
Table 2.
Multiepitope identification code of neural cell phenotypes in the early embryonic rat telencephalon
| Cell phenotype | Morphology | PCNA | TUNEL | GLAST | Nestin | Vimentin | JONES | CHTX | TUJ1 | GFAP |
|---|---|---|---|---|---|---|---|---|---|---|
| Individual cells | ||||||||||
| GLAST− NSC | Epithelioid | + or − | + or − | − | + | + | − | − | − | − |
| GLAST+ NSC | Epithelioid | + or − | + or − | + | + | + | − | − | − | − |
| JONES+ NGP | Radia | + or − | + or − | + | + | + | + | − | − | − |
| JONES+ NP | Complex | + or − | + or − | + or − | + or − | + or − | + | + | + | − |
| JONES− NP | Complex | + or − | + or − | − | + or − | + or − | − | + | + | − |
| Radial glia | Radial | + or − | + or − | + | + | + | − | − | − | + or − |
| Astrocyte | Flat | + or − | + or − | + | + | + | − | − | − | + |
| Clonal NSC expansion states | ||||||||||
| GLAST− | ||||||||||
| ESR | Epithelioid | >60% | <2% | <5% | + | + | − | − | − | − |
| ISR | Mixed | <15% | >60% | <5% | + | + | − | − | − | − |
| NG | Mixed | <20% | <20% | <5% | + | + | − | + | + | − |
| TRANS-GLAST+ | ||||||||||
| ESR | Epithelioid | >60% | <2% | 5–95% | + | + | − | − | − | − |
| GLAST+ | ||||||||||
| ESR | Epithelioid | >60% | <2% | >95% | + | + | − | − | − | − |
| NG | Mixed | <20% | <20% | 5–95% | + | + | − | + | + | − |
| MP | Mixed | <40% | <20% | 5–95% | + | + | + | + | + | + |
The table indexes a multiepitope identification code used to classify and enumerate the clonally expanded progeny of FACS-purified NSCs (see Materials and Methods). The code was empirically determined using a multilabeling protocol that included seven lineage-selective markers (i.e., GLAST, nestin, vimentin, JONES, CHTX, TUJ1, GFAP), anti-PCNA and TUNEL reactions to identify proliferating and apoptotic cells, respectively, and DAPI to facilitate enumeration of total cells per clone. Individual cells were classified as GLAST− or GLAST+ NSCs, JONES+ neuroglial progenitors (NGPs), JONES− or JONES+ NPs, radial glia, or astrocytes. Phenotyping of each clone enabled classification of initially plated NSCs into four generic expansion states: ESR, ISR/proapoptotic, NG, or MP, as specified above and illustrated by representative examples in Figure 3.
Organotypic tissue cultures.
DTC explants were microdissected along a dorsoventral plane and cultured intact for 48 h in neurobasal-B27 medium supplemented with 10 ng/ml bFGF. Some explants were treated over 48 h using selective antisense-targeting of FGFRs or a pan-FGFR tyrosine kinase inhibitor, 1-tert-Butyl-3-[6-(3,5-dimetoxy-phenyl)-2-(4-diethylamino-butylamino) pyrido [2,3-d] pyrimidin-7-yl]-urea (PD173074) (Parke Davis, Ann Arbor, MI), as described below.
Multiepitope, multicolor labeling of tissue sections and cells
We custom-designed novel multiepitope, multicolor staining protocols to identify specific neural and non-neural cell phenotypes and their proliferating, differentiating and apoptotic compartments, in cortical tissues, in single-cell dissociates and in cultured clonally expanded progeny of sort-purified NSCs. All labeling reactions were first optimized using “simple” single color staining of positive controls. Each reaction was titrated to obtain the maximum specific signal with minimal nonspecific background. The protocols were standardized using 1 μg of primary and/or secondary reagent per milliliter of reaction mixture for labeling cells in cultures or in tissue sections, or 1 μg of reagent per 106 cells for labeling single-cell suspensions before FACS analysis and cell sorting. Whenever possible, subtype-specific (i.e., IgG1, IgG2a, IgG2b, IgG3) monoclonal primary and appropriate fluorochrome-conjugated secondary antibodies were used to prevent or minimize any nonselective cross-reactivity. In protocols using primary antibodies of the same class or subclass and host (i.e., two mouse IgG1 s), each of the antibodies was first prelabeled with appropriate fluorochrome-conjugated goat anti-host IgG Fab monovalent fragments using the Zenon labeling technology (Invitrogen, Carlsbad, CA), according to the manufacturer's specifications.
Immunohistochemistry
Identification of neural cell lineages.
Sagittal sections were labeled using the following lineage-selective markers (Table 1): anti-vimentin-Alexa Fluor 488, anti-9-O-acetylated GD3 ganglioside (JONES)-PE, anti-tubulin β III (TUJ1)-Alexa Fluor 647 and anti-proliferation cell nuclear antigen (PCNA)-Alexa Fluor 750. The sections were then counterstained with 1 μg/ml 4,6-diamidino-2-phenylindole (DAPI).
Localization of bFGF and FGFRs1–3.
Sagittal sections were first immunoreacted for 1 h at RT using a mixture of Alexa Fluor 488-preconjugated (Zenon labeled) mouse IgG1 anti-FGFR1 (Upstate, Waltham, MA), mouse monoclonal IgG2b anti-FGFR2, rabbit polyclonal IgG anti-FGFR3 (Santa Cruz Biotechnology, Santa Cruz, CA), and biotin-preconjugated (Zenon labeled) mouse monoclonal IgG1 anti-bFGF (Upstate). The latter three were visualized using goat anti-mouse IgG2b-Alexa Fluor 546, goat anti-rabbit IgG-Alexa Flour 647, and Alexa Fluor 750-conjugated streptavidin (all from Invitrogen) and the sections counterstained with DAPI.
Immunophenotyping of cells in suspension and cell sorting
For cell sorting experiments, we microdissected the telencephalon along a dorsoventral plane into DTC and VTC regions, then dissociated the tissues into single-cell suspensions and labeled the cells with nine surface markers to identify virtually all resident neural and non-neural populations (see below). This labeling method is an extension of those detailed previously in original publications using up to five surface markers to identify neural cell lineages and apoptotic cells in the developing cortex (Maric et al., 2000, 2001, 2003; Maric and Barker, 2005).
Multilineage surface-epitope labeling for FACS analysis and sorting.
Cells were surface-labeled using optimized mixtures of the following lineage-selective markers (for reagent list, material sources, acronym designations and target specificity, see Table 1): anti-A2B5-PE, JONES-PE, anti-O4-PE, CHTX-PE/Cy5, anti-TNTX-PE/Cy5, anti-rat CD44-PE/TR, anti-rat CD11b (OX42)-PE/TR, anti-rat CD31-FITC, ansd annexin V-Alexa Fluor 350. After surface labeling, vital NSCs were physically sort-purified using the FACSVantage SE flow cytometer (Becton Dickinson, Mountain View, CA) by applying a multilineage-negative cell sorting protocol. Briefly, the fluorescence signals emitted by FITC, PE, PE/TR, and PE/Cy5 on individual cells were excited using an argon-ion laser tuned to 488 nm and the resulting fluorescence emissions collected using bandpass filters set at 530 ± 30, 575 ± 25, 613 ± 20, and 675 ± 20 nm, respectively. Alexa Fluor 350 signals were excited using a broad UV (351–364 nm) laser light and the resulting emission signals captured with a bandpass filter set at 440 ± 20 nm. Cell Quest Acquisition and Analysis software (Becton Dickinson) was used to acquire and quantify the fluorescence signal distributions and intensities from individual cells, to electronically compensate spectral overlap of individual fluorophores and to set compound logical electronic gates used for cell analysis and sorting. Vital NSCs from both DTC and VTC dissociates were identified and sorted as a nontuple-negative population (A2B5−JONES−O4−CHTX−TNTX−CD44−CD11b−CD31−annexin V−), thereby excluding all other neural and non-neural LRPs and their apoptotic subpopulations. FACS reanalysis of NSCs after sorting consistently showed >97% viability and >99% purity of these cells.
Detection of bFGF, FGFR, and GLAST expressions in sorted NSCs.
NSCs were acutely plated at a moderate cell density (1 × 10⁵ cells/cm2) on poly-d-lysine- and bovine plasma fibronectin-coated coverslips and allowed to adhere for 1 h at 37°C in NPM/BSA. The cells were immunostained for bFGF and FGFRs 1–3 using the same protocol detailed above for tissue sections. To further resolve the possible heterogeneity within the NSC population, the cells were additionally immunoreacted with 1 μg/ml guinea pig IgG anti-glutamate-aspartate transporter (GLAST) antibody, and visualized using 1 μg/ml donkey anti-guinea pig IgG-aminomethylcoumarin (AMCA) antibody (Table 1). Each staining reaction was then imaged using the appropriate optical setting of an Axiovert 200 fluorescence microscope. After imaging, the AMCA fluorescence was completely photobleached by continuously illuminating the same field of cells using UV light filtered at 350 nm, until the AMCA signal became undetectable (typically within 5 min). The cells were then counterstained with 10 μg/ml of DAPI and the same fields of cells that were imaged previously for bFGF/FGFRs/GLAST expression were relocated using the α-numeric grid and then reimaged for DAPI.
Immunocytochemistry in culture
Cell progeny of clonally expanded NSCs were immunoidentified after 7 d in culture by applying a novel 11-marker, multiepitope staining protocol involving four rounds of sequential labeling-imaging-photobleaching steps using a combination of lineage-selective membrane (GLAST, CHTX, JONES, CD31), cytoskeletal [nestin, vimentin, TUJ1, glial fibrillary acidic protein (GFAP)] and nuclear [PCNA, DAPI, terminal deoxynucleotidyl transferase (TdT)-mediated dUTP nick end-labeling (TUNEL)] markers. This staining strategy was custom-designed to survey for all possible types of neural cell lineages that could be derived from NSCs, including identifying their proliferating, differentiating and apoptotic states, as well as to test whether CD31+ brain endothelial cells can be directly derived from NSCs, as purported previously by others (Wurmser et al., 2004). Labeling with anti-O4, galactocerebroside (GalC), CD11b (OX42) and CD44 markers was not included because “simple” single-color control immunoreactions using these antibodies did not reveal significant numbers of differentiating oligodendrocytes, microglia, or fibroblasts in the clonally expanded progeny of E13 cortical NSCs after 7 d in culture.
Sequential multiepitope labeling of neural and non-neural phenotypes
In the first round of staining, cultured cells were rinsed with NPM, then surface-immunoreacted for 30 min at RT with 1 μg/ml mixture of CHTX-FITC and mouse IgG1 anti-rat CD31-PE. The cells were then rinsed with NPM and fixed in 4% PF for 20 min at RT. After rinsing off the fixative with three washes in NPM, the cells were first imaged under phase-contrast optics using an Axiovert 200 fluorescence microscope to record their position with respect to the underlying α-numeric grid, and then sequentially imaged using appropriate FITC- and PE-fluorescence filter sets to detect CHTX and CD31 expressions, respectively. After capturing the images, the remaining fluorescence signals, if any were present, were selectively and completely photobleached by continuously illuminating the field with appropriately filtered light, until the signals were no longer detectable.
In the second round of staining, the same cells were reimmunoreacted for 45 min at RT using appropriate mixtures of the following lineage-selective markers (Table 1): guinea pig IgG anti-GLAST-AMCA, mouse IgM JONES-PE, mouse IgG1 anti-nestin-FITC (Zenon labeled), chicken IgY anti-vimentin-Cy5, and rabbit IgG anti-GFAP-Alexa Fluor 750. The fluorescence signals of each immunoreaction were separately imaged and then completely photobleached.
In the third round of staining, the cells were fixed in 70% ethanol for 20 min at RT, then rinsed in NPM and reimmunoreacted for 45 min at RT using a 1 μg/ml mixture of mouse IgG2b anti-TUJ1 and mouse IgG2a anti-PCNA. After this incubation and the subsequent rinsing, the cells were immunoreacted using a 1 μg/ml mixture of goat anti-mouse-IgG2b-Alexa Fluor 647 and biotinylated goat anti-mouse IgG2a antibody for an additional 45 min at RT. The latter reaction was visualized by using a third 45 min incubation at RT with 0.1 μg/ml Alexa Fluor 750-conjugated streptavidin. Unbound sites of streptavidin were then blocked by incubating the cells with 10 μg/ml of unconjugated biotin for 30 min at RT, and the excess biotin then rinsed away. Before imaging, the cells were counterstained with 1 μg/ml of DAPI to reveal cell nuclei, which also facilitated enumeration of total cells per clone.
The fourth and final round of staining incorporated an assay for apoptotic cells. These were identified by TUNEL using the TACS 2 TdT In Situ Apoptosis Detection Kit (Table 1), which detects nuclear DNA fragments generated during naturally occurring cell death. Labeling of apoptotic cells was performed according to the manufacturer's specifications using biotinylated dUTPs and PE-conjugated streptavidin (SA-PE) to reveal the DNA breaks (Table 1).
Antisense targeting of FGFR expression
Clonogenic cell cultures.
In experiments designed to study the roles of specific FGFRs in regulating NSC properties in vitro, the cells were periodically treated during their clonal expansion in culture with phosphorothioate-modified antisense oligonucleotides selectively targeting mRNA sequences of rat FGFR1, FGFR2, and/or FGFR3 (Table 3). All antisense constructs were custom designed and manufactured by Biognostik (Göttingen, Germany) using their proprietary technology. Each antisense stock was diluted in 1× dilution buffer (Biognostik) and added directly to the culture medium at a final concentration of 2.5 μm at the time of plating and then once every 48 h, according to the manufacturerapos;s specifications. Control cultures were treated using equimolar concentrations of guanine cytosine (GC)-matched randomized missense constructs (Biognostik).
Table 3.
Antisense sequences used to target rat FGFR1, FGFR2, and FGFR3 mRNA
| mRNA target | Lot number | Antisense sequence (5′-3′) |
|---|---|---|
| FGFR1 | A5452.8 | CAGCTTATGCACAGCC |
| A5204.8 | ATGGCTCATGAGAGAAG | |
| A5195.6 | TGCGTGTACGGTTGCTTT | |
| A5196.9 | CTGGTCATACGGCAAGTT | |
| FGFR2 | A5197.2 | GCCACCAGGAGTTTGTTG |
| A5198.4 | AAAGCTAGGGAGCATTTC | |
| A5199.4 | CATCGTCTGGTTGCTCCT | |
| FGFR3 | A5299.7 | TCAGTCGCATCATCTTTC |
| A5200.8 | GGATGCCAGGATATGGTG | |
| A5201.9 | GAGGAATTAGACTCCAAG |
All antisense sequences were custom designed and manufactured by Biognostik (Göttingen, Germany) using their proprietary R.A.D.A.R (Rational Algorithmic Design of Antisense Reagents) technology, which optimizes for target specificity and excludes sequence motifs that may cause nonantisense related biological effects.
Organotypic cultures.
DTC explants were cultured intact under permissive growth conditions over 48 h, as described above. Missense or select antisense constructs targeting specific FGFRs were added to the culture medium, as specified above, at the time of plating and then again 24 h later. To block bFGF/FGFR-mediated signaling using a pan-inhibitor of FGFR autophosphorylation (Mohammadi et al., 1998), some explants were treated with 100 nm PD173074 (Parke Davis) at the time of plating and the tissues harvested 48 h later. At harvesting, the explants were processed for immunohistochemical and quantitative FACS analyses of neural cell populations, using the same protocols detailed above for tissue sections and telencephalic dissociates, respectively.
Imaging and analysis of fluorescence signals
Sections and cells were imaged with an Axiovert 200 fluorescence microscope (Carl Zeiss) using either 10X Plan-Apochromat (Phase-1) and/or 25X Plan-Neofluar (Phase-2, multi-immersion) objectives (Carl Zeiss), a high resolution ORCA-ER cooled digital camera (Hamamatsu Photonics, Hamamatsu City, Japan) sensitive to a wide-spectrum of emission wavelengths, a 100 W mercury arc lamp (Carl Zeiss), and optimized excitation/emission filter sets (Omega Optical, Brattleboro, VT) for detection of AMCA, FITC, PE, Alexa Fluor 350, Alexa Fluor 488, Alexa Fluor 546, Alexa Fluor 647, and Alexa Fluor 750. Each labeling reaction was captured using light filtered through an appropriate filter set and the images digitized at 12 bit resolution using the OpenLab imaging program (Improvision, Lexington, MA). An appropriate color table was applied to each image to either match its emission spectrum or to set a distinguishing color balance. The pseudocolored images were then converted into .tiff files, exported to Adobe (San Jose, CA) Photoshop and overlaid as individual layers to create multicolored merged composites.
Results
Accessing true NSCs is prerequisite to studying their seminal properties
Because unique markers specific for cortical NSCs have not yet been identified, we developed several multiepitope immunostaining strategies using multiple combinations of well established lineage-selective markers (Table 1) to identify, enumerate, and locate the distributions of all possible types of proliferating neural progenitors and their postmitotic counterparts in sagittal sections (Fig. 1) and single-cell dissociates (Fig. 2) of E13 telencephalic tissues. Implementation of such all-inclusive labeling strategies was prerequisite to identifying true multilineage-negative NSCs from their proliferating and/or differentiating progeny committed toward one or more neural lineages, which could themselves be identified by their differential expression/coexpression of specific membrane and/or cytoskeletal markers (Table 1, 2). Currently, the application of multilineage identification strategies is of paramount importance because classical markers that are commonly used to positively identify NSCs, such as nestin and vimentin, are shared by NSCs and different types of early progenitors derived from NSCs. Conventional retrospective functional identification of NSCs is also nondefinitive, because both NSCs and certain types of LRPs (A2B5+, GFAP+) have been recently shown to exhibit self-renewing and multipotential properties, including the ability to generate neurospheres.
Figure 1.
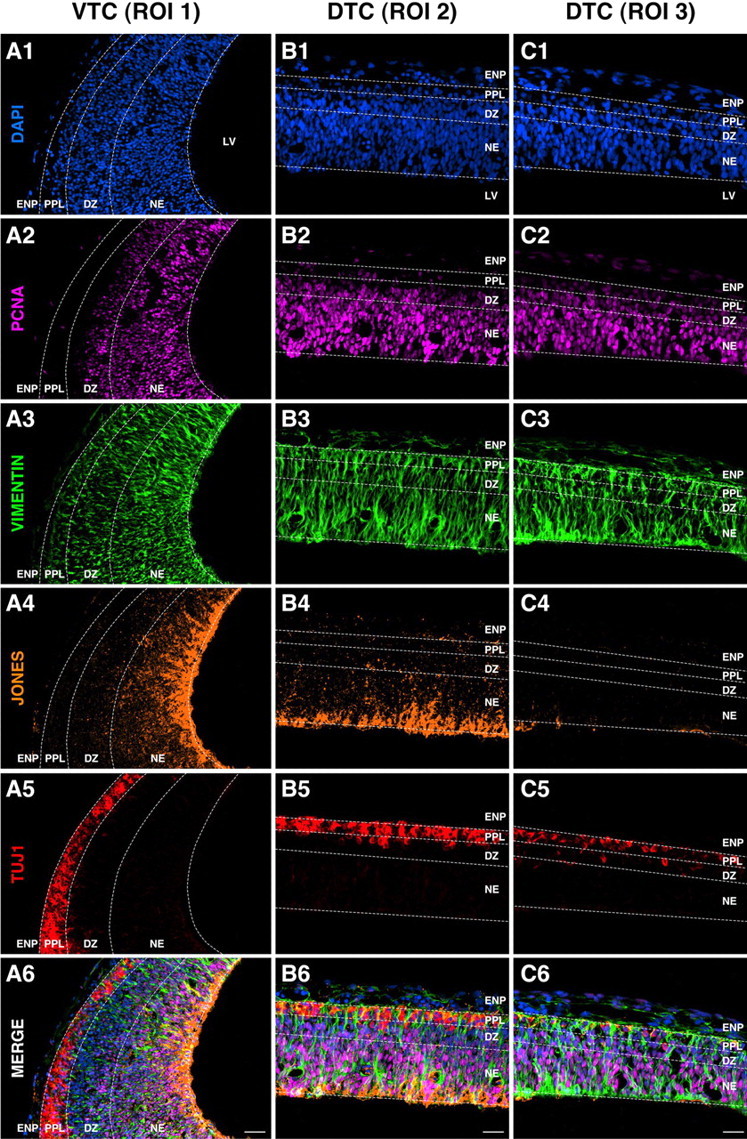
Neural cell distributions at the onset of cortical neurogenesis reveal clear ventriculopial and dorsoventral gradients in lineage development. Sagittal sections of E13 rat telencephalon were multilabeled using DAPI, PCNA, and neural cell markers (vimentin, JONES, and TUJ1), as indicated in each panel. A1–C6, Select ROIs of the VTC and DTC are shown to compare the lineage distributions in the most-developed region (ROI 1; A1–A6) with those in the intermediate- (ROI 2; B1–B6) and least-developed regions (ROI 3; C1–C6). Proliferating (PCNA+) cells are distributed along a ventriculopial gradient in all ROIs primarily in the NE. Vimentin expression is widely distributed throughout the tissue. JONES+ progenitors are distributed both along ventriculopial and dorsoventral gradients with most residing in the NE of VTC-ROI 1, whereas progressively decreasing in abundance throughout the DTC with few detected in DTC-ROI 3. TUJ1+ neuronal progenitors and their postmitotic counterparts are primarily located in the PPL and DZ in all ROIs with their density progressively increasing along a dorsoventral gradient. Note that vimentin+PCNA+ JONES−TUJ1− cells, which represent putative multilineage-negative NSCs, are readily detectable only in DTC-ROI 3 (C6), but are interspersed among the JONES+ progenitors in the NE of DTC-ROI 2 (B6) and VTC-ROI 1 (A6). This cellular complexity precludes the experimental accessibility to NSCs for in vitro studies using simple microdissection methods. LV in A1, B1, C1, Lateral ventricle. Scale bars, 20 μm.
Figure 2.
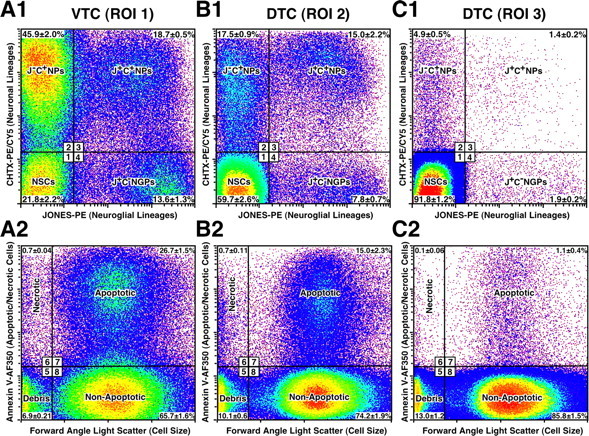
Neural lineage complexity derived from NSCs can be resolved and accessed using comprehensive surface multilabeling and FACS technology. A1, B1, C1, Dissociation of individual telencephalic ROIs (1–3) and differential labeling of cells using surface markers JONES and CHTX identifies four neural lineage phenotypes by quantitative FACS analysis, as depicted here in boxed regions 1–4. These include (1) JONES−CHTX− (J−C−) multilineage-negative neural stem cells (NSCs), (2) J−C+ neuronal progenitors (NPs), (3) J+C+ NPs, and (4) J+C− NGPs. Mean percentage (± SEM) of each population is indicated in their respective quadrant. Note that NSCs predominate in DTC-ROI 3, and then decrease precipitously in DTC-ROI 2 and VTC-ROI 1, as different types of neural progenitors progressively emerge. A2, B2, C2, Forward-angle light scatter and annexin V binding quantify vital from dead (apoptotic or necrotic) cells and subcellular debris (boxed regions 5–8). NSCs become progressively proapoptotic along a dorsoventral gradient, as quantified by surface annexin V binding on multilineage-negative cells electronically gated in region 1 in A1, B1, and C1 (see derived data in Results). Prospective isolation of vital NSCs for in vitro studies was performed using negative selection by sorting only the cells detected in regions 1 and 8, while at the same time excluding different neural progenitors detected in regions 2–4, as well as excluding cell debris in region 5 and apoptotic/necrotic cells in regions 6 and 7.
In our study, we first applied the multiepitope labeling to sagittal sections of the E13 rat telencephalon to investigate dynamically changing anatomical distributions of neural progenitors at the beginning of neurogenesis (Fig. 1). The sections were systematically analyzed along a dorsal (less developed) to ventral (more developed) plane, because this orientation clearly demonstrated the emerging ontogenetic gradient in telencephalic tissue differentiation. The telencephalon was partitioned into three regions of interest (ROIs): ventral-most (ROI 1), intermediate-dorsal (ROI 2), and dorsal-most (ROI 3), and the cellular composition examined in each ROI. The initial survey of lineage-selective markers (see the list in Table 1) revealed that JONES (anti-9-O-acetylated GD3), a marker of early NGPs (Maric et al., 2003; Maric and Barker, 2004), and TUJ1, a marker of NPs and postmitotic neurons, produced significant labeling of E13 telencephalic tissue with highly contrasting distributions between the emerging JONES+ and TUJ1+ cells (Fig. 1, compare A4–C4, A5–C5). Additional markers, including vimentin (Fig. 1A3–C3) and nestin (data not shown), revealed wide-spread distributions throughout the telencephalic tissue, with PCNA+ proliferating cells showing the expected localization within the neuroepithelium (NE) (Fig. 1A2–C2). Labeling of sections using cell surface markers CHTX and TNTX (recombinant tetanus toxin fragment C that binds to GT1b gangliosides), which were also applied to identify early neural phenotypes in cell sorting experiments of telencephalic dissociates, closely paralleled the distribution of TUJ1+ cells in situ (data not shown) (but see Maric and Barker, 2004, 2005), revealing a coexpression of these markers on the emerging NPs at this stage of cortical development.
A semiquantitative immunohistochemical analysis of individual ROIs (data not shown) further resolved the developmental changes in cellular composition observed in gross anatomy. The most developed region (VTC-ROI 1) exhibited the most complex and contrasting neural cell cytoarchitecture (Fig. 1A1–A6), with JONES+TUJ1− NGPs and their immediate progeny, JONES+TUJ1+ NPs, primarily located in the proliferating NE, adjacent to JONES−TUJ1+ NPs and postmitotic neurons found mainly within the differentiating zone (DZ) and the primordial plexiform layer (PPL). DTC-ROI 2 exhibited similar complementary distributions of JONES+TUJ1− NGPs and JONES−TUJ1+ NPs (Fig. 1B1–B6), with JONES+TUJ1+ NPs interspersed within the tissue. However, the abundance of each progenitor population was noticeably decreased relative to undifferentiated proliferating neural precursors, which were identified as multilineage-negative NSCs by quantitative FACS analysis (see below) (Fig. 2, compare A1, B1). The least developed region (DTC-ROI 3) was most revealing because it was almost entirely composed of proliferating multilineage-negative NSCs (Fig. 1C1–C6), with few TUJ1+ NPs in the DZ and PPL (Fig. 1C5) and virtually no JONES+ phenotypes (Fig. 1C4). In some sections, JONES−TUJ1+ NPs could be observed migrating radially from the NE to the PPL (data not shown). These findings imply that (1) neurogenesis of JONES−TUJ1+ NPs in the DTC is directly derived from multilineage-negative NSCs in the NE and (2) JONES−TUJ1+ NPs emerge during cortical development before JONES+ NGPs or JONES+TUJ1+ NPs.
This developmental diversification of neural lineages from NSCs observed in vivo was recapitulated in vitro, as evidenced by time-lapse imaging of E13 NSCs plated at clonal density and cultured under permissive conditions for ∼60 h (supplemental Figs. 1, 2, available at www.jneurosci.org as supplemental material). The results revealed that a NSC can divide asymmetrically first to generate an intermediate progenitor to the JONES−TUJ1+CHTX+ NP lineage and subsequently to generate an intermediate progenitor to the JONES+TUJ1−CHTX− NGP lineage. Both types of intermediate progenitors can divide symmetrically to expand their compartment. However, the intermediate to JONES+ NGP can also divide asymmetrically to generate a progenitor to JONES+TUJ1+CHTX+ NP, which itself can subsequently undergo a symmetrical division (supplemental Figs. 1, 2, available at www.jneurosci.org as supplemental material). The same founder NSC that generated the aforementioned intermediate progenitors via asymmetrical divisions was also capable of sustaining its self-renewing compartment of multilineage-negative progeny via symmetrical divisions (supplemental Figs. 1, 2, available at www.jneurosci.org as supplemental material). These findings support the hypothesis that NSCs are the seminal precursors to distinct pools of proliferating neural progenitors, which sequentially emerge either directly or indirectly from NSCs at the beginning of cortical neurogenesis, while at the same time, these cells continue to maintain a self-renewing compartment of their multilineage-negative progeny.
Cortical NSCs rapidly decrease in vivo because of lineage commitment and apoptosis
Cells were dissociated from microdissected ROIs 1–3 and initially phenotyped using eight lineage-selective surface markers (A2B5, JONES, O4, CHTX, TNTX, CD44, CD11b, CD31), and one surface marker of apoptosis (annexin V). Multiparameter FACS analyses were then performed to quantify the abundance of neural and non-neural populations (Table 1) and their apoptotic compartments. Labeling using non-neural markers CD31, CD44, and CD11b revealed nominal, if not undetectable, numbers of infiltrating populations of endothelial cells (<3%), fibroblasts (<1%), or microglia (<1%) in the E13 telencephalic tissues. Similarly, immunohistochemical analyses of telencephalic sections at this stage of cortical development showed a scant presence of vimentin+ scaffolding radial glia and a complete absence of GFAP+ astrocytes and O4+/GalC+ oligodendrocytes (data not shown). In contrast, FACS surveys using surface markers differentially expressed by emerging NGPs (JONES+) and NPs (CHTX+) confirmed a dynamically changing dorsoventral gradient in the cellular composition (Fig. 2A1–C1), which was observed in tissue sections using immunolabeling with JONES and TUJ1 (Fig. 1). Separate immunocytochemical analysis further demonstrated that JONES+ NGPs predominantly coexpressed A2B5, whereas the emerging CHTX+ NPs typically coexpressed TNTX and TUJ1 (data not shown). Therefore, for future reference, we designated NGPs simply as JONES+CHTX− (J+C−) cells, their neuronal progeny as JONES+CHTX+ (J+C+) NPs, and the neuronal progeny directly derived from NSCs as JONES−CHTX+ (J−C+) NPs, as evidenced in our time-lapse experiments (supplemental Figs. 1, 2, available at www.jneurosci.org as supplemental material).
The FACS assays also revealed, for the first time, a striking developmental change in the abundance of multilineage-negative NSCs (Fig. 2A1–C1), which could not be readily inferred from immunohistochemical observations because of the lack of specific positive identification markers for these cells. In this regard, NSCs, which composed >90% of all cells in DTC-ROI 3 (Fig. 2C1), declined to ∼60% in DTC-ROI 2 (Fig. 2B1) and decreased further to only ∼22% in VTC-ROI 1 (Fig. 2A1). This developmentally related decline in the relative percentage of NSCs was also reflected by a >66% decrease in their absolute numbers, indicating a marked contraction of the NSC compartment as the absolute numbers of NSC-derived NPs and NGPs expanded >20-fold.
Another novel discovery from quantitative FACS analyses of the telencephalic dissociates was that, in addition to lineage commitment, the developmental decrease in NSCs along the dorsoventral axis correlated with a marked increase in their apoptotic compartment, as revealed by annexin V labeling quantified from electronically gated multilineage-negative cells (Fig. 2). The great majority of NSCs (>97%) were vital/nonapoptotic in the dorsal-most DTC-ROI 3, with <1% apoptotic (derived from Fig. 2C1,C2). The apoptotic compartment of NSCs increased to ∼17% in the intermediate DTC-ROI 2 (derived from Fig. 2B1,B2) and peaked at ∼38% in VTC-ROI 1 (derived from Fig. 2A1,A2). This change reflected an approximately sevenfold increase in the absolute numbers of apoptotic NSCs compared with those in DTC-ROI 3. Other neural lineages exhibited nominal to slightly increased numbers of apoptotic cells in VTC-ROI 1 compared with their respective compartments in DTC-ROI 3 (data not shown). These findings reveal that, during the early phases of cortical neurogenesis, NSCs are physiologically regulated in vivo both by lineage differentiation and apoptosis.
Cortical NSCs exhibit four stereotypical clonal expansion states in vitro
The seminal properties of sort-purified NSCs were investigated in vitro by examining their clonal cell expansion potentials under permissive growth conditions. After 7 d in culture, the NSCs generated four stereotypical expansion states, including efficiently self-renewing (ESR) without differentiating or dying, inefficiently self-renewing (ISR) without differentiating, but limited by frequent apoptosis, exclusively neurogenic (NG), or multipotential (MP), as outlined in Table 2 and illustrated in Figure 3. Labeling of NSC-derived progeny using a GLAST immunoreaction retrospectively disclosed a lineage relationship between GLAST− and GLAST+ stages of cortical NSC development (see below) (see Fig. 10).
Figure 3.

NSCs exhibit four stereotypical clonal expansion states in vitro. FACS-purified NSCs formed clones after 7 d in culture that were sequentially labeled using multiple lineage-selective markers to identify and quantify different phenotypes and their proliferative and apoptotic compartments (Table 2). A–D, NSCs generate four highly stereotypical clonal expansion states: ESR without differentiating or dying (A), ISR without differentiating, but limited by frequent apoptoses (B), exclusively neurogenic (NG) restricted along the JONES−CHTX+ (J−C+) NP lineage (C), and MP, generating a limited self-renewing compartment of NSCs (D), which then asymmetrically divide to sequentially produce up to 5 lineage-restricted neural phenotypes, including JONES−CHTX+ (J−C+) NPs, JONES+CHTX− (J+C−) NGPs, JONES+CHTX+ (J+C+) NPs, radial glia (RG) and astroglia (AG). Labeling of NSC-derived progeny for GLAST expression (Table 2) subdivided them into GLAST− and GLAST+ subpopulations, which retrospectively delineated early and late stages of NSC development (see Results) (Fig. 10). VIM, Vimentin. Scale bar: (in D) 10 μm.
Figure 10.

Activation or inactivation of FGFRs selectively mediate the self-renewing and differentiating properties of NSCs. Illustrated is a summary of the complex roles of bFGF/FGFR signaling in mediating the clonal expansion states of NSCs, as they diversify their fate from the self-renewing expansion of undifferentiated cells to neurogenic or multipotential expansion or apoptosis. Solid arrows indicate the lineal relationships and a developmental timeline among the different expansion states and the roles of different FGFRs deduced from experiments on E13 NSCs. Initially, GLAST− ESR-NSCs expand via symmetrical divisions in the presence of high [bFGF] that coactivates FGFR1 and FGFR3. Genesis of JONES−CHTX+ (J−C+) NPs (putative intermediates to “early pioneer neurons”) occurs via asymmetrical divisions of GLAST− NSCs when [bFGF] decreases or either FGFR1 and/or FGFR3 is inactivated. The continued expansion of GLAST− ESR-NSCs is curtailed after a developmental upregulation and activation of FGFR2, which promotes asymmetrical divisions and a proapoptotic cell fate. GLAST− ESR NSCs also transition into TRANS-GLAST+ ESR NSCs before generating entirely GLAST+ ESR progeny. At both stages, the NSCs can either self-renew in high [bFGF] by coactivating FGFR1 and FGFR3 or diversify their seminal properties when either FGFR2 or FGFR3 is activated to become GLAST+ MP-NSCs. MP-NSCs generate all major types of LRPs, including (1) more J−C+ NPs, which differentiate into putative “late pioneer neurons” (via inactivation of FGFR1 and FGFR3), (2) GLAST+ J+C− NGPs (promoted by FGFR3) which, in turn, generate (3) J+C+ NPs (promoted by FGFR3) that differentiate into putative Cajal-Retzius neurons, (4) GLAST+ radial glia (promoted by FGFR2), and (5) GLAST+GFAP+ astrocytes (supported by FGFRs 1–3). Dashed arrows originating from the MP-NSC clone point to clonal expansion states derived from E15 cortical NSCs and reveal an increasing restriction in NSC potentials as development proceeds. A possible interplay between bFGF and epidermal growth factor in mediating the multipotential expansion state of cortical NSCs at E13 was introduced from a previous study (Maric et al., 2003).
Before expressing GLAST, NSCs self-renew or become apoptoticor neurogenic
Cells derived from GLAST− NSCs predominantly generated three types of clonal expansion states (Fig. 3A–C, Table 2), two of which were self-renewing without differentiating (ESR, ISR), and one of which was exclusively restricted along the NG lineage. The ESR state was characterized by symmetrically dividing GLAST− progeny, which were consistently composed almost entirely of undifferentiated nestin+ and vimentin+ epithelioid-like neural cells with most actively proliferating (PCNA+), few apoptotic (TUNEL+), and virtually none expressing neuronal- or glial-restricted markers (Fig. 3A). Cells composing the ISR clones derived from GLAST− NSCs also exhibited the same immature phenotypic identity, but instead most of these cells had undergone apoptosis, usually after each cell division, as revealed by time-lapse analysis (data not shown), thus netting few viable, albeit still proliferative, undifferentiated cells after 7 d in culture (Fig. 3B). Some of the GLAST− NSCs exhibited limited clonal expansion before becoming neurogenic, with their GLAST− progeny composed predominantly of proliferating J−C+ NPs and their postmitotic counterparts and few undifferentiated nestin+ and vimentin+ neural precursors (Fig. 3C). These three fates of GLAST− NSCs were skewed along the dorsoventral gradient. ESR clones were generated by ∼40% of GLAST− DTC-NSCs, but decreased by >50% in clones derived from the VTC-NSCs. This paralleled a nearly twofold increase in ISR and NG clonal expansions of GLAST− VTC-NSCs. These results indicate that GLAST− NSCs initially self-renew efficiently through symmetrical divisions, before developmentally switching toward asymmetrical divisions, which generate neurogenic and proapoptotic fates.
NSCs express GLAST before transitioning into a multipotential state
Under the same growth conditions, ∼30% of ESR-NSCs from DTC and ∼40% of ESR-NSCs from VTC preparations generated clones of mixed GLAST− and GLAST+ progeny (see Fig. 10), which were morphologically and phenotypically indistinguishable from those observed in the entirely GLAST− ESR-NSC clones (Fig. 3A). These cells were retrospectively classified as initially derived from transitional (TRANS)-GLAST+ ESR-NSCs, with the output of GLAST+ progeny in each clone ranging between 5–95% of total cells (Table 2). The remaining compartment of ESR-NSCs in both DTC and VTC preparations exclusively generated GLAST+ progeny via symmetrical cell divisions (see Fig. 10), which were indistinguishable from their GLAST− counterparts. However, unlike clonal expansions of entirely GLAST− ESR-NSCs, which markedly decreased along the dorsoventral gradient, the frequency of ESR-NSCs generating TRANS-GLAST+ and exclusively GLAST+ clones increased by ∼30% in the VTC preparations compared with their DTC counterparts. These findings indicate that GLAST expression becomes progressively upregulated among NSCs during development. Furthermore, the increased expression of GLAST among VTC-NSCs in vivo (see Fig. 6, compare A, B) correlated closely with the emergence of a MP clonal expansion state of NSCs (Fig. 3D). Over 7 d in culture, this state stereotypically produced a limited compartment of self-renewing NSCs, which then underwent asymmetrical divisions to sequentially generate up to five lineage-restricted neural phenotypes, including (in the order of emergence): J−C+ NPs, J+C− NGPs, J+C+ NPs, radial glia, and astrocytes. The multipotential expansion state of GLAST+ NSCs exhibited a clear dorsoventral gradient, increasing in frequency by ∼4-fold in the VTC- compared with DTC-derived preparations. Together, the results show that GLAST expression resolves the developmental progression within the NSC lineage, in which the GLAST− NSCs initially expand by efficiently self-renewing and then express GLAST before becoming multipotential. These cells then generate all major types of neural progenitors, thus demonstrating a common founder/ancestor for all these lineages. Some GLAST− NSCs can switch from efficient self-renewal to divide asymmetrically, generating neurogenic or apoptotic progeny without becoming GLAST+.
Figure 6.
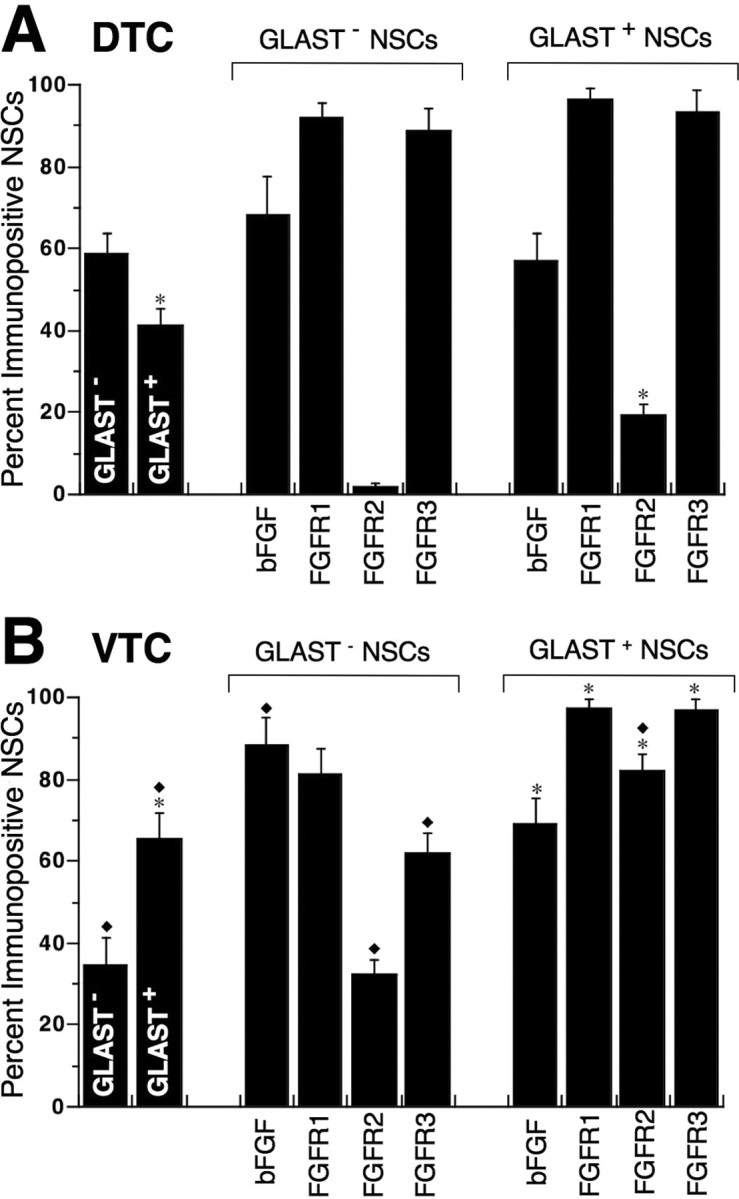
GLAST− and GLAST+ NSCs differentially express FGFRs 1–3. DTC- and VTC-NSCs were FACS-sorted and then plated on glass coverslips for 1 h and immunostained for GLAST, bFGF, and FGFRs 1–3. A, B, Quantitative analysis of bFGF/FGFRs 1–3 expressed by GLAST− and GLAST+ NSCs derived from DTC (A) and VTC (B) preparations is summarized in bar graphs that show percentage of cells differentially immunopositive for each expression (mean ± SEM). Asterisks identify significant differences (p < 0.05) between GLAST+ and GLAST− populations among DTC- and VTC-NSCs. Diamonds indicate significant differences (p < 0.05) between VTC and corresponding DTC populations. Most DTC-NSCs express bFGF and FGFR1 and FGFR3, but few express FGFR2, which is markedly upregulated among VTC-NSCs.
Ambient bFGF and telencephalic developmental stage dictate the plasticity of NSCs
We systematically examined the developmental potentials of NSCs in vitro by varying ambient bFGF concentration over the 0.01–200 ng/ml range. ESR clones composed of undifferentiated progeny that were either entirely GLAST−, entirely GLAST+, or a mixture of GLAST− and GLAST+ cells (see Fig. 10) were merged into a single functional group. Most DTC-NSCs (>80%) efficiently self-renewed at 10–200 ng/ml bFGF, with the remaining NSCs fractionated among ISP, NG, and MP expansion states (Fig. 4A). This was in stark contrast to the VTC-NSCs, which primarily exhibited increased MP clonal expansion with rising ambient bFGF levels, mostly at the expense of the ESR state (Fig. 4B). However, decreasing [bFGF] into the 0.5–5 ng/ml range did promote MP clonal expansion from the DTC-NSCs, which peaked at 40% of total clones at 2 ng/ml bFGF (Fig. 4A). By decreasing [bFGF] even further, both DTC- and VTC-NSCs became predominantly neurogenic at the expense of both ESR and MP clonal expansion states, with the former state virtually nonexistent at 0.01 ng/ml bFGF. Similar results to those obtained with 0.01 ng/ml bFGF occurred when bFGF was omitted (data not shown), indicating that this low bFGF concentration did not affect the relative abundance of different clones occurring in the absence of exogenous bFGF. Relatively few DTC-NSCs (∼10%) generated ISR clones regardless of [bFGF], whereas increasing bFGF over 10–200 ng/ml promoted a significant increase in the proapoptotic fate of VTC-NSCs, as NG and ESR states were suppressed (Fig. 4B).
Figure 4.
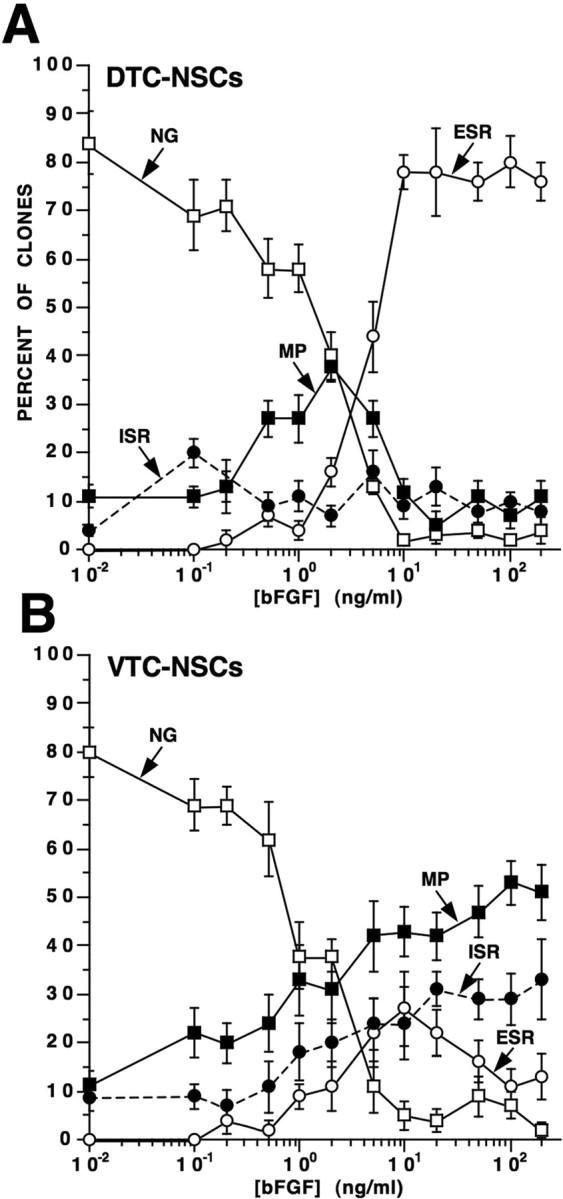
Self-renewing and differentiating NSC clonal expansion states vary with ambient bFGF concentration and telencephalic developmental stage. A, B, DTC-NSCs (A) and VTC-NSCs (B) were cultured at clonal density in medium containing 0.01–200 ng/ml [bFGF]. Their expanded progeny were then phenotyped and enumerated, and the clones were classified either as ESR, ISR, NG, or MP (Fig. 3). Frequency plots demonstrate the relationship between each type of clonal expansion state (mean percent of total clones ± SEM) and ambient bFGF concentration. ESR clones derived from DTC-NSCs abound at high bFGF concentrations (>5 ng/ml), which, in contrast, support mostly MP clones derived from VTC-NSCs. At low bFGF concentrations (<2 ng/ml), both DTC- and VTC-NSCs generate primarily NG clones. ISR clones from DTC-NSCs fluctuate between 10 and 20% independent of bFGF concentration (A) and noticeably increase with increasing [bFGF] in the VTC-NSC preparation (B).
Detailed analyses of the clonal expansion states revealed many similarities and some significant differences in the proliferative, apoptotic and lineage-restricted compartments formed at low (0.01–2 ng/ml) bFGF concentrations compared with those generated at high (5–200 ng/ml) bFGF concentrations. High [bFGF] generally promoted proliferation and decreased apoptosis in almost all types of clonal expansion, leading to an overall increase in cell number per clone, especially among ESR and MP clonal expansion states. Similar roles of bFGF were observed in the ISR and the exclusively NG clonal expansion states of NSCs. Low [bFGF] significantly increased NSC differentiation into J−C+ NPs at the expense of sustaining self-renewing NSCs, which mostly became apoptotic. The effect of promoting neurogenesis along the J−C+ NP lineage at low [bFGF] was also observed in the MP clonal expansion state. In contrast, high [bFGF] promoted neurogenesis of J+C+ NPs in MP clones in parallel with an increase of their immediate antecedents, J+C− NGPs. These findings might help to explain the apparently paradoxical data of Qian et al. (1997), who reported neurogenic differentiation of NSCs at both low and high [bFGF], with the latter concentrations also producing oligodendrocytes. The identities of neuronal phenotypes directly generated from NSCs and J+C− NGPs, in terms of their ontogenetic birth date, transcription factor expression(s), and neurotransmitter phenotype, as well as their physiological relevance to cortical development, is currently under investigation. Preliminary evidence using additional neuron-selective markers (calbindin, calretinin, Reelin) and morphological properties of the emerging NP populations suggest that NSC-derived J−C+ progeny are “pioneer” neurons, whereas NGP-derived J+C+ progeny exhibit the characteristics of Cajal–Retzius neurons (S. Mishra, unpublished observations).
It should be noted that all of the aforementioned stereotypical clonal expansion states of NSCs and diversification of their fates in vitro occurred in the complete absence of endogenous rat brain endothelial cells (ECs), which were initially depleted from NSCs by FACS. Furthermore, none of the NSC expansion states generated EC progeny de novo, whereas CD31+ ECs that were FACS-purified from E13 telencephalon by positive-selection did clonally expand in the same growth medium used for NSCs, stereotypically generating self-renewing CD31+ EC progeny that organized into primitive vessel-like structures (data not shown). These findings demonstrate that E13 cortical NSCs do not give rise to ECs in vitro, although the growth conditions used to culture NSCs permitted the survival and expansion of endogenous brain ECs, which were sort-purified from the same tissue at the same time. Our findings contrast with those reported by Shen et al. (2004) and Wurmser et al. (2004), which implied that ECs exhibit crucial roles in regulating the seminal biology of NSCs. However, these studies were conducted at later stages of cortical development or in the adult brain, when NSCs or their progeny may indeed exhibit different biological properties from those found at the beginning of cortical neurogenesis.
Differential expressions of bFGF/FGFRs correlate with NSC commitment in vivo
Because bFGF exerts clear dose-dependent mitogenic, differentiating and/or survival roles in regulating the seminal biology of E13 cortical NSCs in vitro, we investigated its possible physiological contributions in vivo by applying a customized multiepitope labeling protocol to sagittal sections to disclose the anatomical distributions and relative abundance of bFGF and its receptors, FGFRs1–3 (Fig. 5). Additional semiquantitative immunohistochemical analyses were also performed and the relative expressions of bFGF/FGFRs compared with those of neural cell lineage markers (Fig. 1).
Figure 5.
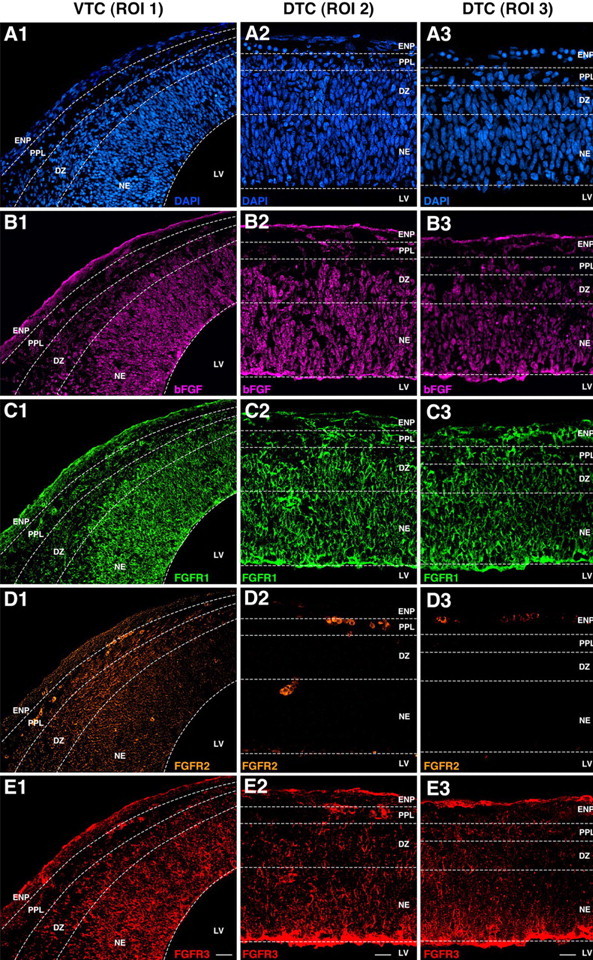
Immunohistochemical analyses of bFGF and FGFRs 1–3 expression in vivo reveal both developmental and anatomical gradients at the onset of neurogenesis. A1–E3, Sagittal sections of E13 rat telencephalon were labeled with DAPI (A1–A3), anti-bFGF (B1–B3), anti-FGFR1 (C1–C3), anti-FGFR2 (D1–D3), and anti-FGFR3 (E1–E3) to reveal their relative expressions in VTC-ROI 1, DTC-ROI 2, and DTC-ROI 3. B1–B3, bFGF is widely expressed in all ROIs but progressively decreases in abundance along a ventriculopial gradient in VTC-ROI 1 (B1) and DTC-ROI 2 (B2). bFGF expression modestly decreases along the ventriculopial gradient in DTC-ROI 3 (B3). C1–C3, FGFR1 expression generally follows the same distribution patterns observed for bFGF. D1–D3, FGFR2 expression in DTC-ROI 2 and ROI 3 is scant to nonexistent but is markedly upregulated in the NE and DZ of VTC-ROI 1, although it decreases in the PPL. E1–E3, FGFR3 expression parallels that of FGFR1 in all ROIs. Scale bars: E1, 20 μm; E2, E3, 10 μm.
Relative expression of bFGF progressively declines along a ventriculopial gradient
bFGF was widely distributed throughout the VTC-ROI 1 (Fig. 5B1), DTC-ROI 2 (Fig. 5B2), and DTC-ROI 3 (Fig. 5B3). However, its relative abundance was markedly decreased along a ventriculopial gradient in the former two regions, dropping by as much as 90% in the DZ and PPL near the pial surface, where most of the JONES− NPs and postmitotic neurons differentiate (Fig. 1A5,B5), when compared with the relatively high bFGF levels in the NE near the ventricular surface, which contained proliferating NSCs, JONES+ NGPs, and their differentiating JONES+ NP progeny (Fig. 1A4,B4). In contrast, the gradient in bFGF expression in DTC-ROI 3 was modest (Fig. 5B3), and correlated with the marked predominance of proliferating NSCs in this region (Figs. 1C1–C6, 2C1). These findings demonstrate that in vivo there is a clear ventriculopial gradient of bFGF expression which emerges as the telencephalic tissue differentiates and thus may be related to its dynamically changing cellular composition. High expression of bFGF in the NE correlated with the initial expansion of NSCs and the subsequent emergence of JONES+ NGPs, whereas low expression in the DZ and PPL was associated with neuronal differentiation. This distribution of bFGF in vivo was consistent with the dose-dependent effects of bFGF on self-renewing and differentiating potentials of NSCs in vitro (Fig. 4). Conceivably, other as yet unidentified extrinsic signals/factors may also be dynamically changing along the same dorsoventral gradient, thus ontogenetically priming the NSCs to diversify from exclusively neurogenic to multiple cell fates, as observed in vitro.
FGFR1 and FGFR3 expressions ontogenetically precede that of FGFR2
Similar to bFGF, FGFR1 and FGFR3 were widely distributed throughout the telencephalon and exhibited progressively declining levels of expression along the ventriculopial gradient in both VTC-ROI 1 (Fig. 5C1,E1) and DTC-ROI 2 (Fig. 5C2,E2). This distribution contrasted with that present in DTC-ROI 3, where the relative expressions of FGFR1 and FGFR3 gradually declined along the ventriculopial gradient (Fig. 5C3,E3). The parallelism in FGFR1 and FGFR3 expressions, with the highest levels in the NE, suggested that both receptors may be coexpressed in the more immature NE cells, including the NSCs (Fig. 6).
In sharp contrast to FGFR1 and FGFR3, the expression of FGFR2 was virtually nonexistent in the parenchyma of DTC-ROI 3 (Fig. 5D3) and mostly absent in DTC-ROI 2 (Fig. 5D2), but quite detectable in the NE and DZ of VTC-ROI 1 (Fig. 5D1). Similar widespread distributions of FGFR1 and FGFR3 in the absence of FGFR2 expression were observed at E11 and E12 (Mishra, unpublished observations) when the neural tube closes, the telencephalic vesicles are formed, and the tissue is almost entirely composed of proliferating neuroepithelial cells. Thus, FGFR1 and FGFR3 expressions predominate at the earliest stages of telencephalic tissue formation and persist together in the more immature stage (DTC-ROI 3) at E13 before FGFR2 emerges. This developmental relationship among differential expressions of FGFRs was also observed in NSCs, as they transitioned from a predominantly GLAST− stage in the DTC to a primarily GLAST+ stage in the VTC (Fig. 6).
NSCs express FGFR1 and FGFR3 before GLAST and FGFR2
NSCs were isolated by FACS and then multilabeled shortly after plating to reveal their individual expressions of bFGF and FGFRs 1–3, with respect to GLAST, a marker previously found to emerge in the NE at the beginning of neurogenesis (Hartfuss et al., 2001). GLAST became expressed in NSCs along a dorsoventral gradient, with GLAST− NSCs predominating (∼60%) in the DTC (Fig. 6A), and GLAST+ NSCs predominating (∼70%) in the VTC preparation (Fig. 6B). Most GLAST− and GLAST+ NSCs from both DTC and VTC expressed bFGF, together with FGFR1 and FGFR3 (Fig. 6). However, few GLAST− NSCs from the DTC expressed FGFR2 (Fig. 6A), which was significantly upregulated in ∼30% of GLAST− NSCs from the VTC (Fig. 6B). A more pronounced upregulation of FGFR2 expression was observed in VTC-derived GLAST+ NSCs, with >80% FGFR2+ (Fig. 6B) compared with <20% FGFR2+ DTC-NSCs (Fig. 6A). Virtually all GLAST+ NSCs from the VTC coexpressed bFGF together with FGFRs1–3 (Fig. 6B).
The differential expression of FGFRs with respect to GLAST further resolves the developmental- and stage-specific lineage relationship within the NSC population. Because the majority of GLAST− DTC-NSCs coexpress FGFR1 and FGFR3, and virtually all of their GLAST+ counterparts express both receptors, FGFR1 and FGFR3 expressions ontogenetically precede GLAST in these cells. Furthermore, because few DTC-NSCs are FGFR2+ and virtually all of those are also FGFR1+, FGFR3+, and GLAST+, these results suggest that the expression of the latter three developmentally precedes that of the former in the DTC. However, there is a small but significant increase of FGFR2+ cells in GLAST− NSCs in the VTC (Fig. 6B), most of which also coexpress FGFR1 and FGFR3, suggesting the subsequent emergence of either a separate population of NSCs that express all three FGFRs, without expressing GLAST, or that FGFR2 expression precedes that of GLAST in some VTC-NSCs. Together, the differential expressions of bFGF/FGFRs by DTC- and VTC-NSCs suggest that endogenous signaling mechanisms mediated by bFGF among the more immature and mostly self-renewing NSCs in the DTC would likely occur via FGFR1 and/or FGFR3, because FGFR2 is absent, whereas putative bFGF signaling among the developmentally older and mostly differentiating NSCs or their proapoptotic progeny in the VTC could also involve FGFR2.
Antisense targeting specific FGFRs reveals their crucial role in NSC seminal biology
During their clonal expansion in 10 ng/ml bFGF, NSCs were periodically treated with antisense (AS) oligonucleotide (ODN) constructs targeting one or more FGFRs. Up to four different AS-ODNs (Table 3) were used simultaneously to selectively target each FGFR and increase the efficiency of FGFR protein knockdown, as verified by immunocytochemistry. Cultures treated with randomized GC-matched missense (MS) ODNs served as controls and those treated with FITC-conjugated MS-ODNs were used to reveal the transfection efficiency, which approached 100%. AS targeting of specific FGFR mRNAs selectively reduced the expression of their encoded FGFR proteins without overtly affecting the expression of nontargeted FGFRs (data not shown), implying that independent mechanisms likely regulate the expressions of different FGFRs.
FGFR1 and FGFR3 collaborate in maintaining the efficient self-renewal of NSCs
Treatment with MS-ODNs produced a frequency distribution of ESR, ISR, NG, and MP clonal expansion states (Fig. 7) that was comparable with that observed in 10 ng/ml bFGF in the absence of MS treatment (Fig. 4). Thus, the transfection of NSCs per se did not significantly alter their complex clonogenic properties. Most of the clones (>75%) generated by DTC-NSCs in the presence of MS-ODNs exhibited the ESR state (Fig. 7A), with the remainder of clones partitioned between the ISR (Fig. 7B) and MP states (Fig. 7D), whereas NG clones were virtually nonexistent (Fig. 7C). In contrast, treatments using AS constructs targeting either FGFR1 or FGFR3 markedly reduced the percentages of ESR clones in the DTC-NSC preparation by as much as sevenfold (Fig. 7A), whereas treatments simultaneously targeting both receptors virtually eliminated the ESR state. Similar effects after AS treatments targeting either FGFR1 and/or FGFR3 were also observed for ESR clones derived from VTC-NSCs (Fig. 7A). AS targeting FGFR2 did not decrease the frequency of ESR clones derived from either population of NSCs and the inclusion of AS-FGFR2 together with AS-FGFR1 and/or AS-FGFR3 did not reverse their suppression of the ESR clones (Fig. 7A). These results suggest that the intrinsic activities of FGFR1 and FGFR3, not FGFR2, collaborate to maintain the efficient self-renewal and expansion of NSCs, which predominates in the DTC. This is consistent with the widespread coexpression of FGFR1 and FGFR3 and the relative absence of FGFR2 in most DTC-NSCs (Fig. 6A), as well as by the presence of FGFR1+FGFR2−FGFR3+ progeny in ESR clones. However, DTC-NSCs did exhibit a significant increase in the abundance of ESR clones after AS-FGFR2 treatment alone (Fig. 7A). This was presumably because of blocking the proapoptotic activity of FGFR2 in the predominantly FGFR1+FGFR2+FGFR3+ progeny composing the ISR-NSC clones, thus permitting these cells to undergo more efficient self-renewal (see below). Similar effects of AS-FGFR2 treatment were observed in the ISR compartment of VTC-NSCs (Fig. 7B), thereby permitting them to significantly contribute to their ESR compartment (Fig. 7A).
Figure 7.

Antisense targeting reveals critical roles of specific FGFRs in generating NSC clonal expansion states. DTC- and VTC-NSCs in culture were periodically treated over 7 d using either three missense constructs (MS1–3) or up to four AS constructs specifically targeting either FGFR1 (AS1) and/or FGFR2 (AS2) and/or FGFR3 (AS3). Clones were phenotyped and classified as ESR, ISR, NG, or MP, and their relative abundance was quantified. A, The percentages of ESR clones derived from DTC- and VTC-NSCs are markedly decreased after AS targeting FGFR1 and/or FGFR3, independent of AS-FGFR2 exposure. B, The percentages of ISR clones in both NSCs populations are significantly and selectively reduced after AS targeting FGFR2, independent of AS-FGFR1 and/or AS-FGFR3 treatments. C, NG clones derived from DTC-NSCs are absent after MS1–3 treatment but markedly increased after AS targeting FGFR1 and/or FGFR3, independent of AS-FGFR2 treatment, which is ineffective by itself. NG clones derived from VTC-NSCs are most clearly promoted by AS targeting FGFR1 alone, FGFR2 and FGFR3 together, or all three FGFRs. D, MP clones generated by DTC-NSCs are variably affected by different AS treatments and consistently eliminated by AS targeting all three FGFRs. MP clones derived from VTC-NSCs are increased by AS targeting FGFR1 and either FGFR2 or FGFR3 and decreased by AS targeting either FGFR2 and FGFR3 or all three FGFRs. Error bars represent percent of clones (mean ± SEM). Crosses show significant differences (p < 0.05) between AS and MS treatments of DTC-NSCs. Asterisks reflect significant differences (p < 0.05) between AS and MS treatments of VTC-NSCs. Diamonds represent significant differences (p < 0.05) between VTC populations and their DTC counterparts.
FGFR2 exhibits a proapoptotic role during the inefficient self-renewal of NSCs
We have observed that the marked upregulation of FGFR2 expression in developmentally advanced VTC-NSCs (Fig. 6B) compared with DTC-NSCs (Fig. 6A) correlates with their increased propensity to undergo inefficient self-renewal (Fig. 4B). Therefore, it was of great interest to investigate the effects of the AS treatment selectively targeting FGFR2 expression during ISR expansion of these cells. The results showed that the percentage of ISR clones derived from VTC-NSCs was significantly reduced after AS-FGFR2 treatment, independent of AS-FGFR1 and/or AS-FGFR3 treatments (Fig. 7B). This was also reflected in the reduction of the total number of apoptotic cells per clone and increased clone size in AS-FGFR2-treated cultures (data not shown), thereby permitting these cells to self-renew more efficiently. Similar protective effects of AS-FGFR2 treatment were observed in the clonally expanded ISR-NSCs derived from the DTC (Fig. 7B), which, under control growth conditions over 7 d in culture, produced progeny that expressed FGFR2. Together, these findings indicate a potent proapoptotic role attributable to FGFR2 activity in mediating the ISR expansion of cortical NSCs.
Suppression of FGFR1 and/or FGFR3 promotes a neurogenic expansion state
NG clones were typically the least abundant outcome derived from DTC- and VTC-NSCs treated with MS-ODNs (Fig. 7C). However, the abundance of NG clones derived from DTC-NSCs markedly increased after AS targeting either FGFR1 and/or FGFR3 (Fig. 7C) independent of AS-FGFR2 treatment, which was by itself ineffective in promoting neurogenesis (Fig. 7C). These findings show that, similar to reducing ambient [bFGF], individual or concerted inactivation of FGFR1 and FGFR3 promotes neurogenesis directly from DTC-NSCs, mostly by suppressing their ESR state (Fig. 7A). NG clonal expansion from VTC-NSCs was most clearly promoted after AS targeting of FGFR1 alone, FGFR2 together with FGFR3, or all three FGFRs, revealing a more complex regulation of neurogenesis in this population of NSCs, which additionally involves the contribution of FGFR2.
FGFRs 1–3 selectively regulate specific cell fates of multipotential NSCs
The roles of FGFRs 1–3 in the generation of MP clones were expectedly more complex because this type of clonal expansion intrinsically involved the emergence of multiple neural cell lineages, with each of these likely regulated by their own mechanisms of lineage progression. The abundance of MP clones generated from both DTC-NSCs and VTC-NSCs was most consistently and effectively compromised only after the AS treatment simultaneously targeting all three FGFRs (Fig. 7D), with other AS treatments producing variable results. To resolve the roles of FGFRs in generating individual lineage-restricted compartments within each MP clone, we performed statistical comparisons among these compartments after different AS conditions, limiting our analysis to those derived from VTC-NSCs, which provided a compelling sample size.
The self-renewing compartment of NSCs, which were mostly GLAST+ and comprised ∼30% of the total expanded progeny of MP clones after 7 d of MS treatment (Fig. 8A), was significantly reduced after AS selectively targeting either FGFR1 or FGFR3, but increased in abundance after AS targeting FGFR2 alone or in combination with other AS treatments. These findings for the most part recapitulated the FGFR-mediated regulation of ESR clones derived from VTC-NSCs (Fig. 7A). Likewise, the emergence of J−C+ NPs clonally expanded from MP-NSCs was significantly increased after AS targeting of either FGFR1 and/or FGFR3 (Fig. 8B) at the expense of self-renewing NSCs (Fig. 8A), similar to results observed in NG clones (Fig. 7C), inferring that a close, but reciprocal relationship exists between these two populations and that an equilibrium between them is, at least in part, mediated by FGFR1 and FGFR3. However, J−C+ NPs were markedly reduced in number after AS targeting of both FGFR1 and FGFR2, implicating a negative feedback role mediated by the concerted inactivation of these two receptors in this population.
Figure 8.
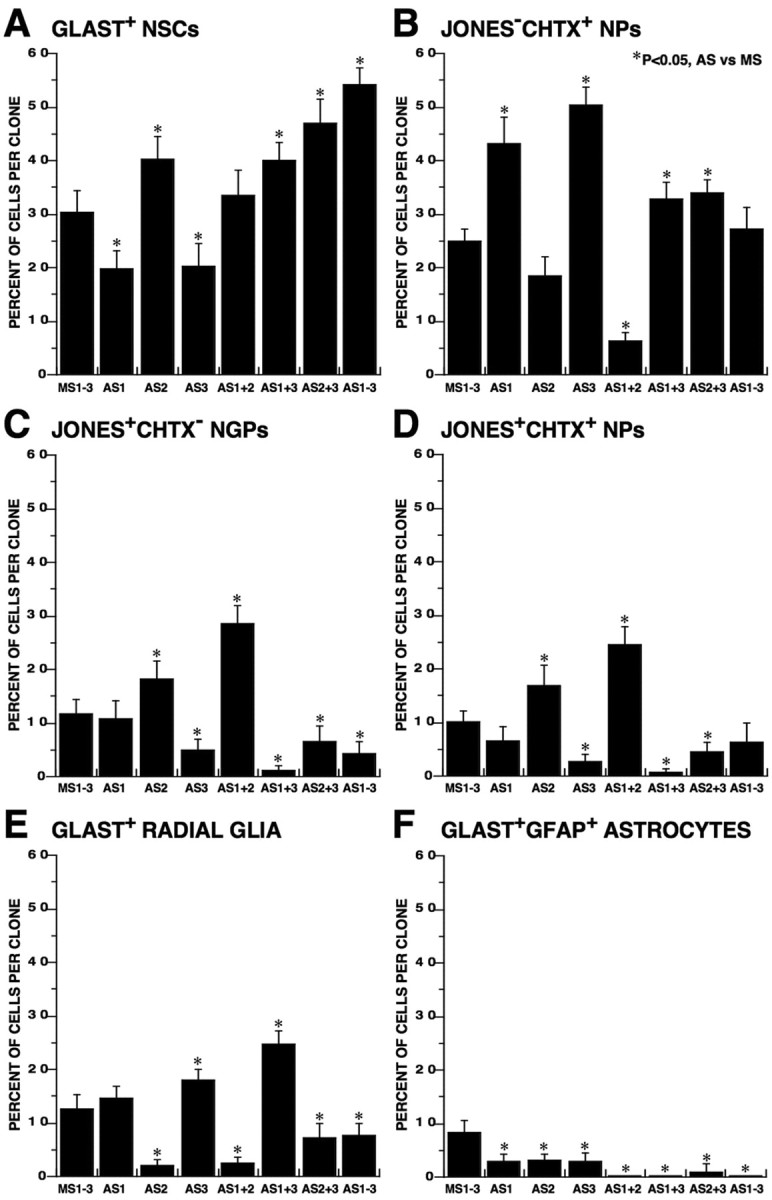
Antisense targeting FGFRs during multipotential expansion of NSCs reveals their critical roles in cell fate determination. MS- and AS-treated MP clones derived from VTC-NSCs were immunophenotyped, and their cellular composition was quantified. A, GLAST+ NSCs are significantly decreased after AS targeting either FGFR1 or FGFR3 alone, whereas AS targeting FGFR2 alone or using other combinations of AS treatments significantly increase their production. B, J−C+ NPs are significantly increased after AS targeting either FGFR1 and/or FGFR3 but markedly decreased after AS targeting both FGFR1 and FGFR2. C, J+C− NGPs are most efficiently increased by AS targeting FGFR1 and FGFR2 but markedly decreased by AS treatments targeting FGFR3 or any combination that includes AS-FGFR3. D, J+C+ NPs exhibit a response to AS treatments closely paralleling that of their precursors J+C− NGPs. E, Radial glia are most efficiently increased after AS targeting FGFR1 together with FGFR3 but markedly decreased by AS treatments targeting FGFR2 or any combination that includes AS-FGFR2. F, Astrocytes are significantly decreased by all AS treatments compared with the levels observed in the MS control. Error bars represent percentage of cells per clone (mean ± SEM). Asterisks show significant differences (p < 0.05) between AS and MS treatments.
The MP clonal expansion of VTC-NSCs also produced two compartments of JONES+ lineage-restricted progeny, which included J+C− NGPs and J+C+ NPs (Table 2, Fig. 3D). The relative abundance of cells in each compartment was most significantly increased after AS targeting of FGFR1 and FGFR2, but markedly decreased by AS treatments targeting FGFR3 or any combination that included AS-FGFR3 (Fig. 8C,D). These results imply that an intimate lineal relationship exists between J+C− NGPs and J+C+ NPs and indicate that FGFR3 activity is critical to the development of this neural lineage. A direct lineal relationship between these two populations was also observed using FACS studies (Maric et al., 2003; Maric and Barker, 2004) and time-lapse imaging (supplemental Figs. 1, 2, available at www.jneurosci.org as supplemental material). The data also demonstrate an important role of concerted FGFR1 and FGFR2 activation/inactivation in mediating the reciprocal relationship observed between J−C+ NP (Fig. 8B) population and J+C− NGPs and J+C+ NPs (Fig. 8C,D).
The remaining compartments composing the MP progeny of VTC-NSCs clonally expanded for 7 d included radial glia and astrocytes (Table 2, Fig. 3D). The relative abundance of radial glia was most significantly increased after AS targeting of FGFR1 together with FGFR3, but markedly decreased by AS treatments targeting FGFR2 or any combination that included AS-FGFR2 (Fig. 8E), implying that the activity of the latter is a crucial determinant in the emergence of the radial glial lineage. In contrast, the relative abundance of astrocytes was significantly decreased by all AS treatments compared with the levels observed in the MS control condition (Fig. 8F), suggesting a more complex contribution of FGFRs 1–3 in mediating the emergence and maintenance of the astroglial lineage from MP-NSCs.
Together, the findings demonstrate complex yet selective roles for specific FGFRs in the regulation of clonogenic properties of NSCs that can be generally summarized as follows: (1) coactivation of FGFR1 and FGFR3 promotes the efficient self-renewal of the least ontogenetically developed NSCs, whereas inactivation of these receptors promotes neurogenesis of J−C+ NPs directly from these cells; (2) developmental upregulation of FGFR2 expression correlates, at least in part, with the increased propensity of NSCs to undergo apoptosis, thereby limiting their self-renewing capability; and (3) as NSCs diversify into their multipotential expansion phase, they exhibit their own microcosm of FGFR regulation that, at least in part, determines, if not promotes, a particular cell fate of their lineage-restricted progeny.
Antisense targeting of specific FGFRs impairs early cortical development in situ
Recent reports have demonstrated that early cortical development involves both tangential and radial migration of neurons and other lineage-restricted progenitors (Meyer et al., 1998; Marin and Rubenstein, 2001). In this study, our results showed that some of the earliest neurons generated in DTC-ROI 3 are directly derived from NSCs in the NE, and then undergo radial migration to settle in the PPL (Fig. 1C5) (our unpublished observations). To study the role of FGFRs in cortical neurogenesis, with minimal contribution from neurons migrating tangentially from extracortical regions, we microdissected the DTC and cultured the tissues as intact explants in the presence of FGFR-AS treatments (Fig. 9).
Figure 9.
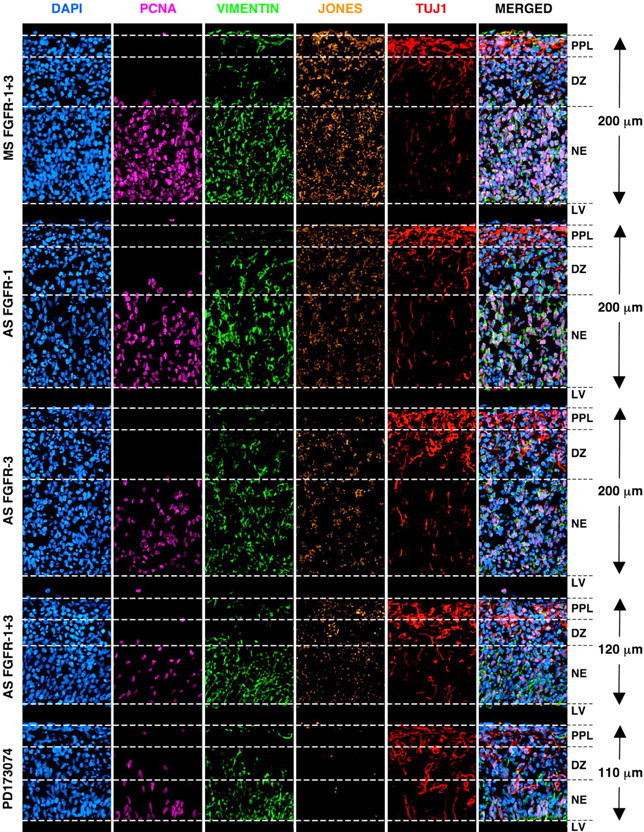
Antisense targeting FGFRs in telencephalic explants differentially affects the early development of neural cell lineages and tissue cytoarchitecture. Organotypic cultures of microdissected E13 DTC explants were treated using either MS or AS constructs targeting FGFRs 1–3 or 100 nm PD173074, a pan-selective inhibitor of FGFR autophosphorylation. Explants were then fixed and sectioned along a sagittal plane and then multilabeled with DAPI, anti-PCNA, anti-vimentin, JONES, and anti-TUJ1. The immunostained panels show DTC-ROI 3 after a 2 d incubation with MS1–3 (first row), AS-FGFR1 (second row), AS-FGFR3 (third row), AS-FGFR1+3 (fourth row), or PD173074 (fifth row). Explants treated with MS constructs largely preserve the ventriculopial distributions of proliferating PCNA+ cells in the NE and differentiating TUJ1+ NPs in the DZ and PPL. JONES+ NGPs are widespread throughout the tissue. AS targeting either FGFR1 or FGFR3 visibly reduces the density of PCNA+, vimentin+ and JONES+ cells but noticeably increases the relative abundance of TUJ1+ NPs throughout the tissue. AS targeting both FGFR1 and FGFR3 retards telencephalic development, reducing overall tissue thickness and promoting the differentiation of JONES−TUJ1+ NPs. Treatment with PD173074 largely parallels the effects of AS-FGFR1+3.
Knockdown of FGFR1 and/or FGFR3 alters early cortical cytoarchitecture
MS-treated explants generally exhibited a well preserved cytoarchitecture after 2 d in culture (Fig. 9, top). The distribution of JONES+ NGPs and their differentiating progeny was widespread throughout DTC-ROI 3 in the explants, whereas virtually none could be detected in this region in vivo at E13 (Fig. 1C4). Presumably, this wider distribution of JONES+ cells was caused by de novo differentiation of JONES+ NGPs and JONES+ NPs from NSCs and their radial migration over the 48 h growth period in vitro. AS targeting of either FGFR1 or FGFR3 did not overtly alter the tissue thickness of DTC explants, but did thin out the overall cell patterning of their cytoarchitecture (Fig. 9, see panels in rows 2 and 3, respectively). The relative abundance of PCNA+, vimentin+, and/or JONES+ cells was significantly decreased relative to those detected in MS-treated controls as quantified by immunohistochemistry and FACS analysis (data not shown). In contrast, TUJ1+ neurons, which were predominantly JONES−, remained widely distributed throughout the AS-FGFR1- or AS-FGFR3-treated tissues, where their relative numbers significantly increased, most appreciably in the DZ after AS targeting of FGFR3. Treatments with AS constructs targeting both FGFR1 and FGFR3 or with a pan-selective FGFR tyrosine kinase antagonist (PD173074) overtly retarded the normal neural lineage patterning of the DTC cytoarchitecture and markedly decreased the overall tissue thickness along the ventriculopial axis (Fig. 9, see panels in rows 4 and 5, respectively). Under both conditions, the abundance of PCNA+ and vimentin+ cells was markedly reduced, whereas the JONES+ population was virtually eliminated, particularly after PD173074 treatment. Both treatments increased the relative abundance of JONES−TUJ1+ neurons throughout the tissue, including the NE, demonstrating a default neurogenic condition after FGFR1 and FGFR3 inactivation, which paralleled the results observed in clonogenic cultures of DTC-NSCs after AS targeting FGFR1 and/or FGFR3 over 7 d (Fig. 7C). DTC explants treated with AS targeting of FGFR2 alone resembled those of the MS control, presumably because FGFR2 was nominally expressed in this part of the telencephalon at E13 (Fig. 5D2,D3) and was not significantly upregulated after 48 h in culture (data not shown). Additionally, explants treated with AS constructs simultaneously targeting all three FGFRs were not significantly different from those treated with FGFR1 together with FGFR3 (data not shown), confirming that FGFR2 does not play a major role in the DTC during this early stage of cortical development. Conceivably, the FGFR2 antisense treatment would produce a more significant effect in VTC explants, because FGFR2 is markedly upregulated in this region (Fig. 5D1) and in the NSC population (Fig. 6B). Resolving the precise role(s) of FGFR2 in specific neural populations of VTC explants will be the focus of a future investigation.
Knockdown of FGFR1 and/or FGFR3 promotes cortical neurogenesis from NSCs
To quantify the effects of AS treatments targeting FGFR1 and/or FGFR3 in DTC explants on NSCs and their progeny, the explants were dissociated at the end of culture and their cellular composition phenotyped and quantified by FACS. AS targeting of either FGFR1 or FGFR3 decreased the relative abundance of NSCs (data not shown), as well as reduced their absolute numbers by ∼50% compared with those observed after MS treatment, primarily because of a reduction in their proliferative activity. A similar reduction in the NSC compartment was evident after AS targeting of both FGFR1 and FGFR3, or after treatment with PD173074. Both types of treatments overtly reduced the relative abundance of JONES+ NGPs and JONES+ NPs, with their absolute numbers reduced by as much as eightfold after targeting FGFR1 together with FGFR3 compared with their respective levels observed in MS-treated controls. In contrast, these AS treatments significantly increased the relative abundance of JONES− NPs. This promotion of the JONES− NP lineage after blocking FGFR activity in DTC explants mimicked the neurogenic results observed in clonogenic expansions of DTC-NSCs after AS-FGFR1 and/or AS-FGFR3 treatment in vitro (Fig. 7C), indicating that inactivation of these FGFRs in situ also promotes neurogenesis directly from NSCs in the NE.
Discussion
Identifying true NSCs is a crucial requirement to study their seminal biology
NSCs have become the focus of many basic and clinical research studies because of their intrinsic, and possibly therapeutically relevant, seminal properties to self-renew and, with specific temporal and microenvironmental cues, to generate all types of neural progenitors that compose the maturing CNS cytoarchitecture. However, the great majority of these studies, along with their inferred conclusions about the properties of NSCs, have been inherently compromised to an unknown degree by the widespread use of heterogeneous neuroepithelial preparations rather that purified cell populations. Despite this, a somewhat-accepted, albeit increasingly fragile consensus has emerged, typically using retrospective clonogenic and/or neurosphere analyses, purporting that only NSCs have the unique property to self-renew via many passages in culture and also retain their multipotential properties with exposure to differentiating media. However, these in vitro models have recently come under increasing scrutiny and criticism (Seaberg and van der Kooy, 2003; Reynolds and Rietze, 2005) because different types of neural progenitors, which can be identified using selective lineage-restricted markers (e.g., A2B5, GFAP) and are intrinsic to the heterogeneous neuroepithelial and neurosphere preparations, also exhibit self-renewing and multipotential properties.
To resolve these ambiguities, there is clearly a crucial need to prospectively identify and then isolate true NSCs from proliferating and differentiating neural progenitors and to initially study their seminal properties and developmental potentials separately. Unfortunately, there are as yet no unique pan-specific markers of true NSCs, thus, making definitive identification of these cells in vivo or in vitro impossible. Therefore, we developed an all-encompassing surface-labeling strategy, which included positive identification of all possible neural progenitors composing the embryonic cortex, using both shared and unique lineage-selective markers linked to fluorescent endpoints. Combining all of these surface markers in a comprehensive multiparameter FACS analysis allowed us to identify a population of multilineage-negative cells, which we hypothesized to be undifferentiated NSCs. These cells were, by our strict definition, completely devoid of any neural lineage-selective markers that could be detected in the E13 rat telencephalon, including those identifying immature neuroglial progenitors (A2B5, JONES) and differentiating neuronal phenotypes (CHTX, TNTX). We next used the preparative capability of the FACS to prospectively isolate these cells from neural progenitors by negative selection and then investigated their developmental potentials using short-term cultures to reveal their intrinsic expansion states in vitro. The results show that multilineage-negative NSCs isolated from the developing rat telencephalon actually exhibit four distinct self-renewing and differentiating compartments, which are physiologically distributed along both ontogenetic and anatomical gradients of cortical development with their plasticity being mediated by both temporal and local microenvironmental cues.
NSC plasticity is controlled by both ontogenetic and epigenetic factors
During the onset of neurogenesis in the rat cortex, the majority of the most ontogenetically immature NSCs in the DTC intrinsically demonstrated the propensity to undergo efficient self-renewal in vivo, without differentiating or dying, as revealed by quantitative FACS analysis. Efficient self-renewal of DTC-NSCs could be reproduced in vitro under permissive growth conditions that included ambient bFGF concentrations ≥5 ng/ml. In marked contrast, FACS analyses revealed that the majority of NSCs from the VTC were programmed in vivo to either differentiate into multiple lineage-restricted phenotypes, or to undergo apoptosis, thereby limiting their self-renewal and physiologically reducing their net contribution to the developing cortical cytoarchitecture. These properties of VTC-NSCs were preserved in vitro under the same permissive growth conditions supporting efficient self-renewal of DTC-NSCs, implying that ontogenetic developmental stage and the in situ microenvironmental conditions play a crucial role in determining the fate of NSCs. Furthermore, both DTC-NSCs and VTC-NSCs could be induced to become exclusively neurogenic in vitro at ambient bFGF concentrations ≤2 ng/ml. Thus, the seminal properties of NSCs are also determined by epigenetic factors, which include bFGF.
In a separate and ongoing study, we quantified ex vivo and in vitro the abundance of multilineage-negative NSCs over the entire period of embryonic cortical development using the same multiphenotyping FACS strategy to assess their ontogenetic relevance. The results revealed that NSCs progressively disappear and effectively lose their efficiently self-renewing clonogenic properties by the end of neurogenesis (E19). During this period, these cells become almost completely depleted because of continued neural lineage commitment and apoptosis, which started at the beginning of neurogenesis. The remaining multilineage-negative cells, which at E19 constitute <1% of the cortical cytoarchitecture, are predominantly composed of radial glia and immature astrocytes, which themselves exhibit limited self-renewal (Fig. 10) before generating neurogenic or exclusively astrogliogenic progeny (data not shown). Furthermore, we have determined that after E15 nearly all of the efficiently self-renewing and multipotential properties, including the ability to generate neurospheres, are actually exhibited by JONES+ (and A2B5+) NGPs, which continue to populate the proliferating ventricular zone of the cortex in vivo. This suggests that the self-renewing and multipotential activities observed during postnatal cortical development and in the adult brain are actually not derived from multilineage-negative NSCs, but instead reflect those of A2B5+ or GFAP+ progenitors, as described previously in the literature (for review, see Ming and Song, 2005).
Complex bFGF/FGFR signaling mediates the plasticity of NSCs
The spatiotemporal and molecular mechanisms underlying the dynamically changing seminal biology of NSCs and their precise role in cell fate determination and lineage progression remain to be elucidated. However, our study demonstrates that intrinsic bFGF/FGFR signaling may play a crucial role in these processes (outlined in Fig. 10). In this regard, we show that, at their earliest stage of development, cortical NSCs are GLAST− and initially coexpress FGFR1 and FGFR3. These cells require the concerted activation of both FGFRs, by relatively high ambient [bFGF], to efficiently self-renew, without differentiating or dying. Pharmacological manipulation of bFGF/FGFR signaling in these cells, by either decreasing ambient [bFGF], using AS targeting FGFR1 and/or FGFR3 or exposure to an inhibitor of FGFR tyrosine kinase activity, promoted the first wave of neurogenesis of J−C+ NPs directly from GLAST− NSCs. The subsequent developmental upregulation of FGFR2 among NSCs in vivo conditions them to either transition into a multipotential state from a GLAST+ stage or undergo apoptosis from a GLAST− stage, with both occurring at the expense of maintaining their efficiently self-renewing state, thereby markedly reducing their numbers, as observed both in vitro and in vivo. The proapoptotic role of FGFR2 activation may involve similar mechanisms as shown in other, non-neural systems (Mansukhani et al., 2000; Kaabeche et al., 2005). As GLAST+ MP-NSCs begin to generate multiple types of lineage-restricted progeny, bFGF/FGFR signaling also plays an intricate, yet selective role in promoting and/or maintaining a specific cell fate. In this regard, inactivation of FGFR1 and/or FGFR3 in these cells promotes neurogenesis along the J−C+ NP lineage similar to that occurring from GLAST− NG-NSCs, thus, effectively producing a second wave of neurogenesis of this type of neuron. In contrast, unabated activity of FGFR3 promotes the expansion of J+C− NGPs and J+C+ NPs, thereby simulating a third wave of neurogenesis, which can be distinguished from the first two waves by their surface expression(s) of JONES (and A2B5) and by their distinctive morphologies in vitro. Moreover, activation of FGFR2 among GLAST+ MP-NSCs promotes the emergence of GLAST+ radial glia, which is consistent with the enhancement of radial glial phenotypes in transgenic mouse experiments (Yoon et al., 2004). The combined activities of all three FGFRs are required for promoting the differentiation of GLAST+GFAP+ astrocytes. Interestingly, inactivation of these FGFRs sustains a compartment of self-renewing GLAST+ MP-NSCs whose survival may instead depend on epidermal growth factor and its receptors, which are expressed by a small fraction of cortical NSCs at E13 (Maric et al., 2003). Together, our findings emphasize the critical role of bFGF/FGFR signaling during the onset of neurogenesis in the rat cortex, and may explain the results obtained with transgenic mice and other in vitro studies that have demonstrated critical roles for bFGF and FGFRs in the expansion of NEPs, including putative NSCs and/or neural progenitors (Qian et al., 1997; Vaccarino et al., 1999; Raballo et al., 2000; Korada et al., 2002, Shin et al., 2004; Inglis-Broadgate et al., 2005; Fortin et al., 2005). However, the identities of the earliest-born neurons derived from GLAST− NSCs and GLAST+ NSCs as putative pioneer neurons and Cajal–Retzius neurons, which emerge at the beginning of neurogenesis in the rat (Meyer et al., 1998), remain to be established. Preliminary results suggest that JONES− neuronal progenitors and differentiating neurons express markers and morphologies characteristic of pioneer neurons, whereas JONES+ neuronal progenitors and differentiating neurons exhibit markers and morphologies associated with Cajal-Retzius neurons (Mishra, unpublished observations). In addition, the underlying signal transduction mechanisms mediating bFGF/FGFR signaling and their effects on fate determination of NSCs merits additional investigation. These mechanisms may involve endogenous Notch signaling (de la Pompa et al., 1997; Shen et al., 2004; Yoon et al., 2004) and/or FGF-inducible negative regulation of FGFR signaling, such as that mediated by Sprouty proteins (for review, see Mason et al., 2006). Elucidation of these mechanisms will be the target of future investigations.
Footnotes
This work was supported by the Intramural Research Program of the National Institute of Neurological Disorders and Stroke–National Institutes of Health.
References
- de la Pompa JL, Wakeham A, Correia KM, Samper E, Brown S, Aguilera RJ, Nakano T, Honjo T, Mak TW, Rossant J, Conlon RA. Conservation of the Notch signalling pathway in mammalian neurogenesis. Development. 1997;124:1139–1148. doi: 10.1242/dev.124.6.1139. [DOI] [PubMed] [Google Scholar]
- Fortin D, Rom E, Sun H, Yayon A, Bansal R. Distinct fibroblast growth factor (FGF)/FGF receptor signaling pairs initiate diverse cellular responses in the oligodendrocyte lineage. J Neurosci. 2005;25:7470–7479. doi: 10.1523/JNEUROSCI.2120-05.2005. [DOI] [PMC free article] [PubMed] [Google Scholar]
- Gotz M, Huttner WB. The cell biology of neurogenesis. Nat Rev Mol Cell Biol. 2005;6:777–788. doi: 10.1038/nrm1739. [DOI] [PubMed] [Google Scholar]
- Guillemot F. Cellular and molecular control of neurogenesis in the mammalian telencephalon. Curr Opin Cell Biol. 2005;17:639–647. doi: 10.1016/j.ceb.2005.09.006. [DOI] [PubMed] [Google Scholar]
- Hartfuss E, Galli R, Heins N, Gotz M. Characterization of CNS precursor subtypes and radial glia. Dev Biol. 2001;229:15–30. doi: 10.1006/dbio.2000.9962. [DOI] [PubMed] [Google Scholar]
- Huttner WB, Kosodo Y. Symmetric versus asymmetric cell division during neurogenesis in the developing vertebrate central nervous system. Curr Opin Cell Biol. 2005;17:648–657. doi: 10.1016/j.ceb.2005.10.005. [DOI] [PubMed] [Google Scholar]
- Inglis-Broadgate SL, Thomson RE, Pellicano F, Targtaglia MA, Pontikis CC, Cooper JD, Iwata T. FGFR3 regulates brain size by controlling progenitor cell proliferation and apoptosis during embryonic development. Dev Biol. 2005;279:73–85. doi: 10.1016/j.ydbio.2004.11.035. [DOI] [PubMed] [Google Scholar]
- Kaabeche K, Guenou H, Bouvard D, Didelot N, Listrat A, Marie PJ. Cbl-mediated ubiquitination of α5 integrin subunit mediates fibronectin-dependent osteoblast detachment and apoptosis induced by FGFR2 activation. J Cell Sci. 2005;118:1223–1232. doi: 10.1242/jcs.01679. [DOI] [PubMed] [Google Scholar]
- Korada S, Zheng W, Basilico C, Schwartz ML, Vaccarino FM. Fibroblast growth factor 2 is necessary for the growth of glutamate projection neurons in the anterior neocortex. J Neurosci. 2002;22:863–875. doi: 10.1523/JNEUROSCI.22-03-00863.2002. [DOI] [PMC free article] [PubMed] [Google Scholar]
- Mansukhani A, Bellosta P, Sahni M, Basilico C. Signaling by fibroblast growth factors (FGF) and fibroblast growth factor receptor 2 (FGFR2)-activating mutations blocks mineralization and induces apoptosis in osteoblasts. J Cell Biol. 2000;149:1297–1308. doi: 10.1083/jcb.149.6.1297. [DOI] [PMC free article] [PubMed] [Google Scholar]
- Maric D, Barker JL. Neural stem cells redefined: a FACS perspective. Mol Neurobiol. 2004;30:49–76. doi: 10.1385/MN:30:1:049. [DOI] [PubMed] [Google Scholar]
- Maric D, Barker JL. Fluorescence-based sorting of neural stem cells and progenitors. Curr Protocols Neurosci. 2005;(Suppl 33):1–29. doi: 10.1002/0471142301.ns0318s33. 3.18. [DOI] [PubMed] [Google Scholar]
- Maric D, Maric I, Ma W, Lahjouji F, Somogyi R, Wen XL, Sieghart W, Fritschy JM, Barker JL. Anatomical gradients in proliferation and differentiation of embryonic rat CNS accessed by buoyant density fractionation: α3, β3 and γ2 GABAA receptor subunit coexpression by postmitotic neocortical neurons correlates directly with cell buoyancy. Eur J Neurosci. 1997;9:507–522. doi: 10.1111/j.1460-9568.1997.tb01628.x. [DOI] [PubMed] [Google Scholar]
- Maric D, Maric I, Barker JL. Buoyant density gradient fractionation and flow cytometric analysis of embryonic rat cortical neurons and progenitor cells. Methods. 1998;16:247–259. doi: 10.1006/meth.1998.0682. [DOI] [PubMed] [Google Scholar]
- Maric D, Maric I, Chang YH, Barker JL. Stereotypical physiological properties emerge during early neuronal and glial lineage development in the embryonic rat neocortex. Cereb Cortex. 2000;10:729–747. doi: 10.1093/cercor/10.8.729. [DOI] [PubMed] [Google Scholar]
- Maric D, Liu QY, Maric I, Chaudry S, Chang YH, Smith SV, Sieghart W, Fritschy JM, Barker JL. GABA expression dominates neuronal lineage progression in the embryonic rat neocortex and facilitates neurite outgrowth via GABAA autoreceptor/Cl− channels. J Neurosci. 2001;21:2343–2360. doi: 10.1523/JNEUROSCI.21-07-02343.2001. [DOI] [PMC free article] [PubMed] [Google Scholar]
- Maric D, Maric I, Chang YH, Barker JL. Prospective cell sorting of embryonic rat neural stem cells and neuronal and glial progenitors reveals selective effects of basic fibroblast growth factor and epidermal growth factor on self-renewal and differentiation. J Neurosci. 2003;23:240–251. doi: 10.1523/JNEUROSCI.23-01-00240.2003. [DOI] [PMC free article] [PubMed] [Google Scholar]
- Marin O, Rubenstein JL. A long, remarkable journey: tangential migration in the telencephalon. Nat Rev Neurosci. 2001;2:780–790. doi: 10.1038/35097509. [DOI] [PubMed] [Google Scholar]
- Mason JM, Morrison DJ, Basson MA, Licht JD. Sprouty proteins: multifaceted negative-feedback regulators of receptor tyrosine kinase signaling. Trends Cell Biol. 2006;16:45–54. doi: 10.1016/j.tcb.2005.11.004. [DOI] [PubMed] [Google Scholar]
- Meyer G, Soria JM, Martinez-Galan JR, Martin-Clemente B, Fairen A. Different origins and developmental histories of transient neurons in the marginal zone of the fetal and neonatal rat cortex. J Comp Neurol. 1998;397:493–518. [PubMed] [Google Scholar]
- Ming GL, Song H. Adult neurogenesis in the mammalian central nervous system. Annu Rev Neurosci. 2005;28:223–250. doi: 10.1146/annurev.neuro.28.051804.101459. [DOI] [PubMed] [Google Scholar]
- Mohammadi M, Froum S, Hamby JM, Schroeder MC, Panek RL, Lu GH, Eliseenkova AV, Green D, Schlessinger J, Hubbard SR. Crystal structure of an angiogenesis inhibitor bound to the FGF receptor tyrosine kinase domain. EMBO J. 1998;17:5896–5904. doi: 10.1093/emboj/17.20.5896. [DOI] [PMC free article] [PubMed] [Google Scholar]
- Mori T, Buffo A, Gotz M. The novel roles of glial cells revisited: the contribution of radial glia and astrocytes to neurogenesis. Curr Top Dev Biol. 2005;69:67–99. doi: 10.1016/S0070-2153(05)69004-7. [DOI] [PubMed] [Google Scholar]
- Qian X, Davis AA, Goderie SK, Temple S. FGF2 concentration regulates the generation of neurons and glia from multipotent cortical stem cells. Neuron. 1997;18:81–93. doi: 10.1016/s0896-6273(01)80048-9. [DOI] [PubMed] [Google Scholar]
- Raballo R, Rhee J, Lyn-Cook R, Leckman JF, Schwartz ML, Vaccarino FM. Basic fibroblast growth factor (Fgf2) is necessary for cell proliferation and neurogenesis in the developing cerebral cortex. J Neurosci. 2000;20:5012–5023. doi: 10.1523/JNEUROSCI.20-13-05012.2000. [DOI] [PMC free article] [PubMed] [Google Scholar]
- Reynolds BA, Rietze RL. Neural stem cells and neurospheres—re-evaluating the relationship. Nat Methods. 2005;2:333–336. doi: 10.1038/nmeth758. [DOI] [PubMed] [Google Scholar]
- Seaberg RM, van der Kooy D. Stem and progenitor cells: the premature desertion of rigorous definitions. Trends Neurosci. 2003;26:125–131. doi: 10.1016/S0166-2236(03)00031-6. [DOI] [PubMed] [Google Scholar]
- Shen Q, Goderie SK, Jin L, Karanth N, Sun Y, Abramova N, Vincent P, Pumiglia K, Temple S. Endothelial cells stimulate self-renewal and expand neurogenesis of neural stem cells. Science. 2004;304:1338–1340. doi: 10.1126/science.1095505. [DOI] [PubMed] [Google Scholar]
- Shin DM, Korada S, Raballo R, Shashikant CS, Simeone A, Taylor JR, Vaccarino F. Loss of glutamatergic pyramidal neurons in frontal and temporal cortex resulting from attenuation of FGFR1 signaling is associated with spontaneous hyperactivity in mice. J Neurosci. 2004;24:2247–2258. doi: 10.1523/JNEUROSCI.5285-03.2004. [DOI] [PMC free article] [PubMed] [Google Scholar]
- Vaccarino FM, Schwartz ML, Raballo R, Nilsen J, Rhee J, Zhou M, Doetschman T, Coffin JD, Wyland JJ, Hung YT. Changes in cerebral cortex size are governed by fibroblast growth factor during embryogenesis. Nat Neurosci. 1999;2:246–253. doi: 10.1038/6350. [DOI] [PubMed] [Google Scholar]
- Wurmser AE, Nakashima K, Summers RG, Toni N, D'Amour KA, Lie DC, Gage FH. Cell fusion-independent differentiation of neural stem cells to the endothelial lineage. Nature. 2004;430:350–356. doi: 10.1038/nature02604. [DOI] [PubMed] [Google Scholar]
- Yoon K, Nery S, Rutlin ML, Radtke F, Fishell G, Gaiano N. Fibroblast growth factor receptor signaling promotes radial glial identity and interacts with Notch 1 signaling in telencephalic progenitors. J Neurosci. 2004;24:9497–9506. doi: 10.1523/JNEUROSCI.0993-04.2004. [DOI] [PMC free article] [PubMed] [Google Scholar]