

Abstract
To understand how electrical signal processing in cortical pyramidal neurons is executed by ion channels, it is essential to know their subcellular distribution. M-channels (encoded by Kv7.2–Kv7.5/KCNQ2–KCNQ5 genes) have multiple important functions in neurons, including control of excitability, spike afterpotentials, adaptation, and theta resonance. Nevertheless, the subcellular distribution of these channels has remained elusive. To determine the M-channel distribution within CA1 pyramidal neurons, we combined whole-cell patch-clamp recording from the soma and apical dendrite with focal drug application, in rat hippocampal slices. Both a M-channel opener (retigabine [N-(2-amino-4-(4-fluorobenzylamino)-phenyl) carbamic acid ethyl ester]) and a blocker (XE991 [10,10-bis(4-pyridinylmethyl)-9(10H)-antracenone]) changed the somatic subthreshold voltage response but had no observable effect on local dendritic responses. Under conditions promoting dendritic Ca2+ spikes, local somatic but not dendritic application of M-channel blockers (linopirdine and XE991) enhanced the Ca2+ spikes. Simultaneous dendritic and somatic whole-cell recordings showed that the medium afterhyperpolarization after a burst of spikes underwent strong attenuation along the apical dendrite and was fully blocked by somatic XE991 application. Finally, by combining patch-clamp and extracellular recordings with computer simulations, we found that perisomatic M-channels reduce the summation of EPSPs. We conclude that functional M-channels appear to be concentrated in the perisomatic region of CA1 pyramidal neurons, with no detectable M-channel activity in the distal apical dendrites.
Keywords: hippocampus, Kv7/KCNQ/M-channels, pyramidal neuron, excitability, potassium channels, synaptic transmission
Introduction
The large principal cells of the mammalian cerebral cortex are equipped with a rich variety of ion channels, which are distributed in various patterns over the complex geometrical shapes of these cells. In concert and in interaction with passive electrical properties, the activity of these channels determine the electrical signal processing in the various subcellular compartments of the neuron, as well as the resultant output of action potentials that emerge from the “calculations” performed by cell and propagate along the axon to the next set of neurons. To understand the functions of neuronal ion channels, it is therefore essential to know their subcellular distribution.
Over the last decade, several voltage-gated ion channels have been shown to be distributed highly non-uniformly within pyramidal cells (Hoffman et al., 1997; Magee, 1998). However, although this class of neurons has been intensely studied for decades, the distributions of some of their most important channel types are still unknown. In particular, little is known about the subcellular distribution of the Kv7 subfamily of voltage-gated potassium channels (also called KCNQ or M-channels) in this and other cell types.
Members of the Kv7 subfamily of K+ channel proteins are known to underlie the M-current (IM) (Wang et al., 1998), which is a voltage-gated K+ current characterized by a unique combination of features: (1) a negative activation range, beginning well below the spike threshold; (2) very slow activation and deactivation; and (3) lack of inactivation (Brown and Adams, 1980). These features enable IM to exert a significant, often dominant influence on neuronal subthreshold excitability and to regulate spike generation, axonal excitability, and neurotransmitter release from nerve terminals in many types of neurons (Halliwell and Adams, 1982; Storm, 1989; Hu et al., 2002; Yue and Yaari, 2004; Gu et al., 2005; Peters et al., 2005; Vervaeke et al., 2006a). Given this multitude of actions, it is not surprising that mutations of Kv7/KCNQ genes cause a variety of hereditary diseases in humans, including epilepsy in newborns and deafness (Jentsch, 2000).
The IM of hippocampal pyramidal cells (Halliwell and Adams, 1982) is generated by Kv7.2 and Kv7.3 subunits, with some contribution from Kv7.5 (Shah et al., 2002). Immunostaining of Kv7 protein is concentrated at axon initial segments (IS) (Devaux et al., 2004), but some was also detected at the soma and the most proximal dendrite (Cooper et al., 2000; Roche et al., 2002). Although clear immunocytochemical evidence for Kv7 channels in the distal dendrites of CA1 pyramidal neurons is lacking, two electrophysiology reports have suggested that there are functional Kv7 channels in the distal dendrites (Chen and Johnston, 2004; Yue and Yaari, 2006).
This study aims at determining the subcellular distribution of functional M-channels within the somatodendritic compartments of CA1 pyramidal neurons. By combining somatic and dendritic patch-clamp recording with focal drug application, extracellular recording, and computational modeling, we obtained converging evidence that M-channels are concentrated in the perisomatic region of this cell type, with no, if any, measurable channel activity in the dendrites.
Materials and Methods
Slice preparation.
Horizontal hippocampal slices were prepared as described previously (Vervaeke et al., 2006b). Briefly, male Wistar rats (4–10 weeks of age; mean, 7 weeks) were anesthetized with an intraperitoneal injection of Equithesin (3 ml/kg body weight), before being perfused transcardially with ice-cold (∼4°C) modified cutting solution (in mm): 230 sucrose, 25 NaHCO3, 1.25 KCl, 1.25 KH2PO4, 7 MgCl2, 1.0 CaCl2, and 16 glucose (saturated with 95% O2–5% CO2). After decapitation, hippocampal slices were cut with a Vibratome 3000 slicer (Vibratome, St. Louis, MO), stored at room temperature (20–25°C), and transferred to a recording chamber. Here they were submerged in artificial CSF (aCSF) containing the following (in mm): 125 NaCl, 25 NaHCO3, 1.25 or 2.25 KCl, 1.25 KH2PO4, 1.0 MgCl2, 1.0 CaCl2, and 16 glucose (saturated with 95% O2-5% CO2). During recording, slices were submerged in aCSF with 1.6 or 2.0 mm CaCl2 at 30–35°C (<0.5°C variation within each recording). In the experiment illustrated in Figures 5 and 6 and supplemental Figures S3 and S4 (available at www.jneurosci.org as supplemental material), the slices were incubated in 10 μm DNQX to block epileptic activity after applying a high dose (2–3 mm) of 4-aminopyridine (4-AP). In the experiment illustrated in Figure 9, 10 μm gabazine [6-imino-3-(4-methoxyphenyl)-1(6H)-pyridazinebutanoic acid hydrobromide (SR95531 hydrobromide)] and 200 μm saclofen (or 2-hydrosaclofen) were added to all extracellular media to block GABAA and GABAB receptors.
Figure 5.
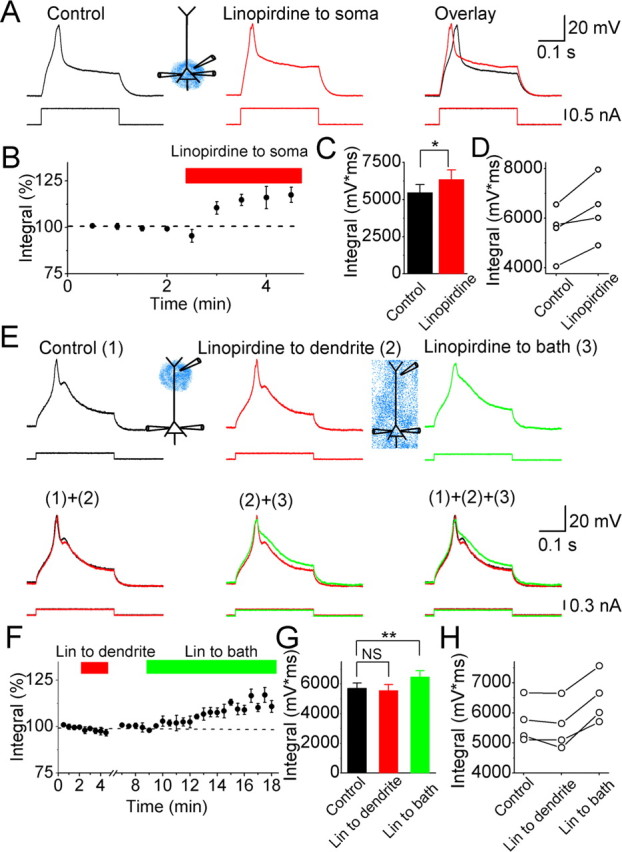
Effects of linopirdine on calcium spikes in CA1 pyramidal neurons. A, Typical example showing the effects of perisomatically applied linopirdine (30 μm; red) on the Ca2+ spike. B, Normalized time course of the effect of perisomatically applied linopirdine on the integral of the depolarizing response, including the Ca2+ spike. C, Summary diagram showing the effect of perisomatically applied linopirdine on the response integral (n = 4). D, The depolarizing response integral values from four cells before and after perisomatically applied linopirdine. E, Ca2+ spikes under control conditions [(1), black trace], after dendritic application of 30 μm linopirdine (212 μm from the soma) [(2), red], and then after bath applying 30 μm linopirdine [(3), green]. F, Normalized time course of the effect of dendritic focal application of linopirdine (Lin) and subsequent bath-applied linopirdine on the response integral. G, Summary diagram showing the response integral, under control conditions, after focally applying linopirdine to the dendrite, and then after bath applying linopirdine for all cells tested (n = 4). **p < 0.01; NS, not significant. H, Depolarizing response integral values from four cells under control conditions, after dendritic application of linopirdine, and subsequently after bath applying linopirdine. In all of the experiments illustrated in this figure, the hippocampal slices were incubated with 20 μm retigabine (to boost the M-current), 10 μm DNQX, 1 μm TTX, and 3 mm 4-AP, which were all routinely added to all the extracellular media. Ca2+ spikes were evoked by injecting a 300-ms-long depolarizing current pulse into the soma from a membrane potential of −68 mV.
Figure 6.
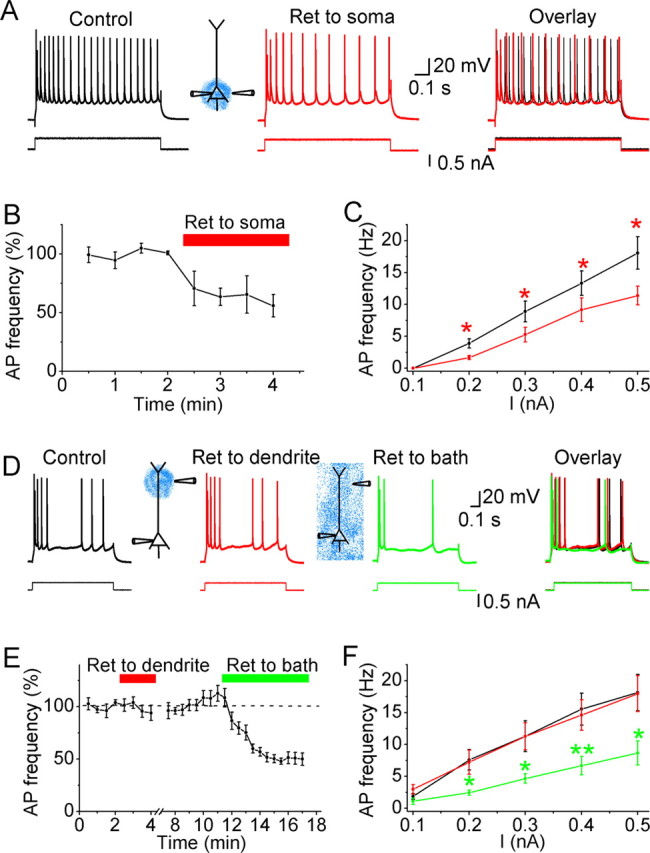
Effects of retigabine on the excitability of CA1 pyramidal neurons under hyperexcitable conditions. A, Representative example showing that perisomatic application of retigabine (20 μm; Ret, red) reduced the excitability of the neuron. B, Normalized time course of perisomatically applied retigabine on the average action potential (AP) frequency in response to injection of 900-ms-long depolarizing current pulses of constant intensity. C, Average action potential frequency plotted against the amplitude of the current injected into the neuron, before (black) and after focal perisomatic application of retigabine (20 μm; red). *0.01 < p < 0.05; n = 4. D, Typical example showing the effects of 20 μm retigabine applied to the dendrite (292 μm from the soma; red trace) and subsequent bath-applied retigabine (20 μm; green) on the excitability of a CA1 pyramidal neuron. E, Normalized time course of dendritically applied and subsequent bath-applied retigabine (20 μm) on the average action potential frequency in response to injection of 900-ms-long depolarizing current pulses of constant intensity (n = 5). F, Average action potential frequency plotted against the amplitude of the injected current pulse, under control condition (black), after focal application of retigabine (20 μm) to the dendrite (red), and after subsequent bath-applied retigabine (green). *0.01 < p < 0.05; **p < 0.01; n = 5. Note that dendritically applied retigabine had no significant effect on the input (I)/output (mean spike frequency) properties of the cells. In all experiments used in this figure, the slices were incubated with 10 μm DNQX and 2–3 mm 4-AP. Action potential trains were evoked by injecting 900-ms-long depolarizing current pulses into the soma from a membrane potential of approximately −68 mV.
Figure 9.
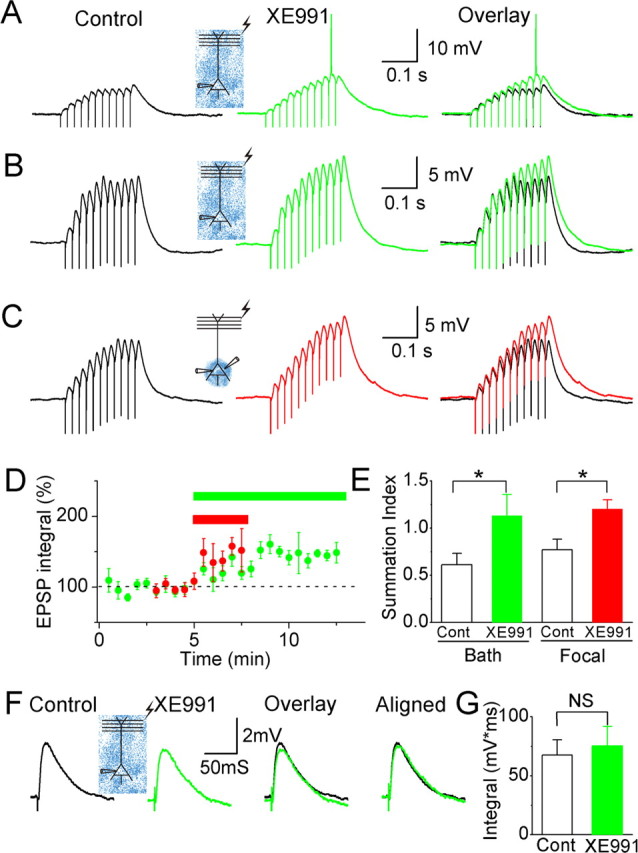
Effects of XE991 on somatic EPSP summation. A, EPSPs (in response to 11 stimuli at 50 Hz) before (black trace) and after (green trace) bath applying XE991 (10–20 μm). In the presence of bath-applied XE991, the same stimulation evoked larger EPSPs, which triggered an action potential (truncated). B, EPSPs before (black) and after (green) bath applying XE991 while QX222 (2 mm) was included in the whole-cell patch pipette to block voltage-gated Na+ channels in the postsynaptic neuron. C, EPSPs before (black) and after (red) perisomatic application of XE991. Again, 2 mm QX222 was included in the patch pipette. D, Normalized time course of the effects of bath-applied (green bar and symbols; n = 4) and perisomatically applied (red bar and symbols; n = 5) XE991 on the integral of the EPSPs. XE991 caused a significant increase in the summed EPSP integral (p < 0.01 and p < 0.05 for global and focal application, respectively). The effects of the two application methods were not significantly different (p = 0.27). For all the four perisomatic applications and four of the five bath applications of XE991, recordings were obtained with 2 mm QX222 in the patch pipette. E, Summary diagram of the effect of XE991 on EPSP summation [EPSP summation index = (late EPSP integral)/(early EPSP integral); the early EPSP integral includes 150 ms after the first stimulus; the late EPSP integral includes 150 ms after the 10th stimulus]. Both bath and perisomatic application of XE991 caused a significant increase of the EPSP summation index (*0.01 < p < 0.05). F, Single EPSPs before (black) and after (green) bath applying XE991. G, Summary diagram of the effect of XE991 on the integral of a single EPSP. There was no significant enhancement by bath-applied XE991 (n = 7; NS, not significant). In all of the experiments illustrated in this figure, the background membrane potential was depolarized to approximately −58 mV by injecting steady-state current through the somatic recording pipette. Gabazine at 10 μm and 200 μm saclofen (or hydrosaclofen) were routinely applied to bath to block GABAA and GABAB receptors.
Whole-cell patch-clamp recording.
Whole-cell patch-clamp recordings were obtained from the soma and/or the apical dendrite of visually identified CA1 pyramidal neurons, viewed with an upright microscope (BX50 with infrared differential interference contrast; Olympus Optical, Tokyo, Japan). The patch pipettes were filled with a solution containing the following (in mm): 140 KMeSO4 (or 70 K-gluconate and 70 KMeSO4), 10 HEPES, 2 ATP, 0.4 GTP, 1.0 MgCl2, 10 phosphocreatine, 10 inositol, and 0.1 EGTA (giving a pipette resistance of 2–5 MΩ for somatic recording and 8–12 MΩ for dendritic recording). The series resistance was 15–90 MΩ, and all potentials were corrected for the junction potential (−8 to −10 mV). Current-clamp recordings were obtained with one or two Dagan (Minneapolis, MN) BVC 700A amplifiers. In most of the experiments (24 of 27 experiments) illustrated in Figures 1–4 and all of the experiments illustrated in Figure 5 and supplemental Figure S4 (available at www.jneurosci.org as supplemental material) (n = 14), membrane potential recording and current injection were performed with separate patch electrodes placed adjacent to each other (<20 μm apart) on the same neuron, to avoid any errors in membrane potential measurement caused by imperfect bridge balance. In the experiments illustrated in Figure 9, single or a train of EPSPs was evoked every 30 s with an aCSF-filled glass pipette placed at the border between stratum radiatum and stratum lacunosum moleculare (stimulation intensity, 100–200 μs, 30–300 μA).
Figure 1.

Effects of the Kv7/KCNQ/M-channel opener retigabine (Ret) on somatic subthreshold responses and excitability in CA1 pyramidal neurons. A, The somatic voltage responses of a neuron to injection of current ramp at the soma, under control conditions [(1), black], after focal perisomatic application of retigabine (20 μm) [(2), red], and after bath application of retigabine (20 μm) [(3), green]. B, The same traces as in A, shown at an expanded voltage scale (the spikes are clipped). C, D, The somatic chord resistance (RChord) (C) and current threshold (IThreshold) (D) values of five neurons under control conditions, after focal perisomatic application of retigabine, and after subsequent bath application of retigabine. **p < 0.01; NS, not significant.
Figure 2.

Effects of retigabine on dendritic subthreshold responses and excitability in CA1 pyramidal neurons. A, The dendritic voltage responses of a neuron to dendritic current ramp injection before (black) and after (red) focal application of retigabine (Ret; 20 μm) to the dendritic recording site (218 μm from the soma). B, Typical example of the dendritic voltage responses to dendritic current ramp injection (239 μm from the soma) before (black) and after (green) bath application of retigabine (20 μm). Arrows indicate the first backpropagating spikes, and asterisks indicate dendritic Ca2+ spikes. C, D, The same traces as in A and B, respectively; the voltage responses between −66 mV and spike threshold were superimposed on expanded scales. Arrows indicate the first spikes evoked by current ramp injection before (black) and after (green) bath applying retigabine. E, F, The dendritic chord resistance (RChord) (E) and current threshold (IThreshold) (F) values of all of the six cells tested, under control condition, after dendritically applied retigabine, and after subsequent bath-applied retigabine. In three of the cells (▴), RChord was reduced after bath-applied retigabine, but retigabine caused no significant change in RChord in the set of all six cells (E) (NS, not significant), whereas IThreshold was significantly changed (F). **p < 0.01.
Figure 3.
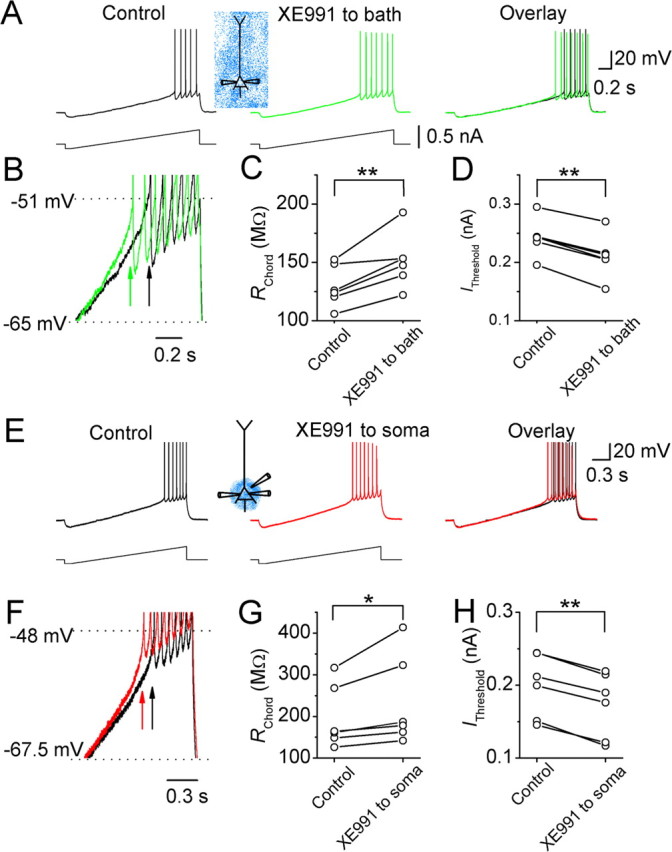
Effects of the Kv7/KCNQ/M-channel blocker XE991 on the somatic subthreshold excitability of CA1 pyramidal neurons. A, The somatic voltage responses of a CA1 pyramidal neuron to somatic injection of a current ramp before (black) and after (green) bath application of XE991 (20 μm). B, Traces from A superimposed on expanded scales. Arrows indicate the first action potentials in response to the somatic current ramp injection before (black) and after (green) bath application of XE991. C, D, The somatic RChord and IThreshold values of six cells before and after bath applying XE991 (20 μm). E, The somatic voltage responses of a neuron to somatic injection of a current ramp before (black) and after (red) focal application of XE991 (20 μm) to the perisomatic region. F, Traces from E superimposed on expanded scales. Arrows indicate the first spikes in response to somatic current ramp injection before (black) and after (red) focally applied XE991. G, H, The somatic RChord (G) and IThreshold (H) values of six cells before and after focal application of XE991 to the perisomatic region. *0.01 < p < 0.05; **p < 0.01.
Figure 4.
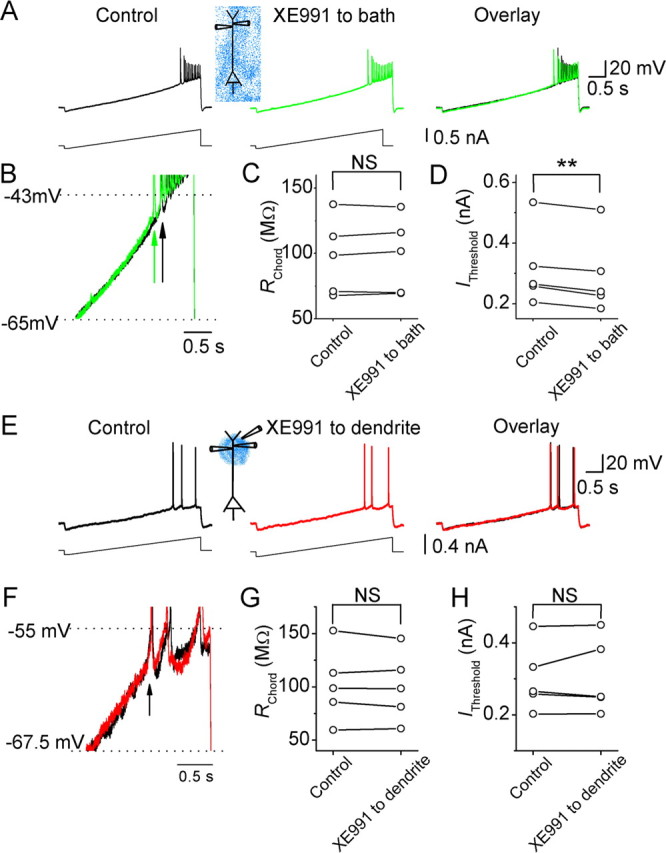
Effects of XE991 on the dendritic subthreshold excitability of CA1 pyramidal neurons. A, Dendritic voltage (∼300 μm from the soma) responses to dendritic injection of a current ramp under control conditions (black) and after bath applying XE991 (20 μm; green). B, The traces from A superimposed on expanded scales. Note that the first backpropagating action potential appeared earlier in the response to current ramp injection after bath applying XE991. Arrows indicate the time point of the first backpropagating action potentials before (black) and after (green) XE991. C, D, The dendritic RChord (C) and IThreshold (D) values of five cells before and after bath-applied XE991. E, The dendritic (217 μm from the soma) voltage responses of a CA1 pyramidal cell to dendritic current ramp injection before (black) and after (red) focal application of XE991 (20 μm) near the recording site. F, The traces from E superimposed on expanded scales. Note that focally applied XE991 to the dendrite had no effect on the timing of the first action potential in response to current ramp injection. G, H, The dendritic RChord (G) and IThreshold (H) values of all five cells tested, before and after application XE991 (20 μm) to the dendrite. **p < 0.01; NS, not significant.
Focal drug application.
Focal application of chemical compounds was performed by pressure ejection (75–150 mBar) through a patch pipette (tip diameter, ∼1–2 μm) placed adjacent to the targeted neuron (<20 μm). The compounds were diluted to the final concentration with the following puffing solution: 150 mm NaCl, 10 mm HEPES, 1.25 or 2.25 mm KCl, 1.25 mm KH2PO4, 1.6 or 2.0 mm CaCl2, 1.0 mm MgCl2, 16 mm glucose, and 0.2% fast green, pH 7.3–7.4. The concentration of K+ and Ca2+ ions in the puffing solution always matched those in the aSCF. Two to 3 mm 4-AP and 10 μm DNQX were included in the puffing solution for the experiments illustrated in Figure 6. In the experiments of Figure 5 and supplemental Figure S4 (available at www.jneurosci.org as supplemental material), 1 μm TTX was also included in the puffing solution, in addition to 3 mm 4-AP and 10 μm DNQX. Gabazine at 10 μm and 200 μm saclofen were included in the puffing solution for the experiments illustrated in Figure 9. By visualizing the spread of fast green (Golding et al., 1999), the diameter of the region being perfused by the puffing was estimated to be between 50 and 100 μm. The speed of focal application of chemical compounds was estimated by focally puffing a solution containing 140 mm K+ to the apical dendrite of CA1 neurons. The resulting depolarizing response rose to its maximal level with a time constant of 0.76 ± 0.16 s (n = 5).
Data acquisition and analysis.
The data were acquired with pClamp 9 (Molecular Devices, Palo Alto, CA) at a sampling rate of 20 kHz and measured and plotted with pClamp 9 and Origin 7 (Microcal Software, Northampton, MA). Values are expressed as mean ± SEM. Two-tailed Studentapos;s t test was used for statistical analysis (α = 0.05). In Figures 1–4, two different parameters were used to estimate the effects of retigabine [N-(2-amino-4-(4-fluorobenzylamino)-phenyl) carbamic acid ethyl ester] and XE991 [10,10-bis(4-pyridinylmethyl)-9(10H)-antracenone] on current ramp responses: (1) the chord resistance between −63 mV and the action potential threshold (RChord) was calculated by dividing the voltage difference between the threshold of the first spike and −63 mV, with the amount of current needed to evoke the first spike from a membrane potential of −63 mV during a slow current ramp injection; (2) the minimal current level needed to evoke a spike during a current ramp injection (IThreshold). When a current ramp was injected into the soma, IThreshold indicates the minimal current required to evoke a somatic spike, which is initiated at the axonal initial segment (supplemental Fig. S1A, available at www.jneurosci.org as supplemental material). When a current ramp was injected into the dendrite (see Figs. 2, 4), comparison of somatic and dendritic action potential latency (Stuart and Sakmann, 1994) showed that the first spike recorded in the distal apical dendrite was also initiated at the axonal initial segment and backpropagated into the apical dendrite (supplemental Fig. S1B, available at www.jneurosci.org as supplemental material). Therefore, IThresold also indicates the minimal current amplitude required to trigger a somatic spike, even if the current ramp (ramp slopes, 0.15–0.40 nA/s) was injected into the distal dendrite. In 4 of 11 experiments illustrated in Figures 1 and 2, retigabine fully inhibited action potential discharge (see Fig. 1A). In these cases, we used the membrane potential and current value at the end of the ramp as substitutes for the voltage and current values of the spike threshold in our calculations of RChord and IThreshold. Although the latter procedure probably leads to a slight underestimation of the effects of retigabine for these four cells, it does not change the conclusion of this study. The input resistance at the resting membrane potential (RMP) was calculated from the slope (at the RMP, i.e., when the injected current vas 0) of the voltage–current relationship in response to injection of a current ramp from −50 to 60 pA (ramp slopes, 0.15–0.40 nA/s). In Figure 5 and supplemental Figure S4 (available at www.jneurosci.org as supplemental material), the integral of the response was defined as the total area under the depolarizing response (including Ca2+ spikes) and was measured during the entire depolarizing current pulse injection.
Extracellular field potential recording.
Extracellular field potentials were recorded in submerged slices maintained at 31 ± 0.5°C, with low-resistance glass micropipettes filled with aCSF and coupled to Axoclamp 2B amplifiers (Molecular Devices). Schaffer collateral axons were stimulated (pulse duration, 150 μs) every 30 s with a sharpened tungsten stimulation electrode placed in the middle of stratum radiatum. One field electrode was positioned in stratum pyramidale ∼200 μm from the stimulation electrode, whereas the other field electrode was positioned in the middle of stratum radiatum (∼200–400 μm from the other electrode) (see Fig. 8A). Bicuculline free base (10 μm) and dl-APV (100 μm) were routinely included the aCSF to block GABAA and NMDA receptors.
Figure 8.
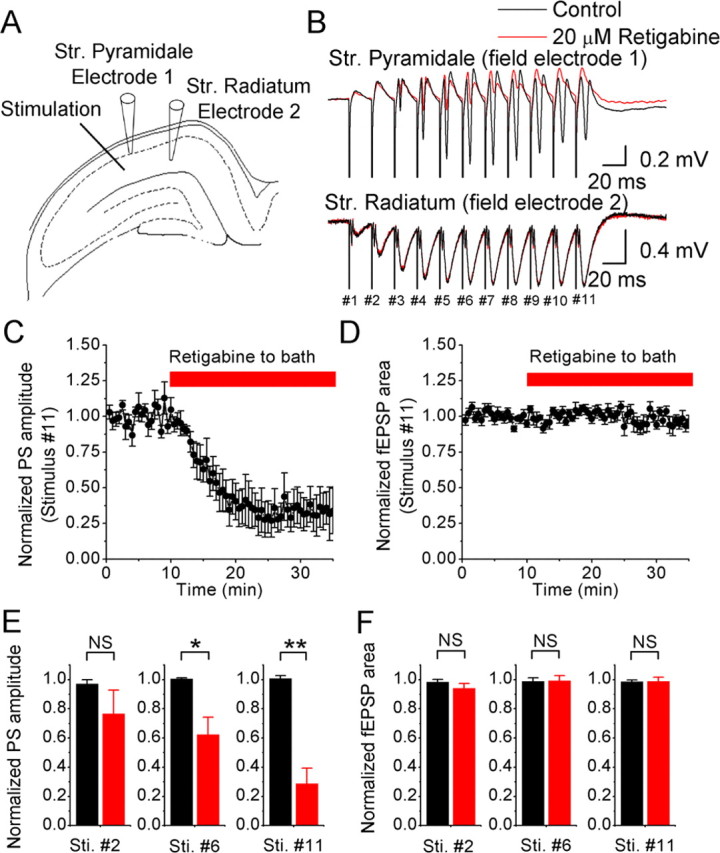
Effects of retigabine (20 μm) on field EPSPs and population spikes (PS) recorded simultaneously in area CA1. A, A tungsten electrode positioned in the middle of the stratum radiatum was used to stimulate Schaffer collaterals at 50 Hz (11 shocks). Field electrode 1 was placed proximal to the stimulation electrode in the stratum pyramidale, and field electrode 2 was positioned more distal from the stimulation site in the stratum radiatum. The current amplitude of the stimulation was adjusted to just below the amplitude that evokes population spikes in the stratum radiatum as observed by field electrode 2. Bicuculline (10 μm) and APV (100 μm) were routinely added to the perfusion medium. B, Typical example of the responses in the stratum pyramidale and stratum radiatum. Application of 20 μm retigabine (red trace) reduced the population spikes but not the fEPSPs. C and D show the average normalized time course of the retigabine effect on the amplitude and area of the last evoked population spike and fEPSP, respectively (n = 7 slices). E, Summary data of the retigabine effect on the population spikes amplitude in response to the 2nd, 6th, and 11th stimulus (Sti.) (NS, not significant; *0.01 < p < 0.05; **p < 0.01; stimulus #2, n = 6; stimulus #6, n = 7; stimulus #11, n = 7). F as in E, summary data of the retigabine effect on the fEPSP area (stimulus #2, n = 6; stimulus #6, n = 4; stimulus #11, n = 7).
Chemicals.
The selective M-channel blocker XE991 was obtained from DuPont (Billerica, MA) and NeuroSearch (Ballerup, Denmark). Retigabine was generously provided by Drs. J. B. Jensen and W. D. Brown (NeuroSearch). DNQX, dl-APV, saclofen, hydrosaclofen, and gabazine (SR95531 hydrobromide) were purchased from Tocris Cookson (Bristol, UK). TTX was obtained from Alomone Labs (Jerusalem, Israel). The remaining chemicals were purchased from Sigma-Aldrich (Oslo, Norway).
Computer simulations.
We used a reduced compartmental model of a CA1 pyramidal neuron as described by Vervaeke et al. (2006b) with two modifications.
An increasing body of evidence supports an axonal distribution of IM in CA1 pyramidal neurons (Devaux et al., 2004; Chung et al., 2006; Pan et al., 2006). Therefore, we elaborated the model with an axon hillock, axon initial segment, and myelinated segments interspaced with nodes, as described by Mainen et al. (1995) and based on published anatomical data. The axon hillock is the transition from the soma to the axon IS and was modeled as consisting of 10 segments, each 1.0 μm long, with a linear tapering diameter from 4 to 1 μm. The initial segment connects the axon hillock with the first stretch of myelinated axon. The initial segment has a 1.0 μm diameter and consists of 10 segments, 1.5 μm long. We included three stretches of myelinated axon, each consisting of four 25-μm-long segments with a 1.5 μm diameter. The nodes between the myelinated axon stretches are 1.0 μm long and 1.0 μm in diameter.
The experimental data in this study showed a slightly elevated spike threshold compared with the sharp-electrode recordings previously obtained by our group (Gu et al., 2005), on which much of our previous model development was based. Therefore, we adapted the INa Markov model to our new data by shifting the V1/2 of the squeezed exponential describing the transition from closed state (C2) to the open state (O) by 6 mV.
The membrane resistance and capacitance of the various compartments were as follows, respectively: soma, 20 kΩ/cm2 and 1.0 μF/cm2; dendritic compartments, 6 kΩ/cm2 and 1.5 μF/cm2; axon hillock, 50 kΩ/cm2 and 0.75 μF/cm2; initial segment, 50 kΩ/cm2 and 0.75 μF/cm2; myelinated segments, 500 kΩ/cm2 and 0.04 μF/cm2; nodes, 1.00 kΩ/cm2 and 0.75 μF/cm2. The intracellular resistance was 100 Ω/cm. Simulations were performed for 30°C.
The M-current was described by extended Hodgkin–Huxley kinetics (Borg-Graham, 1999), and the parameters were as follows: reversal potential of −80 mV; γ = 0.4; base rate (1/ms) of 0.002; τ0 of 1.0 ms; Q10 = 5; reference temperature of 30.0°C. The V1/2 of the activation curve was −44.0 mV (“Wang native”), −40.0 (“Wang expressed”), −31.1 (“Wickenden control”), and −61.1 (“Wickenden retigabine”). The valence (steepness) of the activation was 3.0 (“Wang native”), 4.0 (“Wang expressed”), 2.8 (“Wickenden control”), and 3.2 (“Wickenden retigabine”) (Wang et al., 1998; Wickenden et al., 2000). The maximal conductance of IM was 8.0 pS/μm2 (see Fig. 10A–D,F) or 2.5 pS/μm2 (see Fig. 10E).
Figure 10.
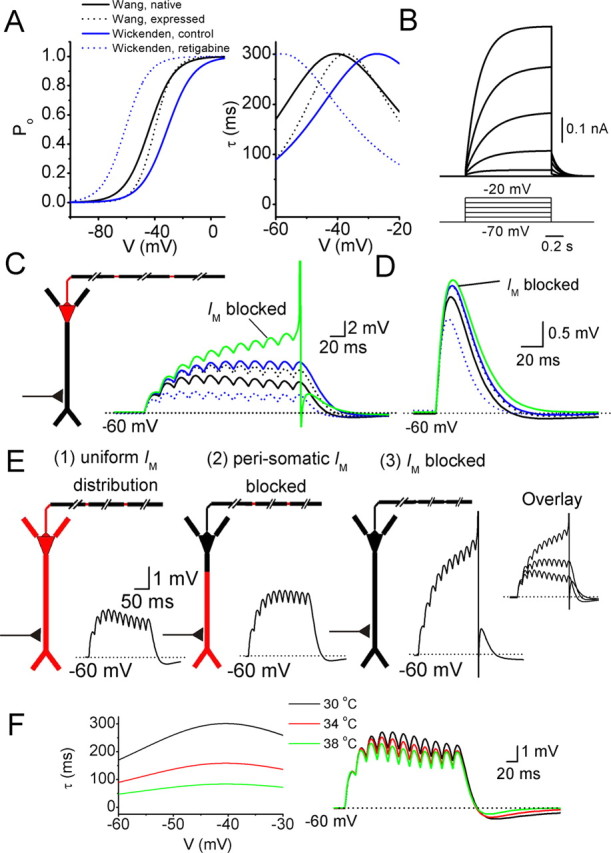
M-current effects on EPSP summation in a CA1 pyramidal neuron model. A, Left, A series of steady-state activation curves as reported by Wang et al. (1998) and Wickenden et al. (2000). “Wang native” (black line) refers to the kinetics of native IM recorded from sympathetic neurons. “Wang expressed” (black dots) refers to expressed KCNQ2 and KCNQ3 channels in oocytes. “Wickenden control” (blue line) refers to expressed KCNQ2 and KCNQ3 channels in CHO cells, and “Wickenden retigabine” (blue dots) refers to KCNQ2/3 in CHO cells with 10 μm retigabine in the extracellular medium. In B, E, and F, “Wang native” was used. A, Right, Voltage dependence of the time constants of activation and deactivation. B, Voltage-clamp simulations at the soma, by stepping the voltage from −70 to −20 mV in 10 mV steps. For each voltage step, the difference in current response before and after removing IM from the model is shown. C, In the diagram, red indicates the presence of IM in the soma, axon hillock, initial segment, and axon nodes. A synaptic conductance in the apical dendrite 300 μm from the soma was activated 11 times at 50 Hz. Somatic voltage responses for IM with different kinetics (compare with A) are shown. D, The same synapse as in C was activated once, and the effects of IM on the somatic EPSP are shown, for different IM kinetics (compare with A). E, Effects of different IM distributions on synaptic summation. The synaptic stimulation was the same as in C. (1), Red indicates a uniform density of IM in all compartments except the myelinated axon segments. (2), IM was removed from the “perisomatic” region, i.e., from the soma, axon hillock, initial segment, and the first 50 μm of the proximal dendrites. (3), Model with no IM. F, Left shows the time constant of activation and deactivation for three different simulation temperatures. Right shows the effects of varying the simulation temperature on the somatic voltage in response to a series of EPSPs, evoked as in C.
The synaptic conductance had a reversal potential of 0 mV, rise and decay time constant of 0.1 and 10 ms, respectively, and a maximal conductance of 0.0015 μS.
Results
Whole-cell patch-clamp recordings were obtained from 92 CA1 pyramidal neurons at either the soma (n = 73) or the apical dendrite (n = 26). The resting membrane potential was −75.9 ± 0.8 mV at the soma, −73.8 ± 1.0 mV at the proximal dendrite (<250 μm from the soma; n = 21), and −74.2 ± 3.1 mV at the distal dendrite (>250 μm from the soma; n = 5).
Effects of local application of M-channel modulators on subthreshold excitability
To compare the contribution of M-channels with the excitability in different subcellular compartments, we performed whole-cell current-clamp tests at the soma (see Figs. 1, 3) and at the apical dendrite (see Figs. 2, 4), while applying the M-channel opener retigabine (20 μm) or the blocker XE991 (20 μm). Retigabine enhances IM by shifting its activation curve in the hyperpolarizing direction and reducing its deactivation speed (Tatulian et al., 2001). We applied retigabine either globally to the entire slice by bath application, focally to the perisomatic region, or to the distal dendritic area of the recorded cell. To standardize these tests, the background membrane potential of the recorded neuron was maintained at −73 mV by steady current injection. As shown in Figure 1A, each test started with a negative current step (−0.1 to −0.2 nA, 100 ms), causing a hyperpolarization, followed by a depolarizing current ramp (ramp slopes, 0.15–0.40 nA/s) that produced a slowly progressing depolarization until spikes were evoked. The depolarizing ramp covered a voltage range from approximately −80 to approximately −40 mV. In the upper part of this voltage range, M-channels are partly activated (Halliwell and Adams, 1982; Wang et al., 1998; Hu et al., 2002). Therefore, blockade or enhancement of the activity of these channels is expected to change the slope of the depolarizing ramp response.
First, we tested the effects of retigabine on the perisomatic subthreshold excitability in CA1 pyramidal neurons during somatic whole-cell recording (Fig. 1). Focal application of retigabine (20 μm) to the perisomatic area reduced the depolarizing slope above −63 mV and inhibited spike discharge in all of the neurons tested with somatic recording (n = 5) (Fig. 1A,B). Thus, perisomatic application of retigabine caused the spikes that were evoked by the depolarizing current ramp to be delayed or disappear (Fig. 1A, red traces). Furthermore, when perisomatic focal application was followed by bath application of retigabine (20 μm), the effect of the latter was occluded so that the voltage responses to current ramp injection were virtually identical under these two conditions (compare traces 2 and 3 in Fig. 1A, bottom right). To compare the effect of M-channel modulation on the slope of depolarizing ramp, we compared the chord resistance shown by the ramp responses between −63 mV and the spike threshold (RChord) before and after the application of retigabine. We found that applying retigabine to the entire cell by bath application (n = 5) caused no additional reduction of RChord than applying retigabine focally only to the perisomatic region (n = 5) (Fig. 1C). Figure 1D illustrates that retigabine significantly raised the minimal current level that was required to trigger an action potential (IThreshold) during a somatic current ramp injection, but there was no difference between the effects of perisomatic and bath-applied retigabine.
Next, we performed whole-cell recordings from the apical dendrite at distances of ∼200–300 μm from the soma (mean distance, 244 ± 11 μm; n = 6) (Fig. 2). To test whether M-channels influence dendritic excitability, we used similar current ramp injections into the dendrite as used in the soma, after adjusting the steady-state dendritic membrane potential to the same level as the soma (approximately −73 mV) for comparison. In sharp contrast to its effect at the soma, focal application of retigabine to the dendrite (218 μm from the soma in the example illustrated in Fig. 2A) had no consistent effect on the voltage responses to current ramp injection (Fig. 2A,C). Neither the slope of the depolarizing ramp (RChord) (Fig. 2E) nor IThreshold (Fig. 2F) was significantly changed by focal, dendritic application of retigabine (n = 5). When we globally enhanced all M-channels on the recorded cell by bath-applied retigabine, there was no significant change of the slope of dendritic voltage responses to current ramp injection (Fig. 2B,D,E) for the whole set of experiments (n = 6), although in three of these six cells, RChord was reduced (37.3 ± 8.2% reduction; n = 3) (Fig. 2E, filled triangles). Computer simulations indicated that the reduction of RChord in these three experiments could be explained by the opening of perisomatic M-channels in response to bath-applied retigabine (data not shown). Thus, opening of perisomatic K+ channels is likely to enhance the axial current flow from the dendrite to the soma during dendritic current ramp injection, thereby reducing the amplitude of local dendritic voltage responses. However, the quantitative effect is likely to be quite variable, because it depends on several factors, such as the distance from the recording site to the soma, the diameter of the apical trunk, and the number of oblique side branches on the apical trunk. Especially the latter can vary quite a bit between neurons.
Interestingly, the threshold current needed to evoke spikes (IThreshold) was significantly raised by bath-applied retigabine (n = 6) (Fig. 2F). This increase in IThreshold after bath applying retigabine probably also reflects the enhancement of M-channels in the perisomatic region, in which incoming voltage signals initiate action potentials, and the change can be seen even in the dendritic recordings, because the somatically triggered spikes backpropagate to the dendrite (supplemental Fig. S1, available at www.jneurosci.org as supplemental material). These results suggest that there was essentially no M-channel activity below the spike threshold on the distal apical dendrite or that the M-channels in this region were too few or too remote to appreciably affect the somatic response.
The results obtained with retigabine suggest that the M-channels of CA1 pyramidal cells are concentrated in the perisomatic region. However, because retigabine may not be entirely selective for this channel type (Rundfeldt and Netzer, 2000; Otto et al., 2002), we also tested our hypothesis by using the highly specific M-channel blocker XE991 (Wang et al., 1998) (Figs. 3, 4). Again, we injected current ramps during whole-cell recording from the soma (Fig. 3) or the distal dendrite (Fig. 4). Bath application of XE991 (20 μm) increased the slope of the somatic voltage responses and enhanced spike discharge in response to current ramp injection into the soma (Fig. 3A,B). Consequently, the somatic chord resistance (RChord) was significantly increased (n = 6) (Fig. 3C) and IThreshold was reduced by bath-applied XE991 (Fig. 3D). Similarly, focal application of XE991 to the perisomatic region (Fig. 3E,F) also caused a significant increase of somatic RChord (n = 6) (Fig. 3G) and a reduction of IThreshold (Fig. 3H).
In contrast, bath-applied XE991 had no effect on the slope of dendritic voltage responses to dendritic current ramp injections (222 ± 23 μm away from the soma; n = 5) (Fig. 4A,B). Thus, the dendritic RChord remained unchanged after bath applying XE991 (n = 5) (Fig. 4C), although IThreshold was significantly reduced by bath-applied XE991 (Fig. 4D). Again, the change in IThreshold after bath application probably reflects the effect on M-channels in the perisomatic region, which facilitates action potential initiation there and, hence, the occurrence of backpropagating dendritic spikes. Furthermore, focal application of XE991 to the dendrite (Fig. 4E,F) had no significant effect on either dendritic RChord (n = 5) (Fig. 4G) or IThreshold (Fig. 4H) during dendritic recording (196 ± 9 μm away from the soma; n = 5).
It is important to determine whether M-channels regulate the somatic or dendritic resting membrane potential or input resistance. To test this, we combined somatic or dendritic patch-clamp recording with focal application of retigabine and XE991. Application of retigabine or XE991 focally to the soma or to the dendrites of CA1 pyramidal neurons had no significant effect on the resting membrane potential or on the input resistance measured at the resting membrane potential, suggesting that M-channels are closed at the resting potential in CA1 pyramidal cells. The results from these experiments, which are summarized in Table 1, are consistent with our previous findings from transgenic suppression of M-channels (Peters et al., 2005). The RMP found here (approximately −75 mV) is close to that measured non-invasively by cell-attached patch recording (Fricker et al., 1999). However, some studies have suggested that M-channels may contribute to the RMP of these neurons (Halliwell and Adams, 1982; Yue and Yaari, 2006). This discrepancy might be attributable to depolarization caused by the impalement with sharp microelectrodes used in those studies. Thus, the RMP they found (approximately −65 mV) was considerably less negative than our values (approximately −75 mV) and may partly activate IM.
Table 1.
Effects of retigabine and XE991 on the somatic and dendritic RMP and the input resistance (Rinput) at RMP
| Somatic RMP | Somatic RInput at RMP | |
|---|---|---|
| Control | −73.8 ± 6.7mV | 95.8 ± 32.5 MΩ |
| Applying retigabine to the soma | −74.3 ± 6.2 mV | 98.8 ± 9.6 MΩ |
| p value (n) | 0.54 (n = 4) | 0.94 (n = 4) |
| Dendritic RMP | Dendritic RInput at RMP | |
|---|---|---|
| Control | −74.5 ± 2.1 mV | 68.8 ± 12.7 MΩ |
| Applying retigabine to the dendrite (239 ± 15 μm away from the soma) | −74.6 ± 2.7 mV | 61.3 ± 8.3 MΩ |
| p value (n) | 0.9 (n = 4) | 0.3 (n = 4) |
| Somatic RMP | Somatic RInput at RMP | |
|---|---|---|
| Control | −81.9 ± 0.8 mV | 85.1 ± 14.3 MΩ |
| Applying XE991 to the soma | −82.2 ± 0.6 mV | 81.0 ± 7.5 MΩ |
| p value (n) | 0.75 (n = 6) | 0.85 (n = 4) |
| Dendritic RMP | Dendritic RInput at RMP | |
|---|---|---|
| Control | −73.9 ± 3.3 mV | 63.5 ± 7.0 MΩ |
| Applying XE991 to the dendrite (196 ± 9 μm away from the soma) | −74.4 ± 3.4 mV | 65.4 ± 4.5 MΩ |
| p value (n) | 0.43 (n = 5) | 0.78 (n = 5) |
Effects of retigabine and linopirdine on dendritic Ca2+-dependent electrogenesis
The previous section suggests that M-channels only play a minimal role in sculpturing the subthreshold voltage response at the distal apical dendrite of CA1 pyramidal cells. To further explore the distribution of M-channels and test whether they might still play a role in dendritic electrogenesis, we next tested whether they could regulate dendritic calcium spikes (Yue and Yaari, 2006). For this purpose and to obtain the same conditions as used previously by Yue and Yaari (2006), we facilitated dendritic Ca2+ spike generation by blocking the dendritic A-type transient K+ current with 4-AP (2–3 mm, bath applied) (Magee and Carruth, 1999; Yue and Yaari, 2006). To determine whether somatic depolarizing current injection could reliably trigger Ca2+ spikes in the distal dendrite, we performed simultaneous somatic and dendritic recordings [supplemental Fig. S2 (available at www.jneurosci.org as supplemental material), the distance between the two recording pipettes in this example was 290 μm]. Under control conditions, somatic injection of depolarizing current pulses from −68 mV evoked a train of somatic action potentials, which propagated back into the distal dendrite (n = 3) (supplemental Fig. S2A, available at www.jneurosci.org as supplemental material). Bath application of 3 mm 4-AP broadened and increased the amplitude of the backpropagating spikes in the distal dendrite (n = 3) (Fig. S2B, available at www.jneurosci.org as supplemental material). The broadness of the dendritic spikes (supplemental Fig. S2D, available at www.jneurosci.org as supplemental material) suggests that they were boosted by enhanced Ca2+ influx after blocking A-type K+ channels with 4-AP (Magee and Carruth, 1999). When we subsequently bath-applied TTX (1 μm, still in the presence of 4-AP), injection of depolarizing current pulses into the soma evoked a “pure” Ca2+ spike, which could be recorded both at the soma and the dendrite (n = 3) (Fig. S2C, available at www.jneurosci.org as supplemental material). This Ca2+ spike was probably initiated at the soma and backpropagated into the apical dendrite, because the rising phase of the somatic spike was steeper than that of the dendritic spike. Nevertheless, the dendritic membrane potential during the Ca2+ spike was depolarized beyond −40 mV, which is more than sufficient to activate M-channels. Similar results were obtained in all cells tested (n = 3).
After establishing that dendritic Ca2+ spikes could be evoked simply by injecting depolarizing current pulses into the soma in the presence of bath-applied 4-AP, we next tested whether M-channels can suppress them (Fig. 5). To this end, we focally applied linopirdine, which also blocks M-channels, to either the perisomatic area or the distal dendrite of CA1 pyramidal neurons in the presence of TTX (1 μm) and 4-AP (3 mm). Because the functional impact of M-channels on dendritic excitability was undetectable under basal conditions (Figs. 1–4), we incubated the slices in 20 μm retigabine to facilitate the opening of M-channels before testing, thus trying to maximize the chance that we would be able to detect possible subtle effects of sparse dendritic M-channels (Fig. 5). When Ca2+ spikes were evoked by injecting a 300-ms-long current pulse into the soma, focal application of linopirdine (30 μm) to the perisomatic region consistently enhanced the Ca2+ spikes, shortening their peak latency and/or increasing their integral (p = 0.03; n = 4) (Fig. 5A–D). In contrast, no clear effect was observed when linopirdine (30 μm) was focally applied to the dendrite (224 ± 6 μm away from the soma; p = 0.2; n = 4) (Fig. 5E–H). However, subsequent bath application of linopirdine (30 μm) reliably enhanced the Ca2+ spike (p = 0.001; n = 4) (Fig. 5E–H), suggesting that the lack of a clear effect of dendritic focal application of linopirdine was not attributable to the absence of functional M-channels in the cell during somatic whole-cell recording.
Next we tested whether focal application of retigabine to the dendrite could suppress spike discharge and bursting in the presence of 4-AP (3 mm) (Fig. 6). Injection of a depolarizing current pulse (900 ms, 0.1–0.5 nA) into the soma evoked a burst of spikes followed by repetitive firing. Retigabine applied to the soma region consistently inhibited spike discharge (Fig. 6A,B) in response to current pulses (n = 4, *0.01 < p < 0.05) (Fig. 6C). In contrast, focal application of retigabine to the dendrite (289 ± 22 μm away from the soma; n = 5) had no significant effect on spike discharge (Fig. 6D, left, E, F), although the discharge was reliably reduced by subsequent bath-applied retigabine (n = 5; *0.01 < p < 0.05 and **p < 0.01) (Fig. 6F). As a positive control, focal application of a solution containing 140 mm K+ to the same dendritic region, in which retigabine was focally applied, consistently depolarized the neuron in the same experiment (n = 5; data not shown). Because spike bursting in the presence of 4-AP is triggered by dendritic Ca2+ spikes (Magee and Carruth, 1999), we reasoned that, if there are M-channels in the dendrite, enhancing their activity with retigabine should cause a local shunt of the spike-generating Ca2+ current in the dendrite and should consequently reduce the somatic bursting. However, neither somatic nor dendritic application of retigabine had any significant effect on bursting in the presence of 4-AP [firing frequency during burst: 142 ± 10 and 123 ± 7 Hz before and after somatic application (n = 4); 123 ± 14 and 108 ± 13 Hz before and after dendritic application of retigabine (n = 5); p > 0.1 in both cases] (supplemental Fig. S3, available at www.jneurosci.org as supplemental material). Given the evidence that bursting in the presence of 4-AP was triggered by dendritic Ca2+ spikes (Magee and Carruth, 1999), these results indicate that there are few if any M-channels in the distal dendrites or, in any case, that their impact on dendritic excitability is small, even under conditions when M-channel activation was facilitated by retigabine and other dendritic K+ channels (A-type) were blocked by 4-AP.
Because of the long electrotonic distance between the distal dendrites and the soma, a change of the Ca2+ spike in the distal dendrite may not always be detectable during somatic recording. Therefore, we performed whole-cell patch-clamp recordings at the soma and along the apical dendrite (up to 313 μm away from the soma; n = 6) and focally applied XE991 close to the recording sites (supplemental Fig. S4, available at www.jneurosci.org as supplemental material). Again, Ca2+ spikes were evoked by injecting a 300-ms-long current pulse through whole-cell patch pipettes in the presence of 1 μm TTX and 3 mm 4-AP. When XE991 was focally applied to either the soma or the very proximal dendrite (24 μm away from the soma) (supplemental Fig. S4A, available at www.jneurosci.org as supplemental material), it strongly enhanced local Ca2+ spikes at the recording site. The effects of focally applied XE991 on the local Ca2+ spikes decayed sharply along the apical dendrite (n = 6 cells; by e-fold every 56 μm when fitted with a monoexponential curve) (Fig. S4C, available at www.jneurosci.org as supplemental material). Thus, in the recordings from the distal apical dendrite [Fig. S4B, (available at www.jneurosci.org as supplemental material) the distance was 313 μm from the soma], focal application of XE991 near the recording sites had no effect on the local dendritic Ca2+ spikes.
Perisomatic M-channels generate the mAHP after a spike train
In CA1 pyramidal neurons, a burst of action potentials is usually followed by two types of afterhyperpolarization (AHP): an AHP of medium duration (mAHP) (100–300 ms) and a slow AHP (sAHP) (duration >1 s) (for review, see Storm, 1990). We found that IM and Ih contribute to the mAHP in a voltage-dependent manner (Storm, 1989; Gu et al., 2005): at depolarized membrane potentials, the mAHP is generated only by IM, with no contribution from apamin-sensitive SK channels, whereas at hyperpolarized membrane potentials, the mAHP is generated by Ih (Gu et al., 2005). We hypothesized that the mAHP at depolarized potentials is initiated in the perisomatic region because M-channels appear to be concentrated there, from both our data (Figs. 1–6) and immunocytochemical studies (Devaux et al., 2004; Pan et al., 2006). To test our hypothesis, we made simultaneous whole-cell recordings from the apical dendrite and the soma of CA1 pyramidal cells (n = 6) (Fig. 7). By injecting steady current through the recording pipettes, we depolarized both the soma and the dendrite to approximately −58 mV, at which potential Ih is deactivated (Halliwell and Adams, 1982; Storm, 1989; Magee, 1998) and does not contribute to the mAHP (Gu et al., 2005). Subsequent injection of a depolarizing current pulse (50–100 ms, 0.1–1 nA) at the soma evoked a burst of action potentials (two to five spikes), which backpropagated into the apical dendrite (Fig. 7A, insets). This spike burst was followed by an mAHP (Fig. 7A, black triangle) and an sAHP (open triangle). The amplitude of the mAHP showed strong attenuation along the apical dendrite (12.0 ± 1.7% attenuation per 100 μm along the dendrite) (Fig. 7A,B). These results suggest that the mAHP after a burst of action potentials is normally conducted passively from the soma into the apical dendrite. To test whether the mAHP is generated in the perisomatic region, in a distal part of the axon, or in the distal basal dendrites, we focally applied XE991 (20 μm) to the perisomatic region during somatic recording (n = 4). Because the overlap between the mAHP and sAHP [Gu et al. (2005), their Fig. 4] may partly obscure the effect of XE991 on the mAHP, we suppressed the sAHP by including 50 μm forskolin in the bath (Madison and Nicoll, 1986) (Fig. 7E; this procedure was also used in two of the four experiments summarized in Fig. 7C,D). Under control conditions, a burst of somatic action potentials reliably triggered a prominent mAHP, which was consistently blocked by focal application of XE991 to the perisomatic region (Fig. 7E). Furthermore, perisomatic XE991 application was followed by bath-applied XE991 to block all M-channels on the recorded neuron (n = 2). In these cases, the effect of bath-applied XE991 was occluded by the previous perisomatically applied XE991. Figure 7, C and D, summarizes the effect of perisomatically applied XE991 on the mAHP from all of the cells tested in this way (n = 4, 2 cells with and 2 cells without forskolin in the bath; p = 0.003). Two of the cells were tested without forskolin to avoid possible effects of forskolin-induced enhancement of M-channels through the cAMP–protein kinase A pathway (Schroeder et al., 1998), but we found no evidence for such an effect of forskolin. Together, these results support our hypothesis that the mAHP at depolarized membrane potentials is generated by M-channels in the perisomatic region, with no detectable contribution from the distal apical dendrite.
Figure 7.

The M-channel-dependent mAHP at depolarized membrane potentials originates perisomatically in CA1 pyramidal neurons. A, Simultaneous whole-cell recording from the soma (black) and apical dendrite (195 μm from the soma; blue traces) of the same CA1 pyramidal neuron, showing the responses to somatic injection of a depolarizing current pulse (100 ms, 0.6 nA). At both recording sites, the background membrane potential was adjusted to approximately −58 mV with steady current injection. The depolarizing parts of the responses are truncated to emphasize the afterhyperpolarizations, but the insets show the full spike amplitudes (calibration: 30 mV, 0.1 s). Note that both the mAHP (filled triangle) and sAHP (open triangle) are smaller in the dendrite. B, The ratio of dendritic to somatic mAHP amplitude plotted against the distance between the dendritic and somatic recording pipettes. C, Summary diagram showing the effect of perisomatic application of XE991 (20 μm) on the mAHP (**p < 0.01; n = 4). D, The amplitude of the mAHP from four neurons before and after perisomatic XE991 application. E, Typical example showing the mAHP (filled triangle) after a train of four somatic action potentials, under control condition (black trace), after focal application of XE991 to the perisomatic area (red trace), and then after bath applying XE991 (green trace). Note that perisomatic XE991 fully blocked the mAHP and occluded the effect of subsequent bath-applied XE991. In the cell illustrated in E and two of the cells in C and D, the slice was incubated with 50 μm forskolin before testing to block sAHP.
So far, our results obtained with whole-cell recording suggested a perisomatic distribution of functional M-channels in CA1 pyramidal cells. However, our results might conceivably be biased by the fact that our dendritic patch-clamp recordings were obtained from neurons with a relatively thick apical dendrite, i.e., those cells whose distal dendrite was thicker than 1 μm and therefore “patchable.” Furthermore, whole-cell recording might change the intracellular environment by dialysis via the recording pipette. Therefore, we wanted to test our hypothesis by a less invasive method that samples the responses from a population of CA1 pyramidal cells. For this purpose, we performed extracellular recording in the CA1 region of rat hippocampal slices. This method has the advantage that the cytoplasm is not dialysed and the recorded signal represents the summed response from a population of neurons, thus minimizing any bias.
Effects of retigabine on population spikes and field EPSPs during extracellular recording
During extracellular field recordings, we repetitively stimulated the Schaffer collaterals with a tungsten electrode placed in the middle of stratum radiatum, i.e., 200–400 μm away from the stratum pyramidale. We recorded the population spikes, corresponding to somatic action potentials in CA1 pyramidal cells, with an electrode (Fig. 8A, Electrode 1) in stratum pyramidale, and the EPSPs in the distal dendrite tree [field EPSPs (fEPSPs)] with an electrode in the distal part of stratum radiatum (Electrode 2). Bath application of 20 μm retigabine consistently reduced the amplitude of population spikes in stratum pyramidale (n = 7) (Fig. 8B,C,E). In contrast, retigabine had no effect on the field EPSPs in stratum radiatum (n = 7) (Fig. 8B,D,F). These results suggest that M-channels do not contribute noticeably to EPSP integration in the distal part of the dendrite tree, thus supporting our hypothesis that the density of functional M-channels in CA1 pyramidal neurons is very low in the distal dendrites compared with the perisomatic region.
Perisomatic M-channels reduce somatic EPSP summation
We next asked whether M-channels regulate synaptic integration at the soma of CA1 pyramidal neurons. EPSPs were evoked by stimulating axons at the border between stratum radiatum and stratum lacunosum moleculare. The strength of synaptic stimulation (11 stimuli at 50 Hz in Fig. 9A–E) was carefully adjusted to keep the EPSP train just below the action potential threshold during the control period. Bath-applied XE991 (10–20 μm) strongly increased the EPSP summation (Fig. 9A) in all cells tested (n = 4) and eventually induced firing on top of the enlarged EPSPs in three of four experiments (Fig. 9A). Because of the shunting effect of spikes on EPSPs (Hausser et al., 2001), EPSP summation will be reduced if an EPSP train triggers spikes after XE991. To quantify the effect of XE991 on EPSP summation, we performed a second set of experiments in which we blocked the voltage-gated Na+ channels on the postsynaptic neurons by including 2 mm 2-[(2,6-dimethylphenyl)amino]-N,N,N-trimethyl-2-oxoethaniminium chloride (QX222) (Strichartz, 1973) in the whole-cell patch pipettes. As shown in Figure 9, B and D, bath application of XE991 strongly enhanced the EPSP train (the integral values under the EPSP train were 1222 ± 105 mV/ms under control condition and 1845 ± 200 mV/ms after bath applying XE991; n = 5; p = 0.006). When we compared the integral of the early and late part of the EPSP train, which was measured within a 150-ms-long time window after the first and the 10th synaptic stimuli, we found that XE991 preferentially enhanced the late part of the EPSP train. As a consequence, somatic EPSP summation was significantly enhanced by XE991. The EPSP summation index, which is the ratio of the late to the early EPSP integral, was significantly increased from 0.61 ± 0.12 to 1.13 ± 0.22 by XE991 (n = 5; p = 0.01). These results indicate that M-channels suppress somatic EPSP summation by preferentially dampening the late part of an EPSP train. To further test whether this effect was mediated by perisomatic M-channels, we focally applied XE991 to the perisomatic region. As illustrated in Figure 9C–E, perisomatic application of XE991 produced a similar effect on the integral and the summation of the EPSP train as bath-applied XE991. This similarity suggests that M-channels strongly regulate EPSP integration in the perisomatic region. Next we analyzed the effect of XE991 on single EPSPs. We found that a single EPSP was little affected by bath-applied XE991 under our recording conditions (n = 7; p = 0.2) (Fig. 9F,G). This also supports our results illustrated in Figure 9, B and C, that XE991 preferentially enhance the late part of an EPSP train.
Mathematical modeling of IM effects on EPSP integration
We used computational modeling to test whether our experimental data on IM effects on synaptic integration is quantitatively compatible with our knowledge of M-channel kinetics, as well as with other passive and active electrical properties of CA1 pyramidal cells. Also, we used the model to test which subcellular distribution of M-channels agrees best with our experimental results and to explore how synaptic integration may vary as a function of changes in M-channel properties. The latter is relevant to changes in IM caused by neuromodulation, temperature variations, and drugs targeting M-channels, such as retigabine.
We used a CA1 pyramidal model similar to the ones we used previously (Vervaeke et al., 2006b). Because there is an increasing amount of experimental data supporting a role for IM in axons, we elaborated the morphology of the model with an axon hillock, initial segment, and myelinated segments interspaced with nodes (see Materials and Methods). Based on our experimental results (Figs. 1–9), as well as previously published data (Devaux et al., 2004; Chung et al., 2006; Vervaeke et al., 2006a; Yue and Yaari, 2006), IM was located in the soma, axon hillock, axon initial segment, and axon nodes of the model (Fig. 10C).
Although IM has been studied intensively in recent years, there are so far no complete experimental descriptions of IM kinetics in CA1 pyramidal and other neurons. In particular, there is a lack of data on activation and deactivation time constants over a wide range of membrane potentials. We used two reports that partly describe IM kinetics; (1) Wang et al. (1998), who described IM in rat sympathetic neurons and in oocytes expressing KCNQ2 and KCNQ3 channels; and (2) Wickenden et al. (2000), who described KCNQ2 and KCNQ3 currents in CHO cells and the effects of retigabine. We chose these reports because they show a broad range of steady-state activation curves (Fig. 10A, left), spanning much of the range in IM properties described in other reports, as well as effects of IM modulation. Although the published data are incomplete, they cover well the range that is important for IM effects on synaptic integration (−70 to −50 mV). Except when explicitly stated, we used the kinetics for native IM reported by Wang et al. (1998) (Fig. 10B,E,F).
First, we used an IM distribution limited to the soma, axon hillock, initial segment, and axon nodes, as indicated by red in the diagram of Figure 10C. To account for the maximal conductance of IM in our model, we performed somatic voltage-clamp simulations (Fig. 10B). The maximal response at −20 mV is ∼0.6 nA, which is very similar to IM recorded at the same potential in CA1 pyramidal neurons (Hu et al., 2002).
Next, we used this model to explore the effects of IM on a train of EPSPs (Fig. 10C), starting from a somatic membrane potential of −60 mV (compare Fig. 9). To simulate synaptic input, a synaptic conductance 300 μm from the soma was repeatedly activated (Fig. 10C) (see Materials and Methods). Figure 10C shows how synaptic summation is affected by IM variants with different kinetics (compare with the four curves in Fig. 10A). We also tested how IM affects single EPSPs. In agreement with our experimental results (Fig. 10D), we found that IM in the model had little impact on single EPSPs. The little effect seen by modeling (<0.5 mV) would probably not be noticed in the presence of normal experimental noise. Note that retigabine strongly affects IM kinetics (Fig. 10A, the dotted blue, negatively shifted activation curve). As a result, retigabine is predicted to have strong effects on synaptic summation (Fig. 10C, dotted blue) and even on a single EPSP (Fig. 10D, dotted blue).
The results shown in Figure 9 support a perisomatic/axosomatic localization of IM. However, if one assumes, hypothetically, a uniform distribution of IM all over the cell, would blockade of the perisomatic IM be expected to cause a clear difference in the synaptic summation recorded in the soma? And, if IM were present in the distal dendrites, would blockade of the dendritic IM then cause a noticeable effect on synaptic summation recorded in the soma? To explore these questions, we distributed IM uniformly except in the myelinated axon segments (diagram in Fig. 10E, left). We adjusted the maximal IM conductance so that somatic voltage-clamp simulations again gave the same somatically recorded IM amplitude as in Figure 10B. The synaptic stimulation protocol used in Figure 10C was then repeated, first with intact IM (Fig. 10E, left) and, subsequently, when IM was “blocked” in the perisomatic region [i.e., removed from the soma, axon hillock, initial segment, and the first 50 μm proximal dendrites; Fig. 10E, (2)]. This “blockade” of the perisomatic IM caused a clear increase in summation [compare (1) and (2) in E]. Finally, when IM was removed also from the dendritic compartments (i.e., the distal dendritic IM was blocked), the summated EPSPs were further strongly increased [compare (2) and (3) in E]. This suggests that, if IM was uniformly distributed or distributed at a comparable density only in the distal dendrites, blocking perisomatic IM or blocking the distal dendritic IM would have clear effects on EPSP summation at the soma. This supports the conclusion that the experimental results illustrated in Figure 9 does indeed strongly suggest a perisomatic distribution of IM.
Finally, given the incompleteness of experimental data on IM activation and deactivation time constants in pyramidal neurons and the high temperature sensitivity of IM kinetics (Q10 = 5), it is of interest to explore the effect of changing IM kinetics by varying the temperature parameter (Fig. 10F, left). IM kinetics changed dramatically with temperature (Fig. 10F, left). Nevertheless, variations in this parameter did not affect synaptic summation (Fig. 10F, right) as strongly as varying the V1/2 of the steady-state activation curve (Fig. 10C).
Discussion
In this study, we sought to determine the subcellular distribution of functional M-channels within the somatodendritic compartments of hippocampal CA1 pyramidal cells. In each of the seven different tests we used, the results pointed to the same conclusion: that M-channels in CA1 pyramidal neurons are concentrated near the soma and can strongly regulate somatic excitability, whereas this channel type seems to have little or no impact in the distal apical dendrites. The seven converging lines of evidence are as follows. (1) When applied at the soma, both retigabine and XE991 had clear effects on local subthreshold voltage response to current ramp injection, whereas no clear effects of these drugs were observed in the dendrites. (2) Dendritic applications of retigabine did not affect somatic spike bursts triggered by dendritic Ca2+ spikes (in the presence of 4-AP). (3) Perisomatic but not dendritic applications of M-channel blockers enhanced Ca2+ spikes (in 4-AP and TTX). (4) Bath-applied retigabine did not affect dendritic field EPSPs, although it strongly reduced somatic population spikes. (5) The mAHP was fully blocked by perisomatic applications of XE991 and showed pronounced attenuation along the apical dendrite. (6) Perisomatic application of XE991 strongly enhanced the summation of somatically recorded EPSPs. (7) Computational modeling indicated that the experimentally observed effects of XE991 on somatic EPSP summation were best explained by M-channels confined to the perisomatic region.
The consistently strong similarity between bath-applied and local somatically applied M-channel drugs support the hypothesis than no substantial dendritic M-channel effects went undetected because the local dendritic drug applications were too restricted. These results speak against the possibility that there might be a significant density of M-channels in the distal dendrites. It also seems highly unlikely that presynaptic M-channels might affect our synaptic tests (Figs. 8, 9), because we recently found that there are no such effects in strata radiatum and lacunosum moleculare under the basal conditions we used here (Vervaeke et al., 2006a).
Together, our results indicate that M-channels in CA1 pyramidal cells are clustered near the soma and the channel density is far lower in the distal apical dendrite. This conclusion is consistent with immunocytochemical data indicating that M-channels are concentrated in the axon IS (Devaux et al., 2004; Pan et al., 2006) and targeted to the axon rather than the apical dendrite of CA1 pyramidal neurons (Chung et al., 2006). Although putative single M-channel events have been recorded from the distal apical dendrites of these neurons, the density was low (Chen and Johnston, 2004). Considering also their small single-channel conductance [∼10 pS (Selyanko et al., 2001)], M-channels probably do not significantly regulate dendritic excitability, at least when other dendritic K+ channels are intact. In a recent report, it was suggested that M-channels can repolarize dendritic Ca2+ spikes but only after blocking other dendritic K+ channels with 4-AP (Yue and Yaari, 2006). However, our tests of effects of M-channel modulators on dendritic Ca2+ spikes in the presence of 4-AP did not support their conclusion (Figs. 5, 6) (supplemental Figs. S3, S4, available at www.jneurosci.org as supplemental material). What might be the reason for this discrepancy? Possibly, whole-cell recording might cause more rundown of IM than sharp-electrode intracellular recording. However, this seems an unlikely explanation, because of the following. (1) Our extracellular recordings, which do not disturb the intracellular environment, did not detect any change in the fEPSPs by retigabine (Fig. 8) or XE991 (Vervaeke et al., 2006a). (2) IM normally shows very little rundown within the time window [∼ 5 min (Hu et al., 2002, their Fig. 6B)], during which M-channel modulators were focally applied in this study. (3) M-channel modulators consistently had clear effects when applied to the perisomatic region, in stark contrast to the weak effects of dendritic applications. An alternative explanation might be the different drug application methods: whereas Yue and Yaari puffed drugs from a patch pipette on the slice surface, we applied drugs from a pipette positioned close to visually identified dendrites of the recorded cell, thus restricting drug effects to dendrites within ∼50 μm from the pipette tip to avoid spread to the perisomatic region.
We found that M-channels reduce somatic EPSP summation in CA1 pyramidal cells. During a train of EPSP, the slow M-channels open mainly toward the end of the EPSP train, thus reducing the late postsynaptic response ∼150 ms after onset but having minimal effect on single EPSP. This observation is consistent with our previous results indicating that IM mainly dampen voltage responses at frequencies below ∼3 Hz at ∼30°C (Hu et al., 2002). Because of the large electrotonic distance between the soma and distal dendrites, the somatic M-channels may have only a very weak impact on distal dendritic EPSP integration. Nevertheless, perisomatic M-channels are capable of effectively inhibiting spiking in response to EPSPs of distant origin (Fig. 9A). Because backpropagating spike acts as a retrograde signal from the soma to the dendrite (Stuart et al., 1997), perisomatic M-channels may “indirectly” control these dendritic spike functions by inhibiting spike output from the perisomatic region. Recent evidence indicates that Schaffer collateral synapses can “gate” the information flow from perforant-path inputs in the distal dendrites to the soma (Jarsky et al., 2005). We hypothesize that perisomatic M-channels may facilitate such “gating” by raising the spike threshold and inhibiting somatic spike initiation in response to Schaffer input. Thus, although M-channels reduce somatic depolarization caused by Schaffer input, they also allow a stronger Schaffer input to produce more dendritic depolarization without triggering somatic spikes, thus facilitating forward propagation of distal dendritic spikes.
We also found evidence that the M-channel-dependent mAHP (Gu et al., 2005) originated at the perisomatic region. One might argue that the lack of mAHP generation in distal dendrites might not necessarily reflect a lack of dendritic M-channels but might simply be caused by less depolarization in the dendrites than at the soma during action potentials. However, in our distal dendritic recordings (>300 μm from soma) (Fig. 7), the backpropagating spike reached approximately −10 mV at the dendritic recording site, i.e., more than sufficient to activate any dendritic M-channels. Hence, our observations that the dendritic mAHP was strongly attenuated and that mAHP was fully blocked by somatic application of XE991 support a perisomatic M-channel localization.
During the mAHP, IM both hyperpolarizes the membrane and produces shunting that inhibits spiking. In hippocampal pyramidal neurons, orthodromic spikes are probably initiated in the axon distal to the IS (Colbert and Johnston, 1996). Immunocytochemical data indicate that KCNQ proteins are clustered at the IS (Pan et al., 2006), which lies between the soma and the spike initiation site. A high density of M-channels at this strategic point is probably an effective regulator of action potential generation, by attenuating EPSPs before they reach the spike initiation site, in particular during repetitive firing, when mAHPs contribute to feedback regulation of the spike frequency. In addition, for the axonal spike to invade the soma, the proximal axon must generate enough inward current to quickly depolarize the soma and activate somatic Na+ channels before they inactivate. In some conditions, in particular during repetitive firing, cumulative activation of M-channels at the IS may block spike invasion into the somatodendritic compartments by shunting this inward current. Hence, M-channels at the IS may electrically isolate the somatodendritic and the axonal compartments.
Theta oscillations in the hippocampal network may be essential for hippocampus-dependent neural coding, navigation, and memory and are thought to be important for neural coding and memory functions of the hippocampal pyramidal cells (Buzsaki, 2002). We recently showed that IM, in conjunction with the persistent sodium current (INaP) generates subthreshold resonance in the theta frequency range (5–8 Hz) in CA1 pyramidal neurons (Hu et al., 2002). To understand the hippocampal theta mechanisms, it is of crucial importance to know the distribution pattern of M-channels within the somatodendritic compartments of hippocampal pyramidal cells. According to a “classical” model of theta generation, CA1 pyramidal cells receive coherent dendritic excitatory and somatic inhibitory inputs: excitatory from the entorhinal cortex via the perforant path to the distal dendrites and inhibitory from the septum to feedforward inhibitory neurons impinging on the CA1 pyramidal somata. The interplay between these two current generating dipoles is assumed to generate the prominent hippocampal theta oscillations. Although there may be inaccuracies in this model (Buzsaki, 2002), the general scheme is supported by current-source density analysis (Mitzdorf, 1985; Buzsaki et al., 1986; Brankack et al., 1993). In conjunction with these network mechanisms, M-channels in the perisomatic region of CA1 pyramidal cells, interacting with a similarly located persistent Na+ current (Vervaeke et al., 2006b), may play a crucial role in mediating theta resonance (Leung and Yu, 1998; Hu et al., 2002) and rebound excitation at theta frequencies (Cobb et al., 1995), as well as a corresponding spiking frequency preference (Pike et al., 2000). Thus, by supporting theta, as well as through other mechanisms (Yue and Yaari, 2004; Gu et al., 2005), M-channels in pyramidal and other hippocampal neurons (Cooper et al., 2001; Lawrence et al., 2006) may be important for hippocampus-dependent memory, as indicated by results from transgenic suppression of this channel type (Peters et al., 2005).
Footnotes
This work was supported by the Norwegian Research Council via the Norwegian Functional Genomics Research program (FUGE), STORFORSK, and Norwegian Centre of Excellence programs and by European Commission Contract QLG3-1999-00827. We thank Dr. Lyle Graham for continued technical support for the SURF-HIPPO simulator.
The main plan and results of this study have been presented previously in June 2004 and October 2005, for our European Union consortium [http://www.kcnq.com/ (groups of D. A. Brown, T. Jentsch, J. Mikkelsen, C. Petit, M. Tagliatela, A. Villarroel, and I. C. Wood)] and in abstract form (Society for Neuroscience 36th Annual Meeting, Atlanta, Georgia, program number 234.21; Federation of European Neuroscience Societies Fifth Annual Forum, Vienna, Austria, program number A189.8).
References
- Borg-Graham L. Interpretations of data and mechanisms for hippocampal pyramidal cell models. In: Jones EG, Ulinski PS, Peter A, editors. Cerebral cortex, Vol 12, Cortical models. New York: Plenum; 1999. [Google Scholar]
- Brankack J, Stewart M, Fox SE. Current source density analysis of the hippocampal theta rhythm: associated sustained potentials and candidate synaptic generators. Brain Res. 1993;615:310–327. doi: 10.1016/0006-8993(93)90043-m. [DOI] [PubMed] [Google Scholar]
- Brown DA, Adams PR. Muscarinic suppression of a novel voltage-sensitive K+ current in a vertebrate neurone. Nature. 1980;283:673–676. doi: 10.1038/283673a0. [DOI] [PubMed] [Google Scholar]
- Buzsaki G. Theta oscillations in the hippocampus. Neuron. 2002;33:325–340. doi: 10.1016/s0896-6273(02)00586-x. [DOI] [PubMed] [Google Scholar]
- Buzsaki G, Czopf J, Kondakor I, Kellenyi L. Laminar distribution of hippocampal rhythmic slow activity (RSA) in the behaving rat: current-source density analysis, effects of urethane and atropine. Brain Res. 1986;365:125–137. doi: 10.1016/0006-8993(86)90729-8. [DOI] [PubMed] [Google Scholar]
- Chen X, Johnston D. Properties of single voltage-dependent K+ channels in dendrites of CA1 pyramidal neurones of rat hippocampus. J Physiol (Lond) 2004;559:187–203. doi: 10.1113/jphysiol.2004.068114. [DOI] [PMC free article] [PubMed] [Google Scholar]
- Chung HJ, Jan YN, Jan LY. Polarized axonal surface expression of neuronal KCNQ channels is mediated by multiple signals in the KCNQ2 and KCNQ3 C-terminal domains. Proc Natl Acad Sci USA. 2006;103:8870–8875. doi: 10.1073/pnas.0603376103. [DOI] [PMC free article] [PubMed] [Google Scholar]
- Cobb SR, Buhl EH, Halasy K, Paulsen O, Somogyi P. Synchronization of neuronal activity in hippocampus by individual GABAergic interneurons. Nature. 1995;378:75–78. doi: 10.1038/378075a0. [DOI] [PubMed] [Google Scholar]
- Colbert CM, Johnston D. Axonal action-potential initiation and Na+ channel densities in the soma and axon initial segment of subicular pyramidal neurons. J Neurosci. 1996;16:6676–6686. doi: 10.1523/JNEUROSCI.16-21-06676.1996. [DOI] [PMC free article] [PubMed] [Google Scholar]
- Cooper EC, Aldape KD, Abosch A, Barbaro NM, Berger MS, Peacock WS, Jan YN, Jan LY. Colocalization and coassembly of two human brain M-type potassium channel subunits that are mutated in epilepsy. Proc Natl Acad Sci USA. 2000;97:4914–4919. doi: 10.1073/pnas.090092797. [DOI] [PMC free article] [PubMed] [Google Scholar]
- Cooper EC, Harrington E, Jan YN, Jan LY. M channel KCNQ2 subunits are localized to key sites for control of neuronal network oscillations and synchronization in mouse brain. J Neurosci. 2001;21:9529–9540. doi: 10.1523/JNEUROSCI.21-24-09529.2001. [DOI] [PMC free article] [PubMed] [Google Scholar]
- Devaux JJ, Kleopa KA, Cooper EC, Scherer SS. KCNQ2 is a nodal K+ channel. J Neurosci. 2004;24:1236–1244. doi: 10.1523/JNEUROSCI.4512-03.2004. [DOI] [PMC free article] [PubMed] [Google Scholar]
- Fricker D, Verheugen JA, Miles R. Cell-attached measurements of the firing threshold of rat hippocampal neurones. J Physiol (Lond) 1999;517:791–804. doi: 10.1111/j.1469-7793.1999.0791s.x. [DOI] [PMC free article] [PubMed] [Google Scholar]
- Golding NL, Jung HY, Mickus T, Spruston N. Dendritic calcium spike initiation and repolarization are controlled by distinct potassium channel subtypes in CA1 pyramidal neurons. J Neurosci. 1999;19:8789–8798. doi: 10.1523/JNEUROSCI.19-20-08789.1999. [DOI] [PMC free article] [PubMed] [Google Scholar]
- Gu N, Vervaeke K, Hu H, Storm JF. Kv7/KCNQ/M and HCN/h, but not KCa2/SK channels, contribute to the somatic medium after-hyperpolarization and excitability control in CA1 hippocampal pyramidal cells. J Physiol (Lond) 2005;566:689–715. doi: 10.1113/jphysiol.2005.086835. [DOI] [PMC free article] [PubMed] [Google Scholar]
- Halliwell JV, Adams PR. Voltage-clamp analysis of muscarinic excitation in hippocampal neurons. Brain Res. 1982;250:71–92. doi: 10.1016/0006-8993(82)90954-4. [DOI] [PubMed] [Google Scholar]
- Hausser M, Major G, Stuart GJ. Differential shunting of EPSPs by action potentials. Science. 2001;291:138–141. doi: 10.1126/science.291.5501.138. [DOI] [PubMed] [Google Scholar]
- Hoffman DA, Magee JC, Colbert CM, Johnston D. + channel regulation of signal propagation in dendrites of hippocampal pyramidal neurons. Nature. 1997;387:869–875. doi: 10.1038/43119. [DOI] [PubMed] [Google Scholar]
- Hu H, Vervaeke K, Storm JF. Two forms of electrical resonance at theta frequencies, generated by M-current, h-current and persistent Na+ current in rat hippocampal pyramidal cells. J Physiol (Lond) 2002;545:783–805. doi: 10.1113/jphysiol.2002.029249. [DOI] [PMC free article] [PubMed] [Google Scholar]
- Jarsky T, Roxin A, Kath WL, Spruston N. Conditional dendritic spike propagation following distal synaptic activation of hippocampal CA1 pyramidal neurons. Nat Neurosci. 2005;8:1667–1676. doi: 10.1038/nn1599. [DOI] [PubMed] [Google Scholar]
- Jentsch TJ. Neuronal KCNQ potassium channels: physiology and role in disease. Nat Rev Neurosci. 2000;1:21–30. doi: 10.1038/35036198. [DOI] [PubMed] [Google Scholar]
- Lawrence JJ, Saraga F, Churchill JF, Statland JM, Travis KE, Skinner FK, McBain CJ. Somatodendritic Kv7/KCNQ/M channels control interspike interval in hippocampal interneurons. J Neurosci. 2006;26:12325–12338. doi: 10.1523/JNEUROSCI.3521-06.2006. [DOI] [PMC free article] [PubMed] [Google Scholar]
- Leung LS, Yu HW. Theta-frequency resonance in hippocampal CA1 neurons in vitro demonstrated by sinusoidal current injection. J Neurophysiol. 1998;79:1592–1596. doi: 10.1152/jn.1998.79.3.1592. [DOI] [PubMed] [Google Scholar]
- Madison DV, Nicoll RA. Cyclic adenosine 3′,5′-monophosphate mediates beta-receptor actions of noradrenaline in rat hippocampal pyramidal cells. J Physiol (Lond) 1986;372:245–259. doi: 10.1113/jphysiol.1986.sp016007. [DOI] [PMC free article] [PubMed] [Google Scholar]
- Magee JC. Dendritic hyperpolarization-activated currents modify the integrative properties of hippocampal CA1 pyramidal neurons. J Neurosci. 1998;18:7613–7624. doi: 10.1523/JNEUROSCI.18-19-07613.1998. [DOI] [PMC free article] [PubMed] [Google Scholar]
- Magee JC, Carruth M. Dendritic voltage-gated ion channels regulate the action potential firing mode of hippocampal CA1 pyramidal neurons. J Neurophysiol. 1999;82:1895–1901. doi: 10.1152/jn.1999.82.4.1895. [DOI] [PubMed] [Google Scholar]
- Mainen ZF, Joerges J, Huguenard JR, Sejnowski TJ. A model of spike initiation in neocortical pyramidal neurons. Neuron. 1995;15:1427–1439. doi: 10.1016/0896-6273(95)90020-9. [DOI] [PubMed] [Google Scholar]
- Mitzdorf U. Current source-density method and application in cat cerebral cortex: investigation of evoked potentials and EEG phenomena. Physiol Rev. 1985;65:37–100. doi: 10.1152/physrev.1985.65.1.37. [DOI] [PubMed] [Google Scholar]
- Otto JF, Kimball MM, Wilcox KS. Effects of the anticonvulsant retigabine on cultured cortical neurons: changes in electroresponsive properties and synaptic transmission. Mol Pharmacol. 2002;61:921–927. doi: 10.1124/mol.61.4.921. [DOI] [PubMed] [Google Scholar]
- Pan Z, Kao T, Horvath Z, Lemos J, Sul JY, Cranstoun SD, Bennett V, Scherer SS, Cooper EC. A common ankyrin-G-based mechanism retains KCNQ and NaV channels at electrically active domains of the axon. J Neurosci. 2006;26:2599–2613. doi: 10.1523/JNEUROSCI.4314-05.2006. [DOI] [PMC free article] [PubMed] [Google Scholar]
- Peters HC, Hu H, Pongs O, Storm JF, Isbrandt D. Conditional transgenic suppression of M channels in mouse brain reveals functions in neuronal excitability, resonance and behavior. Nat Neurosci. 2005;8:51–60. doi: 10.1038/nn1375. [DOI] [PubMed] [Google Scholar]
- Pike FG, Goddard RS, Suckling JM, Ganter P, Kasthuri N, Paulsen O. Distinct frequency preferences of different types of rat hippocampal neurones in response to oscillatory input currents. J Physiol (Lond) 2000;529:205–213. doi: 10.1111/j.1469-7793.2000.00205.x. [DOI] [PMC free article] [PubMed] [Google Scholar]
- Roche JP, Westenbroek R, Sorom AJ, Hille B, Mackie K, Shapiro MS. Antibodies and a cysteine-modifying reagent show correspondence of M current in neurons to KCNQ2 and KCNQ3 K+ channels. Br J Pharmacol. 2002;137:1173–1186. doi: 10.1038/sj.bjp.0704989. [DOI] [PMC free article] [PubMed] [Google Scholar]
- Rundfeldt C, Netzer R. Investigations into the mechanism of action of the new anticonvulsant retigabine. Interaction with GABAergic and glutamatergic neurotransmission and with voltage gated ion channels. Arzneimittelforschung. 2000;50:1063–1070. doi: 10.1055/s-0031-1300346. [DOI] [PubMed] [Google Scholar]
- Schroeder BC, Kubisch C, Stein V, Jentsch TJ. Moderate loss of function of cyclic-AMP-modulated KCNQ2/KCNQ3 K+ channels causes epilepsy. Nature. 1998;396:687–690. doi: 10.1038/25367. [DOI] [PubMed] [Google Scholar]
- Selyanko AA, Hadley JK, Brown DA. Properties of single M-type KCNQ2/KCNQ3 potassium channels expressed in mammalian cells. J Physiol (Lond) 2001;534:15–24. doi: 10.1111/j.1469-7793.2001.00015.x. [DOI] [PMC free article] [PubMed] [Google Scholar]
- Shah MM, Mistry M, Marsh SJ, Brown DA, Delmas P. Molecular correlates of the M-current in cultured rat hippocampal neurons. J Physiol (Lond) 2002;544:29–37. doi: 10.1113/jphysiol.2002.028571. [DOI] [PMC free article] [PubMed] [Google Scholar]
- Storm JF. An after-hyperpolarization of medium duration in rat hippocampal pyramidal cells. J Physiol (Lond) 1989;409:171–190. doi: 10.1113/jphysiol.1989.sp017491. [DOI] [PMC free article] [PubMed] [Google Scholar]
- Storm JF. Potassium currents in hippocampal pyramidal cells. Prog Brain Res. 1990;83:161–187. doi: 10.1016/s0079-6123(08)61248-0. [DOI] [PubMed] [Google Scholar]
- Strichartz GR. The inhibition of sodium currents in myelinated nerve by quaternary derivatives of lidocaine. J Gen Physiol. 1973;62:37–57. doi: 10.1085/jgp.62.1.37. [DOI] [PMC free article] [PubMed] [Google Scholar]
- Stuart G, Spruston N, Sakmann B, Hausser M. Action potential initiation and backpropagation in neurons of the mammalian CNS. Trends Neurosci. 1997;20:125–131. doi: 10.1016/s0166-2236(96)10075-8. [DOI] [PubMed] [Google Scholar]
- Stuart GJ, Sakmann B. Active propagation of somatic action potentials into neocortical pyramidal cell dendrites. Nature. 1994;367:69–72. doi: 10.1038/367069a0. [DOI] [PubMed] [Google Scholar]
- Tatulian L, Delmas P, Abogadie FC, Brown DA. Activation of expressed KCNQ potassium currents and native neuronal M-type potassium currents by the anti-convulsant drug retigabine. J Neurosci. 2001;21:5535–5545. doi: 10.1523/JNEUROSCI.21-15-05535.2001. [DOI] [PMC free article] [PubMed] [Google Scholar]
- Vervaeke K, Gu N, Agdestein C, Hu H, Storm JF. Kv7/KCNQ/M channels in glutamatergic hippocampal axons and their role in regulation of excitability and transmitter release. J Physiol (Lond) 2006a;576:235–256. doi: 10.1113/jphysiol.2006.111336. [DOI] [PMC free article] [PubMed] [Google Scholar]
- Vervaeke K, Hu H, Graham LJ, Storm JF. Contrasting effects of the persistent Na+ current on neuronal excitability and spike timing. Neuron. 2006b;49:257–270. doi: 10.1016/j.neuron.2005.12.022. [DOI] [PubMed] [Google Scholar]
- Wang HS, Pan Z, Shi W, Brown BS, Wymore RS, Cohen IS, Dixon JE, McKinnon D. KCNQ2 and KCNQ3 potassium channel subunits: molecular correlates of the M-channel. Science. 1998;282:1890–1893. doi: 10.1126/science.282.5395.1890. [DOI] [PubMed] [Google Scholar]
- Wickenden AD, Yu W, Zou A, Jegla T, Wagoner PK. Retigabine, a novel anti-convulsant, enhances activation of KCNQ2/Q3 potassium channels. Mol Pharmacol. 2000;58:591–600. doi: 10.1124/mol.58.3.591. [DOI] [PubMed] [Google Scholar]
- Yue C, Yaari Y. KCNQ/M channels control spike after depolarization and burst generation in hippocampal neurons. J Neurosci. 2004;24:4614–4624. doi: 10.1523/JNEUROSCI.0765-04.2004. [DOI] [PMC free article] [PubMed] [Google Scholar]
- Yue C, Yaari Y. Axo-somatic and apical dendritic Kv7/M channels differentially regulate the intrinsic excitability of adult rat CA1 pyramidal cells. J Neurophysiol. 2006;95:3480–3495. doi: 10.1152/jn.01333.2005. [DOI] [PubMed] [Google Scholar]