

Abstract
Experimental autoimmune encephalomyelitis (EAE) is an animal model of the human demyelinating disorder multiple sclerosis (MS). The immune cytokine interferon-gamma (IFN-γ) is believed to participate in disease pathogenesis in both EAE and MS. In the present study, we examined the significance of IFN-γ-oligodendrocyte interactions in the course of EAE. For the purpose of our study, we used the previously described [proteolipid protein/suppressor of cytokine signaling 1 (PLP/SOCS1)] transgenic mouse line that displays suppressed oligodendrocyte responsiveness to IFN-γ. PLP/SOCS1 mice developed EAE with an accelerated onset associated with enhanced early inflammation and markedly increased oligodendrocyte apoptosis. Moreover, we found that IFN-γ pretreatment of mature oligodendrocytes in vitro had a protective effect against oxidative stress and the inhibition of proteasome activity and resulted in upregulation in expression of a number of chemokines, including CXCL10 (IP10), CCL2 (MCP-1), CCL3 (MCP-1α), and CCL5 (RANTES). These results suggest that IFN-γ-oligodendrocyte interactions are of significance to the clinical and pathological aspects of EAE. In addition, the present study suggests that oligodendrocytes are not simply targets of inflammatory injury but active participants of the neuroimmune network operating during the course of EAE.
Keywords: demyelination, oligodendrocytes, inflammation, cytokine, multiple sclerosis, transgenic
Introduction
Experimental autoimmune encephalomyelitis (EAE) is an animal model of the human demyelinating disorder multiple sclerosis (MS) (Lassmann and Werkele, 1998). The inflammatory reaction in the CNS is driven by self-reactive CD4 (+) cells and is associated with complex interactions between inflammatory and local cellular elements, ultimately leading to demyelination and oligodendrocyte apoptosis (Ercolini and Miller, 2006).
Interferon-gamma (IFN-γ) is an inflammatory cytokine that is critically involved in the pathogenesis of EAE. IFN-γ is exclusively produced by activated self-reactive CD4+ and natural killer cells, and its levels have been positively correlated with disease activity (Renno et al., 1998; Tanuma et al., 1999; Wensky et al., 2005). Peripheral administration of IFN-γ to animals with EAE, however, ameliorated the disease, whereas antibodies against IFN-γ worsened disease severity, suggesting that there is a protective role of the cytokine as well (Voorthuis et al., 1990; Hermans et al., 1996; Furlan et al., 2001). EAE experiments with mice that lack IFN-γ or its receptor further revealed that IFN-γ exerts disease-ameliorating effects (Ferber et al., 1996; Krakowski and Owens, 1996; Willenborg et al., 1999; Glabinski et al., 1999).
A number of studies have demonstrated that IFN-γ affects oligodendrocyte function and survival. In the presence of IFN-γ, oligodendrocytes upregulate the expression of a number of surface receptors that facilitate cell-mediated cytotoxicity (Agresti et al., 1998; Pouly et al., 2000). Overexpression of IFN-γ in the CNS results in oligodendrocyte apoptosis and inhibition of myelin formation both during development and after a demyelinating insult (Corbin et al., 1996; Horwitz et al., 1997; Lin et al., 2005, 2006; Balabanov et al., 2006). Paradoxically, low levels of IFN-γ expression, insufficient to cause detectable developmental defects, provide protection to mature oligodendrocytes against toxic (cuprizone) injury and demyelination (Gao et al., 2000). Potential protective effects of IFN-γ on oligodendrocytes are also suggested in models of viral demyelination (Rodriguez et al., 1995; Murray et al., 2002; Gonzalez et al., 2006).
The significance of IFN-γ-oligodendrocyte interactions during the course of EAE is unknown. The goal of the present study was to directly examine these interactions using a transgenic model of suppressed oligodendrocyte responsiveness to IFN-γ. We used for our experiments a previously described transgenic mouse line [proteolipid protein/suppressor of cytokine signaling 1 (PLP/SOCS1)] that expresses the suppressor of cytokine signaling 1 (SOCS1) molecule under the transcriptional control of the proteolipid protein (PLP) promoter (Balabanov et al., 2006). SOCS1 is a competitive inhibitor of IFN-γ receptor-induced Jak/Stat1 signaling and regulates the cellular responsiveness to IFN-γ (Starr et al., 1997). Endogenous levels of SOCS1 in oligodendrocytes under normal and inflammatory conditions are extremely low (Polizzotto et al., 2000; Maier et al., 2002). The regulatory effect of SOCS1 in oligodendrocytes appears to be of differential significance to IFN-γ signaling, because its upregulation has little effect on Stat1 activation by leukemia inhibitory factor (Emery et al., 2006).
In the present study, we report that the suppression of oligodendrocyte responsiveness to IFN-γ resulted in accelerated EAE onset, enhanced inflammation, and oligodendrocyte apoptosis. Our results suggest that IFN-γ-oligodendrocyte interactions are important in the regulation of EAE.
Materials and Methods
PLP/SOCS1 transgenic mice.
The PLP/SOCS1 mouse line was generated in our laboratory, and its functional characteristics were previously described in detail (Balabanov et al., 2006). Briefly, suppressor of SOCS1 was transgenically expressed in oligodendrocytes under the transcriptional control region of the PLP gene. PLP/SOCS1 mice were hemizygotes for the transgene and displayed no phenotypic or morphological abnormalities. For the purpose of the EAE experiments, the PLP/SOCS1 mice, originally generated on a mixed background (C57BL/6J × DBA/2J), were backcrossed to C57BL/6J mice for six generations. Offspring positive for the transgene were identified by PCR using tail DNA and transgene-specific primers.
Induction of EAE.
Six- to 8-week-old female, wild-type, and PLP/SOCS1 mice were selected for the EAE experiments. Wild-type and PLP/SOCS1 mice that belonged to identical F6 generation litters were randomly separated into immunized and control subgroups. Each immunized mouse received 200 μg of MOG35–55 (MEVGWYRSPFSRVVHLY RNGK) (Genemed Synthesis, San Francisco, CA) emulsified in complete Freund's adjuvant (CFA) containing 600 μg of Microbacterium tuberculosum H37Ra (Difco, Detroit, MI) intradermally at several flank areas. Control mice were injected with the same amount of emulsion containing CFA only. All mice received 100 ng of Pertussis toxin (List Biological Laboratories, Campbell, CA) intraperitoneally, 24 h postimmunization (PI). The severity of clinical signs was quantitated using a five-point scoring scale: 0, normal; 1, flaccid tail; 2, ataxia; 3, paraparesis/paraplegia; 4, quadriparesis/quadriplegia; 5, death (McMahon et al., 2005). The clinical data were presented as mean ± SD of the daily clinical score of a given treatment group. All animal procedures were conducted in compliance with the National Institutes of Health Guide for Care and Use of Laboratory Animals and were approved by the Institutional Animal Care and Use Committee at The University of Chicago.
Histochemistry.
Mice selected for histological analysis were anesthetized with 0.01 ml/g 2.5% Avertin (Sigma-Aldrich, St. Louis, MO) administered intraperitoneally and perfused with saline followed by 2% paraformaldehyde for 10 min. The brains and spinal cords were harvested and processed as paraffin blocks using Leica EC1160 (Leica, Wetzlar, Germany). The tissue samples were sectioned longitudinally at 7 μm thickness and were stained with Hematoxylin and Eosin (H&E) or Luxol Fast Blue and Neutral Red (LFB&NR) using standard protocols.
The tissue samples were examined using digital Axoplan microscope (Zeiss, Thornwood, NY), and the degree of inflammation was assessed by counting the inflammatory foci throughout the spinal cord. Inflammatory focus was defined as presence of >20 mononuclear cells in the perivascular space of a given blood vessel (Swanborg, 1988). The total area of measurement was obtained by using the morphometric option of the Axiovision software, and the results were presented as mean ± SD inflammatory foci per area (mm2) with n = 3 animals per study group.
Immunohistochemistry.
Indirect immunostaining of mouse CNS was performed as described previously (Balabanov et al., 2006). After paraformaldehyde perfusion, the spinal cords were harvested, postfixed for 1 h with 2% paraformaldehyde, cryopreserved with 30% sucrose for 48 h, prepared as frozen blocks (OCT compound; Sacura, Torrance, CA), and sectioned at a thickness of 7 μm at −20°C (Leica CM1800 cryostat). Before immunostaining, the sections were treated with 0.1% Triton X-100 (Sigma-Aldrich) for 10 min and incubated with 10% bovine serum albumin (Sigma-Aldrich) or goat serum (Invitrogen, Carlsbad, CA) for 30 min. Indirect immunostaining was performed by sequential incubation with primary antibodies (for 2 h at room temperature or overnight at 4°C) and FITC-conjugated or cyanine 3 (Cy3)-conjugated secondary antibodies for 30 min. All of the following primary and secondary antibodies used in the study were commercially available: mouse anti-adenomatous polyposis coli protein (CC1) antibody (dilution, 1:20; Oncogene Research Products, San Diego, CA), anti-mouse CD3 antibody (dilution, 1:100; BD PharMingen, San Diego, CA), anti-mouse F4/80 antibody (dilution, 1:100; eBioscience, San Diego, CA), anti-major histocompatibility complex (MHC) class I molecule and myelin basic protein (MBP) antibodies (dilution, 1:100; Chemicon, Temecula, CA), anti-mouse or anti-rabbit FITC-conjugated secondary antibody (dilution, 1:100; Jackson ImmunoResearch, West Grove, PA), and anti-mouse or anti-rabbit Cy3-congugated antibody (dilution, 1:500; Jackson ImmunoResearch). Terminal deoxynucleotidyl transferase-mediated dUTP-biotin nick end labeling (TUNEL) staining for apoptotic cells was performed using the Apoptag kit (Serological, Norcross, GA) according to the protocol provided. The immunostained sections were mounted using Vectorshield mounting medium containing 4′, 6′-diamidino-2-phenyldole (DAPI) nuclear stain (Vector Laboratories, Burlingame, CA) and examined using a fluorescent microscope (Axoplan; Zeiss).
The number of cells of interest in the spinal cords was assessed by manual cell counting of positive cells, and the total area of measurement was digitally calculated using the morphometric option of the fluorescent microscope. The results were presented as mean ± SD of (+) cells/mm2 with n = 3 animals per study group.
PCR and quantitative PCR.
All experimental animals were genotyped using isolated tail DNA (Bio-Tek 2000 automatic system; Beckman-Coulter, Fullerton, CA) (Balabanov et al., 2006). PCR (Qiagen PCR kit; Qiagen, Valencia, CA) for transgene detection was performed using the following transgene-specific screening primers: Flag-SOCS1 sense primer 5′-CCAGGACGACGATGACAAGA-3′ and Flag-SOCS1 antisense primer 5′-TCAGGGGTCCCCA ATAGAAG-3′.
Total RNA was isolated from the spinal cords of experimental animals with TRIzol reagent (Invitrogen). Quantitative PCR (Q-PCR; or real-time PCR) was performed by first reverse transcribing 1 μg of DNAaseI-treated total RNA using oligo(dT)12–18 and SuperScript II reverse transcriptase (Invitrogen reverse transcription PCR kit). Q-PCR was performed using 20 ng of the cDNA in a reaction containing iQSupermix, and the following primers and probes for IFN-γ, IP10, and glyceraldehyde-3-phosphate dehydrogenase (GAPDH): IFN-γ sense primer 5′-GATATCTCGAGGAACTGGCAAAA-3′, IFN-γ antisense primer 5′-CTACAAAGAGTCTGAGGTAGAAAGAGATAAT-3′, and IFN-γ probe 5′-FAM-TGGTGACATGAAAATCCTGCAGAGCCA-BHQ1–3′; IP10 sense primer 5′-CTGAGTGGGACTCAAGGGAT-3′, IP10 antisense primer 5′-CAGCGTCTGTTCATGGAAGT-3′, and IP10 probe 5-FAM-TCTCGCAAGAACGGTGCGCT-BHQ1–3′; GAPDH sense primer 5′-CTCAACTACATGGTCTACATGTTCCA-3′; GAPDH antisense primer 5′-CCATTCTCGGCCTTGACTGT-3′; and GAPDH probe 5′-5TxRd-XN/TGACTCCACTCACGGCAAATTCAACG-3BHQ-2–3′ (Integrated DNA Technologies, Coralville, IA). The reactions were performed using a Bio-Rad (Hercules, CA) I-cycler Real-Time PCR unit, under the following conditions: one cycle at 95°C for 3 min, 40 cycles at 95°C for 30 s and 60°C for 30 s (Bio-Rad). IFN-γ and IP10 expression levels were normalized to the expression levels of GAPDH based on threshold cycles (IFN-γ/GAPDH and IP10/GAPDH ratios) (Balabanov et al., 2006).
In vitro proliferation assay.
The in vitro proliferation assay was performed using spleens and draining lymph nodes from antigen-primed and CFA-injected wild-type and transgenic mice at day 8 PI. The cells were isolated by compressing the tissue against a metallic mesh, filtering through a 30 μm filter, and plating in 96-well plates at a density of 5 × 10⁵ cells/well in a total volume of 200 μl of HL-1 medium (BioWhittaker, Walkersville, MD) and 1% ampicillin/streptomycin (Invitrogen) (McMahon et al., 2005). MOG35–55, or ovum albumin (OVA)323–339 were added at various concentrations in triplicates for 48–72 h. The cultures were then pulsed with 1 μCi/well [3H] TdR (PerkinElmer, Wellesley, MA) for the last 20 h of the incubation. The [3H] TdR uptake was detected and measured as counts per minute (cpm) using Topcount microplate scintillation counter (Global Medical Instrumentation, Ramsey, MN), and the results were presented as mean ± SD cpm with n = 3 animals per study group (McMahon et al., 2005).
LiquiChip assay.
Levels of chemokine and cytokine production were assessed using LiquiChip assay (Carpenter et al., 2005). Conditioned media of lymphocyte and oligodendrocyte cultures were collected, and levels of IFN-γ, interleukin-1β (IL-1β), IL-2, IL-4, IL-5, IL-6, tumor necrosis factor-α (TNF-α), CCL2 (MCP-1), CCL3 (MIP-1α), CCL5 (RANTES), and CXCL10 (IP10) were measured using LiquiChip mouse cytokine assay kit 7-plex (Qiagen). Approximately 50 μl of conditioned media was used for analysis per cytokine/chemokine following the kit instructions. The cytokine/chemokine levels were assessed as picograms per milliliter using LiquiChip reader (Quagen) and presented as mean ± SD pg/ml with n = 3 independent measurements.
Enzyme-linked immunosorbent spot assay.
Enzyme-linked immunosorbent spot (ELISPOT) assay was performed using the same lymph node preparations described above at day 8 PI (McMahon et al., 2005). The cells were cultured in the presence or absence of antigens (MOG35–55 or OVA323–339) for 36 h in 96-well plates precoated with 100 μl of anti-IFN-γ antibody (BD PharMingen). After the incubation, the plates were washed three times and incubated with biotinylated anti-IFN-γ antibody (2 μg/well, diluted in 100 μl of PBS/0.05% Tween 20/1% BSA) overnight at 4°C in a humidified chamber. After incubating, the plates were washed and 100 μl of anti-biotin alkaline phosphatase antibody, diluted 1:1000 in the same solution, was added for 2 h at room temperature. Finally, the plates were washed and developed using nitroblue tetrazolium-5-bromo-4-chloro-3-idonyl phosphate substrate solution for 30 min (Pierce, Rockford, IL). The developing reaction was quenched using distilled water, and the IFN-γ spots/well were counted using ImmunoSpot series analyzer (Resolution Technology, Bridgewater, NJ). The data were presented as mean ± SD spots/well with n = 3 animals per group.
ELISA assay for anti-MOG35–55 antibodies.
Anti-MOG35–55 antibody titers were examined in the sera of the same animal groups as described above at day 8 PI. Blood from these animals was obtained by heart puncture. Sera were collected and applied to MOG35–55-coated maxisorb 96-well ELISA plates (Nalge Nunc International, Rochester, NY) in serial dilutions. The plates were incubated for 1 h at room temperature, washed three times, and 100 μl of 1:5000 diluted horseradish peroxidase-conjugated goat anti-IgG and IgM antibodies (BD PharMingen) were applied to the wells. The plates were incubated for 1 h at room temperature and washed three times, and 100 μl of 3,3,5,5-tetra-methyl-benzidine substrate was applied to the wells. The reaction was performed at room temperature for 30 min in the dark and then stopped using ELISA stop solution. The level of reaction product was assessed as optic density (OD) at 490 nm on a standard plate reader, and the data were presented as mean ± SD. OD with n = 3 independent measurements per group.
Rat oligodendrocyte cultures.
Oligodendrocyte cultures were prepared using a method described previously (McCarthy and de Vellis, 1980; Goswami et al., 2005). Brain tissue was harvested from 2- to 3-d-old newborn rats (Harlan, Indianapolis, IN) and digested using 0.25% trypsin and 10 μg/ml DNAaseI in DMEM (Invitrogen) for 20 min at 37°C. The cells were cultured on poly-d-lysine-coated 75 mm2 flasks (Sigma-Aldrich) and maintained with 10% fetal bovine serum (FBS) in DMEM at 37°C with 5% CO2 for 12 d. The oligodendrocyte progenitor cells (OPCs) were enriched by shaking the culture flasks at 240 rpm for 16 h at 37°C with 5% CO2, sieving through 30 μm nylon filter (Tetko, Depew, NY), and by differential nonadherence to uncoated plates. The OPCs were plated on poly-d-lysine-coated plates and proliferated in media containing 10% FBS in DMEM, 10 ng/ml platelet-derived growth factor and 10 ng/ml fibroblast growth factor (Calbiochem, La Jolla, CA). The cells were harvested and plated in poly-d-lysine-coated plates at desired cell number and differentiated using a defined culture media containing 5 μl/ml insulin, 50 μg/ml transferrin, 30 nm selenium, 10 nm biotin, 10 nm progesterone, 15 nm T3, 0.1% bovine serum albumin (Sigma-Aldrich), and 1% ampicillin/streptomycin in DMEM (Bottesthein, 1986). Oligodendrocytes were allowed to differentiate for 5 d, and then the cells were tested for purity and treated according to the purpose of the experiment. According to this protocol, we achieved highly purified oligodendrocyte cultures containing >95% myelin basic protein-positive cells.
Cell viability assay.
Cell viability during the experiments was assessed using MMT [3-(4,5-dimethylthiazol-2-yl)-2,5-diphenyltetrazolium bromide] assay (Goswami et al., 2005). Oligodendrocytes were plated in 24-well plates at density 5 × 10⁵ cells/well in 1 ml volume of defined culture medium. The cells were pretreated with IFN-γ (0–100 U/ml; Calbiochem) for 48 h and then exposed to hydrogen peroxide (H2O2) (50–100 μm/ml) (Invitrogen), staurosporine (100 μm), ceramide (10 μm), lactacystin (0.1–10 μm) (Sigma-Aldrich) for 24 h, and anti-fas antibody (Jo2; BD PharMingen) (0.1 μg/ml) for 30 min followed by anti-IgG antibody (1:1000 dilution) for 1 h. After these treatments, the volume of oligodendrocyte culture media was reduced to 500 ml/well and MTT (Sigma-Aldrich) was added from a stock of 5 mg/ml to one-tenth of the total cell culture volume. The cultures were incubated for 30 min at 37°C and 5% CO2 and then treated with equal volume 10% SDS in 0.1N HCl for 4 h under the same conditions. The purple color of the MTT formazan, which is directly proportional to the cell viability, was quantitated at 570 nm using standard plate reader (Biotech ELX 800; Biotech Instruments, Winooski, VT). Cell viability was assessed as percentage viability calculated from the control untreated wells considered as 100%, and data were presented as mean ± SD with n = 3 independent measurements per group.
Proteasome-20 assay.
Assay was performed as described in the manufacturer's protocol (Calbiochem), in 50 mm HEPES buffer, pH 7.6, containing 5 mm EGTA, 50 μm Suc-LLVY-AMC (substrate), and cell extract (20 μg of protein) in a total volume of 100 μl. Reaction was started by addition of the substrate, and fluorescent intensity (excitation, 360 nm; emission, 460 nm) was measured in a fluorescence microplate reader (ELX 800; Bio-Tek, Burlingame, CA). Plates were read at 30 min intervals for 3 h. All assays were done in three separate experiments in duplicate. Results are presented as relative fluorescence units (rfu) per microgram of protein.
Statistical analysis.
All data were generated from three independent experiments. Means, SDs, and p values were calculated using Average, Stdev, and ANOVA in Microsoft Excel (Microsoft, Redmond, WA). A statistically significant difference was defined as p < 0.05.
Results
PLP/SOCS1 mice developed EAE with an accelerated disease onset
The PLP/SOCS1 mice exhibit no phenotypic abnormalities, live a normal life span, breed well, and produce transgenic progeny in a mendelian manner but exhibit diminished oligodendrocyte-specific responsiveness to IFN-γ (Balabanov et al., 2006). Enforced expression of SOCS1 in oligodendrocytes under the transcriptional control of PLP appears to be stable up to 12 months of age and maintained across different generations and age groups. No significant transgenic SOCS1 expression was detected in the primary and secondary lymph organs (Balabanov et al., 2006).
A total of 40 mice, wild-type and transgenic, from identical litters were selected for the EAE experiments, and five separate experiments were performed. The experimental animals were divided into four groups: (1) 15 wild-type and (2) 15 PLP/SOCS1 mice received full immunization (MOG35–55 emulsified in CFA), and (3) five wild-type and (4) five PLP/SOCS1 mice were injected with CFA only (see Material and Methods). Clinical disease was consistently and reproducibly achieved in all immunized animals with significant clinical severity during the acute phase (average clinical score, >3.0). After the acute phase, the immunized animals retained fluctuating low-grade deficits (clinical score range, 1.0–2.0) for ∼2 months, consistent with the chronic-persistent phase of the disease. Animals that received CFA only developed no clinical signs and remained disease free through the course of the experiments.
Strikingly, the PLP/SOCS1 mice developed EAE with an accelerated onset (Fig. 1). As expected, the wild-type mice developed initial clinical signs at day 15–16 (15.3 ± 0.5) PI, which peaked in severity by days 18–19 PI. The PLP/SOCS1 mice consistently developed the initial clinical signs significantly earlier, at days 10–11 PI (10.9 ± 0.6; p < 0.05), and acute disease with maximal severity at days 12–13 PI. During these time points, as mentioned above, the wild-type mice were still free of clinical signs. The maximal severity of the acute disease was compatible between the wild-type and PLP/SOCS1 mice with a clinical score of 3.0 ± 0.7 in the wild-type and 3.5 ± 0.5 in the PLP/SOCS1 mice. Severity and duration of the chronic phases of both groups were also compatible: 65 ± 13.5 d PI with an average clinical score of 1.5 ± 0.5 in wild-type mice, and 57 ± 9.1 d PI with an average clinical score of 1.3 ± 0.2 in PLP/SOCS1 mice.
Figure 1.

EAE in wild-type and PLP/SOCS1 mice. Immunized PLP/SOCS1 mice developed clinical disease with an accelerated onset compared with the similarly treated wild-type mice. Mice that received only CFA developed no clinical signs and remained disease free (data not shown).
PLP/SOCS1 and wild-type mice did not differ in their peripheral immune responses
To determine the underlying mechanisms of the accelerated disease onset, as well as to rule out any interference of PLP/SOCS1 transgene expression on the immune system, we examined the peripheral immune responses of fully immunized and CFA-injected wild-type and PLP/SOCS1 mice. Three animals per group were killed at day 8 PI, and lymph nodes, spleens, and sera were obtained. To assess the lymphocyte reactivity of each animal group, lymphocyte proliferation assays were performed using spleen and lymph node lymphocytes with various concentrations of priming and irrelevant antigens (Fig. 2A–F). Strong proliferative responses were detected in the lymphocyte cultures originating from all MOG35–55 immunized animals in the presence of the priming antigen (MOG35–55). These responses, however, did not differ between the lymphocyte cultures of fully immunized wild-type and PLP/SOCS1 mice regardless of the organ of isolation, incubation time, or dose of the priming antigen. No significant proliferation was observed in these lymphocyte cultures in the presence of an irrelevant antigen (OVA323–339). Lymphocyte cultures originating from CFA-injected animals displayed no significant proliferative responses in the presence of either antigen.
Figure 2.

Peripheral immune responses in wild-type and PLP/SOCS1 mice. Lymphocytes and sera from immunized and CFA-injected wild-type and PLP/SOCS1 mice were obtained at day 8 PI, and lymphocyte proliferation assay (A–F), cytokine LiquiChip assay (G–I), and anti-MOG antibody ELISA (J, K) were performed. No significant difference between the immune responses of the wild-type and PLP/SOCS1 mice was found.
Cytokine production by MOG35–55 and OVA323–339-stimulated lymphocytes was assessed using the cytokine (LiquiChip) assay. Lymphocytes from MOG35–55-immunized wild-type and PLP/SOCS1 mice demonstrated high and comparable expression of IFN-γ, IL-2, and IL-6 compared with the unstimulated and OVA323–339-stimulated cells (Fig. 2G–I). Other cytokines, including IL-1β, IL-4, IL-5, IL-10, and TNF-α mice were found to be expressed at very low levels and did not increase after stimulation with either peptide (data not shown).
Sera from all four animal groups were simultaneously obtained, and the titers of anti-MOG35–55 antibodies, IgM and IgG isotypes, were measured using ELISA assay (Fig. 2J,K). Rise in antibody titers was detected in the fully immunized compared with the CFA-injected controls. We found no significant difference in the serum titers of anti-MOG35–55 antibodies between fully immunized wild-type and PLP/SOCS1 mice. Titers of anti-MOG35–55 antibodies in the corresponding CFA-injected controls were also similar.
PLP/SOCS1 mice displayed enhanced early inflammation of the CNS and a lower threshold for developing clinical signs
We compared the CNS pathology of fully immunized and CFA-injected wild-type and PLP/SOCS1 mice at different time points corresponding to their preclinical and acute clinical phases. Brains and spinal cords of three animals from all four study groups were harvested at days 8, 10, 12, 15, and 18 PI, processed as sagittal paraffin sections, and stained with H&E to assess for the presence of inflammatory foci. An inflammatory focus was defined as the presence of >20 mononuclear cells in the perivascular space of a given blood vessel and quantitated per mm2 area of spinal cord, as described previously (Swanborg, 1988).
Examination of the pathological samples of fully immunized wild-type and PLP/SOCS1 mice revealed general similarities in the type and spatial distribution of lesions (Fig. 3). Typical perivascular mononuclear infiltrates involving the meninges and the CNS parenchyma were observed in both wild-type and PLP/SOCS1 mice. The distribution of the lesions followed a gradient pattern with the highest number of lesions in the lumbar-sacral portion of the spinal cords. The lesions involving the brain stem, cerebellum, and corpus callosum appeared to be scattered and less extensive. Pathological samples of wild-type and PLP/SOCS1 mice injected with CFA only demonstrated no inflammatory infiltrates.
Figure 3.

CNS inflammation in wild-type and PLP/SOCS1 mice. A–J, Representative images of H&E-stained spinal cord sections: PLP/SOCS1 (A–E) and wild-type (WT) (F–J) mice at day 8 PI (A, F), day 10 PI (B, G), day 12 PI (C, H), day 15 PI (D, I), and day 18 PI (E, J). Arrows point to areas of perivascular inflammation (foci) (B–E, H–J), and the arrowhead points to parenchymal infiltration (J). Scale bar, 100 μm.
The wild-type and PLP/SOCS1 mice differed significantly in inflammatory dynamics of the CNS (Figs. 3, 4). At day 8 PI, when all animals were disease-free (clinical score 0.0) and the peripheral immune responses were comparable, we found minimal or no inflammatory involvement of the CNS of either wild-type or PLP/SOCS1 mice (Figs. 3, 4). At days 10 and 12 PI, however, the PLP/SOCS1 mice had a significantly higher number of inflammatory foci in the spinal cord compared with wild-type mice: 6 ± 2 versus 2 ± 1/mm2 at day 10 PI (p < 0.05) and 15 ± 4 versus 5 ± 3/mm2 at day 12 PI (p < 0.05). The time points of these differences in pathology corresponded to the accelerated disease onset in the PLP/SOCS1 mice and to the preclinical (symptom-free) phase in the wild-type mice. At later time points, days 15 and 18 PI, the number of inflammatory foci became comparable between the wild-type and the PLP/SOCS1 mice.
Figure 4.

Inflammatory foci in wild-type and PLP/SOCS1 mice. Inflammatory foci (focus is defined as >20 cells/vessel)/mm2 were measured in the H&E-stained spinal cords of PLP/SOCS1 mice. No significant inflammation was found at day 8 PI in any of the samples. Two significant differences were found in the later time points: PLP/SOCS1 mice had a higher number of inflammatory foci at days 10 and 12 PI compared with the wild-type mice (*p < 0.05) but fewer inflammatory foci at disease onset compared the wild-type mice, days 10 and 15 PI, respectively (**p < 0.05).
Direct comparison of the number of inflammatory foci between wild-type and PLP/SOCS1 mice with respect to disease onset suggested that significantly fewer inflammatory foci were sufficient to precipitate clinical signs in the PLP/SOCS1 mice (Figs. 3, 4). At disease onset (clinical score, 1.0; days 10 and 15 PI for PLP/SOCS1 mice and wild-type mice, respectively), we found ∼50% fewer inflammatory foci in the PLP/SOCS1 animals compared with wild-type mice: 6 ± 2 versus 13 ± 3/mm2, respectively (p < 0.05). At disease peak (clinical score, 3.0; days 12 and 18 PI for PLP/SOCS1 mice and wild-type mice, respectively), the PLP/SOCS1 and wild-type mice had a comparable number of inflammatory foci. Nevertheless, the distribution and spread of inflammatory cells within the CNS parenchyma at these time points, however, appeared to be different. The inflammatory cells were localized predominantly in the perivascular space of the PLP/SOCS1 mice, whereas in the wild-type mice they were more widely distributed throughout the parenchyma (Fig. 3E,J).
PLP/SOCS1 and wild-type mice did not differ in composition of inflammatory foci
Detailed examination of the composition of the perivascular inflammatory foci revealed that the foci predominantly comprised mononuclear cells in both wild-type and PLP/SOCS1 mice (Fig. 5). Immunostaining with anti-CD3 and F4/80 antibodies, which recognize common lymphocyte and macrophage markers, respectively, further revealed that the inflammatory foci contain mainly CD3+ cells (lymphocytes) and F4/80+ cells (macrophages) in both wild-type and PLP/SOCS1 mice at each time point examined (Fig. 5A–H). The appearance of these cells in the lesions followed the dynamic differences in inflammation between the wild-type and PLP/SOCS1 mice. At day 8 PI, we found occasional CD3+ cells in both wild-type and PLP/SOCS1 mice. Nevertheless, there were significantly more CD3+ and F4/80+ cells at day 10 and 12 PI in the PLP/SOCS1 mice compared with the wild-type mice (Fig. 5A,B). At day 10 PI, we found 35 ± 10 versus 7 ± 4 CD3+ cells/mm2 (p < 0.05), and 145 ± 92 versus 6 ± 3 F4/80+ cells/mm2 (p < 0.05) in the PLP/SOCS1 versus wild-type mice, respectively. Similarly, at day 12 PI, we found 71 ± 15 versus 35 ± 12 CD3+ cells/mm2 (p < 0.05), and 370 ± 110 versus 94 ± 32 F4/80+ cells/mm2 (p < 0.05). The total number of CD3+ cells and F4/80+ cells were comparable in both groups at days 15 and 18 PI.
Figure 5.
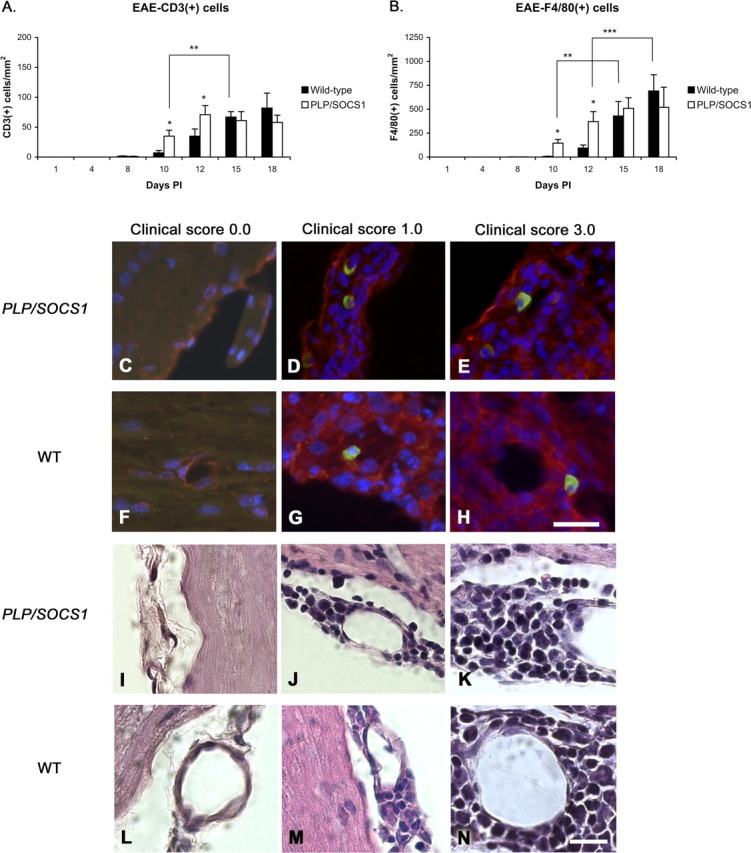
Composition of the inflammatory foci in wild-type and PLP/SOCS1 mice. Cell composition of inflammatory foci was assessed in anti-CD3 and anti-F4/80 immunostained and H&E-stained PLP/SOCS1 and wild-type spinal cords. No qualitative difference in the composition of the inflammatory foci was found. A, B, Three quantitative differences were found: PLP/SOCS1 mice had a higher number of CD3+ and F4/80+ cells at days 10 and 15 PI compared with the corresponding time points in the wild-type mice (*p < 0.05) but fewer CD3+ and F4/80+ cells at disease onset compared with the wild-type mice at days 10 and 15 PI, respectively (**p < 0.05), and fewer F4/80+ cells at disease peak at days 12 and 18 PI, respectively (***p < 0.05). C–N, Representative images of immunostained (C–H) (scale bar, 25 μm) and H&E-stained (I–N) (scale bar, 50 μm) spinal cords of PLP/SOCS1 (first and third row; C–E, I–K) and wild-type (WT) (second and fourth row; F–H, L–N) mice with identical clinical scores of 0.0 (first column; C, F, I, L; CFA controls), 1.0 (second column; D, G, J, M), and 3.0 (third column; E, H, K, N). Note that the inflammatory foci comprise predominantly mononuclear, CD3/FITC-positive (green) and F4/80/Cy3-positive (red) cells.
Furthermore, we directly compared the total number of CD3+ and F4/80+ cells with respect to disease onset (clinical score, 1.0; days 10 and 15 PI for PLP/SOCS1 mice and the wild-type mice, respectively) and found that the PLP/SOCS1 mice had significantly fewer CD3+ cells and F4/80+ cells than the wild-type mice: 35 ± 10 versus 67 ± 9 CD3+ cells/mm2 (p < 0.05) and 245 ± 92 versus 430 ± 150 F4/80+ cells/mm2 (p < 0.05), respectively (Fig. 5A,B). In the acute phase (clinical score, 3.0; days 12 and 18 PI for PLP/SOCS1 and wild-type mice, respectively), the number of CD3+ cells between the wild-type and in the PLP/SOCS1 mice were comparable. Nevertheless, the total number of F4/80+ cells appeared to be significantly lower in the PLP/SOCS1 mice than in the wild-type mice: 370 ± 105 versus 691 ± 150/mm2, respectively. This finding reflected the above-mentioned difference in distribution of inflammatory cells outside the perivascular space.
Examination of the H&E-stained spinal cord samples at high magnification (60× and 100×) revealed that mononuclear cells represented the major cellular constituent of the inflammatory infiltrates (Fig. 5I–N). The contribution of polymorphonuclear cells to the inflammatory infiltrates was minor (<10% of the total cellular infiltrate) in both wild-type and PLP/SOCS1 mice.
PLP/SOCS1 mice developed focal perivascular demyelination and increased oligodendrocyte apoptosis
To determine whether additional factors were involved in or associated with the accelerated disease onset in the PLP/SOCS1 mice, we examined for the presence of demyelination and oligodendrocyte apoptosis. Paraffin sections of spinal cords of all four groups were obtained and stained with LFB&NR. Myelin loss (loss of LFB staining) was observed in areas of inflammation in fully immunized PLP/SOCS1 and wild-type mice at time points of maximum clinical severity (clinical score, 3.0, at days 12 and 18 PI, respectively) (Fig. 6). Patterns and extent of myelin loss in these mice, however, appeared different on microscopic examination. PLP/SOCS1 mice displayed focal myelin loss, predominantly in the perivascular space, and little observable myelin debris (myelin pallor) (Fig. 6A,B). In contrast, wild-type mice displayed myelin loss associated with diffuse infiltration of inflammatory cells between the myelinated tracts, and a presence of myelin debris and phagocytosis, a pattern classically described as myelin striping (Lassmann and Werkele, 1998) (Fig. 6C,D). No changes in myelin were found in the corresponding CFA-injected controls.
Figure 6.

Demyelination in wild-type and PLP/SOCS1 mice. A–D, Demyelination was assessed in LFB&NR-stained spinal cords sections of CFA-injected (A, C) and immunized mice at disease peak (clinical score, 3.0) (B, D). Scale bar, 100 μm. B, PLP/SOCS1 mice displayed focal loss of myelin, predominantly in the perivascular space, and little observable myelin debris (myelin pallor). D, In contrast, wild-type mice (WT) displayed myelin loss associated with diffuse infiltration of inflammatory cells between the myelinated tracts, presence of myelin debris, and phagocytosis. Note that B and D depict sequential sections to those in D and K.
Oligodendrocyte apoptosis was assessed by TUNEL staining and immunostaining with anti-CC1, recognizing an oligodendrocyte marker (Fig. 7). The number of TUNEL+/CC1+ cells/mm2 area of spinal cord was examined and quantitated from the same tissue samples and at the same time points as specified above (Fig. 8). At day 8 PI, when the mice were free of clinical signs and CNS inflammation, no oligodendrocyte apoptosis was observed in the wild-type or the PLP/SOCS1 mice. At days 10, 12, and 15 PI, however, the PLP/SOCS1 mice developed significant oligodendrocyte apoptosis, whereas the wild-type animals did not: 5 ± 2 versus 0.0 mm2 at day 10 PI, 9 ± 4 versus 0.0 mm2 at day 12 PI, and 12 ± 6 versus 1.5 ± 0.5 mm2 at day 15 PI (PLP/SOCS1 vs wild-type mice, respectively; p < 0.05 for all three data points). The wild-type mice did not develop any significant oligodendrocyte apoptosis until day 18, at which time the number of apoptotic oligodendrocytes was comparable between the PLP/SOCS1 and the wild-type mice. No oligodendrocyte apoptosis was found in the corresponding time points for CFA-injected wild-type and PLP/SOCS1 mice.
Figure 7.

Patterns of oligodendrocyte apoptosis in wild-type and PLP/SOCS1 mice. Representative images of oligodendrocyte apoptosis in CNS: PLP/SOCS1 (top row; A–E) and wild-type (WT) spinal cords (bottom row; F–J) with identical clinical scores of 0.0 (first column; A, F, CFA control), 1.0 (second and third columns; B, G corresponding to C, H), and 3.0 (fourth and fifth column; D, I corresponding to E, J) were stained with TUNEL/FITC (green), CC1/Cy3 (red), and DAPI (blue). Stars mark the inflammation and the dotted line represents its edge; arrows point to the apoptotic oligodendrocytes. Scale bar, 100 μm. Note that apoptotic oligodendrocytes in the PLP/SOCS1 mice were localized at some distance from the edge of the inflammatory lesions, whereas in the wild-type mice they were within the lesion.
Figure 8.

Oligodendrocyte apoptosis in wild-type and PLP/SOCS1 mice. Oligodendrocyte apoptosis was assessed in TUNEL-stained and anti-CC1-immunostained spinal cords of PLP/SOCS1 and wild-type mice. Two significant differences were found: PLP/SOCS1 mice developed significantly more apoptotic oligodendrocytes at days 10, 12, and 15 PI compared with the wild-type mice at the corresponding time points (*p < 0.05) and significantly more apoptotic oligodendrocytes at disease onset compared with the wild-type mice at days 10 and 15 PI, respectively (**p < 0.05).
Comparison of the patterns of oligodendrocyte apoptosis between the wild-type and PLP/SOCS1 samples in relationship to the inflammatory foci revealed additional important differences (Fig. 7). Apoptotic oligodendrocytes were observed in all of the PLP/SOCS1 samples early in the inflammatory process and in the presence of significantly fewer inflammatory foci (as early as day 10 PI, 6 ± 2 inflammatory foci/mm2). Apoptotic oligodendrocytes were characteristically present at the edge or at some distance from the lesion without an immediate contact with the inflammatory cells. In contrast, apoptotic oligodendrocytes in the wild-type sample were present mainly in association of extensive inflammation (day 18 PI, 20 ± 5 inflammatory foci/mm2) and were most typically localized within the inflammatory lesion itself.
IFN-γ was present during the preclinical phases of wild-type and PLP/SOCS1 mice
Because the oligodendrocytes in the wild-type and PLP/SOCS1 mice differ in their responsiveness to IFN-γ, we investigated whether this cytokine was present in the experimental animals during the preclinical phases of the disease. Lymphocyte production of IFN-γ was assessed in the same lymph node preparations at day 8 PI, as described above, using ELISPOT assay (Fig. 9A). Significant IFN-γ production was detected in lymphocyte cultures from fully immunized wild-type and PLP/SOCS1 mice in the presence of the priming antigen (MOG35–55). We found no significant difference in the number of IFN-γ spots per well between the wild-type and PLP/SOCS1 lymphocyte preparations. No significant production of IFN-γ was detected in the same lymphocyte culture preparations in the presence of irrelevant antigen (OVA323–339) or in the presence of either antigen when lymphocyte preparations originated from CFA-injected animals. All lymphocyte cultures responded to a nonspecific stimulation with anti-CD3 with significant and comparable levels of IFN-γ production.
Figure 9.

Expression of IFN-γ and MHC class I in wild-type and PLP/SOCS1 mice. A, B, The levels of IFN-γ expression were measured in the lymphocyte proliferating cultures generated at day 8 PI using ELISPOT assay (A) and in the spinal cords at days 8, 10, 12, 15, and 18 PI using Q-PCR (B) of immunized and CFA-injected mice. Lymphocytes from immunized wild-type (WT) and PLP/SOCS1 mice produced significant and comparable amounts of IFN-γ in the presence of the MOG35–55 and anti-CD3 antibody. IFN-γ expression was detected at comparable levels in the spinal cords of both immunized wild-type and PLP/SOCS1 mice at days 8 and 10 PI. The expression levels at later time points appeared to reflect the dynamic differences of inflammatory involvement between these groups (*p < 0.05, ** p < 0.05). C–J, Representative images of sections immunostained for MHC class I (green), CC1/Cy3 (red), and DAPI (blue)-stained spinal cords of PLP/SOCS1 (top row; C–F) and wild-type spinal cords (bottom row; G–J) with identical clinical scores of 3.0. Note the coexistence of MHC class I-positive inflammatory cells and oligodendrocytes in the wild-type mice and the expression of MHC class I by only the inflammatory cells in the PLP/SOCS1 mice. The stars mark the inflammation and the dotted lines represent its edge; arrows point to the oligodendrocytes, and arrowheads point to the inflammatory cells. Scale bars, 50 μm.
IFN-γ expression levels in the spinal cords of the experimental animals were also measured at the selected time points (Fig. 9B). Total RNA from the spinal cords of three animals from each of the four groups was isolated, and the levels of IFN-γ mRNA were measured using Q-PCR. IFN-γ-specific signal was detected in samples of all fully immunized wild-type and PLP/SOCS1 mice. Comparable levels of IFN-γ expression were detected as early as day 8 PI and again at day 10 PI in both wild-type and PLP/SOCS1 mice. After day 10 PI, the cytokine levels appeared to reflect the dynamics of inflammatory involvement in both groups. We found no significant expression of IFN-γ in the spinal cords of the corresponding CFA-injected wild-type or PLP/SOCS1 mice.
We next characterized the responsiveness of PLP/SOCS1 oligodendrocytes to IFN-γ using the induction of MHC class I molecule expression as an indication of IFN-γ sensitivity. The capacity of SOCS1 to inhibit IFN-γ-mediated induction of MHC class I molecule expression has been established previously (Balabanov et al., 2006). Dual immunostaining for MHC class I and CC1 was performed in all four animal groups and the number of MHC class I+/CC1+ cells/mm2 area of spinal cord was quantitated from the same tissue samples as specified above. MHC class I expression was detectable only in the fully immunized mice and not in the CFA-injected controls. Expression of MHC class I in the immunized wild-type mice was found on both inflammatory cells and oligodendrocytes (Fig. 9C–J). Approximately 37 ± 15/mm2 and 78 ± 31/mm2 MHC class I-positive oligodendrocytes were found in the wild-type mice with a clinical score of 1.0 and 3.0, respectively. The MHC class I-positive oligodendrocytes localized within and at the leading edge of the lesion. In contrast, PLP/SOCS1 mice with identical clinical scores displayed a distinct pattern of MHC class I expression. Inflammatory cells positive for MHC class I were present, whereas MHC class I+/CC1+ cells could not be detected (Fig. 9C–F). Similar differential upregulation of MHC class I expression was observed in double transgenic mice expressing both IFN-γ in the CNS and SOCS1 in oligodendrocytes (Balabanov et al., 2006).
IFN-γ exerted a differential effect on oligodendrocyte response to injury in vitro
The early appearance of oligodendrocyte apoptosis in the fully immunized PLP/SOCS1 mice suggests that IFN-γ provides a direct protection for oligodendrocytes in the preclinical phase of the disease. Moreover, in global gene expression studies with highly purified oligodendrocytes treated with IFN-γ, we observed increased expression of genes involved in protection against oxidative and detoxifying mechanisms, including superoxide dismutase, heme oxidase 1, thioredoxin 1, microsomal glutathione peroxidase and multidrug resistant protein1; genes involved in the ubiquitin-proteosomal pathway important for antigen presentation, as well as genes encoding for the proteolytic degradation of oxidized proteins, including ubiquitin D and ubiquitin-activating enzyme E1-like, ubiquitin-specific peptidase 18, proteasome β type subunits 2, 8, 9, and 10, and proteasome 28 subunit α and β (K. Strand and B. Popko, unpublished observations). Based on these microarray data, we decided to examine whether IFN-γ could protect oligodendrocytes against different deleterious factors in vitro. Mature rat oligodendrocyte cultures, which were comprised of >95% MBP-positive cells, were pretreated with IFN-γ (100 U/ml) for 48 h, and after withdrawal of the cytokine various agents, including anti-fas antibody (0.1 μg/ml), staurosporine (100 μm), ceramide (10 μm), hydrogen peroxide (H2O2) (100 μm), and lactacystin (1 μm) were added to the cultures. These agents have been shown previously to be injurious to oligodendrocytes by triggering different apoptotic pathways (Pouly et al., 2000; Fragoso et al., 2004; Goswami et al., 2005; Goldbaum et al., 2006). Cell viability of treated and untreated cultures was measured 24 h later using the MTT assay. As expected, all tested agents independently reduced oligodendrocyte viability compared with the untreated controls (Fig. 10A). IFN-γ pretreatment had no significant effect on oligodendrocyte viability independently but markedly altered the cellular response to injury. We found that IFN-γ potentiated the toxic effects of anti-fas antibody, staurosporine, and ceramide, whereas it provided protection against H2O2 and lactacystin.
Figure 10.

Effect of IFN-γ on oligodendrocytes. Mature oligodendrocyte cultures were treated for 2 d with IFN-γ (0–100 U/ml), and several cellular effects were measured. A, IFN-γ and oligodendrocyte viability. IFN-γ (100 U/ml) had no effect on oligodendrocyte viability; potentiated the toxicity of anti-fas, staurosporine, and ceramide; and protected oligodendrocytes against H2O2 and lactacystine (*p < 0.05). B, IFN-γ protection against H2O2. Maximum protection was found with 25–50 U/ml at 50 μm H2O2. C, IFN-γ induction of proteasome activity. Maximum induction was found with 25 U/ml. D, IFN-γ protection against lactacystin. Significant protection was found with all doses of IFN-γ (25–100 U/ml) against 1 μm (*p < 0.05) and only with 25 U/ml against 10 μm lactacystine (**p < 0.05).
To further define the protective effect against H2O2, oligodendrocyte cultures were pretreated with different doses of IFN-γ (0–100 U/ml) for 48 h, and 50–100 μm H2O2 was added to the culture media for 24 h (Fig. 10B). H2O2 alone reduced significantly the cell viability to 53 ± 10% at 50 μm and 39 ± 8% at 100 μm of the untreated controls. Again, pretreatment of oligodendrocytes with IFN-γ did not induce significant change in cell viability compared with the untreated controls but provided protection against the H2O2-induced cell death. The highest preservation of cell viability was observed against 50 μm H2O2 after pretreatment with 25 U/ml and 50 U/ml IFN-γ, 98 ± 1 and 91 ± 8%, respectively.
The protective effect of IFN-γ on oligodendrocytes against the proteasome inhibitor lactacystin was also examined in more detail (Fig. 10C). Proteasomes of treated and untreated cells were isolated, and their activity was measured sequentially every 30 min for 3 h using a fluorescent (proteasome 20) assay, and the values were normalized per microgram protein (rfu/μg). Our experiment demonstrated that IFN-γ stimulation (25–100 U/ml) for 48 h resulted in significant upregulation of proteasome activity consistent with our microarray data. The highest levels of proteasome activity were induced by 25–50 U/ml IFN-γ, 4.3 ± 05- and 3.3 ± 0.4-fold increase in activity, respectively. IFN-γ-pretreated and untreated oligodendrocyte cultures were incubated with the proteasome inhibitor lactacystin (0.1–10 μm), and cell viability was measured using MTT assay (Fig. 10D). Lactacystin significantly reduced cell viability in the untreated cultures in a dose-dependent manner: 74 ± 5 at 1 μm and 63 ± 7 at 10 μm lactacystin. IFN-γ-pretreated cells were protected against lactacystin toxicity. Maximum preservation of cell viability was observed against 1 and 10 μm lactacystin fallowing pretreatment with 25 U/ml IFN-γ (95 ± 2 and 85 ± 4, respectively).
IFN-γ induced oligodendrocyte expression of chemokines
In an effort to gain insight into the distinct neuropathological features displayed by the PLP/SOCS1 transgenic mice, particularly with regard to altered pattern of immune cell infiltrates, we examined IFN-γ-treated oligodendrocytes for the potential to express various chemokines and cytokines (Fig. 11A). Culture media were examined for expression of IL1β, IL6, TNF-α, CXCL10 (IP10), CCL2 (MCP-1), CCL3 (MIP-1α), and CCL5 (RANTES) using the cytokine (LiquiChip) assay. We found no detectable levels of any of these molecules in the untreated cultures. In contrast, IFN-γ-treated oligodendrocyte cultures significantly upregulated CXCL10 (IP10), CCL2 (MCP-1), CCL3 (MIP-1α), and CCL5 (RANTES). The levels of CXC10 (IP10) were dose dependent (10–100 U/ml IFN-γ) and represented by far the highest chemokine induction (812 ± 59 pg/ml at 100 U/ml IFN-γ). CCL2 (MCP-1) and CCL3 (MIP-1α) production increased significantly at low doses of IFN-γ (10–25 U/ml IFN-γ) but did not increase any further at higher doses (39 ± 3 and 63 ± 7 pg/ml for MCP-1 and MIP-1α, respectively, at 25 U/ml IFN-γ). Production of CCL5 (RANTES) appeared to increase only at high doses of IFN-γ (65 ± 9; 100 U/ml IFN-γ). We found no significant upregulation of IL1, IL6, and TNF-α at any of the treatment doses.
Figure 11.

IFN-γ induction of chemokines. A, Differentiated oligodendrocyte cultures were stimulated with various doses of IFN-γ (0–100 U/ml) for 48 h, and the conditioned media were assayed for cytokine production by using LiquiChip assay. Control unstimulated oligodendrocytes produced no detectible levels of cytokines or chemokines. Oligodendrocyte stimulated with IFN-γ upregulated the expression of a number of chemokines: IP10, RANTES, MIP-1α, and MCP-1. No expression of IL1β, IL-6, and TNF-α was found in any of the samples. B, IP10 expression levels were measured in the spinal cords of CFA-injected controls and immunized wild-type (WT) and PLP/SOCS1 mice with identical clinical scores (0.0, 1.0, and 3.0) using Q-PCR. We found significantly lower expression of IP10 in the PLP/SOCS1 mice with a clinical score of 3.0 compared with the wild-type mice with an identical disease severity (*p < 0.05).
We also measured CXCL10 (IP10) expression levels in the spinal cords of CFA-injected and fully immunized wild-type and PLP/SOCS1 mice with different clinical scores (0.0, 1.0, and 3.0) (Fig. 11B). Total RNA from the spinal cords of three animals from each of the four groups was isolated, and the levels of CXCL10 (IP10) mRNA were measured using Q-PCR. CXCL10 (IP10)-specific signal was detected in samples of immunized wild-type and PLP/SOCS1 mice with clinical scores of 1.0 and 3.0. The levels of CXCL10 (IP10) were comparable in all animals with a clinical score of 1.0 but significantly lower in the PLP/SOCS1 mice with a clinical score of 3.0 compared with the wild-type mice (p < 0.05). We found no significant expression of CXCL10 (IP10) in the spinal cords of the corresponding CFA-injected wild-type or PLP/SOCS1 mice.
Discussion
In the present study, we exploited the PLP/SOCS1 line of transgenic mice, which display reduced oligodendrocyte responsiveness to IFN-γ, to examine the significance of IFN-γ-oligodendrocyte interactions in the course of EAE. We found that these mice developed the disease with an accelerated onset that was associated with enhanced early CNS inflammation compared with wild-type mice. This difference in inflammatory dynamics was preceded by a common preclinical stage of comparable peripheral immune responses and occurred without significant variations in the cellular composition of the infiltrates during the clinical stage. We also found that IFN-γ was expressed in the CNS of both wild-type and the PLP/SOCS1 mice during the preclinical phase at comparable levels. The enhanced early inflammation in the PLP/SOCS1 mice was associated with markedly increased oligodendrocyte apoptosis, which appeared earlier and in the presence of significantly fewer inflammatory foci compared with the wild-type mice. Despite the presence of early inflammation and apoptotic oligodendrocytes, the inflammatory infiltration in the PLP/SOCS1 mice remained mainly perivascular with little involvement of the myelinated tracts or demyelination.
The accelerated disease onset in the PLP/SOCS1 mice can best be attributed to an increased oligodendrocyte susceptibility to injury and accelerated CNS inflammation, which likely facilitated the earlier precipitation of clinical signs in the PLP/SOCS1 mice. The milder perivascular inflammation and the minimal parenchymal infiltration and demyelination observed in the PLP/SOCS1 mice, however, also suggests that despite its accelerated onset, the inflammatory reaction failed to develop to its full extent in these animals. This apparent disconnection between perivascular inflammation and parenchymal infiltration most likely contributed to the clinical recovery in the PLP/SOCS1 mice. Because IFN-γ is expressed in the CNS early in the preclinical phase (Glabinski et al., 2003), as well as during the acute disease, we attribute the observed clinicopathological differences in the PLP/SOCS1 mice to the suppression of IFN-γ/Stat1 signaling in oligodendrocytes.
To investigate further the potential mechanisms that may be involved in the observed differences between wild-type and PLP/SOCS1 mice, we examined the effect of IFN-γ on mature oligodendrocytes in vitro. Our experiments revealed that IFN-γ elicited differential cellular responses to potentially injurious agents. Specifically, we found that IFN-γ potentiated the harmful effect of death receptor signaling triggered by Fas cross-linking ceramide and staurosporine but provided protection against oxidative stress and the inhibition of proteasome activity. Our findings of an enhancing effect of IFN-γ on death receptor signaling in oligodendrocytes are in accordance with previous reports (Agresti et al., 1998; Pouly et al., 2000). The protective effect of IFN-γ on oligodendrocytes against oxidative stress in our study was best observed at lower IFN-γ doses and is likely to involve upregulation of genes with antioxidant function and the activation of proteosome activity.
These results suggest that the distinct clinicopathological response of the PLP/SOCS1 mice to EAE induction can be attributed, at least in part, to a suppression of the differential effects of IFN-γ on oligodendrocytes. It is likely that the early CNS presence of IFN-γ in the EAE disease course provides protection to oligodendrocytes in wild-type mice, and the suppression of this protective effect in the PLP/SOCS1 mice results in increased early oligodendrocyte apoptosis. A well-recognized pathogenic factor in EAE that our in vitro experiments suggest may be a target of IFN-γ protection is oxidative stress, which occurs early in the preclinical phase of the disease (Ruuls et al., 1995). This possibility is supported by a report demonstrating that IFN-γ knock-out (−/−) mice developed more severe oxidative stress during the course of EAE compared with wild-type mice (Espejo et al., 2002). Induction of proteasome activity by IFN-γ is also of particular significance, because proteasomal elimination of oxidized/modified proteins is a principle line of cellular defense against oxidative stress (Poppek and Grune, 2006). Oligodendrocytes appear to be very sensitive to the accumulation of oxidized/modified proteins, a process that triggers mitochondrial dysfunction and apoptotic cell death (Goldbaum et al., 2006). The protective effect of IFN-γ is also consistent with a report from our laboratory that demonstrated that enforced expression of this cytokine in the CNS at low levels, insufficient to cause developmental myelin abnormalities, provides protection against toxic (cuprizone)-induced oligodendrocyte injury and demyelination in mature animals (Gao et al., 2000).
Death receptor signaling is a key mechanism of cell-mediated cytotoxicity and it is an important cause of oligodendrocyte cell death in EAE (Okuda et al., 1998; Hovelmeyer et al., 2005). IFN-γ plays a critical role in regulating TNF-α receptor and Fas expression, and as we and others have demonstrated, IFN-γ potentiates death receptor signaling in oligodendrocytes (Agresti et al., 1998; Pouly et al., 2000; Goswami et al., 2005). Perhaps diminished IFN-γ signaling in the PLP/SOCS1 oligodendrocytes provided protection against this type of cell death, which in turn permitted faster resolution of the inflammatory reaction, despite its accelerated onset and initial oligodendrocyte apoptosis. The milder inflammatory reaction in the PLP/SOCS1 mice is in accordance with reports demonstrating that double knock-out TNFαR−/−/Fas−/− mice with deficient death receptor signaling developed a relatively minor inflammatory reaction in EAE (Hovelmeyer et al., 2005).
The findings in the PLP/SOCS1 mice are also consistent with recent observations we made concerning EAE induction in transgenic mice in which the expression of IFN-γ in the CNS can be temporally controlled. Induction of transgenic IFN-γ expression in the preclinical phase of EAE ameliorates the disease (Lin et al., 2007); whereas when IFN-γ expression is activated later in the clinical phase, it worsens the disease course (Lin et al., 2006). Interestingly, in these studies, we demonstrated that the observed effects of IFN-γ, both protective and deleterious, are modulated by the activity of the pancreatic endoplasmic reticulum (ER) kinase, an ER-localized kinase that is known to be a critical participant in the ER stress response (Harding et al., 2000). Together, these studies suggest that IFN-γ-induced ER stress in oligodendrocytes may participate in both the protective as well as the deleterious effects of this cytokine in the response to EAE induction.
The results of the present study also suggest a link between oligodendrocyte injury, responsiveness of IFN-γ, and the dynamics of the inflammatory reaction in the CNS. Enhanced early inflammation in the PLP/SOCS1 mice coincided with markedly increased oligodendrocyte apoptosis. Other reports demonstrating that transgenic mice with oligodendrocytes resistant to apoptosis developed attenuated CNS inflammation and milder disease are also in support of such an association (Hisahara et al., 2000, 2003). The underlying mechanisms for the observed accelerated inflammatory reaction in the PLP/SOCS1 mice remain unclear, but it is possible that the process of antigen presentation is involved. Because the initiation of EAE depends on de novo antigen presentation of myelin proteins in the CNS, injured oligodendrocytes may increase the availability of the priming antigen, thereby accelerating the inflammatory reaction (Tompkins et al., 2002; McMahon et al., 2005). Interestingly, initial antigen presentation in the CNS has been shown to occur in the perivascular space (Hickey and Kimura, 1988; McMahon et al., 2005), the site of accelerated inflammatory infiltration in the PLP/SOCS1 mice.
Our experiments also provided evidence that IFN-γ-stimulated oligodendrocytes can be an important source of chemokines. The apparent disconnection between the perivascular inflammation and the diminished parenchymal infiltration and demyelination in the PLP/SOCS1 mice may reflect, at least in part, suppression of IFN-γ-induced chemotactic signaling. Genes induced by IFN-γ through the course of EAE influence the dynamics and extent of CNS inflammation (Glabinski et al., 1999; Tran et al., 2000), and suppression of the production of oligodendrocyte-derived chemokines, particularly CXCL10 (IP10), may limit the inflammatory reaction to the perivascular space and minimize inflammatory invasion of the myelin tract. Such a conclusion is consistent with a previous report demonstrating that the neutralization of CXCL10 (IP10) activity reduces CNS inflammatory invasion and demyelination in EAE (Lui et al., 2001).
Our experiments demonstrate that suppression of IFN-γ-oligodendrocyte interactions early in the course of EAE alters the patterns of inflammatory demyelination and oligodendrocyte injury. Myelin stripping in the presence of significant macrophage infiltration, as observed in the wild-type mice, and primarily oligodendrocyte apoptosis accompanied by milder inflammation, as observed in the PLP/SOCS1 mice, are reminiscent of type I and type III patterns of demyelination, respectively, in multiple sclerosis (Lassmann et al., 2001). Primary oligodendrocyte apoptosis in the absence of significant inflammation has also been found in the very early lesions of multiple sclerosis (Barnett and Prineas, 2004). The similarities with our experimental findings suggest that increased differential oligodendrocyte susceptibility to injury and altered inflammatory mechanisms may be involved in the formation of the demyelination patterns of MS.
In conclusion, we examined the significance of IFN-γ-oligodendrocyte interactions during the course of EAE. We demonstrate that suppression of these interactions is of major significance to the clinical and pathological aspects of the disease. Our experiments suggest that oligodendrocytes are not simply targets of inflammatory injury but participants of the neuroimmune network operating during the course of EAE. Further defining the molecular consequences of IFN-γ-oligodendrocyte interactions may provide novel therapeutic targets for human inflammatory demyelinating diseases.
Footnotes
This work was supported by National Institutes of Health Grants K08 NS5040901 (R.B.) and R01 NS34939 (B.P.), grants from the Myelin Repair Foundation (B.P., S.D.M.), and National Multiple Sclerosis Society Grant RG 3291 A4/T (B.P.). We have no conflicting financial interests.
References
- Agresti C, Bernardo A, Del Russo N, Marziali G, Battistini A, Aloisi F, Levi G, Coccia E. Synergistic stimulation of MHC class I and IRF-1 gene expression by IFN-gamma and TNF-alpha in oligodendrocytes. Eur J Neurosci. 1998;10:2975–2983. doi: 10.1111/j.1460-9568.1998.00313.x. [DOI] [PubMed] [Google Scholar]
- Balabanov R, Stand K, Kemper A, Lee, Popko B. Suppressor of cytokine signaling 1 expression protects oligodendrocytes from the deleterious effects of interferon-gamma. J Neurosci. 2006;26:5143–5152. doi: 10.1523/JNEUROSCI.0737-06.2006. [DOI] [PMC free article] [PubMed] [Google Scholar]
- Barnett M, Prineas J. Relapsing and remitting multiple sclerosis: pathology of the newly forming lesion. Ann Neurol. 2004;55:458–468. doi: 10.1002/ana.20016. [DOI] [PubMed] [Google Scholar]
- Bottesthein J. Growth requirements in vitro of oligodendrocyte cell lines and neonatal rat brain oligodendrocytes. Proc Natl Acad Sci USA. 1986;83:1955–1959. doi: 10.1073/pnas.83.6.1955. [DOI] [PMC free article] [PubMed] [Google Scholar]
- Carpenter P, Begolka W, Olson J, Elhofy A, Karpus W, Miller S. Differential activation of astrocytes by innate and adaptive immune stimuli. Glia. 2005;49:360–374. doi: 10.1002/glia.20117. [DOI] [PubMed] [Google Scholar]
- Corbin J, Kelly D, Rath E, Baerwald K, Suzuki K, Popko B. Targeted CNS expression of interferon-gamma in transgenic mice leads to hypomyelination, reactive gliosis, and abnormal cerebellar development. Mol Cell Neurosci. 1996;7:354–370. doi: 10.1006/mcne.1996.0026. [DOI] [PubMed] [Google Scholar]
- Emery B, Butzkueven H, Snell C, Binder M, Kilpatrick T. Oligodendrocytes exhibit selective expression of suppressor of cytokine signaling genes and signal transducer and activator of transcription 1 independent inhibition of interferon-gamma-induced toxicity in response to leukemia inhibitory factor. Neuroscience. 2006;137:463–472. doi: 10.1016/j.neuroscience.2005.09.022. [DOI] [PubMed] [Google Scholar]
- Ercolini A, Miller S. Mechanisms of immunopathology in murine models of central nervous system demyelinating disease. J Immunol. 2006;176:3293–3298. doi: 10.4049/jimmunol.176.6.3293. [DOI] [PubMed] [Google Scholar]
- Espejo C, Penkowa M, Saez-Torres I, Hidalgo J, Garcia A, Montalban X, Martinez-Caceres E. Interferon-gamma regulates oxidative stress during experimental autoimmune encephalomyelitis. Exp Neurol. 2002;177:21–31. doi: 10.1006/exnr.2002.7982. [DOI] [PubMed] [Google Scholar]
- Ferber I, Broke S, Taylor-Edwards C, Rigway W, Dinisco C, Steinman L, Dalton D, Fathman C. Mice with disrupted IFN-gamma gene are susceptible to induction of experimental autoimmune encephalomyelitis (EAE) J Immunol. 1996;159:5–17. [PubMed] [Google Scholar]
- Fragoso G, Martinez-Bermudez A, Liu H, Khorchid A, Chemtob S, Mushynski W, Almazan G. Developmental differences in HO-induced oligodendrocyte cell death: role of glutathione, mitogen-activated protein kinases and caspase 3. J Neurochem. 2004;90:392–404. doi: 10.1111/j.1471-4159.2004.02488.x. [DOI] [PubMed] [Google Scholar]
- Furlan R, Bramilla E, Ruffini F, Poliani P, Bergami A, Marconi P, Franciotta D, Penna G, Comi G, Adorini L, Martino G. Intrathecal delivery of IFN-gamma protects C57BL/6 mice from chronic progressive experimental autoimmune encephalomyelitis by increasing apoptosis of central nervous system-infiltrating lymphocytes. J Immunol. 2001;167:1821–1829. doi: 10.4049/jimmunol.167.3.1821. [DOI] [PubMed] [Google Scholar]
- Gao X, Gilling T, Ye P, D'Ercole J, Matsushima G, Popko B. Interferon-γ protects against cuprizone-induced demyelination. Mol Cell Neurosci. 2000;16:338–349. doi: 10.1006/mcne.2000.0883. [DOI] [PubMed] [Google Scholar]
- Glabinski A, Kranowski M, Han Y, Owens T, Ransohoff R. Chemokine expression in GRO mice (lacking interferon-gamma) with experimental autoimmune encephalomyelitis. J Neurovirol. 1999;51:95–101. doi: 10.3109/13550289909029750. [DOI] [PubMed] [Google Scholar]
- Glabinski AR, Bielecki B, Ransohoff RM. Chemokine upregulation follows cytokine expression in chronic relapsing experimental autoimmune encephalomyelitis. Scand J Immunol. 2003;58:81–88. doi: 10.1046/j.1365-3083.2003.01285.x. [DOI] [PubMed] [Google Scholar]
- Goldbaum O, Vollmer G, Richter-Landsberg C. Proteasome inhibition by MG-132 induces apoptotic cell death and mitochondrial dysfunction in cultured rat brain oligodendrocytes but not in astrocytes. Glia. 2006;53:891–901. doi: 10.1002/glia.20348. [DOI] [PubMed] [Google Scholar]
- Gonzalez J, Bergmann C, Ramakrishna C, Hinton D, Atkinson R, Hoskin J, Macklin W, Stohlman S. Inhibition of interferon-gamma signaling in oligodendroglia delays coronavirus clearance without altering demyelination. Am J Pathol. 2006;168:796–804. doi: 10.2353/ajpath.2006.050496. [DOI] [PMC free article] [PubMed] [Google Scholar]
- Goswami R, Ahmed M, Kilkus J, Han T, Dawson SA, Dawson G. Differential regulation of ceramide in lipid-rich microdomains (rafts): antagonistic role of palmitoyl:protein thioesterase and neutral sphingomyelinase 2. J Neurosci Res. 2005;81:208–217. doi: 10.1002/jnr.20549. [DOI] [PubMed] [Google Scholar]
- Harding HP, Zhang Y, Bertolotti A, Zeng H, Ron D. Perk is essential for translational regulation and cell survival during the unfolded protein response. Mol Cell. 2000;5:897–904. doi: 10.1016/s1097-2765(00)80330-5. [DOI] [PubMed] [Google Scholar]
- Hermans H, Dillen M, Groenen E, Martens E, Biliau A. Chronic-relapsing experimental autoimmune encephalomyelitis (CREAE) in mice: enhancement by monoclonal antibodies against interferon-γ. Eur J Immunol. 1996;26:2393–2398. doi: 10.1002/eji.1830261019. [DOI] [PubMed] [Google Scholar]
- Hickey W, Kimura H. Perivascular microglial cells of the CNS are bone marrow-derived and present antigen in vivo. Science. 1988;239:290–292. doi: 10.1126/science.3276004. [DOI] [PubMed] [Google Scholar]
- Hisahara S, Araki T, Sugiyama F, Yagami K, Suzuki M, Abe K, Yamamura K, Miyazaki J, Momoi T, Satura T, Bernard C, Okano H, Miura M. Targeted expression of baculovirus p35 caspase inhibitor in oligodendrocytes protects mice against autoimmune-mediated demyelination. EMBO J. 2000;19:341–348. doi: 10.1093/emboj/19.3.341. [DOI] [PMC free article] [PubMed] [Google Scholar]
- Hisahara S, Yuan J, Momoi T, Okano H, Miura M. Caspase-11 mediates oligodendrocyte cell death and pathogenesis of autoimmune-mediated demyelination. J Exp Med. 2003;193:111–122. doi: 10.1084/jem.193.1.111. [DOI] [PMC free article] [PubMed] [Google Scholar]
- Horwitz M, Evans C, McGavern D, Rodriguez M, Oldstone M. Primary demyelination in transgenic mice expressing interferon-gamma. Nat Med. 1997;3:1037–1041. doi: 10.1038/nm0997-1037. [DOI] [PMC free article] [PubMed] [Google Scholar]
- Hovelmeyer N, Hao Z, Kranidioti K, Kassiotis G, Buch T, Frommer F, von Hoch L, Kramer D, Minichiello L, Kollias G, Lassmann H, Waisman Apoptosis of oligodendrocytes via Fas and TNF-R1 is a key event in the induction of experimental autoimmune encephalomyelitis. J Immunol. 2005;175:5875–5884. doi: 10.4049/jimmunol.175.9.5875. [DOI] [PubMed] [Google Scholar]
- Krakowski M, Owens T. Interferon-gamma confers resistance to experimental allergic encephalomyelitis. Eur J Immunol. 1996;26:1641–1646. doi: 10.1002/eji.1830260735. [DOI] [PubMed] [Google Scholar]
- Lassmann H, Werkele H. Experimental models of multiple sclerosis. In: Compston A, Ebers E, Lassmann H, McDonald I, Matthews B, Werkele H, editors. McAlpin's multiple sclerosis. Ed 3. London: Churchill Livingstone; 1998. pp. 409–433. [Google Scholar]
- Lassmann H, Bruck W, Lucchinetti C. Heterogeneity of multiple sclerosis pathogenesis: implications for diagnosis and therapy. Trends Mol Med. 2001;7:115–121. doi: 10.1016/s1471-4914(00)01909-2. [DOI] [PubMed] [Google Scholar]
- Lin W, Harding H, Ron D, Popko B. Endoplasmic reticulum stress modulates the response of myelinating oligodendrocytes to the immune cytokine interferon-gamma. J Cell Biol. 2005;169:603–612. doi: 10.1083/jcb.200502086. [DOI] [PMC free article] [PubMed] [Google Scholar]
- Lin W, Kemper A, Dupree J, Harding H, Ron D, Popko B. Interferon-gamma inhibits central nervous system remyelination through a process modulated by endoplasmic reticulum stress. Brain. 2006;129:1306–1318. doi: 10.1093/brain/awl044. [DOI] [PubMed] [Google Scholar]
- Lin W, Bailey SL, Ho H, Harding HP, Ron D, Miller SD, Popko B. The integrated stress response prevents demyelination by protecting oligodendrocytes against immune-mediated damage. J Clin Invest. 2007;117:448–456. doi: 10.1172/JCI29571. [DOI] [PMC free article] [PubMed] [Google Scholar]
- Lui M, Keirstead H, Lane T. Neutralization of the chemokine CXCL10 reduces inflammatory cell invasion and demyelination and improves neurological function in a viral model of multiple sclerosis. J Immunol. 2001;167:4091–4097. doi: 10.4049/jimmunol.167.7.4091. [DOI] [PubMed] [Google Scholar]
- Maier J, Kincaid C, Pagenstecher A, Campbell I. Regulation of signal transducer and activator of transcription and suppressor of cytokine-signaling gene expression in the brain of mice with astrocyte-targeted production of interleukin-12 or experimental autoimmune encephalomyelitis. Am J Pathol. 2002;160:271–288. doi: 10.1016/S0002-9440(10)64371-4. [DOI] [PMC free article] [PubMed] [Google Scholar]
- McCarthy K, de Vellis J. Preparation of separate astroglial and oligodendroglial cell cultures from rat cerebral tissue. J Cell Biol. 1980;85:890–902. doi: 10.1083/jcb.85.3.890. [DOI] [PMC free article] [PubMed] [Google Scholar]
- McMahon E, Bailey S, Castaneda C, Waldner H, Miller S. Epitope spreading initiates in the CNS in two mouse models of multiple sclerosis. Nat Med. 2005;11:335–339. doi: 10.1038/nm1202. [DOI] [PubMed] [Google Scholar]
- Murray P, McGavern D, Pease L, Rodriguez M. Cellular sources and targets of IFN-gamma-mediated protection against viral demyelination and neurological deficits. Eur J Immunol. 2002;32:606–615. doi: 10.1002/1521-4141(200203)32:3<606::aid-immu606>3.0.co;2-d. [DOI] [PMC free article] [PubMed] [Google Scholar]
- Okuda Y, Bernard C, Fujimura H, Yanagihara T, Sakoda S. Fas has a crucial role in the progression of experimental autoimmune encephalomyelitis. Mol Immunol. 1998;35:317–326. doi: 10.1016/s0161-5890(98)00049-2. [DOI] [PubMed] [Google Scholar]
- Polizzotto M, Bartlett P, Turnley A. Expression of “suppressor of cytokine signaling” (SOCS) genes in the developing and adult mouse nervous system. J Comp Neurol. 2000;423:348–358. [PubMed] [Google Scholar]
- Poppek D, Grune T. Proteasomal defense of oxidative protein modifications. Antioxid Redox Signal. 2006;8:173–184. doi: 10.1089/ars.2006.8.173. [DOI] [PubMed] [Google Scholar]
- Pouly S, Becher B, Blain M, Antel J. Interferon-gamma modulates human oligodendrocyte susceptibility to Fas-mediated injury. J Neuropathol Exp Neurol. 2000;59:280–286. doi: 10.1093/jnen/59.4.280. [DOI] [PubMed] [Google Scholar]
- Renno T, Taupin V, Bourbonniere L, Verge G, Tran E, De Simone R, Krakowski M, Rodriguez M, Peterson A, Owens T. Interferon-γ in progression to chronic demyelination and neurological deficit following acute EAE. Mol Cell Neurosci. 1998;12:376–389. doi: 10.1006/mcne.1998.0725. [DOI] [PubMed] [Google Scholar]
- Rodriguez M, Pavelko K, Coffman R. Gamma interferon is critical for resistance to Theiler's virus-induced demyelination. J Virol. 1995;69:7286–7290. doi: 10.1128/jvi.69.11.7286-7290.1995. [DOI] [PMC free article] [PubMed] [Google Scholar]
- Ruuls S, Bauer J, Sontrop K, Huitinga K, t'Hart B, Dijkstra C. Reactive oxygen species are involved in the pathogenesis of experimental allergic encephalomyelitis in Lewis rats. J Neuroimmunol. 1995;56:207–217. doi: 10.1016/0165-5728(94)00154-g. [DOI] [PubMed] [Google Scholar]
- Starr R, Wilson T, Viney E, Murray L, Rayner J, Jenkins J, Brendan J, Gonda T, Alexander W, Metcalf D, Nicola N, Hilton J. A family of cytokine-inducible inhibitors of signaling. Nature. 1997;387:917–921. doi: 10.1038/43206. [DOI] [PubMed] [Google Scholar]
- Swanborg R. Experimental allergic encephalomyelitis. Methods Enzymol. 1988;140:1132–1138. doi: 10.1016/0076-6879(88)62095-7. [DOI] [PubMed] [Google Scholar]
- Tanuma N, Shin T, Kogure K, Matsumoto Y. Differential role of TNF-α and IFN-γ in the brain of rats with chronic relapsing autoimmune encephalomyelitis. J Neuroimmunol. 1999;93:73–79. doi: 10.1016/s0165-5728(99)00018-1. [DOI] [PubMed] [Google Scholar]
- Tompkins S, Padilla J, Del Canto M, Ting J, Van Kaer L, Miller S. De novo central nervous system processing of myelin antigen is required for the initiation of experimental autoimmune encephalomyelitis. J Immunol. 2002;168:4173–4183. doi: 10.4049/jimmunol.168.8.4173. [DOI] [PubMed] [Google Scholar]
- Tran E, Prince E, Owens T. IFN-gamma shapes invasion of the central nervous system via regulation of chemokines. J Immunol. 2000;164:2759–2768. doi: 10.4049/jimmunol.164.5.2759. [DOI] [PubMed] [Google Scholar]
- Wensky A, Furtado G, Marcondes M, Chen S, Manfra D, Lira S, Zagzag D, Lafaille J. IFN-gamma determines distinct clinical outcomes in autoimmune encephalomyelitis. J Immunol. 2005;174:1416–1423. doi: 10.4049/jimmunol.174.3.1416. [DOI] [PubMed] [Google Scholar]
- Willenborg D, Fordman S, Staykova M, Ranshaw I, Cowden W. IFN-gamma is critical to the control of murine autoimmune encephalomyelitis and regulated both in the periphery and in the target tissue: a possible role for the nitric oxide. J Immunol. 1999;163:5278–5286. [PubMed] [Google Scholar]
- Voorthuis J, Uitdehaag B, De Groot C, Goede P, van der Meide P, Dijukstra C. Suppression of experimental allergic encephalomyelitis by intraventricular administration of interferon-gamma in Lewis rats. Clin Exp Immunol. 1990;81:183–188. doi: 10.1111/j.1365-2249.1990.tb03315.x. [DOI] [PMC free article] [PubMed] [Google Scholar]