

Abstract
Primary progressive aphasia (PPA) is a neurodegenerative dementia syndrome principally characterized by the gradual dissolution of language functions, especially in the early stages of disorder. In a previous functional neuroimaging study, PPA patients were found to activate core language areas similarly to control subjects when performing semantic and phonological processing tasks (Sonty et al., 2003). In the present study, functional magnetic resonance imaging (fMRI) and dynamic causal modeling (DCM) were used to study multiregional effective connectivity in early-stage PPA (n = 8) and control (n = 8) subjects performing semantic word matching and visual letter matching tasks. fMRI analysis showed semantic task-specific activations in the left inferior frontal (Broca's area) and posterior superior temporal (Wernicke's area) regions, in addition to other language regions, in both groups. Using a model language network consisting of six left hemisphere regions, the DCM analysis demonstrated reduced language-specific effective connectivity between Wernicke's and Broca's areas in the PPA patient group. Furthermore, this decrement in connectivity was predictive of semantic task accuracy. These results demonstrate for the first time that dysfunctional network interactions (effective connectivity), rather than hypoactivity within individual brain regions, may contribute to the emergence of language deficits seen in PPA.
Keywords: primary progressive aphasia, effective connectivity, dynamic causal modeling, language network, Broca's area, Wernicke's area
Introduction
Primary progressive aphasia (PPA) is a neurodegenerative syndrome principally affecting language, producing word finding, naming, comprehension, and/or syntactic deficits (Mesulam and Weintraub, 1992; Mesulam, 2003). In contrast to other degenerative dementias, attention, memory, and other cognitive functions are relatively preserved within initial phases of illness. PPA has been associated with circumscribed atrophy and functional disruption in left-hemisphere perisylvian and temporal brain regions (Chawluk et al., 1986; Tyrrell et al., 1990; Abe et al., 1997; Westbury and Bub, 1997; Sonty et al., 2003; Gorno-Tempini et al., 2004). The behavioral and structural focality of PPA make it an important model for studying the functional anatomy of language and the effects of degenerative disease on brain function.
In a previous neuroimaging study by the Gitelman group (Sonty et al., 2003), functional magnetic resonance imaging (fMRI) was used to compare PPA and control subjects performing semantic and phonological judgment tasks. The two groups showed similar activations in perisylvian cortex, despite left temporoparietal cortical atrophy in the PPA group. Patients also showed greater activation in premotor, parietal, and fusiform regions. Thus, regional hypoactivity in functionally segregated cortical areas did not provide an adequate account of PPA-related language dysfunction.
Although the lesion deficit model has been the standard approach to understanding neurological dysfunction, disconnection syndromes have assumed increasing importance, as demonstrated clinically (Geschwind, 1965), and more recently through functional imaging in disorders such as stroke (Price et al., 2001), dyslexia (Price et al., 2003), and degenerative dementia (Mummery et al., 1999; Cipolotti and Maguire, 2003), wherein brain damage may disrupt interregional connections within large-scale neural networks (Mesulam, 1990). In PPA, a recent report using proton magnetic resonance (MR) spectroscopy suggested axonal injury within the left superior longitudinal fasciculus, a fiber bundle connecting the classical Wernicke's and Broca's language areas (Catani et al., 2003), thereby suggesting a locus of potential disconnection within the PPA language network.
The current study used dynamic causal modeling (DCM) to examine effective connectivity within the PPA language network. DCM uses a nonlinear systems identification framework and Bayesian estimation to examine direct and interacting effects of experimental conditions and regional signals in brain networks (Friston et al., 2003). DCM neither confirms the presence of specific anatomical connections, nor provides specific information about how interregional influences are mediated. Instead, DCM makes context-specific inferences about the aggregated influences among network regions that may be mediated by monosynaptic or polysynaptic interregional connections, or indirectly through intervening brain regions not explicitly included in the network model (Friston et al., 2003).
Effective connectivity was examined within a six-region model incorporating the left-hemisphere regions activated by PPA and control subjects during lexicosemantic task performance: inferior frontal gyrus, posterior superior temporal cortex, posterior fusiform gyrus, inferior parietal lobule, intraparietal sulcus, and ventral premotor cortex. Task-specific effects were assessed at all network connections and compared between groups to assess PPA-related alterations in connectivity, with specific hypotheses targeting influences between the inferior frontal and superior temporal language epicenters. Gray matter density from each network region was also measured to ensure that findings were not an epiphenomenon of gray matter atrophy.
Materials and Methods
Subjects.
Nine patients (age, mean ± SD, 72.3 ± 7.4 years; four males, five females; education, 17 ± 3.8 years) fulfilled the diagnostic criteria for PPA (Mesulam, 2001), as assessed by neurologists with >10 years of clinical experience in the diagnosis (DRG, MMM). The mean duration of disease after diagnosis was 3.6 ± 1.8 years. These patients were generally of the logopenic subtype, reflecting the presence of one or more of the following criteria: (1) reduced number of words expressed per minute, (2) decreased phrase length, and/or (3) frequent word-finding pauses either in spontaneous speech output or on the Oral Cookie Theft subtest of the Boston Diagnostic Aphasia Examination (BDAE) (Goodglass and Kaplan, 1983), with varying degrees of agrammatism and phonemic paraphasia (Sinnathamby et al., 1996; Mesulam et al., 2003). Eight of nine patients exhibited naming deficits of varying severity, as well as impairments in single-word repetition. Two of nine patients showed impairments in comprehension, one for reading comprehension and the other for auditory comprehension. For the remaining seven patients, single-word comprehension was preserved, although six of nine patients exhibited difficulties at the level of grammatically complex sentences.
Nine older normal control subjects (age, 66.8 ± 9.7 years; two males, seven females; education, 15.2 ± 1.8 years) with no history of significant medical, neurologic, or psychiatric illness were also recruited. All subjects were right-handed as assessed by the modified Edinburgh inventory (Oldfield, 1971) with an average handedness score of 88.5 ± 8.66 for the PPA subjects and 98 ± 3.5 for the normal subjects. All subjects specified English as their first language. Informed consent was obtained from all subjects, and the study protocols were approved by the Institutional Review Board at Northwestern University.
Neuropsychological testing.
PPA patients underwent neuropsychological testing within 6 months of scanning for characterization of their cognitive functioning in a variety of domains including attention, language, memory, visuospatial, comportment, and executive functions. The following neuropsychological tests were administered to each subject: language measures, Western Aphasia Battery (WAB) (Kertesz, 1982), BDAE (selected subtests) (Goodglass and Kaplan, 1983), Boston Naming Test (BNT) (Kaplan et al., 1983); nonlanguage measures, Mini-Mental Status Exam (MMSE) (Folstein et al., 1975), Consortium to Establish a Registry for Alzheimer's Disease (CERAD) Word List Learning (Morris et al., 1989), CERAD Word List Recognition, Wechsler Memory Scale—Revised (WMS-R) Logical Memory I and II (Wechsler, 1987), Word List Generation (category fluency: animals and lexical fluency) (Benton et al., 1983), Judgment of Line Orientation (JLO) (Benton et al., 1998), Trail Making Test (Halstead, 1947), and the Geriatric Depression Scale (GDS) (Yesavage et al., 1983). Six of nine control subjects also received neuropsychological testing on the above batteries through their participation in the Northwestern Alzheimer's Disease Clinical Core program, excluding the Western Aphasia Battery and the Boston Diagnostic Aphasia Examination. The remaining subjects were recruited from the community and therefore received no neuropsychological testing.
PPA patients showed impairments on the Boston Naming Test and on tests of verbal fluency (lexical and categorical). However, these patients performed within normal limits on auditory verbal comprehension subtests of the Boston Diagnostic Aphasia Examination (or the Western Aphasia Battery, which was administered for one patient) (Goodglass and Kaplan, 1983). Some patients also showed impairments on neuropsychological tests that required verbal comprehension or response [e.g., MMSE, CERAD Word Lists, CERAD Logical Memory I and II (recall)]. However, a review of daily living activities (Johnson et al., 2004), and clinical tests of knowledge for current events did not provide evidence for any impairment of episodic memory. In addition, when verbally mediated tests of memory were adapted to reduce the need for a spoken response, subjects displayed preserved retention of information. Therefore, the low scores on some nonlanguage tests were attributed to interference from the language impairment. PPA patients showed relatively less impairment in CERAD Word List Recognition, Visual Target Cancellation, JLO, and the Visual–Verbal Test (Wicklund et al., 2004), representing tests of memory, visuospatial functions, and reasoning and executive functions, respectively. Normal controls showed no impairments on any of the neuropsychological tests. Scores on a subset of the language and nonlanguage neuropsychological screening tests for both groups are shown in Table 1.
Table 1.
Neuropsychological screening data for PPA and control subject groups
| Subject group | Age/gender | Language |
General |
||||||
|---|---|---|---|---|---|---|---|---|---|
| BDAE or WAB (correct) (%) | BNT (60) | Category fluency (animals) | Lexical fluency (FAS) | MMSE (30) | CERAD WLR (10) | TMT-A (s) | JLO (correct) (%) | ||
| PPA | 60/M | 75 | 2 | 4 | n/a | 14 | 10 | 46 | 80 |
| 74/M | 97 | 51 | 8 | 31 | 26 | 10 | 34 | 93 | |
| 73/F | 92 | 33 | 10 | n/a | 20 | 10 | 50 | n/a | |
| 74/M | 90 | 32 | 8 | 29 | 25 | 10 | 71 | 86 | |
| 77/F | 100 | 23 | 3 | 7 | 20 | 10 | 64 | 60 | |
| 61/F | 97 | 12 | 7 | 11 | 17 | 10 | 40 | 93 | |
| 78/F | 100 | 51 | 14 | 22 | 27 | 10 | 37 | 67 | |
| 82/M | 97 | 14 | 4 | 4 | 13 | 7 | 86 | 60 | |
| 72/F | 94 | 49 | 6 | 9 | 23 | n/a | 63 | 83 | |
| χ̄ ± SD | 94 ± 8 | 30 ± 18 | 7 ± 3 | 16 ± 11 | 21 ± 5 | 10 ± 1 | 55 ± 18 | 78 ± 14 | |
| Controlsa | χ̄ ± SD | b | 58 ± 3 | 22 ± 5 | 43 ± 10 | 29 ± 1 | 10 | 35 ± 8 | 96 ± 18 |
χ̄ ± SD, Mean ± SD. Bold scores are >2 SDs from the mean for controls. n/a, Not available at time of scanning; BDAE, Boston Diagnostic Aphasia Examination (auditory comprehension); WAB, Western Aphasia Battery auditory comprehension (scores are underlined); BNT, Boston Naming Test; MMSE, Mini-Mental Status Exam; CERAD WLR, Consortium to Establish a Registry for Alzheimer's Disease Word List Recognition; TMT-A, Trailmaking Test A; JLO, Judgment of Line Orientation; M, male; F, female.
aData available from six of eight control subjects.
bData not available.
Behavioral task.
All participants performed a semantic judgment task while undergoing fMRI. During the active condition of the task (SYN), subjects were presented visually with pairs of words and were asked to make a right-handed push-button response to pairs that were synonyms (i.e., had a very similar meaning but dissimilar orthography and phonology) (Fig. 1). The words presented in the task were obtained from the MRC Psycholinguistic Database (Besner and Coltheart, 1979) and were controlled for length (4–7 characters) and a Kucera–Francis frequency of 10–500 (Kucera and Francis, 1967). The average ratings for Kucera–Francis frequency, familiarity, concreteness, and imageability were 95 ± 33.5, 553 ± 8.5, 393 ± 25.3, and 451 ± 21.2, respectively. Approximately 90% of the words on each list were open-class and 10% were closed-class. Eighty to 92% were nouns or verbs, 30% were adjectives, 15% were adverbs, and 0.8–2% of the word stimuli were prepositions, conjunctions, or pronouns. Percentages added to >100%, because 92% of the words could be classified into multiple parts of speech. Nouns could be concrete or abstract and were drawn from several semantic categories. Less than 20% of the words had irregular spellings. For the control condition (LETTER), subjects were presented with pairs of all-consonant letter strings of the same average length as the words in the active condition and were asked to respond if the letter strings were identical.
Figure 1.

Task paradigm. Subjects were instructed to respond to matching stimuli (arrows) but not to nonmatching stimuli (crosses) for the SYN (semantic task) and LETTER (visual task) conditions.
Reaction times were recorded for all responses. Overall task accuracy was determined from the percentage of correct behaviors [i.e., (number of hits + number of correct rejections)/(number of total stimuli)]. To ensure that findings were not attributable to group differences in response bias, we used c (criterion location), which is the basic bias measure for detection theory (Macmillan and Creelman, 1991). Response bias (c), was calculated using the equation c = −0.5 × [z(H) + z(FA)[, where z(H) represents the mean of the target distribution (H, number of hits) and z(FA), the foil distribution (FA, number of false alarms). Negative c values represented a preference for “yes” responses and greater false alarm rate, whereas positive values represent the tendency toward “no” responses and greater miss rate. Bias measures were compared between the two groups for both conditions separately and together to assess for systematic differences between groups.
The tasks followed a long-trial, event-related design. Each trial lasted ∼5 s (5505 ms) with an intertrial interval of 15.9 s, during which subjects saw a blank screen. The long intertrial interval allowed for the separate assessment of the effects of the individual trial types compared with an implicit baseline, as well as trial-related differences in the BOLD responses. There were five runs of 12 active and 12 control trials each, presented in pseudorandom order. Stimuli were presented and responses were collected using Superlab software (Cedrus, San Pedro, CA) running on a Power Macintosh computer (Apple, Cupertino, CA). The stimuli were projected using an active matrix liquid crystal display projector onto a custom-designed nonmagnetic rear-projection screen. Subjects viewed the screen via a nonmagnetic mirror.
Subjects went through an initial training period on an abbreviated version of the task while outside the scanner. Ultimate inclusion of subjects in the group analysis was dependent on relatively intact language comprehension based on neurological and neuropsychological evaluation and above-chance performance (≥58% accuracy; 35 of 60 correct) on each of the tasks during the actual experimental session. These criteria were met by all subjects (Fig. 2).
Figure 2.

Task performance results. Reaction times (in milliseconds) (a) and percentage accuracy (b) for the PPA patients and control subjects for the SYN (semantic task) and LETTER (visual task) conditions, with significant differences (p < 0.05) between the two groups indicated by an asterisk. Error bars indicate SEM.
Functional MR imaging.
Subjects were imaged using a 1.5 tesla Siemens (Erlangen, Germany) Vision scanner. Subjects' heads were immobilized using a vacuum pillow (VacFix; Bionix, Toledo, OH) (Parrish et al., 1998). Laterality for image processing was indicated using a vitamin E capsule taped to the left temporal region.
Single-shot echo planar images were obtained in 24 slices parallel to the anterior commissure–posterior commissure line: repetition time (TR)/echo time (TE), 2000/40 ms; flip angle, 90°; field of view (FOV), 240 mm; matrix, 64 × 64; slice thickness, 5 mm (Gitelman et al., 1999). At the beginning of each functional run, the MR signal was allowed to stabilize over seven scans, which were excluded from the analysis. A high-resolution, T1-weighted anatomical volume was acquired using a three-dimensional FLASH sequence (TR/TE, 22/5.6 ms; flip angle, 25°; FOV, 256 mm; matrix, 256 × 256; slice thickness, 1 mm). A saturation band was located inferior to the imaging volume to null the signal from the arteries and reduce the pulsation artifacts in the temporal lobes. The final voxel size was 1 mm3.
Functional MR data analysis.
fMRI data were analyzed on Linux workstations under the Matlab software environment (Mathworks, Sherborn, MA) using SPM2 for basic image processing and activation analysis and SPM5 for VBM and DCM analyses (Wellcome Department of Cognitive Neurology, London, UK; http://www.fil.ion.ucl.ac.uk/spm) (Friston et al., 1995a,b, 1996, 2003; Worsley et al., 1996; Penny et al., 2004). All functional images were time acquisition-corrected to the slice obtained at 50% of the TR. The images were realigned to the functional scan immediately preceding the anatomical T1 image. All images (anatomic and functional) were normalized to the Montreal Neurological Institute (MNI-305) template, which approximates the anatomical space delineated by Talairach and Tournoux (1988). Functional images were then smoothed with a 10 mm full width at half-maximum isotropic Gaussian kernel for inclusion in the group analyses.
Condition-specific effects at each voxel were estimated using the general linear model (Friston et al., 1995a). Analyses were performed at the individual subject level to examine the main effects of words and letters, respectively, as well as contrasts between these conditions. Events were treated as 5 s miniblocks to isolate the entire peak of activation in both groups, because the behavioral responses in the PPA group were typically slower than those of control subjects. The use of the miniblock allowed us to account for any differences in the timing of the hemodynamic response that might influence the fMRI signal amplitude or effective connectivity results. Contrast images for the parameter effects were entered into second-level random effects analyses to test for within-group (one-sample t tests) and between-group (one-way ANOVA, with post hoc comparisons) effects. Comparisons were also performed with small volume correction to examine PPA-related increases in activation in a left ventral premotor cortex region of interest (xyz = −54 3 15) based on a previous study of PPA by our group, in which subjects performed a similar semantic judgment task (Sonty et al., 2003). Significance was assigned to the resulting t fields using random field theory (Friston et al., 1995a; Worsley et al., 1996). The random effects SPM(t)s were initially thresholded at p < 0.001, uncorrected, for the purposes of display and exploration. However, all reported activations in tables and text were significant at p < 0.05 after correction for multiple comparisons.
Dynamic causal modeling.
The language network anatomical model consisted of six left hemisphere regions activated by both subject groups (controls and PPAs) for either the main effect of the SYN condition or for the SYN–LETTER contrast (Table 2, Fig. 3). These regions were as follows: left posterior fusiform gyrus (FUS) ]Brodmann's area (BA) 19/37]; posterior superior temporal sulcus (sTS) (BA 22; the classical Wernicke's area); inferior parietal lobule (iPL) (BA 39/40); intraparietal sulcus (iPS) (BA 7); ventral premotor cortex (PRE) (BA 44/6); and inferior frontal gyrus (iFG) (BA 45, anterior Broca's area). The model included ventral and dorsal input regions (FUS and iPS), and areas representative of both the posterior (sTS and iPL) and anterior (iFG and PRE) perisylvian language cortex. These regions had also shown significant activations in our previous PPA study (Sonty et al., 2003). Anterior lateral temporal cortex sites were not included in the model because the PPA group did not show significant activations in these areas, despite showing no differences from controls in these regions. Only left hemisphere regions were included in the network to maintain model simplicity, and because of limitations in the number of regions that can be modeled in the DCM software and memory constraints in Matlab. Left visual extrastriate cortex was also excluded, because it was assumed to respond to task stimuli in a nonspecific manner.
Table 2.
Coordinates for task-specific left hemisphere cortical activations in each subject group
| Control (n = 9) |
PPA (n = 9) |
|||||||
|---|---|---|---|---|---|---|---|---|
| SYN | LETTER | SYN > LETTER | LETTER > SYN | SYN | LETTER | SYN > LETTER | LETTER > SYN | |
| VIS | −27 −84 −9 (6.21) | −27 −84 −9 (6.49) | −36 −78 −18 (5.25) | −36 −78 −18 (6.12) | ||||
| FUS | −45 −54 −18 (7.35) | −36 −51 −24 (7.77) | −36 −51 −24 (6.63) | −36 −51 −21 (6.72) | ||||
| sTS | −51 −45 0 (4.06) | −60 −42 15 (3.87) | −63 −45 15 (4.58) | |||||
| aTL | −57 12 −3 (5.06) | −57 −9 21 (3.87) | ||||||
| iPL | −54 −60 24(4.14) | −45 −66 36 (4.23) | ||||||
| iPS | −33 −48 54(4.67) | −42 −36 45 (5.94) | −60 −27 33 (4.03) | −33 −51 45 (4.06) | −42 −36 48 (6.17) | |||
| sPL | −36 −42 57 (4.80) | |||||||
| PRE | −48 3 18 (4.89) | −54 3 33 (5.44) | −21 0 48 (4.34) | −45 3 39 (5.58) | −45 3 36 (5.66) | |||
| iFG | −45 42 −18 (5.82) | −51 42 −3 (3.44) | −57 18 −3 (6.06) | −57 15 −3 (5.18) | −42 36 −12 (6.39) | |||
SYN, Synonym word matching task; LETTER, letter matching task; VIS, extrastriate visual cortex; FUS, posterior fusiform gyrus; sTS, posterior superior temporal sulcus; aTL, anterior temporal lobe; iPL, inferior parietal lobule; iPS, intraparietal sulcus; sPL, superior parietal lobule; PRE, ventral premotor cortex; iFG, inferior frontal gyrus. Coordinates in bold are the control group maxima for the regions selected for DCM. Data selection was individualized for both PPA and control subjects to be within 15 mm of these maxima.
Figure 3.

fMRI results. Brain activations for control subjects and PPA patients specific for the semantic task (SYN–LETTERS contrast). Both groups showed similar left-lateralized patterns of activation in inferior frontal gyrus, temporoparietal cortex, and anterior cingulate/supplementary motor cortex (not pictured). Also shown is brain activation for PPA > controls for the SYN–LETTERS contrast in left premotor cortex. Activations shown are significant at p > 0.05, corrected.
Using SPM2, BOLD signal time courses were then extracted from 5 mm spheres centered on subject-specific maxima located within 15 mm of the control group maxima for each area in the network model (Fig. 4). Subjects who did not demonstrate activation in all of these regions at p < 0.001, uncorrected, were excluded from DCM analysis (one control subject; one PPA patient).
Figure 4.
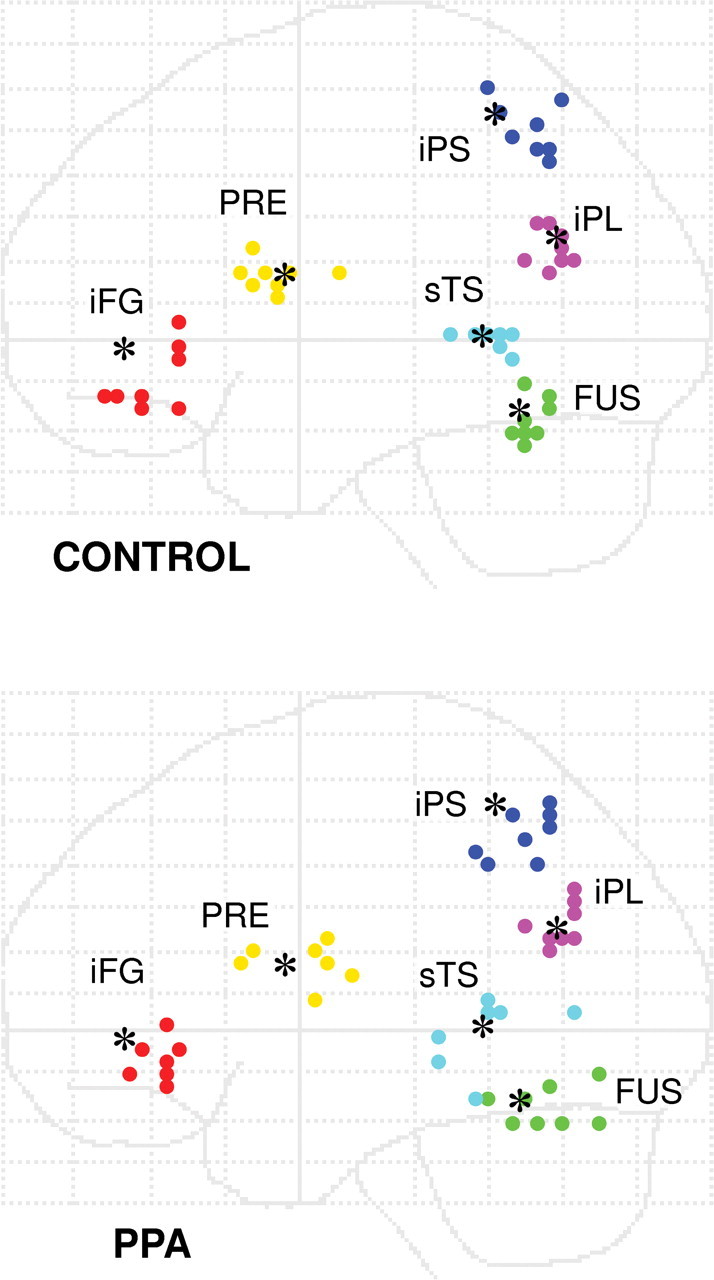
Subject-specific network regions of interest. Left hemisphere regions were selected based on suprathreshold activation for the main effect of SYN and/or the SYN > LETTER contrast. Consensus maxima were obtained for the group of control subjects (black dots), and individually obtained from each subject within 15 mm of the consensus maximum. Note: Adjoining dots for fusiform and superior temporal foci are separated by 20 mm in the x direction.
Using the above regions of interest, individualized dynamic causal models were assembled, with identical connectivity within subjects (Fig. 5). In all subjects' models, stimulus onsets for words and letters were entered as driving inputs to FUS and iPS regions in the ventral and dorsal visual processing streams, respectively (Seltzer and Pandya, 1980; Van Essen et al., 1992; Nobre et al., 1994).
Figure 5.
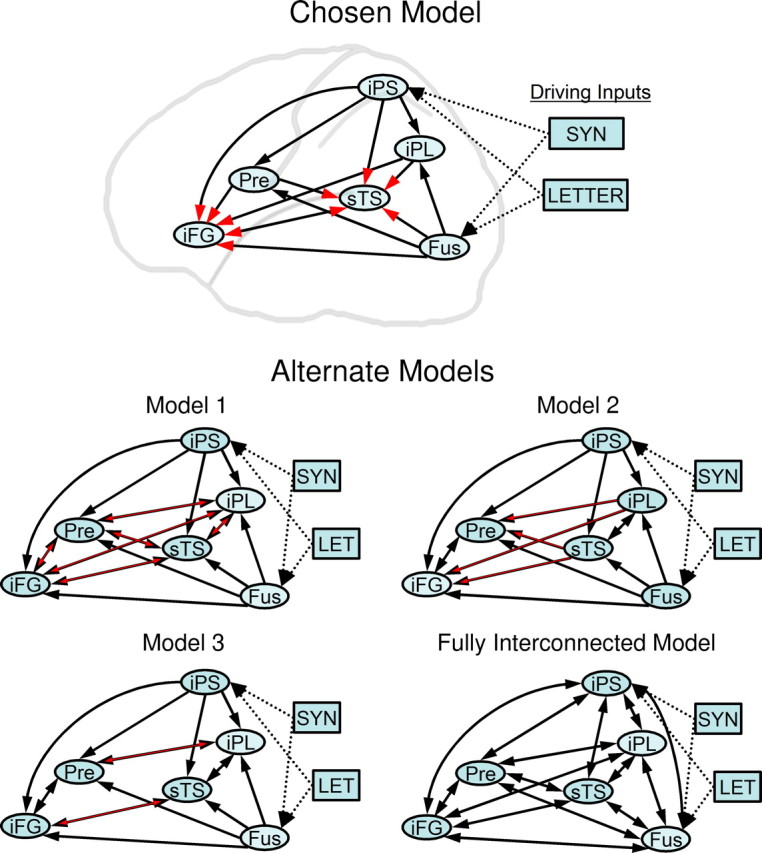
Model network of interregional connections and experimental inputs. Chosen and alternate network models for DCM model comparison are shown. Regions were connected with stimulus inputs entering fusiform (FUS) and parietal (iPS) visual processing streams. Models assumed unidirectional inputs from FUS and iPS to all other regions. The red arrows and arrowheads highlight defining organizational features for each network model: Chosen Model, Inputs from all other regions converge onto sTS and iFG; Alternate Model 1, all other regions are bidirectionally connected; Alternate Model 2, posterior regions (iPL, sTS) send unidirectional input to anterior regions (PRE, iFG); and Alternate Model 3, regions are connected in separate streams between iPL and PRE, and between sTS and iFG. Alternate Model 4 is a fully interconnected network. Task-specific modulatory effects were assessed at every interregional connection for the chosen model. SYN, Semantic task input; LET, visual task input.
For the primary network model, information was assumed to travel in a forward direction from FUS and iPS (i.e., the input regions, to all other areas of the language network model). The sTS and iFG regions (nominally, Wernicke's and Broca's areas, respectively) represented the two bidirectionally connected convergence zones or epicenters of the language network (Mesulam, 1990), and received additional unidirectional inputs from iPL and PRE.
This primary DCM model was compared with four alternate network models using the control group data and DCM model comparison procedures, to arrive at the “best” network model (Penny et al., 2004). The best model was then compared within and between subject groups. All models had the same six nodes, as required by Bayesian model selection, but differing internal connectivity (Fig. 5). DCM model comparison uses the combination of Bayesian information criteria (BIC) and the Akaike's information criteria (AIC) to compute Bayes factors, or ratios of model evidences. BIC tends to favor simpler models, albeit with some loss of model fit or accuracy. AIC is biased toward more accurate but complex models. The conjoint use of the two criteria (specifically the minimum criterion) is, therefore, a conservative test that avoids the biases inherent in the two component criteria.
Although effective connectivity as inferred by DCM does not necessarily result from explicit monosynaptic anatomical connectivity (i.e., interregional influences could be theoretically mediated by polysynaptic connections or by intervening regions present or not present in a given network model), the models for the current study “connected” the six chosen regions in multiple ways in accordance with human anatomy, as based on the anatomical tracer literature in primates (Jacobson and Trojanowski, 1977; Mesulam et al., 1977; Seltzer and Pandya, 1984, 1989, 1994; Webster et al., 1994; Pandya and Yeterian, 1996; Petrides and Pandya, 1999), diffusion tensor imaging studies in humans (Catani et al., 2002, 2004), and the functional and effective connectivity literature studying language (Mechelli et al., 2002; Horwitz and Braun, 2004; Bitan et al., 2005). The defining features of each model are highlighted by red arrowheads (primary model) or red arrows (alternate models) (Fig. 5). Like the primary model, alternate models 1, 2, and 3 all assumed FUS and iPS provided unidirectional, forward inputs to all other regions of the network. Unlike the primary model, the alternate models included bidirectional connections between the anterior regions PRE and iFG, and the posterior regions sTS and iPL. Alternate model 1 included bidirectional connections between all other regions (iFG, iPL, PRE, and sTS). Alternate model 2 specified forward connections from iPL and sTS to both PRE and iFG, whereas alternate model 3 segregated bidirectional connections from iPL and sTS to PRE and iFG, respectively, reflecting arcuate and uncinate temporal-to-frontal language-related pathways, respectively (Catani et al., 2004). Alternate model 4 was a fully interconnected network. The models, five in all, were created for the individual control subjects, averaged using Bayesian model averaging and compared with one another using Bayesian model comparison as outlined above (Penny et al., 2004; Ethofer et al., 2006). Among the five models tested, the most parsimonious and most accurate model was ultimately chosen to examine for alterations in the language network associated with PPA.
DCM connection parameters (“connection strengths”) were obtained for the following effects for each subject: (1) driving connections: the direct influence of the separate effects of SYN and LETTER stimuli on FUS and iPS regional activity; (2) regional connections: task-independent influences between regions in the anatomical network; and (3) modulatory (bilinear) connections, which represent the interaction between stimulus input and interregional connections. Although the task used in this study did not have a factorial design, the use of bilinear modulations allowed for the assessment of selective second-order effects attributable to the task-specific responses of other network regions providing input to the individual network regions. The task-specific influences between sTS and iFG were hypothesized to show alterations related to PPA, in accordance with the recent findings of axonal injury within the white matter tracts connecting these two regions (Catani et al., 2003). However, regional connection strengths and the differential modulatory effects of the tasks at all network connections (i.e., the difference between the individual task modulatory parameters at individual connections) were entered into second-level, two-sample t tests by group to identify connections across the whole network that were significantly different between the two subject groups. The null hypothesis of no difference in connection strength between PPA and control groups was rejected at a significance level of p < 0.05 after Bonferroni's correction for the number of connections. Connection parameters for connections showing significant differences between PPA and control groups were regressed against task accuracy to assess whether connection strength during the SYN task was predictive of SYN task performance.
Voxel-based morphometry.
Structural (T1) images for voxel-based morphometry were processed using the VBM toolbox by Christian Gaser (http://dbm.neuro.uni-jena.de/vbm) (Draganski et al., 2004, 2006; Cuadra et al., 2005) as part of the SPM environment. The Matlab scripts implement the processing stream of Good et al. (2001). The VBM toolbox additionally includes a Hidden Markov Random Field Model in the procedure to improve the segmentation of gray matter and other tissue classes (Cuadra et al., 2005). Images were also initially skull-stripped using the Brain Extraction Toolbox (BET2) software (Smith, 2002; Jenkinson et al., 2005). After segmentation, images were modulated by multiplying the voxel values by the Jacobian determinants of the deformation fields that were defined during normalization. This step has the effect of preserving the amount of original gray matter before normalization (Ashburner and Friston, 2000). Segmented gray matter images were smoothed with a 12 mm Gaussian smoothing kernel, and analyzed at each voxel for changes in gray matter density in PPA patients relative to the controls. A confound for total intracranial volume was included in this analysis so that inferences pertain to regionally specific effects and not global measures of atrophy or differences in overall brain size. Significance was assigned to the resulting t fields using the theory of Gaussian random fields (Friston et al., 1995a; Worsley et al., 1996). Significance was based on p < 0.05 corrected for multiple comparisons and false discovery rate. Correlation analyses were performed on gray matter segment images for 5 mm regions of interest based the six individual areas chosen for the DCM networks versus the connection strength for connections found to be significantly different between PPA and control groups to examine the relationship between alterations in connection strength and gray matter atrophy.
Results
Task performance
Reaction times and accuracy for the two groups on all three tasks are shown in Figure 2. Patients with PPA showed significantly increased reaction times when compared with the normal control group for both SYN (PPASYN, 2829 ± 670 ms, vs NLSYN, 1905 ± 433 ms; p = 0.002) and LETTER (PPALETTER, 3496 ± 559 ms, vs NLLETTER, 2873 ± 305 ms; p = 0.006) conditions. Accuracy was also lower for PPAs for the SYN condition (PPASYN, 0.81 ± 0.1, vs NLSYN, 0.94 ± 0.05; p = 0.001). However, scores were significantly greater than chance in all patients. PPA patients and controls performed with comparable accuracy on the LETTER condition (PPALETTER, 0.93 ± 0.06, vs NLLETTER, 0.96 ± 0.03; p = 0.06).
Response bias (c) was not significantly different between groups for the SYN condition (cNL, −0.05 ± 0.38, vs cPPA, −0.28 ± 0.56; p = 0.35), the LETTER condition (cNL, 0.02 ± 0.17, vs cPPA, 0.03 ± 0.19; p = 0.87), or for the two conditions together [i.e., the main effect of responding (p = 0.52)].
fMRI results (Table 2)
Main effects of condition
Left hemisphere activations for the main effects and interactions of each condition are summarized in Table 2. On intergroup comparison, the subject groups showed no significant differences from each other for SYN, although controls showed significantly greater activation in midline visual cortex for the LETTER condition (xyz = −6 −84 33; Z = 4.15).
Interaction of group and task (Fig. 3)
For the SYN > LETTER comparison, both groups show activation in left inferior frontal gyrus (BA 45; anterior portion of Broca's area), left temporoparietal lobe (extended Wernicke's area), and anterior cingulate cortex, bordering on supplementary motor area (not pictured). The control subjects showed no areas of significantly increased activation relative to the PPA patient group on this contrast. Using a small volume correction analysis (sphere with 10 mm radius) based on the coordinates of the left premotor activation seen in PPAs in Sonty et al. (2003) (xyz = [−54 3 15]), PPA patients show increased activation relative to controls (xyz = −60 0 9; Z = 4.09; p = 0.009). A summary of additional right hemispheric and subcortical fMRI activations and comparisons for the individual subject groups can be found in Table 3.
Table 3.
Coordinates for task-specific right hemisphere and subcortical activations in each subject group
| Control (n = 9) |
PPA (n = 9) |
|||||||
|---|---|---|---|---|---|---|---|---|
| SYN | LETTER | SYN > LETTER | LETTER > SYN | SYN | LETTER | SYN > LETTER | LETTER > SYN | |
| RVIS | 24 −93 −3 (6.95) | 24 −93 −3 (6.86) | 21 −93 0 (5.75) | 21 −93 0 (6.05) | ||||
| RFUS | 42 −75 −6 (6.52) | 27 −48 −27 (6.14) | ||||||
| RiPL | 60 −36 18 (4.84) | |||||||
| RiPS | 33 −54 48 (4.37) | 36 −39 39 (6.89) | 36 −39 39 (6.31) | 33 −51 42 (4.0.58) | 33 −51 45 (6.69) | 45 −39 48 (5.55) | ||
| RsPL | 24 −57 60 (6.10) | 21 −66 54 (7.14) | ||||||
| vRPRE | 48 9 21 (6.20) | 48 9 21 (4.60) | 48 9 30 (6.37) | 42 9 21 (4.00) | ||||
| dRPRE | 33 3 54 (5.61) | 39 3 51 (5.38) | 39 3 51 (6.78) | 30 6 45 (5.31) | ||||
| RiFG/mFG | 60 18 9 (4.86) | 33 39 12 (5.85) | 57 15 6 (6.08) | 45 42 12 (6.54) | 33 36 21 (4.10) | |||
| RsFG | 42 6 48 (6.20) | |||||||
| RINS | 51 18 −9 (5.67) | 36 24 −9 (6.10) | ||||||
| −15 −15 −6 | ||||||||
| LThal | −15 6 3 (5.22) | −27 −12 3 (5.63) | −15 6 3 (5.91) | (4.78) | ||||
| RThal | 15 3 9 (4.94) | 21 −9 12 (5.36) | 15 6 0 (4.81) | |||||
| 21 −51 −24 | ||||||||
| Cereb | −3 −72 −31 (5.37) | (5.87) | 3 −72 −31 (6.53) | |||||
| aCG/SMA | 3 27 45 (5.75) | 6 15 36 (5.87) | 0 45 39 (5.41) | 9 15 42 (6.42) | 9 12 42 (6.91) | −9 24 48 (4.82) | ||
SYN, Synonym word matching task; LETTER, letter matching task; VIS, extrastriate visual cortex; FUS, posterior fusiform gyrus; iPL, inferior parietal lobule; iPS, intraparietal sulcus; sPL, superior parietal lobule; PRE, ventral premotor cortex; iFG, inferior frontal gyrus; mFG, middle frontal gyrus; sFG, superior frontal gyrus; ins, insula; Thal, thalamus; Cereb, cerebellum; aCG/SMA, anterior cingulate gyrus/supplementary motor area. R, Right; L, left; v, ventral; d, dorsal.
DCM results
DCM model comparison (Table 4)
Table 4.
DCM model comparison: Bayes factors comparing model connectivity
| Chosen model vs model 1 | Chosen model vs model 2 | Chosen model vs model 3 | Chosen model vs full model | |
|---|---|---|---|---|
| AIC | 7.02 × 10²⁰ | 4.39 × 10⁷ | 448.72 | 683.22 |
| BIC | 1.56 × 1073 | 9.52 × 1026 | 1.25 × 10⁹ | 1.91 × 10⁹ |
AIC, Akaike's information criteria; BIC, Bayesian information criteria. Both provide very strong evidence in favor of the chosen model. The minimum Bayes factor used for ultimate model selection is indicated in boldface. For interpretation of Bayes factors, see Penny et al. (2004).
Table 4 shows the AIC and BIC criteria associated with the model comparisons between each alternate network model and the primary proposed network model in the control group. The Bayes factor is the minimum of these two criteria. In all comparisons, very strong evidence (Bayes factor, ≥150) was found in favor of the primary model on both measures (Penny et al., 2004). Thus, the primary model was both more parsimonious and more accurate than the alternate model, given the data. A similar pattern emerged when DCM model comparisons were performed separately within each individual control subject. Therefore, the model as shown in Figure 5 (top) was used to examine for alterations in the language network associated with PPA.
Regional (task-independent) connectivity
Mean parameters for the regional connectivity, and the effect of the individual tasks on effective connectivity at each connection can be found in Table 5. A direct comparison between groups showed a slight increase in regional (task-independent) connectivity in controls for the connection from FUS to sTS (p = 0.037, uncorrected).
Table 5.
Averaged strengths for individual connections in controls and PPAs
| FUS | sTS | iPL | iPS | PRE | iFG | |
|---|---|---|---|---|---|---|
| Regional connections (A matrix): control subjects | ||||||
| FUS | ||||||
| sTS | 0.1505 | 0.0095 | 0.0208 | 0.0345 | 0.0745 | |
| iPL | −0.0812 | −0.1191 | ||||
| iPS | ||||||
| PRE | 0.1395 | 0.0408 | ||||
| iFG | 0.1397 | 0.0948 | 0.1004 | −0.0916 | 0.0372 | |
| Regional connections (A matrix): PPA subjects | ||||||
| FUS | ||||||
| sTS | 0.0306 | −0.0178 | −0.0116 | 0.0636 | 0.0744 | |
| iPL | −0.0165 | −0.1139 | ||||
| iPS | ||||||
| PRE | 0.1660 | 0.0517 | ||||
| iFG | 0.1339 | 0.0647 | 0.0742 | −0.0835 | 0.0859 | |
| Modulatory effect of SYN (B matrix): control subjects | ||||||
| FUS | ||||||
| sTS | 0.1381 | −0.0033 | 0.0698 | 0.0114 | 0.0179 | |
| iPL | 0.1383 | 0.0637 | ||||
| iPS | ||||||
| PRE | 0.1328 | 0.0426 | ||||
| iFG | 0.2430 | 0.0339 | −0.0076 | 0.1211 | 0.0353 | |
| Modulatory effect of LETTER (B matrix): control subjects | ||||||
| FUS | ||||||
| sTS | −0.0785 | 0.0138 | −0.0654 | −0.0053 | 0.0041 | |
| iPL | −0.1591 | −0.1204 | ||||
| iPS | ||||||
| PRE | −0.0130 | 0.0155 | ||||
| iFG | −0.1503 | −0.0100 | 0.0310 | −0.1075 | −0.0165 | |
| Modulatory effect of SYN (B matrix): PPA patients | ||||||
| FUS | ||||||
| sTS | 0.0494 | −0.0002 | 0.0139 | 0.0055 | 0.0021 | |
| iPL | 0.0588 | 0.0183 | ||||
| iPS | ||||||
| PRE | 0.1495 | 0.0471 | ||||
| iFG | 0.2159 | 0.0165 | −0.0119 | 0.0801 | 0.0471 | |
| Modulatory effect of LETTER (B matrix): PPA patients | ||||||
| FUS | ||||||
| sTS | −0.0704 | 0.0117 | −0.0574 | −0.0115 | 0.0026 | |
| iPL | −0.1355 | −0.0919 | ||||
| iPS | ||||||
| PRE | −0.0566 | −0.0147 | ||||
| iFG | −0.1219 | 0.0019 | 0.0169 | −0.0811 | −0.0167 | |
Bold indicates significance at p < 0.05, corrected. Italics indicates significance at p < 0.05, uncorrected.
Modulation of effective connectivity by task (Fig. 6)
Figure 6.
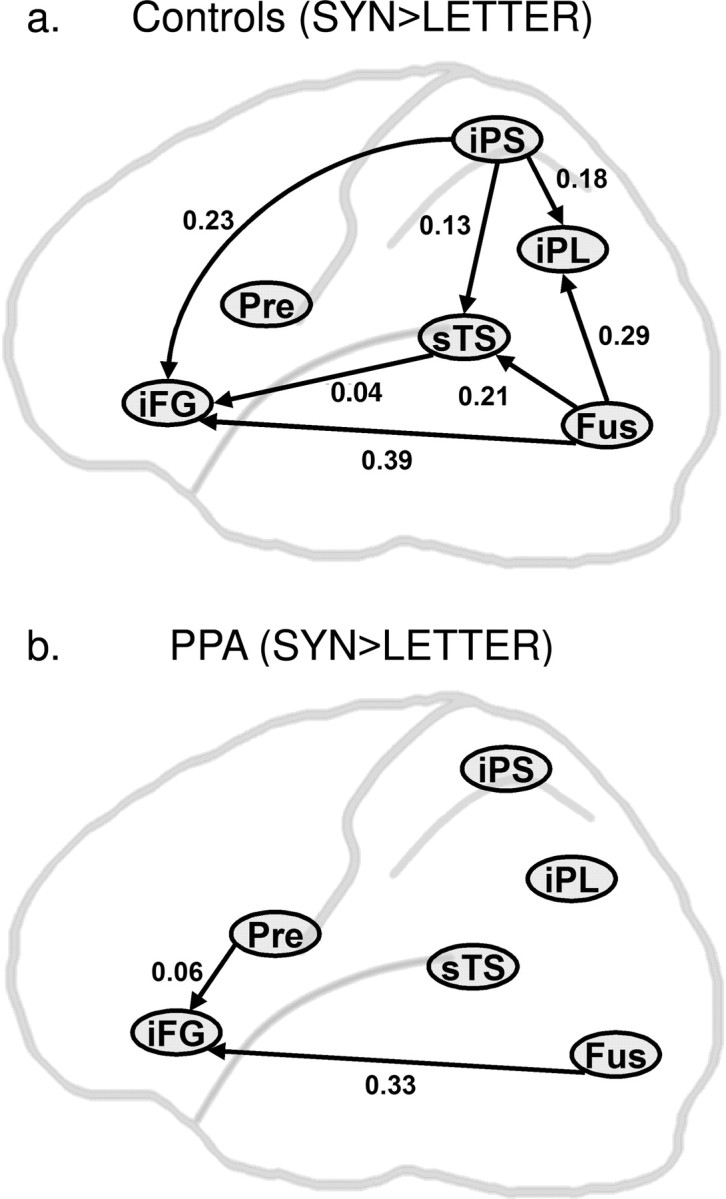
Connections with significant task-specific modulation in controls (a) and PPA patients (b) (p < 0.05, corrected). Numerical values represent a subtraction between the SYN and LETTER modulatory effects at each connection.
The effects of SYN versus LETTER conditions on effective connectivity were directly compared within each group in paired t tests to assess for the task specificity of individual connections. Control subjects showed significant SYN > LETTER modulation of the forward connections from FUS and iPS to sTS, iPL and iFG, and from sTS to iFG at p < 0.05, corrected. PPA patients, in contrast, showed significant SYN > LETTER modulation only of the forward influence from FUS to iFG (p = 0.001), and PRE to iFG (p = 0.002). Values for the contrast between SYN and LETTER effects for each of these connections are reported in Figure 6.
Interaction of group and task (Fig. 7)
Figure 7.

Significant reduction in task-specific modulation in PPA patients seen for the forward connection from posterior superior temporal sulcus (in the classical Wernicke's area) to inferior frontal gyrus (in the classical Broca's area); p < 0.05, corrected on two-sample t test comparisons. The value shown is the p value for the between-group comparison.
When the subject groups were compared on the SYN–LETTER contrast, controls showed specifically greater modulation of the sTS to iFG connection than the PPA group (p = 0.001) (Fig. 7). PPA patients showed no connections with greater SYN–LETTER modulation than controls.
The regression analysis showed that the sTS to iFG modulatory connection strength during the SYN but not the LETTER task was directly related to performance in the PPA group r2 = 0.63, p = 0.019 (Spearman's r = 0.61) (Fig. 8), but not in controls (r2 = 0.04; Spearman's r = −0.41), all of whom performed at near ceiling levels of accuracy. No other connection strengths during the SYN task were found to show a significant relationship to SYN task accuracy in either group.
Figure 8.

Semantic task accuracy as a function of the modulation of the forward connection from Wernicke's area (posterior sTS) to Broca's area (iFG) by semantic task context in PPA patients (dots) (a) and control subjects (diamonds) (b). r2, Regression coefficient (significant at p < 0.05). No other connections were significant predictors of semantic task accuracy in either group.
VBM results
Gray matter density in the PPA group was reduced across a large swathe that included temporoparietal cortex, anterior temporal lobe, and insula, at p < 0.05, corrected, using the false discovery rate. However, none of the changes was significant when assessed using p values based on more traditional and conservative family-wise error calculations. Gray matter density values from each of the six regions in the DCM network did not show any significant relationship to the magnitude of sTS to iFG connection during the SYN task.
Discussion
The current study is the first to quantitatively examine effective connectivity of a model language network in PPA patients and controls by using functional magnetic resonance imaging and dynamic causal modeling (Mesulam, 1982, 2001; Mesulam and Weintraub, 1992). Previous functional neuroimaging in PPA patients with intact comprehension revealed relatively preserved activation in classical language regions, despite longer reaction times and reduced accuracy in the performance of phonological and semantic judgment tasks (Sonty et al., 2003). The current study extends this work by demonstrating that changes in language network connectivity, rather than isolated regional hypoactivity, may underlie the deficits in patients with PPA.
Task behavior
PPA patients were slower and less accurate than control subjects on the semantic task used in this study, but, despite some slowing of reaction time, maintained comparable accuracy for the visual letter judgment task, reflecting the relative behavioral focality of this disorder, where deficits are stronger when stimuli are words rather than letter strings with no natural phonological segmentation or meaning (Fig. 2). Analyses of response bias, based on group hit and false alarm rates, further assured that PPA-related behavioral decrements were not attributable to systematic differences in response bias between the groups.
fMRI results
When letter strings activations were subtracted from semantic task activations (Fig. 3), both groups showed similar left-lateralized patterns of activation in inferior frontal gyrus, temporoparietal cortex, and anterior cingulate/supplementary motor cortex, regions involved in visual word form recognition, orthographic analysis, retrieval of word phonology and meaning, and internally guided covert articulation (Démonet et al., 1992; Petersen and Fiez, 1993; Kapur et al., 1994; Desmond et al., 1995; Fiez, 1997; Fiez and Raichle, 1997; Wagner et al., 1998; Dapretto and Bookheimer, 1999; Hagoort et al., 1999; Chao and Martin, 2000; Devlin et al., 2003; Bitan et al., 2005). PPA patients showed an increase in activation relative to controls in left ventral premotor cortex, consistent with a previous study of lexicosemantic processing in PPA (Sonty et al., 2003). Ventral premotor activation has been noted in studies of phonological processing (Démonet et al., 1992, 1996; Fiez et al., 1995; Fiez, 1997; Paulesu et al., 1997; Bitan et al., 2005; Gitelman et al., 2005) and verbal working memory (Paulesu et al., 1993), consistent with its role in an articulatory rehearsal system maintaining phonology on-line (Baddeley, 1994; Fiez and Petersen, 1998). Recruitment of this region has been demonstrated in neuroimaging studies of semantic dementia and dyslexia (Brunswick et al., 1999; Mummery et al., 1999), suggesting subarticulatory phonological rehearsal in the face of language system disruption.
DCM results
A number of reports of language dysfunction caused by acute (Price et al., 2001), chronic (Paulesu et al., 1996; Price et al., 2003), and neurodegenerative lesions (Mummery et al., 1999; Cipolotti and Maguire, 2003) have suggested underlying decrements in language network connectivity. The chief aim of the present study was to examine whether similar alterations in the influences between network regions engaged by the semantic judgment task were associated with the PPA disease process. Based on recent work demonstrating injury in the left superior longitudinal fasciculus (Catani et al., 2003), our hypothesis was that a disruption between the two main nodes of the large-scale network for language (Mesulam, 1998) may underlie some of the deficits seen in PPA.
The regions for the anatomical model were those that were activated by the language task in this study. Only left hemisphere regions were chosen, because the primary cognitive focus was on the language system, as well as for the sake of network simplicity given limitations in the implementation of DCM and in computing capability. The model included the FUS, sTS, iPL, iPS, PRE, and iFG. The iPS and FUS served as sources of visual word form and letter string information to the network. Furthermore, iFG and sTS were considered to provide sites of convergence for inputs from the other network regions. Numerous patient studies and experiments support the notion that the iFG and sTS represent crucial nodes of a distributed language network, and that many key language functions emerge from the interactions of these two areas (Démonet et al., 1992; Petersen and Fiez, 1993; Kapur et al., 1994; Desmond et al., 1995; Martin et al., 1995; Fiez, 1997; Wagner et al., 1998; Dapretto and Bookheimer, 1999; Hagoort et al., 1999; Price, 2000; Wise et al., 2001; Bookheimer, 2002; Devlin et al., 2003; Bitan et al., 2005). The direct and indirect anatomical pathways interconnecting these two critical nodes have been traced with diffusion tensor imaging in the human brain (Catani et al., 2002, 2004).
Using established model comparison procedures (Penny et al., 2004; Ethofer et al., 2006), the proposed model was first compared with several plausible alternative models using the signal data from the control group. The results of model comparison provided very strong evidence (Bayes factor, ≥150) that the chosen model was better than alternatives on both simplicity and model fit (Table 4). However, the current study does not suggest that the chosen model is the best among all possible models of the language network. Such models would likely include many additional areas from both hemispheres and hundreds, if not thousands (or millions) of connections. Nevertheless, the Bayesian comparison procedures ensured that the chosen model was a reasonable one for examining PPA-related alterations in connectivity.
Within this model network (Fig. 5), controls showed task-specific modulation in the forward connections from FUS and iPS to iFG, sTS, and iPL, as well as from sTS to iFG. PPA patients showed significant task-specific modulation only in the forward connections from FUS and PRE foci to iFG (Fig. 6). When the two groups were compared directly, the task-specific modulation of iFG by sTS was found to be markedly reduced in PPA, as hypothesized (Fig. 7). Mechanistically, the results suggest an alteration in Broca's area activity attributable to task-specific modulatory or second-order effects on the output it receives (directly or indirectly) from Wernicke's area. In essence, a disruption in the communication between two critical nodes of the language network, Broca's and Wernicke's areas, may lead to impaired lexicosemantic processing in PPA.
The importance of the sTS–iFG interregional communication for language function is supported by the presence of a significant correlation between the strength of this influence and behavioral performance in PPA patients (Fig. 8). The persistence of activation in iFG despite altered connectivity from sTS may reflect the relative preservation of inputs to iFG from other regions in the network (Catani et al., 2004), in a manner similar to that proposed by Price et al. (2003) for acquired dyslexia. Furthermore, iFG may receive compensatory input from premotor cortex in the PPA patients, implied by the slight increase in activation and connectivity from PRE to iFG in the PPA group. VBM correlation analyses found no relationship between atrophy and the strength of the sTS–iFG interaction in the PPA group. Therefore, the decrease in effective connectivity in PPA is not explicable by gray matter atrophy alone.
Interpretations of studies using dynamic causal modeling only pertain to those regions and connections that are specified in the chosen model. Additional regions may influence the language network during the processing of words, especially in anterior and ventral temporal lobe. The regions in this study were restricted to those showing fMRI activations across both groups of subjects. Although the omission of ventral and anterior temporal regions does not invalidate or bias the results reported in this study, the possibility remains that the alterations in connectivity reported here are mediated by polysynaptic connections or by regions not explicitly included in the chosen model. Future studies using tasks highlighting additional activation sites would allow the inclusion of other regions in the DCM analysis and may provide additional insight into the network dynamics of the language system.
In summary, PPA patients showed impaired performance on a lexicosemantic judgment task with words, compared with a visual matching task with letter strings. This behavioral impairment occurred despite apparently “normal” levels of activation in language regions, including Broca's and Wernicke's areas. An analysis of the effective connectivity within the language network revealed a reduction in the task-specific modulation of the forward connection from Wernicke's area to Broca's area in the PPA patients. This reduction was a predictive factor for impaired task accuracy in PPA, and may indicate a deficit in the interactions between the two major nodes of the language network. This deficit may reflect underlying anatomical changes in left perisylvian white matter, or altered synaptic dynamics within components of the language network known to be affected by the underlying neurodegenerative process. These findings provide an anatomical template for exploring how sTS–iFG interactions influence specific language functions in health and disease. The identification of potential “improvements” in connectivity between sTS and iFG in response to cognitive–behavioral therapies, transcranial magnetic stimulation, or pharmacological intervention may also allow an objective assessment of treatment modalities in patients with aphasic disorders.
Footnotes
This work was supported by the Northwestern Memorial Foundation (D.R.G.), the Illinois Department of Public Health Alzheimer's Disease Research Fund Early Researcher Award (D.R.G. and S.P.S.), and the National Institutes of Health [Mechanisms of Aging and Dementia Training Grant T32 A620506 (S.P.S.) and National Institute on Aging Grant P30 AG013854]. We thank Dr. Anna Christina Nobre and Dr. Cynthia Thompson for their insightful discussions and suggestions for this study. We also thank Lauren Hancock and Kensen Lam for their assistance in subject recruitment and data collection.
References
- Abe K, Ukita H, Yanagihara T. Imaging in primary progressive aphasia. Neuroradiology. 1997;39:556–559. doi: 10.1007/s002340050466. [DOI] [PubMed] [Google Scholar]
- Ashburner J, Friston KJ. Voxel-based morphometry—the methods. NeuroImage. 2000;11:805–821. doi: 10.1006/nimg.2000.0582. [DOI] [PubMed] [Google Scholar]
- Baddeley A. Working memory: the interface between memory and cognition. In: Schacter DL, Tulving E, editors. Memory systems 1994. Cambridge, MA: MIT; 1994. pp. 351–367. [Google Scholar]
- Benton A, Harnsher KdS, Varney N, Speen O. Contributions to neuropsychological assessment. New York: Oxford UP; 1998. [Google Scholar]
- Benton AL, Hamsher Kd, Varney NR, Spreen O. Contributions to neuropsychological assessment. New York: Oxford UP; 1983. [Google Scholar]
- Besner D, Coltheart M. Ideographic and alphabetic processing in skilled reading of English. Neuropsychologia. 1979;17:467–472. doi: 10.1016/0028-3932(79)90053-8. [DOI] [PubMed] [Google Scholar]
- Bitan T, Booth JR, Choy J, Burman DR, Gitelman DR, Mesulam M-M. Shifts in effective connectivity within a language network during rhyming and spelling. J Neurosci. 2005;25:5397–5403. doi: 10.1523/JNEUROSCI.0864-05.2005. [DOI] [PMC free article] [PubMed] [Google Scholar]
- Bookheimer SY. Functional MRI of language: new approaches to understanding the organization of semantic processing. Annu Rev Neurosci. 2002;25:151–188. doi: 10.1146/annurev.neuro.25.112701.142946. [DOI] [PubMed] [Google Scholar]
- Brunswick N, McCrory E, Price CJ, Frith CD, Frith U. Explicit and implicit processing of words and pseudowords by adult developmental dyslexics: a search for Wernicke's Wortschatz? Brain. 1999;122:1901–1917. doi: 10.1093/brain/122.10.1901. [DOI] [PubMed] [Google Scholar]
- Catani M, Howard RJ, Pajevic S, Jones DK. Virtual in vivo interactive dissection of white matter fasciculi in the human brain. NeuroImage. 2002;17:77–94. doi: 10.1006/nimg.2002.1136. [DOI] [PubMed] [Google Scholar]
- Catani M, Piccirilli M, Cherubini A, Tarducci R, Sciarma T, Gobbi G, Pelliccioli G, Petrillo SM, Senin U, Mecocci P. Axonal injury within language network in primary progressive aphasia. Ann Neurol. 2003;53:242–247. doi: 10.1002/ana.10445. [DOI] [PubMed] [Google Scholar]
- Catani M, Jones DK, ffytche DH. Perisylvian language networks of the human brain. Ann Neurol. 2004;57:8–16. doi: 10.1002/ana.20319. [DOI] [PubMed] [Google Scholar]
- Chao LL, Martin A. Representation of manipulable man-made objects in the dorsal stream. NeuroImage. 2000;12:478–484. doi: 10.1006/nimg.2000.0635. [DOI] [PubMed] [Google Scholar]
- Chawluk JB, Mesulam M-M, Hurtig H, Kushner M, Weintraub S, Saykin A, Rubin N, Alavi A, Reivich M. Slowly progressive aphasia without generalized dementia: studies with positron emission tomography. Ann Neurol. 1986;19:68–74. doi: 10.1002/ana.410190112. [DOI] [PubMed] [Google Scholar]
- Cipolotti L, Maguire EA. A combined neuropsychological and neuroimaging study of topographical and non-verbal memory in semantic dementia. Neuropsychologia. 2003;41:1148–1159. doi: 10.1016/s0028-3932(03)00032-0. [DOI] [PubMed] [Google Scholar]
- Cuadra MB, Cammoun L, Butz T, Cuisenaire O, Thiran JP. Comparison and validation of tissue modelization and statistical classification methods in T1-weighted MR brain images. IEEE Trans Med Imaging. 2005;24:1548–1565. doi: 10.1109/TMI.2005.857652. [DOI] [PubMed] [Google Scholar]
- Dapretto M, Bookheimer SY. Form and content: dissociating syntax and semantics in sentence comprehension. Neuron. 1999;24:427–432. doi: 10.1016/s0896-6273(00)80855-7. [DOI] [PubMed] [Google Scholar]
- Démonet J-F, Chollet F, Ramsay S, Cardebat D, Nespoulous J-L, Wise R, Rascol A, Frackowiak R. The anatomy of phonological and semantic processing in normal subjects. Brain. 1992;115:1753–1768. doi: 10.1093/brain/115.6.1753. [DOI] [PubMed] [Google Scholar]
- Démonet JF, Fiez JA, Paulesu E, Petersen SE, Zatorre RJ. PET studies of phonological processing: a critical reply to Poeppel. Brain Lang. 1996;55:352–379. doi: 10.1006/brln.1996.0109. [DOI] [PubMed] [Google Scholar]
- Desmond JE, Sum JM, Wagner AD, Demb JB, Shear PK, Glover GH, Gabrieli JDE, Morrell MJ. Functional MRI measurement of language lateralization in Wada-tested patients. Brain. 1995;118:1411–1419. doi: 10.1093/brain/118.6.1411. [DOI] [PubMed] [Google Scholar]
- Devlin JT, Matthews PM, Rushworth FS. Semantic processing in the left inferior prefrontal cortex: a combined functional magnetic resonance imaging and transcranial magnetic stimulation study. J Cogn Neurosci. 2003;15:71–84. doi: 10.1162/089892903321107837. [DOI] [PubMed] [Google Scholar]
- Draganski B, Gaser C, Busch V, Schuierer G, Bogdahn U, May A. Changes in gray matter induced by training. Nature. 2004;427:311–312. doi: 10.1038/427311a. [DOI] [PubMed] [Google Scholar]
- Draganski B, Gaser C, Kempermann G, Kuhn HG, Winkler J, Buchel C, May A. Temporal and spatial dynamics of brain structure changes during extensive learning. J Neurosci. 2006;26:6314–6317. doi: 10.1523/JNEUROSCI.4628-05.2006. [DOI] [PMC free article] [PubMed] [Google Scholar]
- Ethofer T, Anders S, Erb M, Herbert C, Wiethoff S, Kissler J, Grodd W, Wildgruber D. Cerebral pathways in processing of affective prosody: a dynamic causal modeling study. NeuroImage. 2006;30:580–587. doi: 10.1016/j.neuroimage.2005.09.059. [DOI] [PubMed] [Google Scholar]
- Fiez JA. Phonology, semantics and the role of the left inferior prefrontal cortex. Hum Brain Mapp. 1997;5:79–83. [PubMed] [Google Scholar]
- Fiez JA, Petersen SE. Neuroimaging studies of word reading. Proc Natl Acad Sci USA. 1998;95:914–921. doi: 10.1073/pnas.95.3.914. [DOI] [PMC free article] [PubMed] [Google Scholar]
- Fiez JA, Raichle ME. Linguistic processing. In: Schmahmann JD, editor. The cerebellum and cognition. San Diego: Academic; 1997. pp. 233–254. [Google Scholar]
- Fiez JA, Raichle ME, Miezin FM, Petersen SE, Tallal P, Katz WF. PET studies of auditory and phonological processing: effects of stimulus characteristics and task demands. J Cogn Neurosci. 1995;7:357–375. doi: 10.1162/jocn.1995.7.3.357. [DOI] [PubMed] [Google Scholar]
- Folstein MF, Folstein SE, McHugh PR. “Mini-Mental State”: a practical method for grading cognitive states of patients for the clinician. J Psychiatr Res. 1975;12:189–198. doi: 10.1016/0022-3956(75)90026-6. [DOI] [PubMed] [Google Scholar]
- Friston KJ, Holmes AP, Worsley KJ, Poline J-B, Frith CD, Frackowiak RSJ. Statistical parametric maps in functional imaging: a general linear approach. Hum Brain Mapp. 1995a;2:189–210. [Google Scholar]
- Friston KJ, Ashburner J, Frith CD, Poline J-B, Heather JD, Frackowiak RSJ. Spatial registration and normalization of images. Hum Brain Mapp. 1995b;3:165–189. [Google Scholar]
- Friston KJ, Holmes A, Poline J-B, Price CJ, Frith CD. Detecting activations in PET and fMRI: levels of inference and power. NeuroImage. 1996;4:223–235. doi: 10.1006/nimg.1996.0074. [DOI] [PubMed] [Google Scholar]
- Friston KJ, Harrison L, Penny W. Dynamic causal modeling. NeuroImage. 2003;19:1273–1302. doi: 10.1016/s1053-8119(03)00202-7. [DOI] [PubMed] [Google Scholar]
- Geschwind N. Disconnection syndromes in animals and man. Brain. 1965;88:237–294. doi: 10.1093/brain/88.2.237. [DOI] [PubMed] [Google Scholar]
- Gitelman DR, Nobre AC, Parrish T, LaBar KS, Kim Y-H, Meyer JR, Mesulam MM. A large-scale distributed network for covert spatial attention: further anatomical delineation based on stringent behavioral and cognitive controls. Brain. 1999;122:1093–1106. doi: 10.1093/brain/122.6.1093. [DOI] [PubMed] [Google Scholar]
- Gitelman DR, Nobre AC, Sonty SP, Parrish TB, Mesulam M-M. Language network specializations: an analysis with parallel task designs and functional magnetic resonance imaging. NeuroImage. 2005;26:975–985. doi: 10.1016/j.neuroimage.2005.03.014. [DOI] [PubMed] [Google Scholar]
- Good CD, Johnsrude IS, Ashburner J, Henson RNA, Friston KJ, Frackowiak RSJ. A voxel-based morphometric study of ageing in 465 normal adult brains. NeuroImage. 2001;14:21–36. doi: 10.1006/nimg.2001.0786. [DOI] [PubMed] [Google Scholar]
- Goodglass H, Kaplan EF. The Boston Diagnostic Aphasia Examination. Philadelphia: Lea and Febiger; 1983. [Google Scholar]
- Gorno-Tempini ML, Dronkers NF, Rankin KP, Ogar JM, Phengrasamy L, Rosen HJ, Johnson JK, Weiner MW, Miller BL. Cognition and anatomy in three variants of primary progressive aphasia. Ann Neurol. 2004;55:335–346. doi: 10.1002/ana.10825. [DOI] [PMC free article] [PubMed] [Google Scholar]
- Hagoort P, Brown C, Indefrey P, Herzog H, Steinmetz H, Seitz RJ. The neural circuitry involved in the reading of German words and pseudowords: a PET study. J Cogn Neurosci. 1999;11:383–398. doi: 10.1162/089892999563490. [DOI] [PubMed] [Google Scholar]
- Halstead W. Brain and intelligence. Chicago: University of Chicago; 1947. [Google Scholar]
- Horwitz B, Braun AR. Brain network interactions in auditory, visual, and linguistic processing. Brain Lang. 2004;89:377–384. doi: 10.1016/S0093-934X(03)00349-3. [DOI] [PubMed] [Google Scholar]
- Jacobson S, Trojanowski J. Prefrontal granular cortex of the rhesus monkey. I. Intrahemispheric cortical afferents. Brain Res. 1977;132:209–233. doi: 10.1016/0006-8993(77)90417-6. [DOI] [PubMed] [Google Scholar]
- Jenkinson M, Pechaud M, Smith SM. BET2: MR-based estimation of brain, skull, and scalp surfaces. Paper presented at Eleventh International Conference on Functional Mapping of the Human Brain, Toronto, Ontario, Canada, June. 2005 [Google Scholar]
- Johnson N, Barion A, Rademaker A, Weintraub S. The Activities of Daily Living Questionnaire: a validation study in patients with dementia. Alzheimer Dis Assoc Disord. 2004;18:223–230. [PubMed] [Google Scholar]
- Kaplan E, Goodglass H, Weintraub S. The Boston Naming Test. Philadelphia: Lea and Febiger; 1983. [Google Scholar]
- Kapur S, Rose R, Liddle P, Zipursky R, Brown G, Stuss D, Houle S, Tulving E. The role of left prefrontal cortex in verbal processing: semantic processing or willed action? NeuroReport. 1994;5:2193–2196. doi: 10.1097/00001756-199410270-00051. [DOI] [PubMed] [Google Scholar]
- Kertesz A. Western Aphasia Battery (WAB) San Antonio, TX: The Psychological Corporation; 1982. [Google Scholar]
- Kucera H, Francis WN. Computational analysis of present-day American English. Providence, RI: Brown UP; 1967. [Google Scholar]
- Macmillan N, Creelman D. Detection theory: a user's guide. Cambridge, UK: Cambridge UP; 1991. [Google Scholar]
- Martin A, Haxby JV, Lalonde FM, Wiggs CL, Ungerleider LG. Discrete cortical regions associated with knowledge of color and knowledge of action. Science. 1995;270:102–105. doi: 10.1126/science.270.5233.102. [DOI] [PubMed] [Google Scholar]
- Mechelli A, Penny W, Price C, Gitelman D, Friston K. Effective connectivity and intersubject variability: using a multi-subject network to test differences and commonalities. NeuroImage. 2002;17:1459–1469. doi: 10.1006/nimg.2002.1231. [DOI] [PubMed] [Google Scholar]
- Mesulam M-M. Slowly progressive aphasia without generalized dementia. Ann Neurol. 1982;11:592–598. doi: 10.1002/ana.410110607. [DOI] [PubMed] [Google Scholar]
- Mesulam M-M. Large-scale neurocognitive networks and distributed processing for attention, language, and memory. Ann Neurol. 1990;28:598–613. doi: 10.1002/ana.410280502. [DOI] [PubMed] [Google Scholar]
- Mesulam M-M. From sensation to cognition. Brain. 1998;121:1013–1052. doi: 10.1093/brain/121.6.1013. [DOI] [PubMed] [Google Scholar]
- Mesulam M-M. Primary progressive aphasia. Ann Neurol. 2001;49:425–432. [PubMed] [Google Scholar]
- Mesulam M-M, Weintraub S. Spectrum of primary progressive aphasia. In: Rossor MN, editor. Unusual dementias. London: Baillière Tindall; 1992. pp. 583–609. [PubMed] [Google Scholar]
- Mesulam M-M, Van Hoesen GW, Pandya DN, Geschwind N. Limbic and sensory connections of the inferior parietal lobule (area PG) in the rhesus monkey: a study with a new method for horseradish peroxidase histochemistry. Brain Res. 1977;136:393–414. doi: 10.1016/0006-8993(77)90066-x. [DOI] [PubMed] [Google Scholar]
- Mesulam MM. Primary progressive aphasia–a language-based dementia. N Engl J Med. 2003;349:1535–1542. doi: 10.1056/NEJMra022435. [DOI] [PubMed] [Google Scholar]
- Mesulam MM, Grossman M, Hillis A, Kertesz A, Weintraub S. The core and halo of primary progressive aphasia and semantic dementia. Ann Neurol. 2003;54(Suppl 5):S11–S14. doi: 10.1002/ana.10569. [DOI] [PubMed] [Google Scholar]
- Morris JC, Heyman A, Mohs RC, Hughes JP, van Belle G, Fillenbaum G, Mellits ED, Clark C. The consortium to extablish a registry for Alzheimer's disease (CERAD). Part I. Clinical and neuropsychological assessment of Alzheimer's disease. Neurology. 1989;39:1159–1165. doi: 10.1212/wnl.39.9.1159. [DOI] [PubMed] [Google Scholar]
- Mummery CJ, Patterson K, Wise RJS, Vandenbergh R, Price CJ, Hodges JR. Disrupted temporal lobe connections in semantic dementia. Brain. 1999;122:61–73. doi: 10.1093/brain/122.1.61. [DOI] [PubMed] [Google Scholar]
- Nobre AC, Allison T, McCarthy G. Word recognition in the human inferior temporal lobe. Nature. 1994;372:260–263. doi: 10.1038/372260a0. [DOI] [PubMed] [Google Scholar]
- Oldfield RC. The assessment of analysis of handedness: the Edinburgh inventory. Neuropsychologia. 1971;9:97–113. doi: 10.1016/0028-3932(71)90067-4. [DOI] [PubMed] [Google Scholar]
- Pandya DN, Yeterian EH. Comparison of prefrontal connections and architecture. Philos Trans R Soc Lond B Biol Sci. 1996;351:1423–1432. doi: 10.1098/rstb.1996.0127. [DOI] [PubMed] [Google Scholar]
- Parrish TB, Gitelman DR, Kim Y-H, LaBar KS, Hallam D, Mesulam M-M. Clinical fMRI: is patient motion really an issue? NeuroImage. 1998;7:S560. [Google Scholar]
- Paulesu E, Frith CD, Frackowiak RSJ. The neural correlates of the verbal component of working memory. Nature. 1993;362:342–345. doi: 10.1038/362342a0. [DOI] [PubMed] [Google Scholar]
- Paulesu E, Frith U, Snowling M, Gallagher A, Morton J, Frackowiak RSJ, Frith CD. Is developmental dyslexia a disconnection syndrome? Evidence from PET scanning. Brain. 1996;119:143–158. doi: 10.1093/brain/119.1.143. [DOI] [PubMed] [Google Scholar]
- Paulesu E, Goldacre B, Scifo P, Cappa SF, Gilardi MC, Castiglioni I, Perani D, Fazio F. Functional heterogeneity of left inferior frontal cortex as revealed by fMRI. NeuroReport. 1997;8:2011–2016. doi: 10.1097/00001756-199705260-00042. [DOI] [PubMed] [Google Scholar]
- Penny W, Stephan KE, Mechelli A, Friston KJ. Comparing dynamic causal models. NeuroImage. 2004;22:1157–1172. doi: 10.1016/j.neuroimage.2004.03.026. [DOI] [PubMed] [Google Scholar]
- Petersen SE, Fiez JA. The processing of single words studied with positron emission tomography. Annu Rev Neurosci. 1993;16:509–530. doi: 10.1146/annurev.ne.16.030193.002453. [DOI] [PubMed] [Google Scholar]
- Petrides M, Pandya DN. Dorsolateral prefrontal cortex: comparative cytoarchitectonic analysis in the human and the macaque brain and corticocortical connection patterns. Eur J Neurosci. 1999;11:1011–1036. doi: 10.1046/j.1460-9568.1999.00518.x. [DOI] [PubMed] [Google Scholar]
- Price CJ. The anatomy of language: contributions from functional neuroimaging. J Anat. 2000;197:335–359. doi: 10.1046/j.1469-7580.2000.19730335.x. [DOI] [PMC free article] [PubMed] [Google Scholar]
- Price CJ, Warburton EA, Moore CJ, Frackowiak RSJ, Friston KJ. Dynamic diaschisis: anatomically remote and context-sensitive human brain lesions. J Cogn Neurosci. 2001;13:420–429. doi: 10.1162/08989290152001853. [DOI] [PubMed] [Google Scholar]
- Price CJ, Gorno-Tempini ML, Graham KS, Biggio N, Mechelli A, Patterson K, Noppeney U. Normal and pathological reading: converging data from lesion and imaging studies. NeuroImage. 2003;20:S30–S41. doi: 10.1016/j.neuroimage.2003.09.012. [DOI] [PubMed] [Google Scholar]
- Seltzer B, Pandya DN. Converging visual and somatic sensory input to the intraparietal sulcus of the rhesus monkey. Brain Res. 1980;192:339–351. doi: 10.1016/0006-8993(80)90888-4. [DOI] [PubMed] [Google Scholar]
- Seltzer B, Pandya DN. Further observations on parieto-temporal connections in the rhesus monkey. Exp Brain Res. 1984;55:301–312. doi: 10.1007/BF00237280. [DOI] [PubMed] [Google Scholar]
- Seltzer B, Pandya DN. Intrinsic connections and architechtonics of the superior temporal sulcus in the rhesus monkey. J Comp Neurol. 1989;290:451–471. doi: 10.1002/cne.902900402. [DOI] [PubMed] [Google Scholar]
- Seltzer B, Pandya DN. Parietal, temporal, and occipital projections to cortex of the superior temporal sulcus in the rhesus monkey: a retrograde tracer study. J Comp Neurol. 1994;343:445–463. doi: 10.1002/cne.903430308. [DOI] [PubMed] [Google Scholar]
- Sinnathamby R, Antoun NA, Freer CEL, Miles KA, Hodges JR. Neuroradiological findings in primary progressive aphasia: CT, MRI and cerebral perfusion SPECT. Neuroradiology. 1996;38:232–238. doi: 10.1007/BF00596535. [DOI] [PubMed] [Google Scholar]
- Smith SM. Fast robust automated brain extraction. Hum Brain Mapp. 2002;17:143–155. doi: 10.1002/hbm.10062. [DOI] [PMC free article] [PubMed] [Google Scholar]
- Sonty SP, Mesulam M-M, Thompson CK, Johnson NA, Weintraub S, Parrish TB, Gitelman DR. Primary progressive aphasia: PPA and the language network. Ann Neurol. 2003;53:35–49. doi: 10.1002/ana.10390. [DOI] [PubMed] [Google Scholar]
- Talairach J, Tournoux P. Co-planar stereotaxic atlas of the human brain. New York: Thieme Medical Publishers; 1988. [Google Scholar]
- Tyrrell PJ, Warrington EK, Frackowiak RSJ, Rossor MN. Heterogeneity in progressive aphasia due to focal cortical atrophy. Brain. 1990;113:1321–1336q. doi: 10.1093/brain/113.5.1321. [DOI] [PubMed] [Google Scholar]
- Van Essen DC, Anderson CH, Felleman DJ. Information processing in the primate visual system: an integrated systems perspective. Science. 1992;255:419–423. doi: 10.1126/science.1734518. [DOI] [PubMed] [Google Scholar]
- Wagner AD, Schacter DL, Rotte M, Koutstaal W, Maril A, Dale AM, Rosen BR, Buckner RL. Building memories: remembering and forgetting of verbal experiences as predicted by brain activity. Science. 1998;281:1188–1191. doi: 10.1126/science.281.5380.1188. [DOI] [PubMed] [Google Scholar]
- Webster MJ, Bachevalier J, Ungerleider LG. Connections of inferior temporal areas TEO and TE with parietal and frontal cortex in macaque monkeys. Cereb Cortex. 1994;4:470–483. doi: 10.1093/cercor/4.5.470. [DOI] [PubMed] [Google Scholar]
- Wechsler D. Wechsler Memory Scale—Revised Manual. San Antonio, TX: Psychological Corporation; 1987. [Google Scholar]
- Westbury C, Bub D. Primary progressive aphasia: a review of 112 cases. Brain Lang. 1997;60:381–406. doi: 10.1006/brln.1997.1840. [DOI] [PubMed] [Google Scholar]
- Wicklund AH, Johnson N, Weintraub S. Preservation of reasoning in primary progressive aphasia: further differentiation from Alzheimer's disease and the behavioral presentation of frontotemporal dementia. J Clin Exp Neuropsychol. 2004;26:347–355. doi: 10.1080/13803390490510077. [DOI] [PubMed] [Google Scholar]
- Wise RJS, Scott SK, Blank SC, Mummery CJ, Murphy K, Warburton EA. Separate neural subsystems within “Wernicke's area.”. Brain. 2001;124:83–95. doi: 10.1093/brain/124.1.83. [DOI] [PubMed] [Google Scholar]
- Worsley KJ, Marrett S, Neelin P, Vandal AC, Friston KJ, Evans AC. A unified statistical approach for determining significant signals in images of cerebral activation. Hum Brain Mapp. 1996;4:58–73. doi: 10.1002/(SICI)1097-0193(1996)4:1<58::AID-HBM4>3.0.CO;2-O. [DOI] [PubMed] [Google Scholar]
- Yesavage JA, Brink TL, Rose TL, Lum O, Huang V, Adey M, Leirer VO. Development and validation of a geriatric depression screening scale: a preliminary report. J Psychiatr Res. 1983;17:37–49. doi: 10.1016/0022-3956(82)90033-4. [DOI] [PubMed] [Google Scholar]