

Abstract
Expansion of a CAG repeat in the Huntington's disease (HD) gene results in progressive neuronal loss, particularly of striatal medium-sized spiny neurons (MSNs). Studies in human HD autopsy brain tissue, as well as cellular and animal models of HD, suggest that increased activity of NMDA-type glutamate receptors and altered mitochondrial function contribute to selective neuronal degeneration. In this regard, the YAC128 mouse model, expressing full-length human huntingtin with 128 glutamine repeats, has been the focus of much interest. Although NMDA-induced apoptosis is enhanced in YAC128 MSNs, here we report that the initial steps in the death signaling pathway, including NMDA receptor (NMDAR) current and cytosolic Ca2+ loading, are similar to those observed in wild-type MSNs. In contrast, we found that the NMDAR-mediated Ca2+ load triggered a strikingly enhanced loss of mitochondrial membrane potential in YAC128 MSNs, suggesting that NMDAR signaling via the mitochondrial apoptotic pathway is altered. This effect was accompanied by impaired cytosolic Ca2+ clearance after removal of NMDA, a difference that was not apparent after high potassium-evoked depolarization-mediated Ca2+ entry. Inhibition of the mitochondrial permeability transition (mPT) reduced peak cytosolic Ca2+ and mitochondrial depolarization evoked by NMDA in YAC128 MSNs but not wild-type MSNs. Hence, in contrast to YAC models with moderate CAG expansions, the enhanced NMDA-induced apoptosis in YAC128 MSNs is predominantly determined by augmented mitochondrial sensitivity to Ca2+-induced activation of the mPT. These results suggest that the CAG repeat length influences the mechanism by which mHtt enhances NMDAR-mediated excitotoxicity.
Keywords: mutant huntingtin, NMDA receptor, calcium, mitochondria, ratiometric imaging, striatal neurons
Introduction
Progressive neurodegeneration in Huntington's disease (HD) is caused by a CAG repeat expansion in exon 1 of the HD gene. The resulting polyglutamine (polyQ) expansion in the 350 kDa cytosolic protein huntingtin (Htt) is associated with typical adult onset disease for repeat lengths of 40–55, whereas more extreme expansions cause juvenile onset and a distinct clinical presentation (Bittenbender and Quadfasel, 1962; van Dijk et al., 1986; Brinkman et al., 1997). Neuronal loss is most severe among the medium-sized spiny neurons (MSNs) of the neostriatum (Vonsattel et al., 1985), whereas Htt expression is widespread (Strong et al., 1993). Transcriptional interference (Cha, 2000; Luthi-Carter et al., 2000; Zuccato et al., 2001), protein aggregation, and inhibition of the proteasomal machinery (Ross, 2002) mediated by polyQ-expanded (mutant) Htt (mHtt) may contribute to neuronal dysfunction and/or death. Caspase and calpain activation also occur in HD (Kim et al., 2001; Wellington et al., 2002), and mHtt cleavage by caspase-6 is critical for producing clinical features and neurodegeneration typical of HD in a transgenic mouse model (Graham et al., 2006b). However, it remains unclear how proteolytic cleavage, mHtt nuclear translocation, and transcriptional dysregulation are selectively activated in HD striatal neurons.
Previous studies in autopsy brain tissue from humans with HD have suggested that excitotoxicity resulting from overactivation of NMDA-type glutamate receptors (NMDARs) in combination with impaired mitochondrial function contributes to the relatively selective dysfunction and death of striatal neurons (Fan and Raymond, 2007). Additionally, increased NMDAR-mediated current has been recorded in striatal MSNs from several transgenic HD mouse models (Cepeda et al., 2001; Laforet et al., 2001; Zeron et al., 2002, 2004). The yeast artificial chromosome (YAC) transgenic mouse model of HD expresses the full-length human HD gene with 18, 46, 72, or 128 CAG repeats (Hodgson et al., 1999; Leavitt et al., 2001; Slow et al., 2003). YAC mice expressing expanded Htt exhibit motor and cognitive impairment, as well as striatal degeneration, typical of HD (Hodgson et al., 1999; Slow et al., 2003; Van Raamsdonk et al., 2005); these mice also show increased sensitivity to NMDA-induced apoptosis in MSNs cultured from early postnatal pups (Zeron et al., 2002; Graham et al., 2006b; Shehadeh et al., 2006).
YAC128 mice, carrying a more extreme CAG expansion than the other YAC HD mouse models, show an accelerated phenotype and significant striatal neurodegeneration by 6–12 months (Slow et al., 2003). Here, we examined the sequence of events leading to the previously reported (Graham et al., 2006b) enhanced NMDA-induced neuronal death in YAC128 compared with wild-type (WT) mouse MSNs and found some surprising differences compared with YAC46 and YAC72 MSNs (Zeron et al., 2002, 2004). Although NMDA-evoked currents and cytosolic calcium loads are similar for YAC128 and WT MSNs, YAC128 MSNs exhibit slowed cytosolic calcium clearance and enhanced sensitivity to induction of the mitochondrial permeability transition (mPT) in response to NMDA. Our results suggest that therapy targeted toward signaling downstream of NMDAR activation would be most effective in this more aggressive model of HD.
Materials and Methods
Preparation of primary striatal neurons.
Primary neostriatal neuronal cultures were prepared from WT or YAC128 line 55 mouse pups, as described previously (Zeron et al., 2004; Shehadeh et al., 2006). Briefly, sterile poly-d-lysine-coated coverslips were placed in 24-well plates and allowed to dry before culturing. Striata were dissected from postnatal day 0 (P0) to P1 mice in HBSS on ice and then digested in warmed (37°C) papain solution for 10 min. Cells were further dissociated using a series of reducing bore-size Pasteur pipettes in warmed trypsin inhibitor solution and transferred to warmed serum-free plating media [Neurobasal medium including 2% B27 without supplements (Invitrogen, Burlington, Ontario), 2 mm l-glutamine, and 1% penicillin/streptomycin]. Neurons were plated at a density of ∼2.0 × 10⁵ cells per well and incubated (37°C, 5% CO2) for 9–12 d. Approximately 80–90% of cells cultured in this serum-free medium have the characteristics of MSNs, as evidenced by morphology, DARPP-32 staining, and/or staining for the GABAergic neuronal marker GAD-65 (Hansson et al., 1999; Kovacs et al., 2001; Shehadeh et al., 2006). In all experiments, measurements were taken only from cells with morphological features consistent with MSNs, including an ovoid soma with a short diameter of ∼10 μm and two to four closely projecting processes (Shi and Rayport, 1994).
Electrophysiological experiments.
All cells were used for electrophysiological analysis at 9–11 d in vitro (DIV). Coverslipped cultured MSNs were placed in the recording chamber on the stage of an inverted microscope (Axiovert 100; Carl Zeiss, Thornburg, NY). Intracellular recording solution contained the following: 115 mm CsMeSO3, 10 mm HEPES, 10 mm BAPTA, 4 mm Mg-ATP, 20 mm K2-creatine phosphate, and 50 U/ml creatine phosphokinase, titrated to pH 7.25 using CsOH and with an osmolarity of 309–310 mOsm. Extracellular recording solution contained the following: 167 mm NaCl, 2.4 mm KCl, 1.8 mm CaCl2, 10 mm HEPES, and 10 mm d-(+) glucose, titrated to pH 7.3 using NaOH and with an osmolarity of 325 mOsm. Both intracellular and extracellular solutions were filtered before use. In all experiments, 50 μm glycine and 0.3 μm TTX (to block voltage-gated sodium currents) were added to all extracellular solutions. Perfusion of neurons with different agonist solutions was achieved using a gravity-fed solenoid system attached to a theta tube. Currents were sampled at 5 kHz and acquired and analyzed using pCLAMP software and an Axopatch 200A amplifier (Molecular Devices, Foster City, CA). Current amplitude measurement and kinetics fittings were performed using Clampfit software.
Measurement of current density, steady-state to peak ratio, and ifenprodil sensitivity.
Primary cultures of MSNs were prepared as described, and whole-cell currents were recorded under voltage clamp (VH = −60 mV) in nominally Mg2+-free conditions. All currents were leak-subtracted before analysis. NMDAR currents were elicited by a 4 s application of 1 mm NMDA. This was repeated twice at 60 s intervals, for a total of three separate trials. Peak current density was calculated by dividing the peak current amplitude by the cell capacitance, thus normalizing current to cell surface area (allowing comparisons between cells with potentially different membrane surface areas). NMDAR steady-state to peak current ratios were calculated by averaging NMDAR currents over the last 200 ms before cessation of NMDA application (to get a measure of steady-state current) and then dividing by the peak current amplitude and expressed as a percentage.
The NMDA stimulation paradigm was then repeated in the presence of 3 μm ifenprodil (IFN). IFN was washed out, and the stimulation paradigm was repeated to monitor recovery of NMDAR current from IFN block. The percentage of current inhibited by IFN was calculated by dividing the average peak NMDAR current of two responses in the presence of IFN by the peak NMDAR current before IFN application.
Visualization of changes in cytosolic free Ca2+ and mitochondrial membrane potential (ΔΨm).
Measurements were taken at room temperature (20–21°C) from primary cultures of age-matched WT or YAC128 MSNs between 9 and 11 DIV. Neurons were loaded with the acetoxymethyl (AM) esters of fura-2, fura-FF or magfura-2 by incubation at 32°C for 45 min in 6.7 μm indicator dye in balanced salt solution (BSS; containing 139 mm NaCl, 3.5 mm KCl, 2 mm NaHCO3, 10 mm HEPES, 3 mm Na2HPO4–7H2O, 1.8 mm CaCl2, 11 mm d-glucose, and 50 μm glycine, pH adjusted to 7.35) containing 2.5% bovine serum albumin. The coverslips were then transferred to BSS alone for 15 min before each experiment to ensure hydrolysis of the fluorophore. Experiments were performed using a Zeiss Attofluor digital fluorescence imaging system as previously described (Abdel-Hamid and Baimbridge, 1997).
Neurons were superfused continuously with BSS at 2.4 ml/min. Regions of interest were sized and placed over the soma of cells that morphologically resembled MSNs. Cells were stimulated with varying concentrations (100 or 500 μm) of NMDA (in some experiments in the presence of 0.2 mm Cd2+, as noted) or 50 mm KCl + 5 μm FPL64176 (FPL), with 50 μm glycine in all experiments; other compounds were added where indicated. Exposure of cells to 50 mm KCl was achieved by replacing BSS (during the stimulation period) with a high-KCl solution containing the following: 70 mm NaCl, 50 mm KCl, 2 mm NaHCO3, 10 mm HEPES, 3 mm Na2HPO4–7H2O, 1.8 mm CaCl2, 11 mm d-glucose, and 50 μm glycine, pH adjusted to 7.35. Cells that morphologically resembled MSNs and responded to NMDA or KCl/FPL application with an increase in cytosolic Ca2+ were used in the analysis. Data conversion calculations and analysis were performed using Microsoft (Seattle, WA) Excel macros created in Microsoft Visual Basic by Dr. Gordon Rintoul. For measurement of cytosolic Ca2+, the mean peak F334/F380 response for each cell was calculated by averaging over a 30 s period around the maximal peak response during application of NMDA or KCl/FPL, after subtraction of mean baseline F334/F380 for a 30 s period before stimulus application. The resulting values from each cell were then used to calculate an overall mean value for that experiment; mean and SE for each treatment group were calculated from the means of each experiment for that treatment group (i.e., n is the number of experiments). Estimates of cytosolic calcium recovery were made by expressing the mean F334/F380 value every 5 min after NMDA or KCl/FPL washout as a percentage of the maximal peak F334/F380 response.
Changes in ΔΨm were assessed by single wavelength imaging of rhodamine-123 (rhod-123) fluorescence. This dye is preferentially sequestered in the mitochondria, where its fluorescence is quenched as a result of dye stacking. A loss of ΔΨm results in the redistribution of rhod-123 back into the cytosol, producing an increase in overall cell fluorescence.
In some experiments, the initial loading of Ca2+ indicator (either fura-2 or fura-FF) was followed immediately by an addition of 26.3 mm rhod-123 to the loading buffer to achieve a final concentration of 5.0 μm rhod-123. Fifteen minutes after the addition of rhod-123, coverslips were transferred to BSS alone, at room temperature. Dual imaging experiments were then performed in which both cytosolic Ca2+ and ΔΨm were measured simultaneously under the same conditions and in the same age-matched and paired (except for experiments using mPT inhibitors) WT and YAC128 MSNs. The same chamber and imaging system were used as described above, and the same stimulation and measurement paradigm with the addition of an excitation (488 nm) and emission (>510 nm) cycle for rhod-123. Data for ΔΨm were expressed as the background-corrected change in fluorescence compared with baseline (ΔF/F0). The mean peak ΔF/F0 during NMDA application (calculated by averaging over a 30 s period around the peak response) was calculated from measurements for all responding neurons during stimulus (NMDA or KCl/FPL) application in each experiment. The resulting means from each experiment were then used to calculate an overall mean and SE (based on n reflecting the number of experiments) for each treatment group.
For some experiments, mitochondrial Ca2+ content was measured after NMDA application by depolarizing mitochondria using 5 μm carbonyl cyanide 3-chlorophenylhydrazone (CCCP), causing mitochondria to release accumulated free Ca2+ into the cytosol. To isolate this source of Ca2+ influx to the cytosol (and exclude Ca2+ entry from extracellular space), neurons were superfused with a Ca2+-free BSS (same composition as normal BSS above, except 1.8 mm CaCl2 is replaced by 0.9 mm MgCl2) for 2 min before the addition of CCCP, during the washout of NMDA.
To calculate the lag time between initial changes in Ca2+ and ΔΨm, experiments using the dye pair of fura-2 (because of high sensitivity at low [Ca2+]) and rhodamine-123 were analyzed. The time bases for both variables were aligned, and the initiation of fluorescence changes for each variable was recorded. The start time for a fluorescence change was defined as the initial data point in a series of at least five data points that successively increased in a positive direction, after NMDA application. Changes in Ca2+ were observed to always occur before changes in ΔΨm.
Data analysis.
All data are presented as means ± SEM, unless otherwise noted. t tests and two-way and repeated-measure ANOVAs followed by Bonferroni posttest were performed using GraphPad (San Diego, CA) Prism statistical analysis software. ANOVAs were used where experiments using WT and YAC128 MSNs could be age-matched and performed on the same days (the majority of experiments), allowing for variability in dye-loading and deesterification times, and changes in the intensity of the UV light source over time, to be accounted for equally in all genotype and treatment groups within and across culture batches. Where experiments for both genotypes could not be performed on the same day (those using mPT inhibitors), unpaired t tests were used to analyze data within genotype only, to assess the effects of treatment. All Ca2+ imaging data were baseline-subtracted before analysis.
Materials.
Acetoxymethyl esters of fura-2, fura-FF, and magfura-2, as well as rhodamine-123, were purchased from Invitrogen. TTX was purchased from Alomone Labs (Israel). Neurobasal medium, B27 with no added supplements, HBSS, and penicillin/streptomycin were purchased from Invitrogen. All other chemicals were purchased from Sigma-Aldrich (Oakville, Ontario, Canada).
Results
NMDAR current properties are similar for YAC128 and wild-type neurons
Cultured YAC128 MSNs display increased apoptosis 24 h after brief exposure to NMDA compared with WT MSNs (Graham et al., 2006b). Enhanced excitotoxicity could result from increased NMDAR activation, impaired Ca2+ homeostasis, or mitochondrial dysfunction. To determine the mechanisms underlying augmented NMDAR excitotoxicity, we began by comparing NMDAR-mediated current in YAC128 and WT MSNs. In these and subsequent experiments, we chose 500 μm to 1 mm NMDA as an appropriate agonist concentration range for maximally stimulating NMDARs for two reasons. First, the EC50 for sustained glutamate stimulation of recombinant NR1/NR2B-type NMDARs is ∼20 μm (Chen et al., 2001), and NMDA is only a partial NMDAR agonist with a higher EC50 than glutamate (Banke and Traynelis, 2003). Second, Alano et al. (2002) found that NMDA concentrations on the order of 500 μm to 1 mm were required to saturate NMDAR responses in rat MSNs; our own previous results confirmed that 500 μm NMDA was sufficient for maximal induction of apoptosis and evoking the largest changes in cytosolic Ca2+ and mitochondrial depolarization in cultured murine MSNs (Zeron et al., 2004; Shehadeh et al., 2006). Somewhat surprisingly, we found that the mean NMDA-evoked peak current density recorded from YAC128 MSNs was not significantly different (p > 0.05 by unpaired t test) from that of WT MSNs (Fig. 1B, left). As well, we found no significant difference (p > 0.05 by unpaired t test) in the mean capacitance of WT and YAC128 MSNs (12.0 ± 0.4 pF, 28 cells vs 13.2 ± 0.9 pF, 20 cells, respectively).
Figure 1.
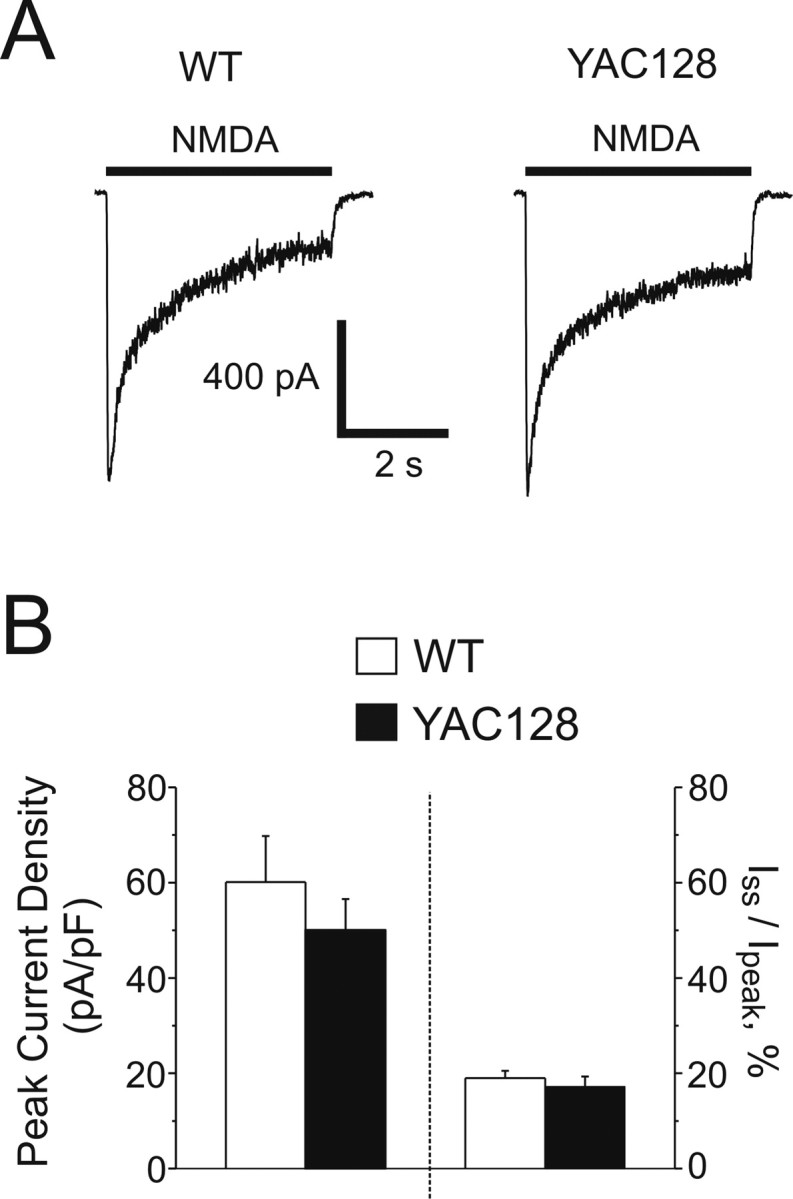
NMDAR current densities in WT and YAC128 MSNs. A, Representative whole-cell NMDAR currents from WT (left) and YAC128 (right) MSNs, evoked by the application of 1 mm NMDA. B, Left, Mean peak current densities (left y-axis) of WT (open bar, n = 28 cells) and YAC128 (filled bar, n = 20 cells) MSNs, not significant by unpaired t test. Data are expressed as mean ± SEM. Right, Iss/Ipeak values (right y-axis) for WT (19.0 ± 1.5%, n = 28 cells) and YAC128 MSNs (17.2 ± 2.1%, n = 20 cells, not significant by unpaired t test). Data are expressed as mean ± SEM.
NMDARs desensitize in the continuous presence of agonist, which is one mechanism for attenuating the total current (and Ca2+) that enters the neuron during sustained NMDAR activation. If mHtt expression resulted in reduced NMDAR desensitization (i.e., a higher steady-state to peak ratio) this would allow greater current and Ca2+ to enter the cell, facilitating neurotoxic damage. Hence, we assessed the ratio of NMDAR steady-state (Iss) to peak (Ipeak) current in both WT and YAC128 MSNs. However, no significant differences were found in Iss/Ipeak between genotypes (Fig. 1B, right).
Recent studies suggest NMDAR subunit composition determines activation of distinct signaling pathways (Liu et al., 2004; Massey et al., 2004; Kim et al., 2005; Li et al., 2006), some of which are linked to cell death (DeRidder et al., 2006). Moreover, mHtt selectively alters NMDAR-mediated current and apoptosis in a non-neuronal cell line expressing recombinant NR1/NR2B but not NR1/NR2A (Chen et al., 1999). To determine whether YAC128 MSNs differed from WT MSNs in the NR2B content of NMDARs, we measured the reduction in NMDA-evoked peak current after treatment with the NR1/NR2B-selective inhibitor IFN (3 μm) (Williams, 1993). Our results confirmed that WT and YAC128 MSNs express predominantly NR2B-containing NMDARs, similar to our previous observations in acutely dissociated MSNs from 6- to 11-week-old mice (Zeron et al., 2002). However, there was no significant difference in the percentage of IFN-sensitive NMDAR current between genotypes (WT: 68.6 ± 2.7%, n = 10 cells; YAC128: 58.0 ± 4.8%, n = 10 cells; p > 0.05 by unpaired t test). These data indicate that mHtt does not alter the proportion of NR1/NR2B-type NMDARs in cultured YAC128 MSNs.
Altered cytosolic Ca2+ clearance after NMDA stimulation in YAC128 MSNs
The above results suggest an apparent paradox: mHtt expression in YAC128 MSNs does not increase the NMDAR peak current density as it does in YAC72 MSNs (Zeron et al., 2002, 2004; Fan et al., 2007) or affect desensitization (and hence the integrated NMDAR current), yet NMDA exposure induces apoptosis more efficiently in YAC128 than in WT MSNs (Graham et al., 2006b), and indeed produces the largest enhancement of apoptosis in YAC128 MSNs relative to YAC18 controls of any stimulus (Shehadeh et al., 2006). We therefore focused on the downstream consequences of NMDAR activation, monitoring cytosolic free calcium levels by fluorescence imaging of MSNs loaded with the high-affinity calcium dye fura-2 (representative traces shown in Fig. 2A). We hypothesized that YAC128 MSNs have a higher resting Ca2+ level, possibly indicative of a stress-induced change (Hansson et al., 2001) or existing mitochondrial impairment (Xiong et al., 2002) that may leave cells more vulnerable to further insult, or else that an equivalent concentration of NMDA would produce a larger increase in cytosolic Ca2+ in YAC128 than WT MSNs.
Figure 2.
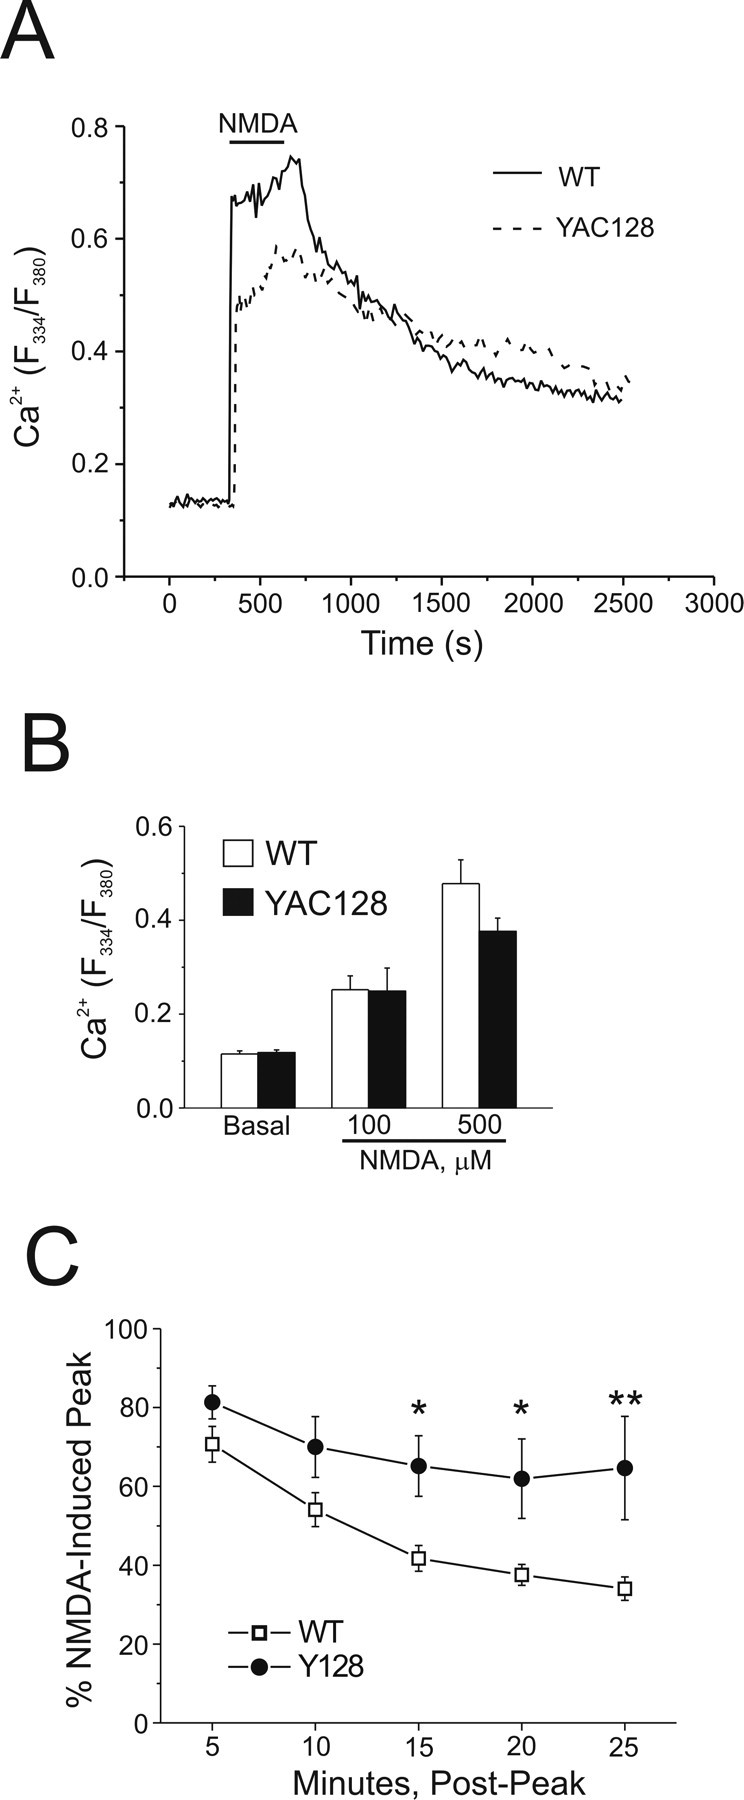
Cytosolic Ca2+ handling in WT and YAC128 MSNs after NMDA application. Intracellular Ca2+ was monitored using fura-2 in these experiments. A, Representative mean responses of WT (solid line, n = 27 cells) and YAC128 (dashed line, n = 21 cells) MSNs before, during, and after 5 min of application of 500 μm NMDA. B, Basal (n = 10 experiments per genotype, total of 168 and 163 neurons for WT and YAC128, respectively, from 6 different batches of cultured neurons) and peak cytosolic Ca2+ responses to 100 μm NMDA (n = 4 experiments per genotype, total of 73 and 68 neurons for WT and YAC128, respectively, from 2 different culture batches) or 500 μm NMDA (n = 10 experiments per genotype, total of 168 and 163 neurons for WT and YAC128, respectively, from 6 different culture batches) in WT (open bars) or YAC128 (filled bars) MSNs. Not significant by paired t test for WT versus YAC128 basal cytosolic Ca2+ or 100 or 500 μm NMDA; data are expressed as mean ± SEM. C, Recovery of cytosolic Ca2+ toward prestimulus levels after application of 500 μm NMDA in WT (open squares, n = 5 experiments, total of 91 neurons from 3 different culture batches) or YAC128 (filled circles, n = 5 experiments, total of 90 neurons, from 3 different culture batches) MSNs. Repeated-measures ANOVA, effect of genotype, F(1,20) = 33.78, p < 0.0001; effect of time, F(4,20) = 4.04, *p < 0.05; *p < 0.05 at 15 min; *p < 0.05 at 20 min; **p < 0.01 at 25 min by Bonferroni posttest.
We found equivalent baseline cytosolic Ca2+ concentrations, as reflected in similar F334/F380 ratios (p > 0.05 by paired t test) for WT and YAC128 MSNs (Fig. 2B). As well, the maximal peak amplitude of the increase in cytosolic Ca2+ evoked during the application of either 100 μm NMDA or 500 μm NMDA was not significantly different (p > 0.05 by paired t test) between WT and YAC128 MSNs (Fig. 2B), similar to the mean whole-cell peak current density evoked by 1 mm NMDA (Fig. 1B). The lack of difference in peak NMDAR-evoked Ca2+ increases was confirmed using the lower-affinity Ca2+ indicator magfura-2: F334/F380 ratios using magfura-2 (data not shown) for WT (four experiments, 74 cells total) versus YAC128 (four experiments, 80 cells total) were 0.54 ± 0.16 versus 0.43 ± 0.10, respectively (p > 0.05 by paired t test), ruling out the possibility that indicator dye saturation artifactually equalized the Ca2+ responses (Hyrc et al., 1997; Stout and Reynolds, 1999). Thus, neither resting nor peak cytosolic Ca2+ responses could explain the markedly enhanced NMDA-induced apoptosis found in YAC128 compared with WT MSNs.
In contrast to the similarity in peak Ca2+ response, recovery of cytosolic Ca2+ toward baseline levels after washout of NMDA appeared slower in YAC128 MSNs, as illustrated in representative traces (Fig. 2A). To investigate this further, data from a subset of experiments, in which Ca2+ changes were monitored over longer periods, were pooled, and cytosolic Ca2+ recovery was quantified as the percentage of the peak NMDA-induced change remaining over time after washout of NMDA. This analysis revealed a significantly slower recovery rate for YAC128 versus WT MSNs as early as 15 min (repeated-measures ANOVA followed by Bonferroni posttest, *p < 0.05 at 15 min, *p < 0.05 at 20 min, **p < 0.01 at 25 min) post-NMDA (Fig. 2C), indicating a prolonged elevation of cytosolic Ca2+ in YAC128 MSNs that may be toxic to the cells in and of itself and/or reflect pathological changes in neuronal function, such as the failure of calcium removal to the extracellular space or sequestration into intracellular stores.
Next, we asked whether the slowed cytosolic Ca2+ recovery reflected a general defect in Ca2+ handling in YAC128 MSNs, or whether it was specific for NMDA-induced Ca2+ accumulation. Notably, NMDAR activation under unclamped conditions will lead to activation of voltage-gated calcium channels (VGCCs), which will add to the intracellular Ca2+ load. To stimulate influx of calcium from outside the cell without activating NMDARs, we used 50 mm KCl together with the L-type Ca2+ channel modulator FPL64176 (5 μm), a combination that optimizes depolarization-induced Ca2+ influx via VGCCs (Hardingham et al., 1999). We compared cytosolic Ca2+ responses induced by this stimulus to those evoked by 100 μm NMDA, as well as to 500 μm NMDA with the panspecific VGCC inhibitor, Cd2+, to isolate NMDAR-mediated Ca2+ influx from the VGCC-mediated contribution (representative responses shown in Fig. 3A). It should be noted, however, that 0.2 mm Cd2+ may also partially block NMDARs (Mayer et al., 1989), so in addition to inhibition of VGCC-mediated Ca2+ entry, the NMDAR-mediated Ca2+ influx is also likely attenuated. When the maximal peak Ca2+ response for NMDA application was normalized to that of KCl/FPL in paired experiments (Fig. 3B), we found these responses to be similar for selective activation of VGCCs (KCl/FPL) versus NMDARs (500 μm NMDA with 0.2 mm Cd2+); however, 100 μm NMDA, which will activate both NMDARs and VGCCs, induced a significantly larger maximal cytosolic Ca2+ response than that elicited by paired applications of KCl/FPL. There was no significant difference in peak cytosolic Ca2+ between genotypes for any stimulus (two-way ANOVA; no effect of treatment or genotype). Similar to the previous experiments using 500 μm NMDA alone, recovery from a Ca2+ load induced by 100 μm NMDA was also significantly slower in YAC128 compared with WT MSNs (two-way ANOVA followed by Bonferroni posttest, *p < 0.05 at 5 min, **p < 0.01 at 10 min, ***p < 0.01 at 15 min). In contrast, recovery from the smaller Ca2+ load induced by membrane depolarization with KCl and FPL or NMDAR activation in the presence of Cd2+ proceeded at equivalent rates in both genotypes (two way ANOVA; no effect of genotype) (Fig. 3C). Thus, this defect in Ca2+ handling in YAC128 MSNs is revealed under conditions of maximal Ca2+ loading, such as occurs during near-maximal stimulation of NMDARs combined with activation of VGCCs.
Figure 3.

Contrasting responses of WT and YAC128 MSNs to different stimuli that increase cytosolic Ca2+. Intracellular Ca2+ was monitored using fura-FF in these experiments. A, Left, Representative mean responses of WT MSNs to 100 μm NMDA (solid line, n = 14 cells) or 50 mm KCl + 5 μm FPL64176 (dotted line, n = 23 cells). Right, Representative mean responses of WT MSNs to 500 μm NMDA + 0.2 mm Cd2+ (solid line, n = 19 cells) or 50 mm KCl + 5 μm FPL64176 (dotted line, n = 19 cells). B, Peak cytosolic Ca2+ responses to 100 μm NMDA (n = 6 experiments for WT, n = 5 for YAC128; total of 108 and 86 neurons for WT and YAC128, respectively, from 3 different culture batches) or 500 μm NMDA + 0.2 mm Cd2+ (n = 6 experiments, 98 cells total for WT; n = 6 experiments, 114 cells total for YAC128, from 2 different culture batches per genotype) normalized to peak cytosolic Ca2+ responses to 50 mm KCl + 5 μm FPL64176 (n = 12 experiments per genotype, total of 216 and 211 neurons for WT and YAC128, respectively, from 5 different culture batches) obtained in paired experiments in WT (open bars) or YAC128 (filled bars) MSNs. *p < 0.05 by single-factor t test (significantly different from 1.0). Data are expressed as mean ± SEM. C, Recovery of cytosolic Ca2+ toward prestimulus levels after 5 min of application of 100 μm NMDA (WT: open squares; YAC128: filled squares; n = 5 experiments per genotype, total of 97 and 86 neurons for WT and YAC128, respectively, from 3 different culture batches), 500 μm NMDA + 0.2 mm Cd2+ (n = 6 experiments, 98 cells total for WT; n = 6 experiments, 114 cells total for YAC128, from 2 different culture batches per genotype) or 50 mm KCl + 5 μm FPL64176 (WT: open triangles; YAC128: filled triangles; n = 12 experiments per genotype, total of 216 and 211 neurons for WT and YAC128, respectively, from 5 different culture batches). Significant difference in recovery of cytosolic Ca2+, WT versus YAC128 (100 μm NMDA): two-way ANOVA; effect of genotype F(1,21) = 36.76, p < 0.0001; *p < 0.05; **p < 0.01; ***p < 0.01 by Bonferroni posttest; effect of time F(2,21) = 2.23, p > 0.05.
Similar cytosolic Ca2+ loads induce markedly different changes in ΔΨm in YAC128 compared with WT MSNs
A number of studies demonstrate that NMDAR-mediated excitotoxicity is likely dependent on mitochondrial calcium uptake and overload (Castilho et al., 1998; Stout et al., 1998), and the extent of mitochondrial membrane depolarization induced by calcium uptake is one indicator of the risk for subsequent apoptotic death (Schinder et al., 1996). Therefore, we assessed whether the difference in toxicity between WT and YAC128 MSNs correlated with a difference in mitochondrial responses to near-equivalent NMDA-induced cytosolic Ca2+ transients. Figure 4A shows two typical experiments using two dyes (fura-2 and rhod-123) to simultaneously monitor cytosolic Ca2+ and ΔΨm in WT (top) and YAC128 (bottom) MSNs. Of note (Fig. 4A, inset), the increase in cytosolic Ca2+ indicated by an increase in fura-2 ratio precedes any change in rhod-123 fluorescence (mean lag time between initial changes in fura-2 and rhod-123 signals: 4.39 ± 0.98 s for WT, 5.89 ± 1.2 s for YAC128 MSN, p > 0.05 by paired t test; n = 8 paired experiments per genotype; total of 131 and 147 neurons for WT and YAC128, respectively, from four different culture batches); this demonstrates the temporal link between the two monitored parameters, consistent with the increase in cytosolic Ca2+ triggering uptake by the mitochondria and, consequently, a reduction in ΔΨm. As expected, there was no difference between WT and YAC128 MSNs (p > 0.05 by paired t test) in the calcium signal at baseline or in response to 500 μm NMDA (Fig. 4B, left). However, the simultaneously monitored changes in ΔΨm were markedly different (*p < 0.05 by paired t test), with a larger reduction of ΔΨm in YAC128 MSNs indicated by an approximately threefold greater change in rhod-123 fluorescence compared with WT MSNs (Fig. 4B, right) (*p < 0.05 by paired t test).
Figure 4.

NMDA-induced changes in cytosolic Ca2+ and ΔΨm in WT and YAC128 MSNs. A, Representative mean cytosolic Ca2+ (solid line, fura-2) and mitochondrial ΔΨm (dashed line, rhodamine-123) responses of WT (top, n = 20 cells) and YAC128 (bottom, n = 15 cells) MSNs before, during, and after 5 min of application of 500 μm NMDA. Inset of YAC128 responses illustrates temporal order of changes in Ca2+ (solid line) preceding changes in ΔΨm (dashed line) during initial phase of response to NMDA (arrow indicates start of NMDA application). B, Left, Basal and peak cytosolic Ca2+ responses (F334/F380 measured using fura-2; left y-axis) to 500 μm NMDA in WT (open bars) or YAC128 (filled bars) MSNs. Not significant by paired t test; data are expressed as mean ± SEM. Right, Concurrent changes in ΔΨm (ΔF/F; right y-axis) in WT (open bar) or YAC128 (filled bar) MSNs (n = 8 paired experiments per genotype; total of 131 and 147 neurons for WT and YAC128, respectively, from 4 different culture batches). *p < 0.05 by paired t test; data are expressed as mean ± SEM. C, 5 μm CCCP-mediated mitochondrial depolarization in previously unstimulated Y128 MSNs results in very little free Ca2+ released from the mitochondria into the cytosol. Mean cytosolic Ca2+ (solid line, fura-FF) and ΔΨm (dashed line, rhodamine-123) responses of 13 MSNs. D, Representative example of mitochondrial Ca2+ uptake experiment, mean responses ± SEM of 13 WT MSNs shown. Fura-FF was used as the Ca2+ indicator. Shaded areas, determined by stimulus duration, were used in AUC calculations to determine C/N ratios.
There are several possible reasons for the larger NMDA-induced loss of ΔΨm in YAC128 MSNs. This effect could reflect altered resting mitochondrial function and/or enhanced mitochondrial access to the NMDAR-induced Ca2+ influx leading to increased uptake and depolarization. By applying CCCP (a mitochondrial protonophore that dissipates ΔΨm, thus releasing accumulated rhod-123) (Fig. 4C, example trace) (Toescu and Verkhratsky, 2000) to MSNs loaded with both fura-FF and rhod-123, we established that resting mitochondria in YAC128 MSNs have an average polarization state (p > 0.05 by paired t test) similar to those in WT MSNs (peak ΔF/F: 2.364 ± 0.195 for WT, 2.351 ± 0.476 for YAC128, n = 6 paired experiments per genotype; total of 121 and 113 neurons for WT and YAC128, respectively, from three different culture batches; data are expressed as mean ± SEM). Notably, there is little free Ca2+ released from depolarized mitochondria to the cytosol in the absence of prior NMDAR stimulation, as illustrated in Figure 4C. Furthermore, we used previously established methods to ascertain the efficiency of mitochondrial Ca2+ uptake (Brocard et al., 2001), in which we measured the area under the curve (AUC) of Ca2+ responses to a 1 min exposure to 500 μm NMDA (N) followed 2 min later by a 1 min application of CCCP (C; to release free Ca2+ accumulated by mitochondria) to calculate the C/N ratio (representative experiment shown in Fig. 4D). Similar C/N ratios (WT: 0.978 ± 0.097, n = 8 experiments, 92 neurons total; YAC128: 0.805 ± 0.127, n = 6 experiments, 105 neurons total; 3–4 different culture batches, p > 0.05 by unpaired t test; data are expressed as mean ± SEM) indicated that mitochondria in WT and YAC128 MSNs were equally capable of initially buffering Ca2+ that enters via NMDARs. Moreover, we observed similar, rapid recovery rates after NMDA for WT and YAC128 MSNs (Fig. 4D) (time to recovery to 50% of the peak was 41.1 ± 4.9 s, n = 8 experiments and 92 cells total for WT; and 36.1 ± 7.1 s, n = 6 experiments and 105 cells total for YAC128; p > 0.05 by unpaired t test), suggesting that the Ca2+ handling defect is only observed after prolonged NMDAR activity. However, in comparing the total integrated Ca2+ response, it is apparent that the CCCP-induced release of Ca2+ to the cytosol from mitochondria that occurs 2 min after the brief NMDA application is larger than the NMDA-induced cytosolic Ca2+ response (Fig. 4D). From these data, we conclude that mitochondria rapidly and efficiently buffer the Ca2+ influx through NMDARs in both WT and YAC128 MSNs.
The dramatically enhanced mitochondrial depolarization found in YAC128 MSNs during 5 min NMDA applications suggested that the mPT might be acutely activated in this paradigm. We therefore tested the effect of mPT inhibition on ΔΨm, maximal peak Ca2+ and subsequent recovery toward baseline. Cyclosporin A (CsA) (Fig. 5A), which binds cyclophilin D, showed no effect (p > 0.05 by paired t test) on NMDA-induced peak cytosolic Ca2+ in WT MSNs but significantly (*p < 0.05 by unpaired t test) reduced peak Ca2+ in YAC128 MSNs. CsA also tended to diminish simultaneously monitored NMDA-induced mitochondrial depolarization in YAC128 MSNs, although the effect was not significant (p > 0.05 by unpaired t test). Because CsA inhibits calcineurin as well as the mPT, we tested an alternate mPT inhibitor, bongkrekic acid (BkA) (Fig. 5B), which binds the adenine nucleotide transporter. BkA (5 μm) significantly reduced both peak Ca2+ (*p < 0.05, unpaired t test) and mitochondrial depolarization (*p < 0.05, unpaired t test) in YAC128 MSNs, without affecting either parameter (p > 0.05, unpaired t test) in WT MSNs. Neither of the mPT inhibitors had an effect on Ca2+ recovery rate over a 15 min period after NMDA application (data not shown).
Figure 5.

Effect of mPT inhibitors on peak cytosolic Ca2+ and ΔΨm in WT and YAC128 MSNs. Intracellular calcium was monitored using fura-FF in these experiments. A, Top, Peak cytosolic Ca2+ in WT (open bars; with 10 μm CsA: n = 6 experiments, 81 neurons total; without 10 μm CsA: n = 6 experiments, 109 neurons total; from 3–4 different culture batches) and YAC128 (filled bars; with 10 μm CsA: n = 5 experiments, 106 neurons total; without 10 μm CsA: n = 7 experiments, 88 neurons total; from 3–4 different culture batches) MSNs after 5 min of application of 500 μm NMDA, with or without 10 μm CsA in all solutions (as indicated). *p < 0.05 by unpaired t test comparing treatments within genotype (see Materials and Methods); data are expressed as mean ± SEM. Bottom, Concurrent changes in ΔΨm (ΔF/F); not significant by unpaired t test, data are expressed as mean ± SEM. B, Top, Peak cytosolic Ca2+ in WT (open bars; with BkA: n = 9 experiments, 135 cells total; without BkA: n = 10 experiments, 129 cells total; from 5 different culture batches) and YAC128 (filled bars; with 5 μm BkA: n = 10 experiments, 145 cells total; without 5 μm BkA: n = 9 experiments, 148 cells total; from 5 different culture batches) MSNs after 5 min of application of 500 μm NMDA, with or without 5 μm BkA in all solutions (as indicated). Bottom, Concurrent changes in ΔΨm (ΔF/F). *p < 0.05 by unpaired t test comparing treatments within genotype (see Materials and Methods); data are expressed as mean ± SEM.
Discussion
The YAC128 HD mouse model exhibits motor and cognitive changes consistent with human HD (Slow et al., 2003; Van Raamsdonk et al., 2005; Graham et al., 2006a), with selective striatal neurodegeneration (Slow et al., 2003), and enhanced MSN apoptosis after striatal quinolinate injection in vivo (Slow et al., 2005; Graham et al., 2006b). In YAC128 MSN cultures, NMDAR activation (vs other apoptotic stimuli) produces the largest increase in apoptosis (Shehadeh et al., 2006). Given results from YAC46 and YAC72 mice (Zeron et al., 2002, 2004; Shehadeh et al., 2006), these studies suggest a role for altered NMDAR signaling in MSN dysfunction and death. For the first time in the YAC128 model, we examined the relationship between the initiating event of NMDAR activation and downstream interactions between cytosolic Ca2+ and mitochondrial responses underlying enhanced apoptosis of MSNs.
Dissociation between NMDAR current and Ca2+ and ΔΨm changes in YAC128 MSNs
NMDAR peak current density increases with Htt polyQ length in MSNs cultured from YAC18, YAC46, and YAC72 mice (Fan et al., 2007). However, cultured WT and YAC128 MSNs exhibit comparable NMDAR current densities, similar to those of YAC18 MSNs (Fan et al., 2007). Thus, the correlation between Htt polyQ length and NMDAR current density in MSNs does not extend to more extreme repeat sizes. Basal activation levels of proteases and/or protein kinases/phosphatases that regulate NMDAR trafficking to and from the surface membrane may be altered as a result of increased cellular stress associated with the extreme polyQ expansion in YAC128 MSNs.
The IFN sensitivity of NMDARs in 9–11 DIV cultured MSNs, which lack glutamatergic input, is similar to that found in MSNs acutely isolated from 6- to 11-week-old mice, which lose many dendritic synapses during isolation. Thus, the relatively immature cultured MSNs express an NMDAR population similar to those on the soma of more mature neurons in vivo. Our results may reflect signaling largely by extrasynaptic NMDARs, distinct from the mainly triheteromeric (NR1/NR2A/NR2B) receptors found at corticostriatal synapses in vivo (Li et al., 2004).
In contrast to YAC46 and YAC72 MSNs (Zeron et al., 2004) (Table 1), but consistent with electrophysiological data presented here, we found no significant difference in NMDA-induced peak cytosolic Ca2+ between WT and YAC128 MSNs. Despite similar Ca2+ loads, YAC128 MSNs exhibited a dramatically enhanced change in ΔΨm downstream of NMDAR activation. Because NMDAR-mediated excitotoxicity depends on mitochondrial Ca2+ uptake and overload (Castilho et al., 1998; Stout et al., 1998), and the extent of loss of ΔΨm induced by Ca2+ uptake is an indicator for risk of subsequent apoptotic death (Schinder et al., 1996), our results help explain the exquisite sensitivity of YAC128 MSNs to NMDA-induced apoptosis.
Table 1.
NMDA-induced responses in cultured MSNs from YAC HD mouse models, compared with WT FVB/Na
| Genotype | Peak NMDAR current | Peak cytosolic Ca2+ | Loss of ΔΨm | Caspase 9 and 3 activation | Induction of apoptosis |
|---|---|---|---|---|---|
| YAC46 | ≅ | ↑ | ↑ | ↑ | ↑ |
| YAC72 | ↑ | ↑ | ↑ | ↑ | ↑↑ |
| YAC128 | ≅ | ≅ | ↑ | N.R. | ↑↑ |
N.R., Not reported.
aAggregate observations as reported by Zeron et al. (2002, 2004), Shehadeh et al. (2006), and Fan et al. (2007). FVB/N indicates mouse strain background for WT and YAC transgenic mice.
Acute NMDA-evoked mPT induction in YAC128 MSNs
The mPT inhibitors CsA and BkA significantly attenuated NMDA-induced peak Ca2+ in YAC128 MSNs. The change in ΔΨm was also reduced, whereas the recovery rate of the Ca2+ response was not significantly altered. Remarkably, the mPT is activated during a 5 min stimulation of NMDARs in YAC128 MSNs, suggesting early induction of apoptosis. NMDA-induced mPT activation in cultured WT rat MSNs required much longer exposures (>20 min) to 1 mm NMDA (Alano et al., 2002); indeed, we found no evidence of mPT activation during 5 min applications of NMDA in WT MSNs. Moreover, acute NMDA-induced mPT activation in YAC128 MSNs occurred in response to cytosolic Ca2+ levels observed in WT MSNs. YAC72 MSNs, in contrast, have increased NMDA-induced current, Ca2+ levels, and ΔΨm changes compared with WT MSNs (Zeron et al., 2004). Still, altered Ca2+ homeostasis and mitochondrial dysfunction play a role in enhanced NMDAR toxicity in YAC46 and YAC72 MSNs, because mitochondria isolated from these neurons are more sensitive to Ca2+-mediated mPT induction (Panov et al., 2002), and NMDAR currents are equivalent in YAC46 and WT MSNs, whereas NMDAR-mediated Ca2+ responses, mitochondrial depolarization, and apoptosis are all enhanced (Table 1) (Zeron et al., 2004; Fan et al., 2007). Therefore the relative contribution of different mechanisms whereby mHtt enhances NMDAR-mediated apoptosis may depend on CAG repeat length (Fig. 6).
Figure 6.

A general model for the main excitotoxic events in the various YAC HD models. Previous research established that enhanced NMDAR activation (step 1) leads to elevated peak cytosolic Ca2+ (step 2) and subsequent mitochondrial depolarization (step 3), caspase activation (step 4), and apoptosis (step 5) in YAC46 and YAC72 MSNs. In the YAC128 mouse model, steps 1 and 2 do not appear to play a role in the enhancement of apoptosis for YAC128 versus WT MSNs. The key excitotoxic step augmented in YAC128 MSNs occurs at the level of the mitochondria (step 3), but is still dependent on NMDAR activation. Thus, the increased sensitivity to NMDA-induced toxicity occurs at a later point in the sequence of events leading to apoptotic death in YAC128 compared with YAC72 MSNs. Delayed recovery from NMDA-induced Ca2+ loads in YAC128 MSNs may also serve to enhance calpain activity levels after intense NMDAR activity.
Several parallels exist between our observations in YAC128 MSNs and studies of mitochondrial dysfunction in HD patients. Lymphoblasts from HD patients are more susceptible to apoptosis, preceded by mitochondrial depolarization and caspase-3 activation (Sawa et al., 1999). Enhanced stress-induced mitochondrial depolarization was confirmed in mitochondria isolated from HD patients (Panov et al., 2002, 2005) or from normal individuals and exposed to GST-fusion proteins expressing an expanded polyQ region (Panov et al., 2003). When challenged with stepwise additions of calcium, mitochondria impaired by mHtt or a polyQ-containing protein depolarized at smaller calcium loads than control mitochondria (Panov et al., 2003, 2005). Strikingly, mitochondria isolated from lymphoblasts of adult-onset HD patients exhibited a threshold for calcium loads above which they completely depolarized, whereas mitochondria from juvenile-onset HD patients showed robust and progressive depolarization to each calcium addition, and complete depolarization occurred at comparatively small calcium loads (Panov et al., 2002). These data from human HD cells support our model that CAG repeat length modulates mechanisms underlying sensitivity to apoptosis.
Other studies suggest that mitochondrial function is abnormal in YAC128 MSNs. Cytosolic Ca2+ and ΔΨm responses to prolonged NMDAR stimulation are impaired in YAC128 MSNs under conditions of glycolytic inhibition and ATP depletion (Oliveira et al., 2006). In contrast, our results were obtained in YAC128 MSNs in their normal metabolic state, to elucidate events that could specifically lead to NMDAR-induced apoptosis (Shehadeh et al., 2006). Inhibitors of the mPT protect against glutamate-induced cell death in YAC128 (line 53) MSNs, further supporting our hypothesis that mPT induction enhances NMDAR-mediated apoptosis in YAC128 MSNs (Tang et al., 2005). Although the mechanisms underlying mHtt enhancement of sensitivity to calcium-induced mPT are not fully understood, mHtt may promote a H+ conductance to explain enhanced mitochondrial depolarization (Panov et al., 2005), and mHtt appears to directly facilitate the mPT by binding to mitochondrial membranes (Choo et al., 2004).
MHtt-induced impairment of Ca2+ homeostasis
Consistent with data from YAC128 line 53 MSNs (Tang et al., 2005), we found comparable resting cytosolic Ca2+ levels in WT and YAC128 MSNs. Cytosolic Ca2+ recovery is normal after 1 min stimulation of NMDARs, 5 min stimulation of VGCCs, or submaximal stimulation of NMDARs during inhibition of VGCCs. Our results suggest that differences in intracellular Ca2+ handling, such as mitochondrial buffering, become apparent during prolonged NMDA application that results in maximal Ca2+ loading (Alano et al., 2002; Zeron et al., 2004), as occurs with near-saturating NMDAR stimulation combined with VGCC activation. In support of this conclusion, of several stimuli that increased intracellular calcium levels, NMDA stimulation produced the largest enhancement of apoptosis in MSNs from YAC128 compared with YAC18 mice (Shehadeh et al., 2006).
Other intracellular Ca2+ stores and extrusion mechanisms likely contribute to impaired Ca2+ homeostasis. Indeed, mHtt enhances IP3 receptor (IP3R) sensitivity (Tang et al., 2003) and augments toxicity of mGluR1/5-mediated activation of IP3Rs in YAC128 MSNs (Tang et al., 2005), a mechanism unlikely to be activated in our paradigm. Consistent with our finding of slowed Ca2+ recovery after NMDAR activation in YAC128 MSNs, repetitive glutamate pulses produced a gradual Ca2+ elevation in YAC128 (line 53), but not WT MSNs over a similar time frame (Tang et al., 2005). The Na+/Ca2+ exchanger isoform 3 (NCX3) is cleaved by calpains in striatal tissue after focal ischemia and in cerebellar granule neurons under excitotoxic conditions (Bano et al., 2005). Similar calpain activation may occur in YAC128 MSNs after NMDAR activity, impairing an important homeostatic Ca2+ clearance route.
Impaired recovery of cytosolic Ca2+ in YAC128 MSNs after NMDA challenge may influence downstream toxic consequences mediated by Ca2+-activated pathways. In excitotoxic-resistant R6/2 mice, elevated resting Ca2+ in MSNs may cause neuronal dysfunction underlying behavioral deficits preceding neuronal death (Hansson et al., 2001). A similar phenomenon, stemming from cumulative dysfunction downstream of NMDAR activity, may manifest over time in YAC128 mice, which show behavioral changes preceding neuronal loss (Slow et al., 2003). Indeed, a number of factors impinging on the striatum, including relative enrichment of NR2B (Rigby et al., 1996), the presence of dopamine and other oxidative stressors, and an increased susceptibility of striatal mitochondria to Ca2+-induced mPT induction (Brustovetsky et al., 2003), may act synergistically with mHtt-induced deficits such as impairment of BDNF production (Zuccato et al., 2001), aberrant cortical presynaptic activity (Cepeda et al., 2003), and pathological changes reported here, to render MSNs particularly vulnerable in HD.
Summary
Our data indicate that intense NMDAR activation produces acute mitochondrial dysfunction, mPT activation, and inability to regulate cytosolic Ca2+ in YAC128 MSNs. Diverging from YAC models with shorter polyQ expansions, enhanced NMDA-induced apoptosis is largely determined by increased susceptibility to Ca2+-induced mitochondrial depolarization and mPT activation. These results may explain why equivalent NMDAR currents produce marked differences in apoptosis in YAC128 compared with WT MSNs and help to refine therapeutic strategies in YAC HD mouse models with different CAG sizes. Signaling pathways activated by strong NMDAR stimulation converge on mitochondria in all YAC HD models, suggesting that bolstering mitochondrial function and/or inhibiting the mPT are viable targets for ameliorating excitotoxicity-driven apoptosis in HD.
Footnotes
This work was supported by funding to the Fundamental Innovation in Neurodegenerative Diseases research unit from the Michael Smith Foundation for Health Research (MSFHR), as well as by operating grants to L.A.R. and M.R.H. from the High Q Foundation and the Canadian Institutes of Health Research (CIHR). H.B.F. is supported by a Landmark Graduate Award from the Huntington Society of Canada. L.A.R. is a CIHR Investigator and MSFHR Senior Scholar. M.R.H. holds a Canada Research Chair in Human Genetics and is a University Killam Professor. We gratefully acknowledge technical assistance from E. Yu and L. Zhang. We thank J. Shehadeh for helpful comments on this manuscript.
References
- Abdel-Hamid KM, Baimbridge KG. The effects of artificial calcium buffers on calcium responses and glutamate-mediated excitotoxicity in cultured hippocampal neurons. Neuroscience. 1997;81:673–687. doi: 10.1016/s0306-4522(97)00162-0. [DOI] [PubMed] [Google Scholar]
- Alano CC, Beutner G, Dirksen RT, Gross RA, Sheu SS. Mitochondrial permeability transition and calcium dynamics in striatal neurons upon intense NMDA receptor activation. J Neurochem. 80:531–538. doi: 10.1046/j.0022-3042.2001.00738.x. [DOI] [PubMed] [Google Scholar]
- Banke TG, Traynelis SF. Activation of NR1/NR2B NMDA receptors. Nat Neurosci. 2003;6:144–152. doi: 10.1038/nn1000. [DOI] [PubMed] [Google Scholar]
- Bano D, Young KW, Guerin CJ, Lefeuvre R, Rothwell NJ, Naldini L, Rizzuto R, Carafoli E, Nicotera P. Cleavage of the plasma membrane Na+/Ca2+ exchanger in excitotoxicity. Cell. 2005;120:275–285. doi: 10.1016/j.cell.2004.11.049. [DOI] [PubMed] [Google Scholar]
- Bittenbender JB, Quadfasel FA. Rigid and akinetic forms of Huntington's chorea. Arch Neurol. 1962;7:275–288. doi: 10.1001/archneur.1962.04210040027003. [DOI] [PubMed] [Google Scholar]
- Brinkman RR, Mezei MM, Theilmann J, Almqvist E, Hayden MR. The likelihood of being affected with Huntington disease by a particular age, for a specific CAG size. Am J Hum Genet. 1997;60:1202–1210. [PMC free article] [PubMed] [Google Scholar]
- Brocard JB, Tassetto M, Reynolds IJ. Quantitative evaluation of mitochondrial calcium content in rat cortical neurones following a glutamate stimulus. J Physiol (Lond) 2001;531:793–805. doi: 10.1111/j.1469-7793.2001.0793h.x. [DOI] [PMC free article] [PubMed] [Google Scholar]
- Brustovetsky N, Brustovetsky T, Purl KJ, Capano M, Crompton M, Dubinsky JM. Increased susceptibility of striatal mitochondria to calcium-induced permeability transition. J Neurosci. 2003;23:4858–4867. doi: 10.1523/JNEUROSCI.23-12-04858.2003. [DOI] [PMC free article] [PubMed] [Google Scholar]
- Castilho RF, Hansson O, Ward MW, Budd SL, Nicholls DG. Mitochondrial control of acute glutamate excitotoxicity in cultured cerebellar granule cells. J Neurosci. 1998;18:10277–10286. doi: 10.1523/JNEUROSCI.18-24-10277.1998. [DOI] [PMC free article] [PubMed] [Google Scholar]
- Cepeda C, Ariano MA, Calvert CR, Flores-Hernandez J, Chandler SH, Leavitt BR, Hayden MR, Levine MS. NMDA receptor function in mouse models of Huntington disease. J Neurosci Res. 2001;66:525–539. doi: 10.1002/jnr.1244. [DOI] [PubMed] [Google Scholar]
- Cepeda C, Hurst RS, Calvert CR, Hernandez-Echeagaray E, Nguyen OK, Jocoy E, Christian LJ, Ariano MA, Levine MS. Transient and progressive electrophysiological alterations in the corticostriatal pathway in a mouse model of Huntington's disease. J Neurosci. 2003;23:961–969. doi: 10.1523/JNEUROSCI.23-03-00961.2003. [DOI] [PMC free article] [PubMed] [Google Scholar]
- Cha JH. Transcriptional dysregulation in Huntington's disease. Trends Neurosci. 2000;23:387–392. doi: 10.1016/s0166-2236(00)01609-x. [DOI] [PubMed] [Google Scholar]
- Chen N, Luo T, Wellington C, Metzler M, McCutcheon K, Hayden MR, Raymond LA. Subtype-specific enhancement of NMDA receptor currents by mutant huntingtin. J Neurochem. 1999;72:1890–1898. doi: 10.1046/j.1471-4159.1999.0721890.x. [DOI] [PubMed] [Google Scholar]
- Chen N, Ren J, Raymond LA, Murphy TH. Changes in agonist concentration dependence that are a function of duration of exposure suggest N-methyl-d-aspartate receptor nonsaturation during synaptic stimulation. Mol Pharmacol. 2001;59:212–219. doi: 10.1124/mol.59.2.212. [DOI] [PubMed] [Google Scholar]
- Choo YS, Johnson GV, MacDonald M, Detloff PJ, Lesort M. Mutant huntingtin directly increases susceptibility of mitochondria to the calcium-induced permeability transition and cytochrome c release. Hum Mol Genet. 2004;13:1407–1420. doi: 10.1093/hmg/ddh162. [DOI] [PubMed] [Google Scholar]
- DeRidder MN, Simon MJ, Siman R, Auberson YP, Raghupathi R, Meaney DF. Traumatic mechanical injury to the hippocampus in vitro causes regional caspase-3 and calpain activation that is influenced by NMDA receptor subunit composition. Neurobiol Dis. 2006;22:165–176. doi: 10.1016/j.nbd.2005.10.011. [DOI] [PubMed] [Google Scholar]
- Fan MM, Raymond LA. N-Methyl-d-aspartate (NMDA) receptor function and excitotoxicity in Huntington's disease. Prog Neurobiol. 2007;81:272–293. doi: 10.1016/j.pneurobio.2006.11.003. [DOI] [PubMed] [Google Scholar]
- Fan MM, Fernandes HB, Zhang LY, Hayden MR, Raymond LA. Altered NMDA receptor trafficking in a yeast artificial chromosome transgenic mouse model of Huntington's disease. J Neurosci. 2007;27:3768–3779. doi: 10.1523/JNEUROSCI.4356-06.2007. [DOI] [PMC free article] [PubMed] [Google Scholar]
- Graham RK, Slow EJ, Deng Y, Bissada N, Lu G, Pearson J, Shehadeh J, Leavitt BR, Raymond LA, Hayden MR. Levels of mutant huntingtin influence the phenotypic severity of Huntington disease in YAC128 mouse models. Neurobiol Dis. 2006a;21:444–455. doi: 10.1016/j.nbd.2005.08.007. [DOI] [PubMed] [Google Scholar]
- Graham RK, Deng Y, Slow EJ, Haigh B, Bissada N, Lu G, Pearson J, Shehadeh J, Bertram L, Murphy Z, Warby SC, Doty CN, Roy S, Wellington CL, Leavitt BR, Raymond LA, Nicholson DW, Hayden MR. Cleavage at the caspase-6 site is required for neuronal dysfunction and degeneration due to mutant huntingtin. Cell. 2006b;125:1179–1191. doi: 10.1016/j.cell.2006.04.026. [DOI] [PubMed] [Google Scholar]
- Hansson O, Petersen A, Leist M, Nicotera P, Castilho RF, Brundin P. Transgenic mice expressing a Huntington's disease mutation are resistant to quinolinic acid-induced striatal excitotoxicity. Proc Natl Acad Sci USA. 1999;96:8727–8732. doi: 10.1073/pnas.96.15.8727. [DOI] [PMC free article] [PubMed] [Google Scholar]
- Hansson O, Guatteo E, Mercuri NB, Bernardi G, Li XJ, Castilho RF, Brundin P. Resistance to NMDA toxicity correlates with appearance of nuclear inclusions, behavioural deficits and changes in calcium homeostasis in mice transgenic for exon 1 of the huntington gene. Eur J Neurosci. 2001;14:1492–1504. doi: 10.1046/j.0953-816x.2001.01767.x. [DOI] [PubMed] [Google Scholar]
- Hardingham GE, Chawla S, Cruzalegui FH, Bading H. Control of recruitment and transcription-activating function of CBP determines gene regulation by NMDA receptors and L-type calcium channels. Neuron. 1999;22:789–798. doi: 10.1016/s0896-6273(00)80737-0. [DOI] [PubMed] [Google Scholar]
- Hodgson JG, Agopyan N, Gutekunst CA, Leavitt BR, LePiane F, Singaraja R, Smith DJ, Bissada N, McCutcheon K, Nasir J, Jamot L, Li XJ, Stevens ME, Rosemond E, Roder JC, Phillips AG, Rubin EM, Hersch SM, Hayden MR. A YAC mouse model for Huntington's disease with full-length mutant huntingtin, cytoplasmic toxicity, and selective striatal neurodegeneration. Neuron. 1999;23:181–192. doi: 10.1016/s0896-6273(00)80764-3. [DOI] [PubMed] [Google Scholar]
- Hyrc K, Handran SD, Rothman SM, Goldberg MP. Ionized intracellular calcium concentration predicts excitotoxic neuronal death: observations with low-affinity fluorescent calcium indicators. J Neurosci. 1997;17:6669–6677. doi: 10.1523/JNEUROSCI.17-17-06669.1997. [DOI] [PMC free article] [PubMed] [Google Scholar]
- Kim MJ, Dunah AW, Wang YT, Sheng M. Differential roles of NR2A- and NR2B-containing NMDA receptors in Ras-ERK signaling and AMPA receptor trafficking. Neuron. 2005;46:745–760. doi: 10.1016/j.neuron.2005.04.031. [DOI] [PubMed] [Google Scholar]
- Kim YJ, Yi Y, Sapp E, Wang Y, Cuiffo B, Kegel KB, Qin ZH, Aronin N, DiFiglia M. Caspase 3-cleaved N-terminal fragments of wild-type and mutant huntingtin are present in normal and Huntington's disease brains, associate with membranes, and undergo calpain-dependent proteolysis. Proc Natl Acad Sci USA. 2001;98:12784–12789. doi: 10.1073/pnas.221451398. [DOI] [PMC free article] [PubMed] [Google Scholar]
- Kovacs AD, Cebers G, Cebere A, Moreira T, Liljequist S. Cortical and striatal neuronal cultures of the same embryonic origin show intrinsic differences in glutamate receptor expression and vulnerability to excitotoxicity. Exp Neurol. 2001;168:47–62. doi: 10.1006/exnr.2000.7576. [DOI] [PubMed] [Google Scholar]
- Laforet GA, Sapp E, Chase K, McIntyre C, Boyce FM, Campbell M, Cadigan BA, Warzecki L, Tagle DA, Reddy PH, Cepeda C, Calvert CR, Jokel ES, Klapstein GJ, Ariano MA, Levine MS, DiFiglia M, Aronin N. Changes in cortical and striatal neurons predict behavioral and electrophysiological abnormalities in a transgenic murine model of Huntington's disease. J Neurosci. 2001;21:9112–9123. doi: 10.1523/JNEUROSCI.21-23-09112.2001. [DOI] [PMC free article] [PubMed] [Google Scholar]
- Leavitt BR, Guttman JA, Hodgson JG, Kimel GH, Singaraja R, Vogl AW, Hayden MR. Wild-type huntingtin reduces the cellular toxicity of mutant huntingtin in vivo. Am J Hum Genet. 2001;68:313–324. doi: 10.1086/318207. [DOI] [PMC free article] [PubMed] [Google Scholar]
- Li L, Murphy TH, Hayden MR, Raymond LA. Enhanced striatal NR2B-containing N-methyl-d-aspartate receptor-mediated synaptic currents in a mouse model of Huntington disease. J Neurophysiol. 2004;92:2738–2746. doi: 10.1152/jn.00308.2004. [DOI] [PubMed] [Google Scholar]
- Li S, Tian X, Hartley DM, Feig LA. Distinct roles for Ras-guanine nucleotide-releasing factor 1 (Ras-GRF1) and Ras-GRF2 in the induction of long-term potentiation and long-term depression. J Neurosci. 2006;26:1721–1729. doi: 10.1523/JNEUROSCI.3990-05.2006. [DOI] [PMC free article] [PubMed] [Google Scholar]
- Liu L, Wong TP, Pozza MF, Lingenhoehl K, Wang Y, Sheng M, Auberson YP, Wang YT. Role of NMDA receptor subtypes in governing the direction of hippocampal synaptic plasticity. Science. 2004;304:1021–1024. doi: 10.1126/science.1096615. [DOI] [PubMed] [Google Scholar]
- Luthi-Carter R, Strand A, Peters NL, Solano SM, Hollingsworth ZR, Menon AS, Frey AS, Spektor BS, Penney EB, Schilling G, Ross CA, Borchelt DR, Tapscott SJ, Young AB, Cha JH, Olson JM. Decreased expression of striatal signaling genes in a mouse model of Huntington's disease. Hum Mol Genet. 2000;9:1259–1271. doi: 10.1093/hmg/9.9.1259. [DOI] [PubMed] [Google Scholar]
- Massey PV, Johnson BE, Moult PR, Auberson YP, Brown MW, Molnar E, Collingridge GL, Bashir ZI. Differential roles of NR2A and NR2B-containing NMDA receptors in cortical long-term potentiation and long-term depression. J Neurosci. 2004;24:7821–7828. doi: 10.1523/JNEUROSCI.1697-04.2004. [DOI] [PMC free article] [PubMed] [Google Scholar]
- Mayer ML, Vyklicky L, Jr, Westbrook GL. Modulation of excitatory amino acid receptors by group IIB metal cations in cultured mouse hippocampal neurones. J Physiol (Lond) 1989;415:329–350. doi: 10.1113/jphysiol.1989.sp017724. [DOI] [PMC free article] [PubMed] [Google Scholar]
- Oliveira JM, Chen S, Almeida S, Riley R, Goncalves J, Oliveira CR, Hayden MR, Nicholls DG, Ellerby LM, Rego AC. Mitochondrial-dependent Ca2+ handling in Huntington's disease striatal cells: effect of histone deacetylase inhibitors. J Neurosci. 2006;26:11174–11186. doi: 10.1523/JNEUROSCI.3004-06.2006. [DOI] [PMC free article] [PubMed] [Google Scholar]
- Panov AV, Lund S, Greenamyre JT. Ca2+-induced permeability transition in human lymphoblastoid cell mitochondria from normal and Huntington's disease individuals. Mol Cell Biochem. 2005;269:143–152. doi: 10.1007/s11010-005-3454-9. [DOI] [PubMed] [Google Scholar]
- Panov AV, Burke JR, Strittmatter WJ, Greenamyre JT. In vitro effects of polyglutamine tracts on Ca2+-dependent depolarization of rat and human mitochondria: relevance to Huntington's disease. Arch Biochem Biophys. 2003;410:1–6. doi: 10.1016/s0003-9861(02)00585-4. [DOI] [PubMed] [Google Scholar]
- Panov AV, Gutekunst CA, Leavitt BR, Hayden MR, Burke JR, Strittmatter WJ, Greenamyre JT. Early mitochondrial calcium defects in Huntington's disease are a direct effect of polyglutamines. Nat Neurosci. 2002;5:731–736. doi: 10.1038/nn884. [DOI] [PubMed] [Google Scholar]
- Rigby M, Le Bourdelles B, Heavens RP, Kelly S, Smith D, Butler A, Hammans R, Hills R, Xuereb JH, Hill RG, Whiting PJ, Sirinathsinghji DJ. The messenger RNAs for the N-methyl-d-aspartate receptor subunits show region-specific expression of different subunit composition in the human brain. Neuroscience. 1996;73:429–447. doi: 10.1016/0306-4522(96)00089-9. [DOI] [PubMed] [Google Scholar]
- Ross CA. Polyglutamine pathogenesis: emergence of unifying mechanisms for Huntington's disease and related disorders. Neuron. 2002;35:819–822. doi: 10.1016/s0896-6273(02)00872-3. [DOI] [PubMed] [Google Scholar]
- Sawa A, Wiegand GW, Cooper J, Margolis RL, Sharp AH, Lawler JF, Jr, Greenamyre JT, Snyder SH, Ross CA. Increased apoptosis of Huntington disease lymphoblasts associated with repeat length-dependent mitochondrial depolarization. Nat Med. 1999;5:1194–1198. doi: 10.1038/13518. [DOI] [PubMed] [Google Scholar]
- Schinder AF, Olson EC, Spitzer NC, Montal M. Mitochondrial dysfunction is a primary event in glutamate neurotoxicity. J Neurosci. 1996;16:6125–6133. doi: 10.1523/JNEUROSCI.16-19-06125.1996. [DOI] [PMC free article] [PubMed] [Google Scholar]
- Shehadeh J, Fernandes HB, Zeron Mullins MM, Graham RK, Leavitt BR, Hayden MR, Raymond LA. Striatal neuronal apoptosis is preferentially enhanced by NMDA receptor activation in YAC transgenic mouse model of Huntington disease. Neurobiol Dis. 2006;21:392–403. doi: 10.1016/j.nbd.2005.08.001. [DOI] [PubMed] [Google Scholar]
- Shi WX, Rayport S. GABA synapses formed in vitro by local axon collaterals of nucleus accumbens neurons. J Neurosci. 1994;14:4548–4560. doi: 10.1523/JNEUROSCI.14-07-04548.1994. [DOI] [PMC free article] [PubMed] [Google Scholar]
- Slow EJ, van Raamsdonk J, Rogers D, Coleman SH, Graham RK, Deng Y, Oh R, Bissada N, Hossain SM, Yang YZ, Li XJ, Simpson EM, Gutekunst CA, Leavitt BR, Hayden MR. Selective striatal neuronal loss in a YAC128 mouse model of Huntington disease. Hum Mol Genet. 2003;12:1555–1567. doi: 10.1093/hmg/ddg169. [DOI] [PubMed] [Google Scholar]
- Slow EJ, Graham RK, Osmand AP, Devon RS, Lu G, Deng Y, Pearson J, Vaid K, Bissada N, Wetzel R, Leavitt BR, Hayden MR. Absence of behavioral abnormalities and neurodegeneration in vivo despite widespread neuronal huntingtin inclusions. Proc Natl Acad Sci USA. 2005;102:11402–11407. doi: 10.1073/pnas.0503634102. [DOI] [PMC free article] [PubMed] [Google Scholar]
- Stout AK, Reynolds IJ. High-affinity calcium indicators underestimate increases in intracellular calcium concentrations associated with excitotoxic glutamate stimulations. Neuroscience. 1999;89:91–100. doi: 10.1016/s0306-4522(98)00441-2. [DOI] [PubMed] [Google Scholar]
- Stout AK, Raphael HM, Kanterewicz BI, Klann E, Reynolds IJ. Glutamate-induced neuron death requires mitochondrial calcium uptake. Nat Neurosci. 1998;1:366–373. doi: 10.1038/1577. [DOI] [PubMed] [Google Scholar]
- Strong TV, Tagle DA, Valdes JM, Elmer LW, Boehm K, Swaroop M, Kaatz KW, Collins FS, Albin RL. Widespread expression of the human and rat Huntington's disease gene in brain and nonneural tissues. Nat Genet. 1993;5:259–265. doi: 10.1038/ng1193-259. [DOI] [PubMed] [Google Scholar]
- Tang TS, Tu H, Chan EY, Maximov A, Wang Z, Wellington CL, Hayden MR, Bezprozvanny I. Huntingtin and huntingtin-associated protein 1 influence neuronal calcium signaling mediated by inositol-(1,4,5) triphosphate receptor type 1. Neuron. 2003;39:227–239. doi: 10.1016/s0896-6273(03)00366-0. [DOI] [PMC free article] [PubMed] [Google Scholar]
- Tang TS, Slow E, Lupu V, Stavrovskaya IG, Sugimori M, Llinas R, Kristal BS, Hayden MR, Bezprozvanny I. Disturbed Ca2+ signaling and apoptosis of medium spiny neurons in Huntington's disease. Proc Natl Acad Sci USA. 2005;102:2602–2607. doi: 10.1073/pnas.0409402102. [DOI] [PMC free article] [PubMed] [Google Scholar]
- Toescu EC, Verkhratsky A. Assessment of mitochondrial polarization status in living cells based on analysis of the spatial heterogeneity of rhodamine 123 fluorescence staining. Pflügers Arch. 2000;440:941–947. doi: 10.1007/s004240000390. [DOI] [PubMed] [Google Scholar]
- van Dijk JG, van der Velde EA, Roos RA, Bruyn GW. Juvenile Huntington disease. Hum Genet. 1986;73:235–239. doi: 10.1007/BF00401235. [DOI] [PubMed] [Google Scholar]
- Van Raamsdonk JM, Pearson J, Slow EJ, Hossain SM, Leavitt BR, Hayden MR. Cognitive dysfunction precedes neuropathology and motor abnormalities in the YAC128 mouse model of Huntington's disease. J Neurosci. 2005;25:4169–4180. doi: 10.1523/JNEUROSCI.0590-05.2005. [DOI] [PMC free article] [PubMed] [Google Scholar]
- Vonsattel JP, Myers RH, Stevens TJ, Ferrante RJ, Bird ED, Richardson EP., Jr Neuropathological classification of Huntington's disease. J Neuropathol Exp Neurol. 1985;44:559–577. doi: 10.1097/00005072-198511000-00003. [DOI] [PubMed] [Google Scholar]
- Wellington CL, Ellerby LM, Gutekunst CA, Rogers D, Warby S, Graham RK, Loubser O, van Raamsdonk J, Singaraja R, Yang YZ, Gafni J, Bredesen D, Hersch SM, Leavitt BR, Roy S, Nicholson DW, Hayden MR. Caspase cleavage of mutant huntingtin precedes neurodegeneration in Huntington's disease. J Neurosci. 2002;22:7862–7872. doi: 10.1523/JNEUROSCI.22-18-07862.2002. [DOI] [PMC free article] [PubMed] [Google Scholar]
- Williams K. Ifenprodil discriminates subtypes of the N-methyl-d-aspartate receptor: selectivity and mechanisms at recombinant heteromeric receptors. Mol Pharmacol. 1993;44:851–859. [PubMed] [Google Scholar]
- Xiong J, Verkhratsky A, Toescu EC. Changes in mitochondrial status associated with altered Ca2+ homeostasis in aged cerebellar granule neurons in brain slices. J Neurosci. 2002;22:10761–10771. doi: 10.1523/JNEUROSCI.22-24-10761.2002. [DOI] [PMC free article] [PubMed] [Google Scholar]
- Zeron MM, Hansson O, Chen N, Wellington CL, Leavitt BR, Brundin P, Hayden MR, Raymond LA. Increased sensitivity to N-methyl-d-aspartate receptor-mediated excitotoxicity in a mouse model of Huntington's disease. Neuron. 2002;33:849–860. doi: 10.1016/s0896-6273(02)00615-3. [DOI] [PubMed] [Google Scholar]
- Zeron MM, Fernandes HB, Krebs C, Shehadeh J, Wellington CL, Leavitt BR, Baimbridge KG, Hayden MR, Raymond LA. Potentiation of NMDA receptor-mediated excitotoxicity linked with intrinsic apoptotic pathway in YAC transgenic mouse model of Huntington's disease. Mol Cell Neurosci. 2004;25:469–479. doi: 10.1016/j.mcn.2003.11.014. [DOI] [PubMed] [Google Scholar]
- Zuccato C, Ciammola A, Rigamonti D, Leavitt BR, Goffredo D, Conti L, MacDonald ME, Friedlander RM, Silani V, Hayden MR, Timmusk T, Sipione S, Cattaneo E. Loss of huntingtin-mediated BDNF gene transcription in Huntington's disease. Science. 2001;293:493–498. doi: 10.1126/science.1059581. [DOI] [PubMed] [Google Scholar]