

Abstract
Long-term potentiation (LTP), a cellular model of learning and memory, produces both an enhancement of synaptic function and an increase in the size of the associated dendritic spine. Synaptic insertion of AMPA receptors is known to play an important role in mediating the increase in synaptic strength during LTP, whereas the role of AMPA receptor trafficking in structural changes remains unexplored. Here, we examine how the cell maintains the correlation between spine size and synapse strength during LTP. We found that cells exploit an elegant solution by linking both processes to a single molecule: the AMPA-type glutamate receptor subunit 1 (GluR1). Synaptic insertion of GluR1 is required to permit a stable increase in spine size, both in hippocampal slice cultures and in vivo. Synaptic insertion of GluR1 is not sufficient to drive structural plasticity. Although crucial to the expression of LTP, the ion channel function of GluR1 is not required for the LTP-driven spine size enhancement. Remarkably, a recombinant cytosolic C-terminal fragment (C-tail) of GluR1 is driven to the postsynaptic density after an LTP stimulus, and the synaptic incorporation of this isolated GluR1 C-tail is sufficient to permit spine enlargement even when postsynaptic exocytosis of endogenous GluR1 is blocked. We conclude that during plasticity, synaptic insertion of GluR1 has two functions: the established role of increasing synaptic strength via its ligand-gated ion channel, and a novel role through the structurally stabilizing effect of its C terminus that permits an increase in spine size.
Keywords: long-term potentiation, AMPA receptor, GluR1, spine, morphology, actin
Introduction
Dendritic spines are femtoliter-sized protrusions on dendritic shafts that receive the majority of excitatory synapses (Cajal, 1891; Harris et al., 1992). There are several observations indicating that spine size, which can range over two orders of magnitude, is likely to be important. For example, larger spines can greatly outlast small spines (months compared with hours) (Holtmaat et al., 2005). Most importantly, large spines contain large synapses (Harris et al., 1992) with more glutamate-sensitive AMPA receptors (Baude et al., 1995; Nusser et al., 1998; Kharazia and Weinberg, 1999; Takumi et al., 1999) and hence are functionally stronger than small spines. This robust positive correlation between spine size and synaptic strength is maintained in the face of plasticity (Matsuzaki et al., 2004; Kopec et al., 2006). However, the mechanism(s) maintaining the balance between synaptic strength and spine size are not known.
One may hypothesize that strong synapses require large spines because they contain more proteins. However, overexpression of the synaptic scaffolding protein postsynaptic density-95 (PSD-95) increases synaptic strength by increasing the number of postsynaptic AMPA receptors (El-Husseini et al., 2000; Stein et al., 2003) without greatly affecting spine size (Ehrlich and Malinow, 2004). Indeed, data from electron microscopy (EM) show that synapses occupy only 10% of the spine surface (Harris et al., 1992) and postsynaptic densities only 10% of the spine volume (Stewart et al., 2005). Therefore, the mechanisms coordinating spine size with synaptic strength are not trivial.
Interestingly, structural changes in spines appear to precede, by minutes, the accumulation of AMPA receptors on their surface, suggesting that these processes, although correlated, may be controlled by separate processes (Kopec et al., 2006). Rearrangements of the actin cytoskeleton have been shown to drive changes in spine morphology (Fischer et al., 1998; Halpain et al., 1998; Dunaevsky et al., 1999; Tolias et al., 2005), and long-term potentiation (LTP) is accompanied by an increase of filamentous actin in spines (Fukazawa et al., 2003; Lin et al., 2005). Other studies have investigated the increase in synaptic strength during LTP, showing the requirement for exocytosis and synaptic insertion of AMPA-type glutamate receptor subunit 1 (GluR1)-containing AMPA receptors (AMPARs) (Lledo et al., 1998; Hayashi et al., 2000; Lu et al., 2001; Shi et al., 2001; Park et al., 2004). The cytoplasmic tail of GluR1 plays a prominent role in guiding activity-dependent trafficking of the receptor to synapses during plasticity (Shi et al., 2001).
How could spine size and synapse strength be mechanistically linked? One can imagine that an LTP-induced calcium influx initiates two independent cascades: one leading to exocytosis and synaptic incorporation of GluR1, whereas the other activates actin polymerization driving spine enlargement. In order for spine size and synapse strength to always be correlated, not only must the rates of these pathways be balanced, but they must be robust against stochastic noise induced by the random fluctuations of the small number of molecules involved. Another possibility is that these two pathways are linked downstream of the initial stimulus, thereby removing the need for perfectly balanced rates while increasing robustness.
Here, we examine how and whether spine enlargement and synaptic delivery of GluR1 are linked. Surprisingly, we found that insertion of the cytoplasmic tail of the GluR1 receptor into synapses does not drive spine enlargement but is necessary and sufficient to permit a stable increase in spine size during LTP-inducing stimuli. Thus, a single receptor subunit can provide a link between two important subcellular processes.
Materials and Methods
Constructs.
tDimer dsRed was kindly provided by Dr. Roger Tsien and cloned into pCI. Super Ecliptic pHluorin (SEP) kindly provided by Dr. Gero Miesenbock, Yale University, New Haven, CT) was cloned 3 amino acids downstream of the predicted signal peptide of GluR1 in pCI. Mutagenesis accomplished using PCR-based QuikChange protocol (Stratagene, La Jolla, CA). Enhanced green fluorescent protein (eGFP)-GluR1-C-tail peptide consists of GluR1 amino acids 809–889 (all residues following the final transmembrane domain) cloned into peGFP, with eGFP as an N-terminal fusion. Untagged PSD-95 consists of the full sequence cloned in pDNR. Syntaxin-13 (kindly provided by Dr. Andrew Bean, University of Texas Medical School, Houston, TX) was PCR amplified from amino acid 1–245 (ΔTM, lacking the transmembrane domain) and cloned into peGFP, with eGFP as an N-terminal fusion. Sindbis virus constructs consist of SEP-GluR1, SEP-GluR1 3A (S818A, S831A, S845A), eGFP, eGFP-GluR1[Pore Dead (PD)] (Q582E), eGFP-GluR1(T887A)-C-tail cloned into pSinRep5. For dual expressing virus, constructs were cloned into pSinEGdsp#9 (vector kindly provided by Dr. Hiroyuki Nawa, Niigata University, Niigata, Japan). These consist of tDimer-GluR1-C-tail plus eGFP-Syn13ΔTM and tD-Tomato (kindly provided by Dr. Roger Tsien, University of California, San Diego, CA) plus SEP-GluR1 [wild type (wt), PD, T887A, or 3A].
Transfection and imaging.
Organotypic hippocampal slice cultures were prepared as described previously (Stoppini et al., 1991) from postnatal day 6 (P6) to P7 rat pups. Cultures were maintained for 17–19 d in vitro (DIV) before transfection with biolistic techniques (Gene Gun; Bio-Rad, Hercules, CA). Cells were allowed to express for 48–72 h before imaging (Syn13ΔTM constructs were only allowed a maximum of 24 h; experiments involving PSD-95 were conducted between 42 and 48 h). Transfected CA1 pyramidal neurons were identified under epifluorescence, and a standard region ∼250 μm along the apical dendrite from the soma, near the first primary bifurcation, was chosen for imaging.
Slices were maintained in constant perfusion during imaging. The solution consisted of ACSF (in mm: 119 NaCl, 26 NaHCO3, 1 NaH2PO4, 11 d-glucose, 2.5 KCl, 4 CaCl2, 4 MgCl2, and 1.25 NaHPO4) gassed with 95% O2 and 5% CO2, and maintained at 30°C. The imaging chamber measures <1 ml to allow rapid introduction and removal of drugs.
Images were acquired on a custom built dual channel 2-photon laser-scanning microscope (based on Olympus Fluoview laser-scanning microscope) using a Ti:Sapphire Chameleon laser (Coherent, Kitchener, Ontario, Canada) mode-locked to 910 nm. Full three-dimensional (3D) image stacks were acquired using a 60× 0.9 NA objective lens at 5× digital zoom (Fluoview software; Olympus), 70 nm per pixel. Each image plane was resampled three times and spaced 0.5 μm in the Z-dimension.
Chemically induced LTP.
ChemLTP is induced as described previously (Otmakhov et al., 2004; Kopec et al., 2006). Slices were imaged in basal ACSF (above) with 4 μm 2-chloroadenosine (to lower spontaneous activity) at −30 min and −10 min relative to induction. At time 0 min, the perfusion was switched to LTP induction solution (ACSF with 0 mm Mg2+, 4 mm Ca2+, 100 nm rolipram, 50 μm forskolin, and 100 μm picrotoxin; drugs dissolved in DMSO at 1000×). Ten milliliters were allowed to flow through before recycling to prevent mixing of solution. At 16 min, the perfusion was switched back to basal solution, again allowing 10 ml to flow through before recycling to prevent mixing. Images were acquired at +5 min (during) and +40 and +70 min (after) relative to induction initiation.
In experiments using SEP-GluR1(PD), slices following infection were maintained in media containing 100 μm APV. APV was removed before imaging.
Image analysis.
Full 3D images were analyzed using a custom written MatLab-based software package. All spines present in baseline images were chosen for analysis and therefore blind to outcome. Regions of interest (ROIs) were manually placed over spines. Spines manually identified under visual inspection as regions of fluorescence protruding from the dendritic shaft present in a minimum of three consecutive Z-stacks. Peak integrated fluorescence was >3 SDs above background fluorescence. Analysis was performed as described previously (Kopec et al., 2006). Integrated fluorescence within the ROI was plotted as a function of Z-depth. Background, defined as the lowest mean of 10 consecutive stacks, was determined independently for each ROI and subtracted for each channel. Cross talk between channels was removed (values were determined by expressing each fluorophore independently). Spine Z-boundaries were defined as the full width at half maximum (FWHM) in the background subtracted, cross talk corrected, integrated data. ROI boundaries were manually defined in the X-Y dimensions, because dendritic fluorescence is routinely continuous with that of the spine. Automated boundary detection was used in the Z dimension for four reasons: (1) this speeds up the analysis; (2) it ensures the analysis is more uniform and less subject to experimenter bias; (3) the point spread function of the laser is four to five times more extended in this dimension making manual boundary detection more difficult; and (4) because of the previous reason, spines above and below the dendrite are never analyzed; therefore, the dendritic fluorescence is not continuous with spine fluorescence in the Z dimension making automated boundary detection possible. Spine data are the integrated red and green fluorescence within these boundaries (X, Y defined by ROI; Z defined by FWHM). Data for each spine were normalized to the value of that spine at the −10 min time point. The mean was taken of normalized data from all spines for each time point. Significant difference between means was determined by two-tailed t test. The Kolmogorov–Smirnov test was used for cumulative distributions. In each experiment, data from only one dendrite were collected per slice, so we sampled across dendrites and slices equally. Data were collected across a minimum of three dendrites, two animals, and two litters. We used bootstrap analysis to ensure that we were accurately sampling all sources of variance and that collecting data from multiple spines per neuron did not introduce any significant error to our measurements. We found that 3.7 times more variance in spine volume is present within a cell than between them, and 4.7 times more variance in spine volume within a cell than between animals.
Enrichment serves as a relative measure of protein localization in or on spines (Kopec et al., 2006) and is defined as: (integrated spine green fluorescence/integrated spine red fluorescence)/(mean dendrite green/mean dendrite red fluorescence). Significance for cumulative distributions was determined using the Kolmogorov–Smirnov test.
Infection and electrophysiology.
Sindbis virus, prepared as described previously (Hayashi et al., 2000), was injected into 8–11 DIV slice cultures. For each experiment, except for the dual expressing virus, the investigator was blind as to the virus injected. Cells were allowed to express for 24 h before recording. Just before recording, a cut was made between CA3 and CA1 to prevent stimulus induced bursting. Infected CA1 neurons were identified under epifluorescence. Two stimulating electrodes, 2-contact Pt/Ir cluster electrode (Frederick Haer, Bowdoinham, ME), were placed 200 and 300 μm down the apical dendrite and 250 μm laterally in opposite directions. Whole-cell recordings were obtained with Axopatch-1D amplifiers (Molecular Devices, Foster City, CA) using 3–5 MΩ glass pipettes with an internal solution containing the following (in mm): 115 cesium methanesulfonate, 20 CsCl, 10 HEPES, 2.5 MgCl2, 4 Na2ATP, 0.4 Na3GTP, 10 sodium phosphocreatine, 0.6 EGTA, and 0.1 spermine, at pH 7.25. Pairing and control pathways were chosen randomly. External perfusion consisted of ACSF at 27°C (see above) with 4 mm Mg2+, 4 mm Ca2+, 4 μm 2-chloroadenosine, 100 μm picrotoxin, and 1 nm tetrodotoxin (to prevent stimulus-induced bursting). EPSCs were recorded while holding the cells at −60 mV, alternating pathways every 1.5 s. LTP induction was achieved by holding the cell at 0 mV and stimulating one pathway at 3 Hz for 3 min. Data were normalized to baseline, and every 12 sweeps were binned and averaged. Significance was determined by two-tailed t test on 5 min blocks of data.
To test for an effect of GluR1(PD) on LTP, slices 12–14 DIV were infected with Sindbis virus expressing GFP-GluR1(PD) and maintained in media containing 100 μm APV. We found that in the absence of APV, expression of SEP-GluR1(PD) produced depressed transmission (77%; p = 0.05; n = 12), presumably by spontaneous activity-dependent synaptic incorporation of SEP-GluR1(PD), because there was no significant depression when slices were maintained in APV (89%; p = 0.36; n = 14). Two days after infection, slices were bathed in ACSF for 10 min to wash out APV and then exposed to chemLTP protocol. One to 2 h after chemLTP protocol, whole-cell recordings were obtained from infected and noninfected neighboring pairs of neurons. Transmission evoked onto an infected cell was depressed relative to a nearby noninfected cell (see Fig. 3E2).
Figure 3.
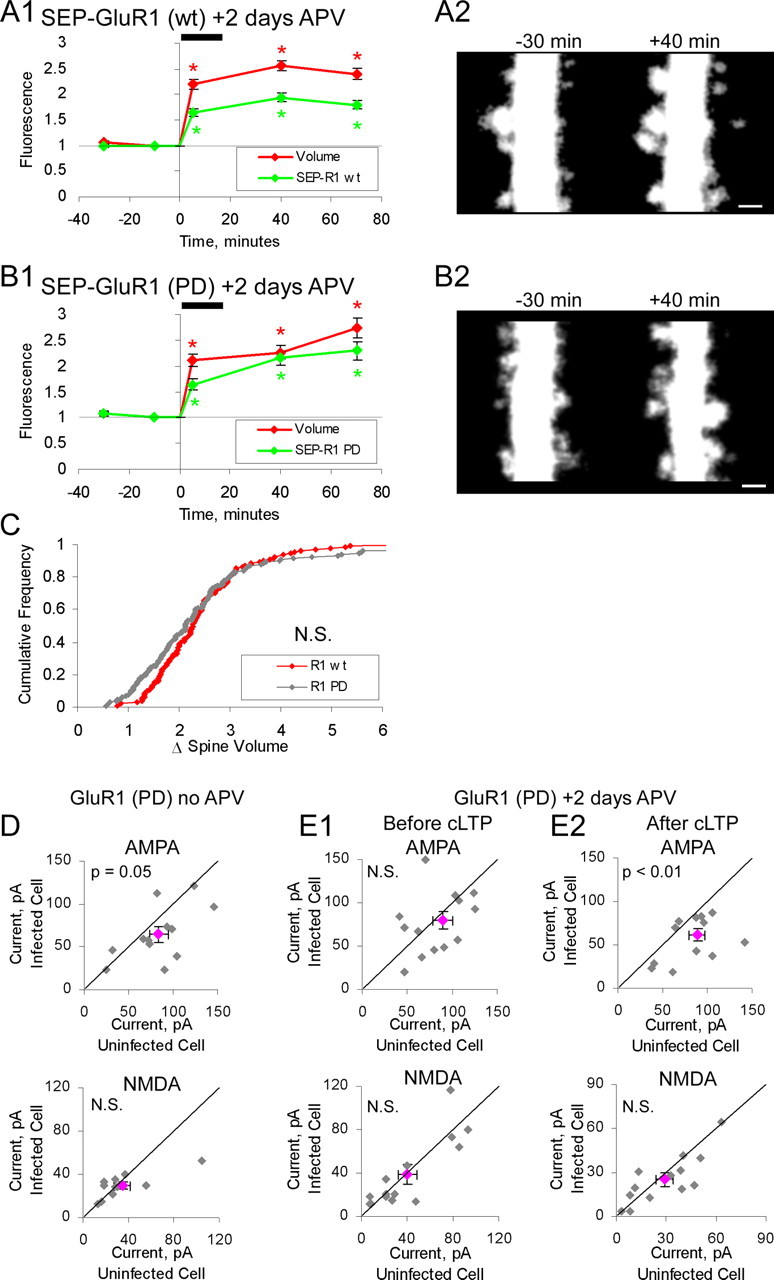
Ion channel function of GluR1 is not required for it to permit spine enlargement. A1, A2, Neurons expressing SEP-GluR1(wt) and tDimer (n = 124 spines; 3 cells). Slices incubated in 100 μm APV during 2 d expression period. APV was removed before imaging. A1, Mean spine volume (integrated red fluorescence) and spine SEP-GluR1 (integrated green fluorescence) relative to chemLTP induction. Values are normalized to −10 min time point (*p < 0.05). A2, Sample images obtained at indicated times relative to chemLTP induction (red channel only). Images are displayed as in Figure 2. B1, B2, Same as A for neurons expressing SEP-GluR1(PD) and tDimer (n = 145 spines; 3 cells). Slices treated as in A. B1, Mean spine volume (integrated red fluorescence) and spine SEP-GluR1(PD) (integrated green fluorescence) relative to chemLTP induction. B2, Sample images obtained at indicated times relative to chemLTP induction (red channel only). Images are displayed as in Figure 2. Scale bars, 1 μm. C, Cumulative distribution of fold spine volume change during chemLTP from cells expressing SEP-GluR1(wt) or SEP-GluR1(PD). Fold volume change is defined as in Figure 2. D, E, Paired whole-cell recordings of AMPAR- and NMDAR-mediated synaptic currents from uninfected cells and neighboring infected cells expressing GFP-GluR1(PD). Slices are treated as in A. AMPAR component defined as peak amplitude at −60 mV holding potential. NMDAR component is defined as mean amplitude from 110–160 ms after peak at +40 mV holding potential. Gray points, Individual data points; pink point, mean data point. D, Slice cultures not incubated in APV during the expression period (n = 12; AMPA, p = 0.05). E1, Neurons before cLTP induction (n = 14; AMPA, p = 0.36). E2, Neurons after cLTP induction (n = 14; AMPA, p < 0.01). Error bars represent SEM.
For input–output curves and whole-cell recordings during chemLTP, a potassium-based internal solution was used (in mm: 130 potassium gluconate, 5 potassium chloride, 10 HEPES, 2.5 magnesium chloride, 4 Na2ATP, 0.4 NaGTP, 10 sodium-phosphocreatine, 0.6 EGTA at pH 7.25), and cells were held in current clamp. For input–output curves, 250 ms current steps were applied every 10 s. Data from each cell (counted as one independent observation) were the average from three progressions through the full series of steps. Action potentials were identified visually. For chemLTP recordings, cells were maintained in current clamp with no external current applied. Action potentials were identified using a custom written MatLab-based program. Interspike intervals were defined as the time between a pair of consecutive spikes occurring between cells in a paired recording.
In vivo infection and imaging.
The procedure was performed similar to that in the study by Qin et al. (2005). Briefly, pups were anesthetized with a mixture of ketamine (1:20) and Dormitor (1:20) and placed in a stereotaxic setup. A 2 × 2 mm window was removed from both hemispheres over the somatosensory cortex above the dorsal hippocampus. A glass electrode was used to deliver the virus into the CA1 region of the hippocampus. Pressure was applied via a pico-spritzer. The bone was replaced over the window, and the incision was closed. The animals were injected with 100 μl AntiSedan (Pfizer, Groton, CT) to counter the effects of the Dormitor. After 30 min on a heat pad, they were returned to their home cage.
Acute slices were prepared either 1 or 2 d after the injection (depending on specific experiment) in choline-based dissection buffer (in mm: 25 sodium bicarbonate, 1.25 sodium phosphate monobasic, 2.5 potassium chloride, 0.5 calcium chloride, 7 magnesium chloride, 25 glucose, 110 choline chloride, 11.6 ascorbic acid, 3.1 pyruvic acid, gassed with 95% O2 and 5% CO2) at 400 μm thick and allowed to recover for 2 h in standard ACSF (room temperature; 4 mm Mg2+ and 4 mm Ca2+, gassed with 95% O2 and 5% CO2). Slices where then imaged under a 2-photon laser-scanning microscope as described above.
Postembedding immunogold electron microscopy.
Sindbis virus expressing eGFP-GluR1-C-tail peptide was injected into the CA1 region of 14 DIV organotypic hippocampal slice cultures. After 24 h, chemLTP was induced. Briefly, slices were equilibrated in basal ACSF with 4 μm 2-chloroadenosine at 35°C for 10 min. At 0 min, the slices were immersed in the LTP induction solution (above) at 35°C. At 16 min, slices were rapidly washed in ACSF solution containing 4 μm 2-chloroadenosine just before fixation in 0.12 m phosphate buffer containing 4% paraformaldehyde and 0.1% glutaraldehyde. Control slices were treated the same way by replacing the induction solution by ACSF. Fixed slices were thus treated for cryosubstitution and Lowicryl embedding in a Reichert AFS apparatus (Leica, Vienna, Austria). The sections were washed three times in PBS and incubated for 30 min in 50 mm NH4Cl in PBS at 4°C. The slices were transferred to 30% methanol, and the temperature was lowered to −8°C at 24°C/h. Slices were then transferred to 50% methanol, and the temperature was lowered to −20°C at the same rate. Slices were incubated for 30 min in a solution of 0.5% uranyl acetate in 50% methanol at −20°C. Slices were rinsed in 50% methanol and then dehydrated through graded methanol solutions (70, 90, and 100%) while lowering the temperature to −45°C at the rate of 15°C/h. The sections were then infiltrated with Lowicryl HM20 (Polysciences, Warrington, PA), and the resin was polymerized by exposure to UV light for 48 h at −45°C. The slices were cut parallel to axis of pyramidal cell apical dendrites. Ultrathin sections were cut using a Leica Ultracut UCT and collected on nickel grids coated with formvar (Electron Microscopy Sciences, Fort Washington, PA).
For immunochemistry, the sections were incubated for 30 min in goat gold conjugates blocking solution (905.002; Aurion, Wageningen, The Netherlands). After three washes, 5 min each in incubation buffer 0.2% BSA-c (900.099; Aurion) in PBS, the sections were incubated for 2 h at room temperature in incubation buffer containing a rabbit polyclonal antibody against GFP (1:100; 132002; Synaptic System, Goettingen, Germany). After three washes, 5 min each, in incubation buffer, the sections were incubated for 1 h at room temperature in 10 nm gold-conjugated secondary antibodies against rabbit IgG (1:50; Aurion). The sections were washed twice in incubation buffer, twice in PBS, followed by a fixation in 1% glutaraldehyde in PBS for 5 min. They were washed once in PBS and once in distilled water before being air dried. The sections were counterstained by incubation with 5% uranyl acetate in 70% methanol for 10 min, followed by washing in 70% methanol, air drying, and incubation with lead citrate (0.15 m lead citrate, 0.12 m sodium citrate in CO2-free dH2O) for 3 min. Finally, sections were observed using a Hitachi H-7000 transmission electron microscope. Micrographs were captured from the stratum radiatum at 50–150 μm below the pyramidal cell layer. Measurements of the minimal distance between a gold bead and the PSD were made from the center of the gold particle to the nearest point on the inner leaflet of the postsynaptic plasma membrane juxtaposed to the PSD.
Results
To study structural changes during LTP, we used a protocol intended to induce plasticity at a majority of synapses. Standard electrode stimulation activates only a small percentage of synapses, making it less than ideal to detect modest changes on individual spines. Here, we used a brief bath application of a solution (see Materials and Methods) that drives activation of presynaptic and postsynaptic neurons in organotypic slices leading to a long-lasting potentiation of synaptic transmission (Otmakhov et al., 2004; Kopec et al., 2006). This chemLTP protocol reliably produces a stereotypical activation pattern in all cells of an organotypic slice culture (22 of 22 cells; both CA1 and CA3 recorded, across 12 slice cultures) (Fig. 1). In control conditions, this protocol consistently produces structural and functional synaptic potentiation (Kopec et al., 2006). We further characterized this form of plasticity (chemLTP) (Fig. 1) and demonstrate that it shares many similarities with standard LTP. Specifically, the number of stimuli during the induction period (477 ± 68 presynaptic and postsynaptic paired action potentials) is similar to strong LTP protocols; the potentiation is blocked by APV (Collingridge et al., 1983; Otmakhov et al., 2004; Kopec et al., 2006); the potentiation is associated with phosphorylation of GluR1 on key residues (Boehm et al., 2006b) as well as synaptic incorporation of GluR1 (Shi et al., 2001; Kopec et al., 2006); and the potentiation is associated with the enlargement of dendritic spines (Van Harreveld and Fifkova, 1975; Desmond and Levy, 1983; Matsuzaki et al., 2004; Kopec et al., 2006), which is blocked by agents preventing actin polymerization (Kim and Lisman, 1999; Fukazawa et al., 2003) (Fig. 2A1,3).
Figure 1.
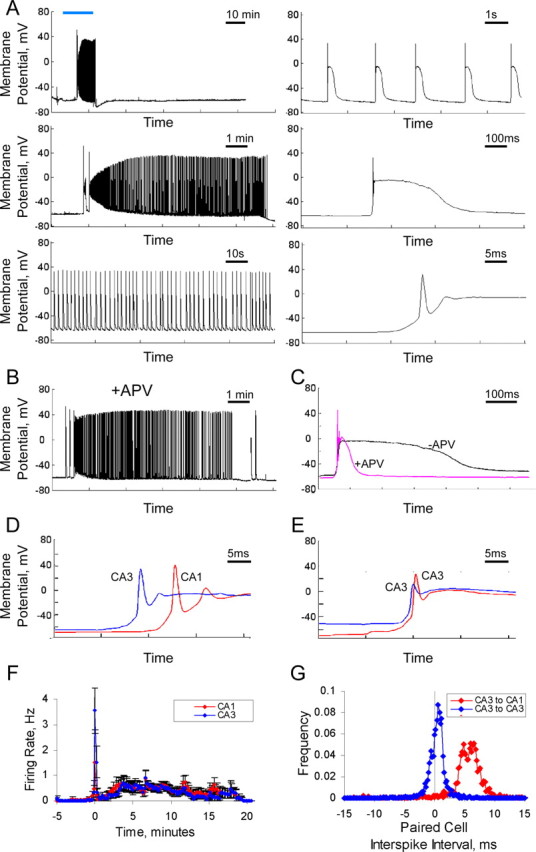
Electrophysiological characteristics of chemLTP induction. A, Whole-cell recording of a CA1 pyramidal cell held in current clamp during a chemLTP protocol. LTP-inducing solution was applied at the time indicated by the blue bar. Note the lack of activity after the washout of LTP-inducing solution. This is one of several critical differences between this LTP induction protocol and an epilepsy induction protocol (for additional discussion, see Kopec et al., 2006). The panels show activity at different time scales. B, C, ChemLTP in the presence of APV. B, In the presence of APV, cells produce action potentials with a similar frequency and count, indicating that the failed induction of synaptic potentiation is not attributable to failed spontaneous activity. C, APV reduces the long depolarization after each action potential. D–G, Paired whole-cell recordings during chemLTP reveal that the spontaneous activity follows a stereotyped consistent firing pattern. CA3 cells fire synchronously and precede cells in the CA1 region. D, E, Single period showing that the CA3 cell fires ∼7 ms before the CA1 cell, and two CA3 pyramidal cells fire nearly simultaneously. F, Average spike rate during chemLTP for CA1 and CA3 cells (n = 5 each). Time relative to chemLTP induction. G, Frequency histogram of interspike intervals. The interval taken between consecutive spikes in a paired cell recording is shown. CA1-CA3, n = 5 cell pairs, 3261 interspike events; CA3-CA3, n = 5 cell pairs, 2757 interspike events. Error bars represent SEM. One CA3-CA3 cell pair and one CA1-CA3 cell pair showed evidence of a direct synaptic connection and yielded data equivalent to the population. This separation between presynaptic and postsynaptic action potentials corresponds well with optimal timing to induce spike timing-dependent plasticity (Magee and Johnston, 1997; Markram et al., 1997; Bi and Poo, 1998) and may explain how a 0.5 Hz stimulus can lead to stable potentiation; the large NMDA current during each event may also be sufficient to drive this potentiation.
Figure 2.

Synaptic insertion of GluR1 and actin polymerization is necessary to permit stable spine enlargement after chemically induced LTP. A1–A3, CA1 neurons from organotypic hippocampal slice cultures expressing SEP-GluR1(wt) and tDimer, a red cytoplasmic marker (n = 200 spines; 3 cells) [data taken from the study by Kopec et al. (2006) for comparison with subsequent data], or tDimer alone and exposed to 1 μm Cytochalasin D 10 min before and during the entire imaging protocol (n = 120 spines; 3 cells). A1, Mean spine volume (integrated red fluorescence) and spine surface receptor (integrated green fluorescence) relative to chemLTP induction. ChemLTP drug exposure is indicated by a black bar. Values normalized to −10 min time point are shown (*p < 0.05). A2, Sample images obtained at indicated times relative to chemLTP induction (red channel only). Images are maximum value projection of three to four consecutive stacks. Blue arrowheads indicate spines that have enlarged, and orange arrowheads indicate spines that have shrunk. A3, Sample images, red channel only, for cells exposed to Cytochalasin D. B1, B2, Same as A for neurons expressing SEP-GluR1(T887A) and tDimer (n = 178 spines; 3 cells). B3, Paired whole-cell recordings of AMPAR- and NMDAR-mediated currents from uninfected cells and neighboring infected cells expressing GluR1 (T887A). AMPA component is defined as peak amplitude at −60 mV holding potential. NMDA component is defined as mean amplitude from 150–160 ms after peak at +40 mV holding potential. Gray points, Individual data points; pink point, mean data point (n = 9 pairs). C1, C2, Same as A for neurons expressing SEP-GluR1(3A) and tDimer (n = 187 spines; 3 cells). C3, Same as B3 for neurons expressing SEP-GLuR1(3A). C4, LTP is blocked in cells expressing SEP-GluR1(3A) compared with SEP-GluR1(wt), GluR1(wt) (n = 9), and GluR1(3A) (n = 8). LTP induction (3 min pairing protocol, 3 Hz, 0 mV holding potential) is indicated by a black bar (*p = 0.05). D, Cumulative distribution of fold spine volume change during chemLTP from cells expressing SEP-GluR1 (wt), (T887A), or (3A). Fold volume change defined as mean volume (+40 and +70 min time points)/mean volume (−30 and −10 min time points). Error bars represent SEM. Scale bar, 1 μm.
To address whether synaptic insertion of GluR1 is linked to spine enlargement during LTP, we expressed mutants of GluR1 that prevent its insertion into synapses and observed their effect on chemLTP-driven spine enlargement. We expressed GluR1 constructs with N-terminally fused SEP, which allowed us to monitor only surface receptors (Miesenbock et al., 1998; Ashby et al., 2004; Kopec et al., 2006), and tDimer, a cytoplasmic marker, which allowed us to monitor spine volume. On cells expressing wild-type GluR1, chemLTP produced a rapid and stable increase in spine size and in the amount of recombinant GluR1 on the spine surface [Kopec et al. (2006), their Fig. 2A1,2]. However, expression of SEP-GluR1(T887A), which contains a nonfunctional PDZ (PSD-95/Discs large/zona occludens-1) ligand (Songyang et al., 1997; Kim and Sheng, 2004) not only blocks LTP (Hayashi et al., 2000; Boehm et al., 2006a) and the trafficking of GluR1 onto the surface of spines but also reduced the rapid chemLTP-induced spine enlargement and prevented long-term stable spine enlargement (Fig. 2B1,2).
To independently test whether preventing synaptic incorporation of GluR1 blocks LTP driven spine enlargement, we examined the effects of SEP-GluR1(3A), a GluR1 construct that contains mutations at three functionally important phosphorylation sites on the C terminus (S818A, S831A, S845A) (Roche et al., 1996; Barria et al., 1997; Lee et al., 2003; Boehm et al., 2006b) but retains a functional PDZ domain. Expression of GluR1(3A) was found to block LTP (Fig. 2C4), indicating that this receptor also acts as a dominant negative by preventing endogenous as well as recombinant receptors from entering synapses. Furthermore, this result indicates that sites apart from the PDZ domain (i.e., phosphorylation sites) are necessary for synaptic incorporation of GluR1. This mutant also reduced the rapid spine enlargement and prevented the long-term stable spine enlargement after chemLTP (Fig. 2C1,2), reinforcing the view that blocking synaptic insertion of GluR1 prevents stable spine enlargement. As a control to ensure that the neurons are receiving an LTP stimulus, we confirmed that expression of either GluR1(T887A) or GluR1(3A) does not result in a decrease in basal synaptic AMPA or NMDA currents (Fig. 2B3,C3). As a second control to ensure the neurons can support the chemLTP driven spontaneous activity, we confirmed that expression of these two constructs does not result in a decrease in the propensity for the cell to generate action potentials (supplemental Fig. 1A,B, available at www.jneurosci.org as supplemental material) or a change in the resting potential (data not shown). These results suggest that LTP-induced stable spine enlargement requires synaptic incorporation of GluR1.
We next tested whether the ion-channel function of GluR1 is required for stable structural changes. We expressed in slices GluR1 with a mutation in its pore (Q582E) that blocks ion-channel permeation [pore-dead (PD)] (Shi et al., 2001) [SEP-GluR1(PD)]. In contrast to the other GluR1 mutants used here, expression of GluR1(PD) tended to produce slightly depressed basal AMPAR transmission compared with nearby noninfected neurons (Fig. 3D). This effect was blocked if slices were maintained in APV during the 2 d expression period (Fig. 3E1), suggesting the depression is because of synaptic incorporation of GluR1(PD) driven by spontaneous activity in slices that are cultured for prolonged periods of time (14–16 DIV). Previous use of GluR1(PD) (Shi et al., 2001) showed no effect on basal synaptic strength but was conducted in younger slices, which are known to have significantly lower levels of spontaneous activity. To test the effect of GluR1(PD) on LTP, slices were incubated with APV during the 2 d expression period. Subsequently, APV was washed, and chemLTP was induced. Cells expressing GluR1(PD) showed significantly lower AMPAR-mediated transmission compared with nearby noninfected cells, indicating block of chemLTP by GluR1(PD) (Fig. 3E2). Despite the inhibition of enhanced transmission, structural increase in spine size after chemLTP was the same in cells expressing wild-type GluR1 or GluR1(PD) (Fig. 3A–C). These results suggest that ion-channel permeation through newly delivered synaptic AMPA receptors is required for electrophysiological enhancement but not required to generate structural changes during LTP. Therefore, it is most likely that the presence of GluR1 in the synapse, even without its ion-passing capacity, is required to stabilize spine enlargement.
To test whether synaptic incorporation of GluR1, in the absence of a chemLTP stimulus, is sufficient to drive spine enlargement, SEP-GluR1 was expressed along with PSD-95 and tDimer. Previous experiments showed that overexpression of PSD-95 drives GluR1 into synapses, thereby increasing synaptic strength and occluding further synaptic potentiation (Stein et al., 2003; Ehrlich and Malinow, 2004). Cells expressing SEP-GluR1, tDimer, and PSD-95 had spines with elevated levels of SEP-GluR1, compared with cells expressing only SEP-GluR1 and tDimer (Fig. 4A,B). However, consistent with a previous report (Ehrlich and Malinow, 2004), these spines showed no significant change in size (median spine size, +6%; p = 0.27) (Fig. 4C). After chemLTP induction, spines displayed no immediate increase in surface GluR1, consistent with the complete occlusion of electrophysiological LTP (Ehrlich and Malinow, 2004), but showed a significant stable growth (Fig. 4D1,2). The presence of spine enlargement after chemLTP indicates that PSD-95 overexpression does not fully block LTP-driven growth, whereas the lack of an effect on basal spine size indicates that PSD-95 overexpression does not occlude spine enlargement. Combined, these results show that an LTP stimulus provides a growth-promoting signal not provided by GluR1 or PSD-95. We note that longer-term (5 d or greater) expression of PSD-95 (El-Husseini et al., 2000) can lead to increased spine size and number. This is consistent with the view that spontaneously generated transient spines may be stabilized if GluR1 is driven to synapses by overexpressed PSD-95. However, it is also possible that overexpression of PSD-95 for many days can lead to spine enlargement through an unrelated mechanism. We conclude that synaptic incorporation of GluR1 alone is not sufficient to drive spine enlargement in the absence of plasticity-inducing stimuli, indicating that the pathway leading to spine enlargement is most likely parallel to the one leading to increased synaptic strength.
Figure 4.

Synaptic insertion of GluR1 is not sufficient to drive spine enlargement. A, B, Expression of PSD-95 increases SEP-GluR1 enrichment on spines. A, Sample images of spines expressing SEP-GluR1 with or without PSD-95. Images are pixelwise ratio of green (SEP-GluR1)/red (volume). The color bar is shown at the right of images with red depicting high G/R and blue depicting low G/R. B, Cumulative distribution of spine SEP-GluR1 enrichment with or without PSD-95. Enrichment = [(spine integrated green/spine integrated red)/(dendrite mean green/dendrite mean red)]. +PSD-95, 15.9 ± 2.8, n = 3 cells, 196 spines; −PSD-95, 2.8 ± 0.1, n = 4 cells, 302 spines; p ≪ 0.01. Log scale was used to capture the distribution details across the full range of both data sets. C, Cumulative distribution of spine volume from cells expressing SEP-GluR1 with or without PSD-95. Spine volume is defined as (integrated spine red fluorescence)/(mean dendritic red fluorescence). +PSD-95, Median volume, 38.8, n = 3 cells, 196 spines; −PSD-95, median volume, 36.4, n = 3 cells, 200 spines; p = 0.27. D1, D2, Neurons expressing SEP-GluR1, untagged-PSD-95, and tDimer (n = 196 spines; 3 cells). D1, Mean spine volume (integrated red fluorescence) and spine SEP-GluR1 (integrated green fluorescence) relative to chemLTP induction. Values normalized to −10 min time point. *p < 0.05. E, Sample images obtained at indicated times relative to chemLTP induction (red channel only). Images are displayed as in Figure 2. Error bars represent SEM. Scale bars, 1 μm.
We next tested the effects of expressing the GluR1-C-tail peptide, a sequence corresponding to the full cytoplasmic C terminus of GluR1, on chemLTP-induced spine growth, because this peptide is also known to prevent synaptic incorporation of GluR1. The GluR1-C-tail peptide blocks several forms of synaptic potentiation that involve synaptic delivery of GluR1: hippocampal LTP (Shi et al., 2001); chemically induced LTP in cultured neurons (Watt et al., 2004); amygdala LTP and memory (Rumpel et al., 2005); and experience-dependent cortical plasticity (Takahashi et al., 2003; Frenkel et al., 2006). When expressed for 2 d, the GluR1-C-tail peptide has no effect on basal AMPA or NMDA transmission in organotypic slices (Shi et al., 2001) or cultured cortical neurons (Watt et al., 2004), no effect on passive membrane properties such as input resistance, and no effect on other forms of plasticity such as long-term depression (Shi, 2000). The GluR1-C-tail also has no effect on AMPA or NMDA transmission in the amygdala or cortex when deprived of plasticity-producing input (Takahashi et al., 2003; Rumpel et al., 2005). These previous studies indicate that the GluR1-C-tail peptide interacts specifically with proteins participating in GluR1-dependent potentiation to prevent synaptic incorporation of endogenous GluR1. We were thus surprised to find that in the presence of GluR1-C-tail peptide, chemLTP produced normal spine growth (Fig. 5A1,2), because other constructs that prevent endogenous GluR1 from entering synapses, such as full-length GluR1 (T887A) and (3A) shown above, blocked chemLTP-induced spine growth.
Figure 5.

GluR1 C terminus (C-tail) peptide permits spine enlargement. A1, A2, Neurons expressing eGFP-GluR1-C-tail peptide and tDimer (n = 318 spines; 6 cells). A1, Mean spine volume (integrated red fluorescence) and spine GluR1-C-tail (integrated green fluorescence) relative to chemLTP induction. Values are normalized to −10 min time point (*p < 0.05). A2, Sample images obtained at indicated times relative to chemLTP induction (red channel only). Images are displayed as in Figure 2. B1, B2, Same as A for neurons expressing eGFP-GluR1(T887A)-C-tail peptide (n = 270 spines; 6 cells). B3, Paired whole-cell recordings of AMPAR- and NMDAR-mediated currents from uninfected cells and neighboring infected cells expressing GFP-GluR1 C-tail (T887A) (n = 10). Recordings are performed as in Figure 2. B4, LTP is blocked in cells expressing GluR1(T887A)-C-tail peptide, compared with eGFP control, eGFP (n = 16), GluR1(T887A)-C-tail (n = 17). LTP induction as in Figure 2 (*p < 0.02). C, Cumulative distribution of fold spine volume change during chemLTP from cells expressing GFP-GluR1 C-tail (wt) or (T887A). Fold volume change is defined as in Figure 2. Error bars represent SEM. Scale bar, 1 μm.
We considered the possibility that LTP signaling moves the GluR1-C-tail peptide into the PSD, taking the place normally occupied by LTP-driven endogenous GluR1 C termini, allowing protein interactions to occur that serve to stabilize plasticity-induced spine growth. To test this model, we expressed in neurons the GluR1-C-tail peptide with a mutation at the terminal PDZ domain, because this domain is important for synaptic insertion of the full-length receptor (Hayashi et al., 2000; Boehm et al., 2006a). GluR1(T887A)-C-tail prevented chemLTP-induced spine enlargement (Fig. 5B1,2,C), consistent with the view that LTP drives the GluR1-C-tail, but not the GluR1(T887A)-C-tail peptide into spines, and GluR1-C-tail in spines permits plasticity-induced spine growth. Expression of GluR1(T887A)-C-tail peptide blocked LTP (Fig. 5B4) indicating that this peptide prevents endogenous GluR1 from entering the synapse, presumably by competing for interactions on parts other than the PDZ domain that are required for LTP (such as GluR1-C-tail phosphorylation sites; see above). Two-day expression of the GluR1(T887A)-C-tail peptide had no effect on basal NMDA or AMPA current (Fig. 5B3), the ability of cells to generate action potentials (supplemental Fig. 1, available at www.jneurosci.org as supplemental material), or the resting potential (data not shown). Thus, expression of the GluR1-C-tail with a mutation that prevents the full-length receptor from entering the synapse prevents chemLTP-induced spine growth.
To test directly whether the GluR1-C-tail peptide is inserted into the PSD during chemLTP, we performed postembedding immunogold electron microscopy. First, slices were infected with Sindbis virus expressing GFP-GluR1-C-tail and allowed to express for 1 d. They were then divided into two groups, one control and the other exposed to chemLTP inducing solution. At the end of the chemLTP induction protocol, slices from both groups were fixed and processed for postembedding immunogold EM (see Materials and Methods). GFP-GluR1-C-tail peptide was detected using a primary antibody against GFP. All gold particles within 100 nm of a synapse were identified, and the minimal distance from the center of the gold particle to the postsynaptic density was determined (see Materials and Methods). Figure 6A1 shows the cumulative distribution for all gold particles from slices either with or without chemLTP induction. ChemLTP results in a significant increase in the number of GFP-GluR1-C-tail molecules detected directly within the PSD (-chemLTP, 3.5%; +chemLTP, 24.7%; p < 0.01) (for example images, see Fig. 6A2). Excluding the gold particles found within the PSD, one sees no difference between the distributions of the remaining gold particles (data not shown). Combined, these results confirm our hypothesis that chemLTP leads specifically to the synaptic insertion of the GluR1-C-tail and therefore further supports our hypothesis that synaptic insertion of GluR1, specifically the GluR1-C-tail, is required to stabilize spine enlargement.
Figure 6.

GluR1-C-tail peptide becomes localized to PSDs after LTP. A, Postembedding immunogold electron microscopy performed against GFP-GluR1 C-tail in slices with or without chemLTP induction. All spines containing a gold particle were identified, and the minimal distance between the gold particle and PSD was measured (see Materials and Methods). A1, Cumulative distribution of all particles within 100 nm of the PSD shown (p < 0.01) (without chemLTP, n = 2 slices, 86 particles; with chemLTP, n = 2 slices, 101 particles). A2, Example images of spines from slices with and without chemLTP induction. Gold particles are marked by red arrowheads. Scale bar, 250 nm. B, Photoconversion of tDimer-GluR1-C-tail used to measure the peptides stability within spines both before and after chemLTP induction. B1, Experiment timeline. Two identical image series are performed, one before and one after chemLTP induction (blue bar). Images acquired at times marked by black triangles. MECC, the photoconversion, performed at times marked by red lines. MECC permanently converts tDimer from a red to a green fluorophore. B2, Spine green/red ratio plotted relative to MECC. Values are normalized to mean baseline values (*p < 0.01, for tDimer-GluR1-C-tail after chemLTP only). Photoconversion is performed on a 25 μm stretch of dendrite so the decay of the green/red ratio during the first 10 min represents mixing of that dendritic region with the rest of the cell and is not an accurate measure of spine to dendrite diffusion. tD-GluR1-C-tail before chemLTP, n = 42 spines, 3 cells; tD-GluR1-C-tail after chemLTP, n = 32 spines, 3 cells; tD only before chemLTP, n = 42 spines, 3 cells; tD only after chemLTP, n = 45 spines, 3 cells. B3, Example images of a spine before and after photoconversion both before and after chemLTP. Images are a pixelwise green/red ratio of two to three collapsed stacks where green represents high G/R, and red represents low G/R. Scale bar, 0.5 μm.
To better understand how the GluR1-C-tail can move into synapses, we conducted a series of photo-conversion and recovery experiments. Here, we tagged the GluR1-C-tail with tDimer (a dimmer version of dsRed used in other experiments to fill the cytoplasm). We made use of a process known as multi-photon evoked color change (MECC), in which 750 nm light is sufficient to permanently convert tDimer from a red into a green fluorophore (Marchant et al., 2001). In doing so, we can use the green:red ratio (G/R) of a spine at various times after MECC (photo-conversion) as a measure of the stability of GluR1-C-tail within that spine. In these experiments, we photo-convert a 25 μm stretch of dendrite, including spines and dendrite. Although this prevents us from measuring the rapid spine-dendrite diffusion, it does allow us to collect data from many individual spines both before and after chemLTP.
The timeline of this experiment is shown in Figure 6B1. Two identical image series are acquired, one before and one after chemLTP induction. Each image series consists of two baseline images followed by MECC (photo-conversion). Recovery images are taken one every minute for 10 min and then two images are taken at 1 h after MECC. Data in Figure 6, B2 and B3, correspond to spine green/red fluorescence (i.e., photoconverted construct) after MECC. Before chemLTP, no significant quantity of photoconverted GluR1-C-tail remains in spines by 1 h after MECC (normalized green/red, 0.002 ± 0.018) (Fig. 6B2, orange curve), indicating that the GluR1-C-tail is free to diffuse throughout the cytoplasm of dendrites and spines. As mentioned above, the slow decay of green fluorescence within the spines is because an entire 25 μm stretch of dendrite was photoconverted. After chemLTP, however, we see a significantly elevated green:red ratio lasting up to 1 h after MECC (normalized green/red, 0.102 ± 0.038; p < 0.01) (Fig. 6B2, red curve; for example images, see Fig. 6B3). To control for the possibility that alterations in spine morphology after chemLTP might trap the GluR1-C-tail within spines (e.g., by constricting the spine neck and thus preventing diffusional mixing with the dendrite), we conducted the same experiment with tDimer alone. Both before and after chemLTP, there was no significant photoconverted tDimer remaining within spines at 1 h after MECC (Fig. 6B2, green and blue curves, respectively), indicating that the persistence of photoconverted GluR1-C-tail in spines after chemLTP was not an artifact of spine geometry. Combined, the EM and photo-conversion experiments indicate that before chemLTP, the GluR1-C-tail diffuses freely throughout the spine and dendritic cytoplasm but rapidly becomes stably bound to proteins within the PSD after chemLTP.
Up to this point, our results indicate that synaptic incorporation of GluR1, specifically the C tail, is necessary (Figs. 2, 5) but not sufficient (Fig. 4) to stabilize spine enlargement. We wanted to investigate whether other events occurring during LTP may play a direct role in mediating or stabilizing spine enlargement. Intracellular compartments that contain AMPA receptors undergo exocytosis during LTP (Lu et al., 2001; Passafaro et al., 2001; Gerges et al., 2006; Kopec et al., 2006; Park et al., 2006). Recent evidence implicates the SNARE protein Syntaxin-13 in directing this LTP-induced exocytosis (Park et al., 2004, 2006). To determine the role of such fusion events in spine enlargement, we tested the effect of the Syntaxin-13 dominant-negative construct Syn13ΔTM (Syntaxin-13 lacking the transmembrane domain) (Sun et al., 2003), which blocks LTP (Park et al., 2004). Syn13ΔTM blocked chemLTP-induced spine enlargement (Fig. 7A1,2). We confirmed that expression of Syn13ΔTM did not affect basal NMDA or AMPA currents (Fig. 7A3), the ability of the cell to generate action potentials (supplemental Fig. 1D, available at www.jneurosci.org as supplemental material), or the resting potential (data not shown), indicating that the failed spine enlargement was not caused by a change in electrophysiological cell properties. We conclude that Syntaxin-13-mediated exocytosis is required for chemLTP-induced spine enlargement.
Figure 7.

GluR1-C-tail peptide can rescue spine enlargement in the presence of an exocytosis blocker. A, Neurons expressing eGFP-Syntaxin13ΔTM and tDimer (n = 135 spines, 3 cells). A1, Mean spine volume (integrated red fluorescence) and spine Syn13ΔTM (integrated green fluorescence) relative to chemLTP induction. Values normalized to −10 min time point (*p < 0.05). A2, Sample images obtained at indicated times relative to chemLTP induction (red channel only). Images are displayed as in Figure 2. A3, Paired whole-cell recordings of AMPAR- and NMDAR-mediated currents from uninfected cells and neighboring infected cells expressing GFP-Syn13ΔTM (n = 10). Recordings are performed as in Figure 2. B, Same as A for neurons expressing eGFP-Syntaxin13ΔTM, untagged-GluR1-C-tail peptide, and tDimer (n = 162 spines; 3 cells). B3, Coexpression of GFP-Syn13ΔTM and tDimer-GluR1-Ctail peptide, blocks LTP (paired pathway, n = 8; control pathway, n = 8). LTP induction as in Figure 2. C, Cumulative distribution of fold spine volume change during chemLTP from cells expressing GFP-Syn13ΔTM with or without untagged GluR1-C-tail. Fold volume change is defined as in Figure 2. Error bars represent SEM. Scale bar, 1 μm.
Syntaxin-13-mediated exocytosis provides spines with GluR1, lipid membrane, and other GluR1-associated transmembrane proteins (e.g., stargazin) (Chen et al., 2000). It is unclear, however, which of these components is required for stable spine enlargement. Because the GluR1-C-tail peptide does not contain transmembrane domains, it should not require exocytosis to diffuse into synapses. We therefore attempted to rescue chemLTP-induced spine enlargement in the absence of Syntaxin-13-mediated exocytosis by expressing the GluR1-C-tail peptide. Strikingly, expression of the GluR1-C-tail permitted chemLTP-induced spine growth despite coexpression with Syn13ΔTM (Fig. 7B1,2,C). LTP was still blocked by dual expression of GluR1-C-tail and Syn13ΔTM (Fig. 7B3), indicating that the constructs were not interfering with each other's actions in preventing endogenous GluR1 from reaching the synapse. These results indicate that to permit LTP-induced spine enlargement, Syntaxin-13-mediated exocytosis is only required to provide GluR1 and any cytoplasmic proteins associated with its C terminus. Other exocytic events, not dependent on Syntaxin-13, may still participate in the addition of lipids or other transmembrane molecules to the dendritic surface thereby playing a role in spine enlargement.
Although slice cultures have proven to be a good model system for plasticity in vivo (Takahashi et al., 2003; Rumpel et al., 2005), the activity levels and modulatory inputs are clearly different in these two systems. Thus, we tested under more physiological conditions whether synaptic insertion of GluR1 is required to permit stable spine enlargement. Previous work has shown that 12 h of experience in 2-week-old rat pups is sufficient to drive GluR1 into CA1 pyramidal cell synapses in the hippocampus (Qin et al., 2005). We examined structural changes occurring at this age by in vivo injection of eGFP expressing Sindbis virus into the hippocampus of P11 and P13 pups, permitting expression for 24 h, and imaging of acute slices at P12 and P14, respectively (see Materials and Methods). In these experiments, spine integrated fluorescence is normalized by dendritic mean fluorescence as a measure of spine size, to control for variability in eGFP expression level from cell to cell. From P12 to P14, spines show a modest but significant enlargement (median spine size, +17%; p < 0.01) (Fig. 8A), whereas the dendrites showed no change in fluorescence intensity (mean dendritic fluorescence, −3%; p = 0.84) (Fig. 8B). We hypothesized that if synaptic insertion of GluR1 is required, then spine enlargement should be blocked by expression of full-length GluR1(T887A) or full-length GluR1(3A) from P12 to P14. This would result in spines appearing smaller at P14 on cells expressing these dominant-negative mutants of GluR1 when compared with cells from litter mates expressing wt GluR1.
Figure 8.
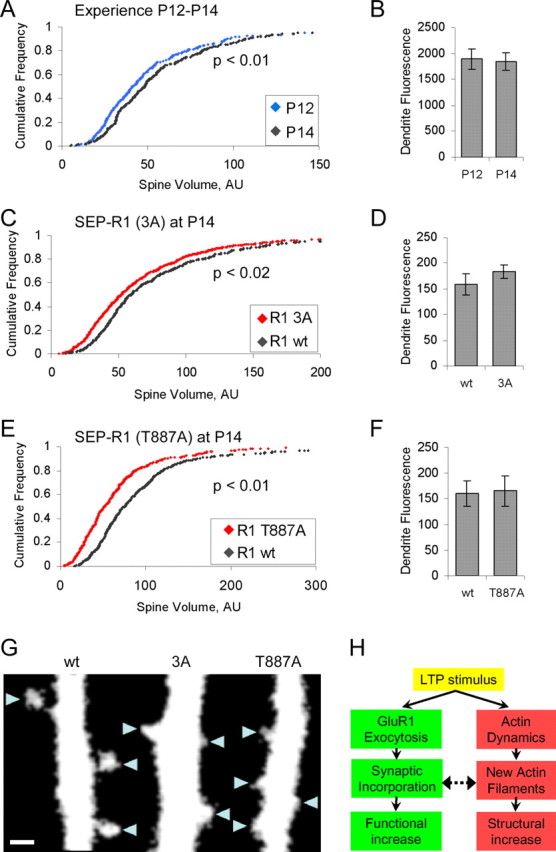
Experience driven synaptic insertion of GluR1 is required to permit stable spine enlargement in vivo. A, B, Two days of experience from P12 to P14 results in an increase in spine size. Spine size is defined as (integrated spine fluorescence)/(mean dendritic fluorescence). A, Cumulative distribution of spine size on cells expressing eGFP at P12 and P14. P12, n = 270 spines, 12 dendrites, 2 animals, median spine size, 41.3; P14, n = 374 spines, 12 dendrites, 2 animals, median spine size, 48.4. p < 0.01. B, Mean dendritic green fluorescence from cells in A. C–F, Expression of GluR1 mutants that block synaptic insertion prevent spine enlargement occurring from P12 to P14 resulting in smaller spines when compared with cells expressing wt GluR1. C, Cumulative distribution of spine size on cells expressing td-Tomato along with either SEP-GluR1 (wt) or (3A) at P14 for 2 d. wt, n = 436 spines, 21 dendrites, 2 animals, median spine size, 59.3; 3A, n = 695 spines, 29 dendrites, 2 animals, median spine size, 51.8; p < 0.02. D, Mean dendritic red fluorescence from cells in C, E, Cumulative distribution of spine size on cells expressing td-Tomato along with either SEP-GluR1 (wt) or (T887A) at P14 for 2 d. wt, n = 494 spines, 23 dendrites, 2 animals, median spine size, 75.2; T887A, n = 396 spines, 18 dendrites, 2 animals, median spine size, 51.5; p < 0.01. F, Mean dendritic red fluorescence from cells in E. G, Example images of red channel from cells expressing td-Tomato along with either SEP-GluR1 wt, 3A, or T887A. Spines are indicated by blue triangles. Error bars represent SEM. Scale bar, 1 μm. H, Model, LTP stimulus activates two pathways: one leading to a functional increase in synaptic strength through exocytosis and synaptic insertion of GluR1; the second leads to stable increase in spine size through actin remodeling. The synaptic incorporation of GluR1 and the increase of actin filaments in the spine costabilize one another, thus ensuring the balance between spine size and synapse strength is maintained. Solid arrows indicate “causes,” and dashed arrows indicate “stabilize.”
To test this hypothesis, we used a dual promoter Sindbis virus to drive the expression of an SEP-GluR1 construct (wt, T887A, or 3A) along with td-Tomato (a red cytoplasmic marker) (Shaner et al., 2004). Animals were infected at P12 in the CA1 region of the dorsal hippocampus. For each experiment, two littermates were infected: one with a virus driving wt GluR1 and the other with a virus driving one of the mutant forms of GluR1. After recovery from surgery, the pups were returned to the home cage for 48 h, after which acute slices were prepared. Apical dendrites of isolated infected CA1 neurons were identified, and a single 3D image was acquired near the primary bifurcation. As above, spine size is measured as spine integrated fluorescence normalized by dendrite mean fluorescence. Spines on cells expressing either SEP-GluR1(3A) (Fig. 8C) (median spine size, −12.6%; p < 0.02) or SEP-GluR1(T887A) (Fig. 8E) (median spine size, −31.5%; p < 0.01) were smaller when compared with spines on the cells of a littermate expressing wt SEP-GluR1 (for example images, see Fig. 8G), indicating that blocking synaptic insertion of GluR1 in vivo prevents stable spine enlargement. No significant difference was seen between the mean dendritic fluorescence of either group (Fig. 8D,F). The greater effect of SEP-GluR1(T887A) compared with SEP-GluR1(3A) correlates with the greater efficacy of the former in blocking the initial chemLTP induced spine enlargement (Fig. 2, compare B1 and C1). The difference between cells expressing GluR1(T887A) and wild-type GluR1 is greater than the difference between P12 and P14 and may be the result of a simultaneous LTD process that decreases spine size and becomes more apparent after block of LTP. These data indicate that synaptic insertion of GluR1 driven by experience is required to permit spine enlargement in vivo.
Discussion
In this study, we examined the cellular mechanisms controlling plasticity-induced spine growth. There is general agreement that stable incorporation of AMPA receptors into synapses occurs during LTP (Malinow and Malenka, 2002; Sheng and Kim, 2002; Song and Huganir, 2002; Bredt and Nicoll, 2003; Collingridge et al., 2004; Triller and Choquet, 2005) and that actin polymerization drives changes in spine morphology (Fischer et al., 1998; Halpain et al., 1998; Dunaevsky et al., 1999; Okamoto et al., 2004). We found that synaptic incorporation of GluR1 is required for stable spine enlargement after plasticity-inducing stimuli, indicating that GluR1 likely stabilizes protein complexes that promote spine-growth. Consequently, proteins with direct or indirect association with AMPA receptors that can produce larger spines (Pak et al., 2001; Penzes et al., 2001; Sala et al., 2001; Rumbaugh et al., 2003; Vazquez et al., 2004; Racz and Weinberg, 2006) are likely to be stably incorporated into synapses during LTP. These proteins likely bind multiple sites along the C terminus, including but not limited to the PDZ domain and the three known phosphorylation sites. Because larger spines are not produced by expression of the GluR1-C-tail peptide with no LTP stimulus (2 d expression, −15%; p = 0.022) or synaptic insertion of GluR1 by PSD-95 overexpression and no LTP stimulus, it appears that the protein complexes responsible for spine growth that are stabilized by the GluR1 C terminus also require LTP-inducing stimuli to form or be localized to the synapse. One possibility is that filamentous actin, known to be required for LTP (Kim and Lisman, 1999; Krucker et al., 2000; Fukazawa et al., 2003; Okamoto et al., 2004; Lin et al., 2005) and for structural enhancement (Fischer et al., 1998; Halpain et al., 1998; Dunaevsky et al., 1999; Okamoto et al., 2004) (Fig. 2A1), is activated by the calcium rise during LTP induction (Fukazawa et al., 2003; Okamoto et al., 2004; Lin et al., 2005) and produces large spines that are then stabilized by the GluR1-C-tail and its associated proteins. Previously, we have shown that structural changes precede the accumulation of GluR1 on the surface of spines, indicating that synaptic GluR1 does not drive actin polymerization but could act to stabilize it within minutes of its formation (Fig. 8H). Previous work from Krucker et al. (2000) has shown that actin polymerization is required for stable LTP, suggesting that nascent actin filaments may stabilize synaptically delivered AMPA receptors. Thus, polymerized actin in spines and synaptic receptors may be mutually stabilizing, therefore providing an elegant solution explaining how spine size and synapse strength are kept in balance.
Our data can be explained by a simple model shown in Figure 8H. Here, LTP initiates two parallel pathways, one leading to an increase in synaptic strength through the exocytosis and synaptic insertion of GluR1 and the other to an increase in spine size through reorganization of the actin cytoskeleton. Each pathway may be initiated independently but become interdependent for long-term stabilization. Because of this simple link, the cell ensures that spine size and synapse strength will always be correlated.
Our data indicate that the function of GluR1 as an ion channel is not required for it to permit stable spine enlargement after its incorporation into synapses during LTP. GluR1(PD) moved into dendritic spines during chemLTP and inhibited enhanced transmission, but it did not block structural enhancement. Indeed, synaptic insertion of the GluR1 isolated C terminus is sufficient to support spine enlargement even while exocytosis of endogenous GluR1 is blocked. Recent studies provide conflicting views regarding whether Ca2+ entry through synaptically delivered GluR2-lacking receptors is required to stabilize LTP (Clem and Barth, 2006; Plant et al., 2006; Adesnik and Nicoll, 2007). Although our study argues against a requirement for calcium entry through GluR2-lacking AMPA receptors, it may be that our LTP induction protocol, which is 16 min long, provides ample Ca2+ influx through NMDA receptors to both drive GluR1 receptors into synapses and subsequently stabilize them there.
A recent study showed that Syntaxin-13-mediated fusion provides AMPA receptors to synapses during LTP (Park et al., 2004). Here, we provide support by showing that Syntaxin-13-mediated fusion is required for spine growth during chemLTP. However, stable spine enlargement is rescued by coexpression of the cytoplasmic tail of GluR1. Thus, the only critical component provided by Syntaxin-13 vesicles required for spine growth is GluR1, or any cargo associated with its C terminus. Indeed, it appears that GluR1 on these organelles is the mechanistic link between increased function and enlarged structure during plasticity. The ion channel portion enhances synaptic strength by increasing postsynaptic currents, whereas the C terminus interacts with proteins that stabilize spine growth. Because the dominant-negative construct used here blocks only Syntaxin-13-directed exocytosis (Sun et al., 2003), this does not rule out a possible role for other exocytic pathways to stabilize spine enlargement by adding lipids or delivering other transmembrane proteins to the dendritic/spine surface. In the absence of Syntaxin-13-mediated exocytosis, spine enlargement may be at the expense of lipids moving from the dendritic surface (causing a reduction in dendritic radius smaller than the detection limit of a light microscope).
Here, we show that a mutation in the PDZ domain on both GluR1 and the isolated C-tail peptide blocks LTP-induced spine growth. This suggests that recruitment of a protein binding to the PDZ domain may be required for spine enlargement or stabilization in the synapse, or both. Recent studies indicate that this point mutation in GluR1 PDZ domain at the −2 position blocks LTP (Shi et al., 2001; Boehm et al., 2006a), whereas removal of the terminal seven amino acids does not block LTP (Kim et al., 2005; Boehm et al., 2006a). It is possible that a mutation at the −2 position produces a nonfunctional domain with different molecular structure that may inhibit formation of a protein complex (which may have several stabilizing interaction sites) through steric hindrance. Removing the domain entirely would neither positively nor negatively stabilize the complex, permitting other stabilizing interactions to occur.
Although we have shown a link between the pathways leading to spine enlargement and synapse strength, we can only speculate about the detailed mechanism by which the GluR1 C-tail stabilizes spine enlargement. It is possible that this peptide can bind proteins and therefore support a complex that directly links to the actin cytoskeleton, thus stabilizing it. Another possibility is that the protein complex supported by GluR1 may contain enzymes, such as kinases or GTPases, that themselves modify proteins controlling the actin cytoskeleton (Xie et al., 2005). In this way, the GluR1 C-tail becomes a spine-specific docking site for an actin-regulating complex. Indeed, previous studies have identified a number of potential links between GluR1 and actin involving indirect protein–protein interactions (supplemental Fig. 2A, available at www.jneurosci.org as supplemental material) (Kopec, 2006). There are also potential links between GluR1 and several GTPases and kinases (supplemental Fig. 2B,C). None of these protein–protein interaction chains have been confirmed to exist in their entirety, let alone in the synapse after LTP. In the future, it will be of interest to examine the potential role of these interactions after LTP induction, because this may elucidate the mechanism by which the GluR1 C-tail stabilizes spine growth.
Footnotes
This work was supported by the National Institutes of Health (C.D.K., R.M.), the Goldberg-Lindsay Fellowship (C.D.K.), and the National Alliance for Research on Schizophrenia and Depression (E.R.). We thank Drs. Gero Miesenbock, Roger Tsien, and Andrew Bean for supplying constructs; Dr. Antione Triller for sharing equipment for the EM experiment; Drs. Yasunori Hayashi, Michael Ehlers, and Sam Wang and members of the Malinow laboratory for helpful comments in preparing this manuscript; and Nancy Dawkins for her help in preparing slice cultures.
References
- Adesnik H, Nicoll RA. Conservation of glutamate receptor 2-containing AMPA receptors during long-term potentiation. J Neurosci. 2007;27:4598–4602. doi: 10.1523/JNEUROSCI.0325-07.2007. [DOI] [PMC free article] [PubMed] [Google Scholar]
- Ashby MC, De La Rue SA, Ralph GS, Uney J, Collingridge GL, Henley JM. Removal of AMPA receptors (AMPARs) from synapses is preceded by transient endocytosis of extrasynaptic AMPARs. J Neurosci. 2004;24:5172–5176. doi: 10.1523/JNEUROSCI.1042-04.2004. [DOI] [PMC free article] [PubMed] [Google Scholar]
- Barria A, Muller D, Derkach V, Griffith LC, Soderling TR. Regulatory phosphorylation of AMPA-type glutamate receptors by CaM-KII during long-term potentiation. Science. 1997;276:2042–2045. doi: 10.1126/science.276.5321.2042. [DOI] [PubMed] [Google Scholar]
- Baude A, Nusser Z, Molnar E, McIlhinney RA, Somogyi P. High-resolution immunogold localization of AMPA type glutamate receptor subunits at synaptic and non-synaptic sites in rat hippocampus. Neuroscience. 1995;69:1031–1055. doi: 10.1016/0306-4522(95)00350-r. [DOI] [PubMed] [Google Scholar]
- Bi GQ, Poo MM. Synaptic modifications in cultured hippocampal neurons: dependence on spike timing, synaptic strength, and postsynaptic cell type. J Neurosci. 1998;18:10464–10472. doi: 10.1523/JNEUROSCI.18-24-10464.1998. [DOI] [PMC free article] [PubMed] [Google Scholar]
- Boehm J, Ehrlich I, Hsieh H, Malinow R. Two mutations preventing PDZ-protein interactions of GluR1 have opposite effects on synaptic plasticity. Learn Mem. 2006a;13:562–565. doi: 10.1101/lm.253506. [DOI] [PubMed] [Google Scholar]
- Boehm J, Kang MG, Johnson RC, Esteban J, Huganir RL, Malinow R. Synaptic incorporation of AMPA receptors during LTP is controlled by a PKC phosphorylation site on GluR1. Neuron. 2006b;51:213–225. doi: 10.1016/j.neuron.2006.06.013. [DOI] [PubMed] [Google Scholar]
- Bredt DS, Nicoll RA. AMPA receptor trafficking at excitatory synapses. Neuron. 2003;40:361–379. doi: 10.1016/s0896-6273(03)00640-8. [DOI] [PubMed] [Google Scholar]
- Cajal R. Significación fisiológica de las expansiones protoplásmicas y nerviosas de la sustancia gris. Revista de ciencias médicas de Barcelona 22. 1891 [Google Scholar]
- Chen L, Chetkovich DM, Petralia RS, Sweeney NT, Kawasaki Y, Wenthold RJ, Bredt DS, Nicoll RA. Stargazin regulates synaptic targeting of AMPA receptors by two distinct mechanisms. Nature. 2000;408:936–943. doi: 10.1038/35050030. [DOI] [PubMed] [Google Scholar]
- Clem RL, Barth A. Pathway-specific trafficking of native AMPARs by in vivo experience. Neuron. 2006;49:663–670. doi: 10.1016/j.neuron.2006.01.019. [DOI] [PubMed] [Google Scholar]
- Collingridge GL, Kehl SJ, McLennan H. The antagonism of amino acid-induced excitations of rat hippocampal CA1 neurones in vitro. J Physiol (Lond) 1983;334:19–31. doi: 10.1113/jphysiol.1983.sp014477. [DOI] [PMC free article] [PubMed] [Google Scholar]
- Collingridge GL, Isaac JT, Wang YT. Receptor trafficking and synaptic plasticity. Nat Rev Neurosci. 2004;5:952–962. doi: 10.1038/nrn1556. [DOI] [PubMed] [Google Scholar]
- Desmond NL, Levy WB. Synaptic correlates of associative potentiation/depression: an ultrastructural study in the hippocampus. Brain Res. 1983;265:21–30. doi: 10.1016/0006-8993(83)91329-x. [DOI] [PubMed] [Google Scholar]
- Dunaevsky A, Tashiro A, Majewska A, Mason C, Yuste R. Developmental regulation of spine motility in the mammalian central nervous system. Proc Natl Acad Sci USA. 1999;96:13438–13443. doi: 10.1073/pnas.96.23.13438. [DOI] [PMC free article] [PubMed] [Google Scholar]
- Ehrlich I, Malinow R. Postsynaptic density 95 controls AMPA receptor incorporation during long-term potentiation and experience-driven synaptic plasticity. J Neurosci. 2004;24:916–927. doi: 10.1523/JNEUROSCI.4733-03.2004. [DOI] [PMC free article] [PubMed] [Google Scholar]
- El-Husseini AE, Schnell E, Chetkovich DM, Nicoll RA, Bredt DS. PSD-95 involvement in maturation of excitatory synapses. Science. 2000;290:1364–1368. [PubMed] [Google Scholar]
- Fischer M, Kaech S, Knutti D, Matus A. Rapid actin-based plasticity in dendritic spines. Neuron. 1998;20:847–854. doi: 10.1016/s0896-6273(00)80467-5. [DOI] [PubMed] [Google Scholar]
- Frenkel MY, Sawtell NB, Diogo AC, Yoon B, Neve RL, Bear MF. Instructive effect of visual experience in mouse visual cortex. Neuron. 2006;51:339–349. doi: 10.1016/j.neuron.2006.06.026. [DOI] [PubMed] [Google Scholar]
- Fukazawa YSY, Ozawa F, Ohta Y, Mizuno K, Inokuchi K. Hippocampal LTP is accompanied by enhanced F-actin content within the dendritic spine that is essential for late LTP maintenance in vivo. Neuron. 2003;38:447–460. doi: 10.1016/s0896-6273(03)00206-x. [DOI] [PubMed] [Google Scholar]
- Gerges NZ, Backos DS, Rupasinghe CN, Spaller MR, Esteban JA. Dual role of the exocyst in AMPA receptor targeting and insertion into the postsynaptic membrane. EMBO J. 2006;25:1623–1634. doi: 10.1038/sj.emboj.7601065. [DOI] [PMC free article] [PubMed] [Google Scholar]
- Halpain S, Hipolito A, Saffer L. Regulation of F-actin stability in dendritic spines by glutamate receptors and calcineurin. J Neurosci. 1998;18:9835–9844. doi: 10.1523/JNEUROSCI.18-23-09835.1998. [DOI] [PMC free article] [PubMed] [Google Scholar]
- Harris K, Jensen F, Tsao B. Three-dimensional structure of dendritic spines and synapses in rat hippocampus (CA1) at postnatal day 15 and adult ages: implications for the maturation of synaptic physiology and long-term potentiation. J Neurosci. 1992;12:2685–2705. doi: 10.1523/JNEUROSCI.12-07-02685.1992. [DOI] [PMC free article] [PubMed] [Google Scholar]
- Hayashi Y, Shi SH, Esteban JA, Piccini A, Poncer JC, Malinow R. Driving AMPA receptors into synapses by LTP and CaMKII: requirement for GluR1 and PDZ domain interaction. Science. 2000;287:2262–2267. doi: 10.1126/science.287.5461.2262. [DOI] [PubMed] [Google Scholar]
- Holtmaat AJ, Trachtenberg JT, Wilbrecht L, Shepherd GM, Zhang X, Knott GW, Svoboda K. Transient and persistent dendritic spines in the neocortex in vivo. Neuron. 2005;45:279–291. doi: 10.1016/j.neuron.2005.01.003. [DOI] [PubMed] [Google Scholar]
- Kharazia VN, Weinberg RJ. Immunogold localization of AMPA and NMDA receptors in somatic sensory cortex of albino rat. J Comp Neurol. 1999;412:292–302. doi: 10.1002/(sici)1096-9861(19990920)412:2<292::aid-cne8>3.0.co;2-g. [DOI] [PubMed] [Google Scholar]
- Kim CH, Lisman JE. A role of actin filament in synaptic transmission and long-term potentiation. J Neurosci. 1999;19:4314–4324. doi: 10.1523/JNEUROSCI.19-11-04314.1999. [DOI] [PMC free article] [PubMed] [Google Scholar]
- Kim CH, Takamiya K, Petralia RS, Sattler R, Yu S, Zhou W, Kalb R, Wenthold R, Huganir R. Persistent hippocampal CA1 LTP in mice lacking the C-terminal PDZ ligand of GluR1. Nat Neurosci. 2005;8:985–987. doi: 10.1038/nn1432. [DOI] [PubMed] [Google Scholar]
- Kim E, Sheng M. PDZ domain proteins of synapses. Nat Rev Neurosci. 2004;5:771–781. doi: 10.1038/nrn1517. [DOI] [PubMed] [Google Scholar]
- Kopec CD. Watson School of Biological Sciences. Cold Spring Harbor, NY: Cold Spring Harbor Laboratory; 2006. AMPA receptor trafficking and their effect on spine enlargement during long-term potentiation; p. 272. [Google Scholar]
- Kopec CD, Li B, Wei W, Boehm J, Malinow R. Glutamate receptor exocytosis and spine enlargement during chemically induced long-term potentiation. J Neurosci. 2006;26:2000–2009. doi: 10.1523/JNEUROSCI.3918-05.2006. [DOI] [PMC free article] [PubMed] [Google Scholar]
- Krucker T, Siggins GR, Halpain S. Dynamic actin filaments are required for stable long-term potentiation (LTP) in area CA1 of the hippocampus. Proc Natl Acad Sci USA. 2000;97:6856–6861. doi: 10.1073/pnas.100139797. [DOI] [PMC free article] [PubMed] [Google Scholar]
- Lee HK, Takamiya K, Han JS, Man H, Kim CH, Rumbaugh G, Yu S, Ding L, He C, Petralia RS, Wenthold RJ, Gallagher M, Huganir RL. Phosphorylation of the AMPA receptor GluR1 subunit is required for synaptic plasticity and retention of spatial memory. Cell. 2003;112:631–643. doi: 10.1016/s0092-8674(03)00122-3. [DOI] [PubMed] [Google Scholar]
- Lin B, Kramar EA, Bi X, Brucher FA, Gall CM, Lynch G. Theta stimulation polymerizes actin in dendritic spines of hippocampus. J Neurosci. 2005;25:2062–2069. doi: 10.1523/JNEUROSCI.4283-04.2005. [DOI] [PMC free article] [PubMed] [Google Scholar]
- Lledo PM, Zhang X, Sudhof TC, Malenka RC, Nicoll RA. Postsynaptic membrane fusion and long-term potentiation. Science. 1998;279:399–403. doi: 10.1126/science.279.5349.399. [DOI] [PubMed] [Google Scholar]
- Lu W, Man H, Ju W, Trimble WS, MacDonald JF, Wang YT. Activation of synaptic NMDA receptors induces membrane insertion of new AMPA receptors and LTP in cultured hippocampal neurons. Neuron. 2001;29:243–254. doi: 10.1016/s0896-6273(01)00194-5. [DOI] [PubMed] [Google Scholar]
- Magee JC, Johnston D. A synaptically controlled, associative signal for Hebbian plasticity in hippocampal neurons. Science. 1997;275:209–213. doi: 10.1126/science.275.5297.209. [DOI] [PubMed] [Google Scholar]
- Malinow R, Malenka R. AMPA receptor trafficking and synaptic plasticity. Annu Rev Neurosci. 2002;25:103–126. doi: 10.1146/annurev.neuro.25.112701.142758. [DOI] [PubMed] [Google Scholar]
- Marchant JS, Stutzmann GE, Leissring MA, LaFerla FM, Parker I. Multiphoton-evoked color change of DsRed as an optical highlighter for cellular and subcellular labeling. Nat Biotechnol. 2001;19:645–649. doi: 10.1038/90249. [DOI] [PubMed] [Google Scholar]
- Markram H, Lubke J, Frotscher M, Sakmann B. Regulation of synaptic efficacy by coincidence of postsynaptic APs and EPSPs. Science. 1997;275:213–215. doi: 10.1126/science.275.5297.213. [DOI] [PubMed] [Google Scholar]
- Matsuzaki M, Honkura N, Ellis-Davies G, Kasai H. Structural basis of long-term potentiation in single dendritic spines. Nature. 2004;429:761–766. doi: 10.1038/nature02617. [DOI] [PMC free article] [PubMed] [Google Scholar]
- Miesenbock G, De Angelis DA, Rothman JE. Visualizing secretion and synaptic transmission with pH-sensitive green fluorescent proteins. Nature. 1998;394:192–195. doi: 10.1038/28190. [DOI] [PubMed] [Google Scholar]
- Nusser Z, Lujan R, Laube G, Roberts JD, Molnar E, Somogyi P. Cell type and pathway dependence of synaptic AMPA receptor number and variability in the hippocampus. Neuron. 1998;21:545–559. doi: 10.1016/s0896-6273(00)80565-6. [DOI] [PubMed] [Google Scholar]
- Okamoto K, Nagai T, Miyawaki A, Hayashi Y. Rapid and persistent modulation of actin dynamics regulates postsynaptic reorganization underlying bidirectional plasticity. Nat Neurosci. 2004;7:1104–1112. doi: 10.1038/nn1311. [DOI] [PubMed] [Google Scholar]
- Otmakhov N, Khibnik L, Otmakhova N, Carpenter S, Riahi S, Asrican B, Lisman J. Forskolin-induced LTP in the CA1 hippocampal region is NMDA receptor dependent. J Neurophysiol. 2004;91:1955–1962. doi: 10.1152/jn.00941.2003. [DOI] [PubMed] [Google Scholar]
- Pak DT, Yang S, Rudolph-Correia S, Kim E, Sheng M. Regulation of dendritic spine morphology by SPAR, a PSD-95-associated RapGAP. Neuron. 2001;31:289–303. doi: 10.1016/s0896-6273(01)00355-5. [DOI] [PubMed] [Google Scholar]
- Park M, Penick EC, Edwards JG, Kauer JA, Ehlers MD. Recycling endosomes supply AMPA receptors for LTP. Science. 2004;305:1972–1975. doi: 10.1126/science.1102026. [DOI] [PubMed] [Google Scholar]
- Park M, Salgado JM, Ostroff L, Helton TD, Robinson CG, Harris KM, Ehlers MD. Plasticity-induced growth of dendritic spines by exocytic trafficking from recycling endosomes. Neuron. 2006;52:817–830. doi: 10.1016/j.neuron.2006.09.040. [DOI] [PMC free article] [PubMed] [Google Scholar]
- Passafaro M, Piech V, Sheng M. Subunit-specific temporal and spatial patterns of AMPA receptor exocytosis in hippocampal neurons. Nat Neurosci. 2001;4:917–926. doi: 10.1038/nn0901-917. [DOI] [PubMed] [Google Scholar]
- Penzes P, Johnson RC, Sattler R, Zhang X, Huganir RL, Kambampati V, Mains RE, Eipper BA. The neuronal Rho-GEF Kalirin-7 interacts with PDZ domain-containing proteins and regulates dendritic morphogenesis. Neuron. 2001;29:229–242. doi: 10.1016/s0896-6273(01)00193-3. [DOI] [PubMed] [Google Scholar]
- Plant K, Pelkey KA, Bortolotto ZA, Morita D, Terashima A, McBain CJ, Collingridge GL, Isaac JT. Transient incorporation of native GluR2-lacking AMPA receptors during hippocampal long-term potentiation. Nat Neurosci. 2006;9:602–604. doi: 10.1038/nn1678. [DOI] [PubMed] [Google Scholar]
- Qin Y, Zhu Y, Baumgart JP, Stornetta RL, Seidenman K, Mack V, van Aelst L, Zhu JJ. State-dependent Ras signaling and AMPA receptor trafficking. Genes Dev. 2005;19:2000–2015. doi: 10.1101/gad.342205. [DOI] [PMC free article] [PubMed] [Google Scholar]
- Racz B, Weinberg RJ. Spatial organization of cofilin in dendritic spines. Neuroscience. 2006;138:447–456. doi: 10.1016/j.neuroscience.2005.11.025. [DOI] [PubMed] [Google Scholar]
- Roche KW, O'Brien RJ, Mammen AL, Bernhardt J, Huganir RL. Characterization of multiple phosphorylation sites on the AMPA receptor GluR1 subunit. Neuron. 1996;16:1179–1188. doi: 10.1016/s0896-6273(00)80144-0. [DOI] [PubMed] [Google Scholar]
- Rumbaugh G, Sia GM, Garner CC, Huganir RL. Synapse-associated protein-97 isoform-specific regulation of surface AMPA receptors and synaptic function in cultured neurons. J Neurosci. 2003;23:4567–4576. doi: 10.1523/JNEUROSCI.23-11-04567.2003. [DOI] [PMC free article] [PubMed] [Google Scholar]
- Rumpel S, LeDoux J, Zador A, Malinow R. Postsynaptic receptor trafficking underlying a form of associative learning. Science. 2005;308:83–88. doi: 10.1126/science.1103944. [DOI] [PubMed] [Google Scholar]
- Sala C, Piech V, Wilson NR, Passafaro M, Liu G, Sheng M. Regulation of dendritic spine morphology and synaptic function by Shank and Homer. Neuron. 2001;31:115–130. doi: 10.1016/s0896-6273(01)00339-7. [DOI] [PubMed] [Google Scholar]
- Shaner NC, Campbell RE, Steinbach PA, Giepmans BN, Palmer AE, Tsien RY. Improved monomeric red, orange and yellow fluorescent proteins derived from Discosoma sp. red fluorescent protein. Nat Biotechnol. 2004;22:1567–1572. doi: 10.1038/nbt1037. [DOI] [PubMed] [Google Scholar]
- Sheng M, Kim MJ. Postsynaptic signaling and plasticity mechanisms. Science. 2002;298:776–780. doi: 10.1126/science.1075333. [DOI] [PubMed] [Google Scholar]
- Shi S. Neuroscience. Stony Brook, NY: State University of New York; 2000. Molecular mechanisms for synaptic regulation of AMPA receptors; p. 146. [Google Scholar]
- Shi S, Hayashi Y, Esteban JA, Malinow R. Subunit-specific rules governing AMPA receptor trafficking to synapses in hippocampal pyramidal neurons. Cell. 2001;105:331–343. doi: 10.1016/s0092-8674(01)00321-x. [DOI] [PubMed] [Google Scholar]
- Song I, Huganir RL. Regulation of AMPA receptors during synaptic plasticity. Trends Neurosci. 2002;25:578–588. doi: 10.1016/s0166-2236(02)02270-1. [DOI] [PubMed] [Google Scholar]
- Songyang Z, Fanning AS, Fu C, Xu J, Marfatia SM, Chishti AH, Crompton A, Chan AC, Anderson JM, Cantley LC. Recognition of unique carboxyl-terminal motifs by distinct PDZ domains. Science. 1997;275:73–77. doi: 10.1126/science.275.5296.73. [DOI] [PubMed] [Google Scholar]
- Stein V, House DR, Bredt DS, Nicoll RA. Postsynaptic density-95 mimics and occludes hippocampal long-term potentiation and enhances long-term depression. J Neurosci. 2003;23:5503–5506. doi: 10.1523/JNEUROSCI.23-13-05503.2003. [DOI] [PMC free article] [PubMed] [Google Scholar]
- Stewart MG, Medvedev NI, Popov VI, Schoepfer R, Davies HA, Murphy K, Dallerac GM, Kraev IV, Rodriguez JJ. Chemically induced long-term potentiation increases the number of perforated and complex postsynaptic densities but does not alter dendritic spine volume in CA1 of adult mouse hippocampal slices. Eur J Neurosci. 2005;21:3368–3378. doi: 10.1111/j.1460-9568.2005.04174.x. [DOI] [PubMed] [Google Scholar]
- Stoppini L, Buchs PA, Muller D. A simple method for organotypic cultures of nervous tissue. J Neurosci Methods. 1991;37:173–182. doi: 10.1016/0165-0270(91)90128-m. [DOI] [PubMed] [Google Scholar]
- Sun W, Yan Q, Vida TA, Bean AJ. Hrs regulates early endosome fusion by inhibiting formation of an endosomal SNARE complex. J Cell Biol. 2003;162:125–137. doi: 10.1083/jcb.200302083. [DOI] [PMC free article] [PubMed] [Google Scholar]
- Takahashi T, Svoboda K, Malinow R. Experience strengthening transmission by driving AMPA receptors into synapses. Science. 2003;299:1585–1588. doi: 10.1126/science.1079886. [DOI] [PubMed] [Google Scholar]
- Takumi Y, Ramirez-Leon V, Laake P, Rinvik E, Ottersen OP. Different modes of expression of AMPA and NMDA receptors in hippocampal synapses. Nat Neurosci. 1999;2:618–624. doi: 10.1038/10172. [DOI] [PubMed] [Google Scholar]
- Tolias KF, Bikoff JB, Burette A, Paradis S, Harrar D, Tavazoie S, Weinberg RJ, Greenberg ME. The Rac1-GEF Tiam1 couples the NMDA receptor to the activity-dependent development of dendritic arbors and spines. Neuron. 2005;45:525–538. doi: 10.1016/j.neuron.2005.01.024. [DOI] [PubMed] [Google Scholar]
- Triller A, Choquet D. Surface trafficking of receptors between synaptic and extrasynaptic membranes: and yet they do move! Trends Neurosci. 2005;28:133–139. doi: 10.1016/j.tins.2005.01.001. [DOI] [PubMed] [Google Scholar]
- Van Harreveld A, Fifkova E. Swelling of dendritic spines in the fascia dentata after stimulation of the perforant fibers as a mechanism of post-tetanic potentiation. Exp Neurol. 1975;49:736–749. doi: 10.1016/0014-4886(75)90055-2. [DOI] [PubMed] [Google Scholar]
- Vazquez LE, Chen HJ, Sokolova I, Knuesel I, Kennedy MB. SynGAP regulates spine formation. J Neurosci. 2004;24:8862–8872. doi: 10.1523/JNEUROSCI.3213-04.2004. [DOI] [PMC free article] [PubMed] [Google Scholar]
- Watt AJ, Sjostrom PJ, Hausser M, Nelson SB, Turrigiano GG. A proportional but slower NMDA potentiation follows AMPA potentiation in LTP. Nat Neurosci. 2004;7:518–524. doi: 10.1038/nn1220. [DOI] [PubMed] [Google Scholar]
- Xie Z, Huganir RL, Penzes P. Activity-dependent dendritic spine structural plasticity is regulated by small GTPase Rap1 and its target AF-6. Neuron. 2005;48:605–618. doi: 10.1016/j.neuron.2005.09.027. [DOI] [PubMed] [Google Scholar]