

Abstract
Introduction
Neutrophils display an array of behaviors ranging from rolling and migration to phagocytosis and granule secretion. Several of these behaviors are modulated by the local shear conditions. In the normal circulation, neutrophils experience shear rates from approximately 10–2000 s−1. However, neutrophils are also exposed to pathological shear levels in natural conditions such as severe stenosis and arteriosclerosis, as well as in blood-contacting devices such as ventricular assist devices and hemodialysis machines. The effects of transiently (< 1 s) exposing neutrophils to abnormally high shear rates (> 3000 s−1) are not well understood.
Methods
We developed a set of microfluidic devices capable of exposing neutrophils to high shear rates for short durations (100–400 ms). Suspensions of isolated neutrophils were perfused through the devices and their rolling velocities on P-selectin were analyzed before and after shear exposure.
Results
We observed a significant increase in neutrophil rolling velocities on P-selectin coated regions following transient high shear exposure. The magnitude of the rolling velocity increase was dependent upon the duration of high shear exposure and became statistically significant for exposure times of 310 ms or longer. When polystyrene beads coated with a glycosulfopeptide that mimics the binding region of P-selectin glycoprotein ligand-1 (PSGL-1) were perfused through the devices, no change between the pre-shear and post-shear rolling velocities was observed.
Conclusions
These results suggest that high shear levels alter normal neutrophil rolling behavior and are important for understanding neutrophil biology in high shear conditions, as well as for improving medical device performance.
Electronic supplementary material
The online version of this article (10.1007/s12195-018-0533-z) contains supplementary material, which is available to authorized users.
Keywords: Shear rate, P-selectin, Microfluidics, Rolling, Neutrophil, Ventricular assist device
Introduction
Neutrophils are one of the most important cell contributors to the immune response, due to their role as first responders of the innate immune system. This role requires a diverse range of function and behavior including rolling, migration, phagocytosis, secretion of activating molecules for the recruitment of other leukocytes and platelets, apoptosis, and extracellular trap formation.4,31 In addition, neutrophils have been implicated to play a role in a number of health complications such as cancer14,41 and thrombosis.24,53 Since neutrophils reside within the bloodstream, they are naturally exposed to a wide array of shear conditions, at both arterial and venous levels. On the venous side, it is well known that wall shear rates, which normally range from approximately 10–1000 s−1, modulate neutrophil rolling via selectins.2,3,12,25,27,29 Furthermore, there have been reports that fluid shear can affect other neutrophil behavior such as the activation state or receptor levels.15,17,33,34,46
Most studies of neutrophil behavior in response to shear have focused on physiological shear stresses in the range of 50–2000 s−1. However, neutrophils and other blood cells can be introduced to a wide variety of higher shear rates stemming from both physiological and non-physiological origins. Shear rates can range up to approximately 2000 s−1 in the arterial system, with pathophysiological shear rates starting around 3000–10,000 s−1 in atherosclerotic vessels and stenosis, with severe stenosis (above 90% blockage) potentially increasing beyond this point.26,39,51 In addition to these pathophysiologic sources, a variety of devices can introduce blood cells to increased shear rates. Ventricular assist devices (VADs) are one such example, with high shear rates present primarily around the rotors of the pumps. Maximum shear rates in these devices vary depending on the type of device and flow path of the cell, but can reach as high as 100,000 s−1. The exposure time for such shear rates ranges from approximately 1–15 ms.49 Average shear exposures in certain types of VADs can be encountered over several hundred milliseconds at relatively lower shear rates around 3000 s−1.13 Other devices, such as hemodialysis machines designed to filter blood, also create new points of high shear in the approximately 2000 s−1 range, as well as possible atherosclerotic vulnerable regions.50 Many of these devices, despite their clinical utility, have seen a variety of complications encountered throughout the device lifetime, including high infection rates, bleeding rates, thrombosis, hemolysis, and several other symptoms.19,47,50 Infection has been reported in 20–60% of VAD patients, with sepsis the leading cause of death. While this is generally attributed to biomaterial interaction with tissue, the persistence of infections throughout the device lifetime suggest that this viewpoint may be incomplete. In addition, some studies have indicated that approximately 40% of these infections are not directly related to the device itself.19
Recent studies have revealed that shear not only affects rolling but other neutrophil functions and receptor levels as well. Fluid shear can affect cell shape and pseudopod retraction,9,16,17,30,35,46 cell stiffness,10,35 receptor integrin levels,1,15,55 and cell activation.45,46 More recent studies have elucidated the ability of neutrophils to sense and react to shear through various surface receptors. Notably, Mitchell et al.33,34 have examined the effect of venous shear rates (10–400 s−1 for 1–120 min) on various receptors related to neutrophil activation and sensing. Surprisingly, n-formylmethionine-leucyl-phenylalanine (fMLP) receptor decreased in expression level following shear exposure,33 while shear exposure caused the platelet activating factor (PAF) receptor level to increase.34 Similarly, other studies have reported a change in receptor expression levels, such as a decrease in CD18 levels due to cleavage following prolonged exposure to shear.15
Few studies have examined the effect on leukocyte behavior of high shear rates above 3000 s−1 present in pathological conditions and in some blood-contacting biomedical devices such as VADs and hemodialysis. Almost all of the leukocyte studies that have examined the exposure time have been on the scale of minutes to hours, rather than a clinically relevant, millisecond exposure time9,15,17,33 encountered in vivo. Since 2003, there has been only one study examining the effects of millisecond exposure to high shear rates on leukocyte function. In the study by Carter et al.,6 whole blood was perfused through capillary flow chambers of various lengths and diameters to produce shear rates of 3700–34,000 s−1 and exposure times of 90 and 125 ms. They observed that exposure of whole blood to a shear rate of ~ 3700 s−1 for 90 or 125 ms was sufficient to reduce the phagocytic ability of leukocytes.
The traditional method to expose leukocytes to high shear is with the cone and plate viscometer, due to the fact that it applies a uniform shear magnitude to all of the cells in a sample. Although studies employing the cone and plate viscometer have led to an abundance of information on the effects of shear on neutrophil biology, the startup times for these devices limit their use in studies that involve transient (< 1 s) high shear exposure. In addition, they do not mimic the flow geometry that neutrophils experience during interactions with the vessel wall or allow for rolling behavior to be studied.
The aim of this study was to develop a microfluidic assay that could mimic the transient, high shear exposure environments that are relevant to pathological conditions present in stenosis and blood-contacting medical devices. We describe the fabrication of a series of microfluidic channels that have constricted regions of varying length and the characterization of their velocity and shear profiles by microparticle image velocimetry (μPIV). The microfluidic devices were designed to (i) utilize small sample amounts (< 500 μL), (ii) allow for precise control over fluid shear rates and high shear exposure times, and (iii) allow for real-time optical microscopy imaging. By perfusing suspensions of isolated neutrophils over P-selectin coated Petri dishes through constricted microfluidic devices, we were able to detect changes in neutrophil rolling velocities over P-selectin coated regions following transient exposure to high shear conditions. We demonstrated that the changes in rolling velocity were related to the duration of the high shear exposure.
Methods
Proteins and Reagents
FITC tagged mouse-anti-PSGL-1 mAb PL1 was purchased from MBL (Woburn, MA), while unlabeled PL1 was purchased from Ancell (Bayport, MN). P-selectin purified from human platelet membranes and 2-glycosulfopeptide (GSP-6) were kindly provided by Dr. Rodger McEver (Oklahoma Medical Research Foundation).
Neutrophil Collection and Isolation from Whole Blood
Blood was collected via venipuncture into heparin coated vacutainers from healthy adult volunteers after informed consent was acquired, according to a University of Texas at Dallas Institutional Review Board (IRB) approved process. Neutrophils were isolated from whole blood using poly-lympholyte solution (Cedarlane, Burlington, NC) according to the manufacturer’s instructions. Five milliliters of whole blood was slowly layered upon an equal volume of the lympholyte solution and spun for 35 min at 500×g. The granulocyte layer was carefully removed and washed in an equal volume of 0.4% (w/w) sodium chloride (NaCl), followed by Hanks balanced salt solution (HBSS, Lonza BioWhittaker, Allendale, NJ) without calcium and magnesium. Cells were centrifuged at room temperature at 450×g for 15 min. Residual erythrocytes were then lysed with a hypotonic salt solution: 0.2% NaCl followed by an equal volume of 1.6% NaCl. After centrifugation for 10 min, the isolated neutrophils were washed three times with 0.5% human serum albumin (HSA; Octapharma, Hoboken, NJ) in HBSS without calcium and magnesium. Washes were done for 5 min each. All spin steps were done at room temperature at 450×g unless otherwise noted. Cells were then resuspended at 4 × 10⁵ cells/mL in 0.5% HSA in HBSS with calcium and magnesium.
Design, Fabrication, and Assembly of the Microfluidic Shearing Device
To assess the effect of short exposure to high shear on neutrophil behavior, microfluidic chambers were designed to create two low shear regions flanking a high shear constriction (Fig. 1). The two wider regions flanking the high shear constriction provide low shear regions that allow one to measure the effects of shear exposure on cell rolling velocity. Straight microfluidic channels with a constant width were also fabricated and served as a control by providing a baseline rolling velocity. Microfluidic devices were prepared from poly-dimethyl siloxane (PDMS; Dow Corning, Midland, MI) in a 10:1 ratio as previously described.8,44 Briefly, the master mold was fabricated through a standard negative photolithography technique using KMPR 1050 photoresist (MicroChem, Westborough, MA). The dimensions of the different microfluidic channels fabricated are listed in Fig. 1. PDMS was poured over the photoresist mold and degassed for 1 h. Elbow outlet ports (Value Plastics, Fort Collins, CO) were then placed at one end, and wafers placed in an oven at 80 °C for at least 1 h to cure. To assemble the device, 15 μL drops of membrane P-selectin (mPs; 0.75 µg/mL), were deposited on plastic Petri dishes and incubated overnight in a humidified environment at 4 °C. After overnight incubation, the mPs was rinsed with HBSS, and the Petri dishes were incubated with a 0.5% HSA solution to prevent non-specific binding. After 30 min of blocking, the HSA solution was carefully removed and replaced with HBSS until use in the rolling assay. Next, the HBSS solution was removed from the Petri dish, and the PDMS microfluidic channel was carefully positioned on the Petri dish (via alignment marks built into the PDMS structure) so that the wide upstream and downstream regions on the channel were placed over the P-selectin coated regions (Fig. 2). The PDMS stamps were sealed to the plastic Petri dishes using a vacuum seal. The vacuum seal consisted of an array of posts (diameter = 500 µm, spacing = 500 µm).36 Channels were charged and blocked with the 0.5% HSA solution for 10 min prior to cell rolling experiments.
Figure 1.

Schematic of the constricted microfluidic channels and their dimensions.
Figure 2.

Overview of the microfluidic device assembly and neutrophil rolling assay. Drops of membrane P-selectin are deposited on a plastic petri dish and incubated overnight at 4 °C. The petri dish is then washed with buffer (HBSS) and blocked with human serum albumin (HSA). The constricted microfluidic device is carefully placed on the petri dish so that the low shear upstream and downstream regions are positioned over the P-selectin coated regions. The microfluidic device is reversibly bonded to the petri dish by applying a vacuum, placed on an inverted microscope stage, and filled with buffer containing HSA to prevent nonspecific adhesion to the channel ceiling and walls. A suspension of isolated neutrophils is then perfused through the device and images of rolling neutrophils are recorded.
Flow Characterization of Microfluidic Channels
The shear rate and exposure time in the constricted region were controlled by both the channel dimensions and the perfusion flow rate. Theoretical velocity profiles and wall shear rates were calculated based on the channel dimensions using an approximation for rectangular die with low aspect (width:height) ratios.48 Experimental velocity profiles in the channels were measured using a µPIV system (TSI, Shoreview, MN) and perfusing fluorescent beads through microfluidic devices sealed to glass coverslips (#1.5, Fisher Scientific). A double pulsed Nd:YAG laser was used to illuminate 1 µm fluorescent beads (Molecular Probes, Eugene, OR). The velocities of the fluorescent beads were measured at three regions: upstream of the constriction, downstream of the constriction, and within the high shear constriction. In the upstream and downstream regions of the microfluidic channels, z planes at 5 µm intervals were taken to characterize the velocity profile from the channel floor to the center region of the channel, while in the constricted region z planes were taken throughout the entire height. Fluorescent images of the beads were taken using a Zeiss AxioObserver microscope equipped with a 40× oil objective (1.4NA), a 16MP PowerView camera, and a synchronization controller. The delay between laser pulses was set from 6 to 2000 µs depending on the location within the channel. Velocities were determined using Insight 4G software. Velocity profiles and wall shear rates were then subsequently created and calculated in Matlab.
Neutrophil and Bead Rolling Assays
Isolated neutrophils were perfused through the microfluidic devices at 4 × 10⁵ cells/mL. The channels were perfused with buffer for 2 min to stabilize the flow prior to the introduction of the cells. Cells were imaged using a Zeiss AxioObserver equipped with a 10× phase contrast objective (0.25NA) and a digital camera (Orcaflash 4.0; Hamamatsu, Bridgewater, NJ) at 30 frames per second. At least 30 cells were tracked in both the upstream and downstream region for each channel and shear condition, and instantaneous velocities were measured over a five second interval. Instantaneous velocities were determined using the particle tracking function in ImagePro Premier. The average of the instantaneous velocities was then determined and the average taken over the 30 cells. Channels using neutrophils from at least five different donors were collected for each condition.
Microspheres bearing 2-glycosulfopeptide (GSP-6), which is a glycosulfopeptide modeled after the P-selectin binding region of PSGL-1, were prepared as described previously.54 Briefly, 10 µm polystyrene beads (Polysciences, Warrington, PA) were washed three times with HBSS to remove the surfactant in the storage buffer. The beads were then coated overnight with end-over-end rotation in 1% neutravidin in HBSS. Beads were blocked for 30 min with rotation in a 1% HSA solution in HBSS before being incubated with biotinylated GSP-6 for 3.5 h on ice, with vortexing every 30 min. The beads were then washed 3 times with HBSS. GSP-6 concentration on the bead surface was measured via flow cytometry using a FITC conjugated mAb PL-1. Samples were analyzed at slow acquisition speed on a BD Accuri C6 flow cytometer (Franklin Lakes, NJ).
Analysis of PSGL-1 Levels
In order to collect sufficient sample volume for flow cytometric analysis, a second set of channels was designed and fabricated with cross-sectional dimensions (height = 120 μm, width = 90 μm) that were two times larger than the original channels. These larger channels exposed the cells to the same wall shear rate, but at a flow rate (40 μL/min) that was 8 times larger, which provided enough neutrophil sample volume (200 μL) for flow cytometric analysis. These experiments were performed in a similar manner to the rolling experiments. First, buffer was perfused through the channels for 2 min to stabilize the flow before the addition of cells. Cells were then perfused through the channels and collected for 5 min. In control experiments, suspensions of unsheared, isolated neutrophils were incubated for 10 min at 37 °C in buffer (unstimulated) or with 10 nM phorbol 12-myristate acetate (PMA) (stimulated). It has been reported that exposure to PMA reduces surface expression of PSGL-1 on neutrophils.11,18 Cells were then spun down at 500×g for 5 min and labeled with PL-1 on ice for 30 min. Cells were washed with 1 mL of 0.5% HSA in HBSS, then resuspended in anti-mouse 488 secondary antibody for 30 min on ice. Cells were washed again with 1 mL of 0.5% HSA in HBSS, then resuspended in this same solution for flow cytometric analysis.
Statistical Analysis
All velocity values are reported as the mean ± standard error of the mean. Statistical significance of rolling velocities was assessed using paired student t tests with p < 0.05 considered significant. Comparison of PSGL-1 levels were analyzed via ANOVA with a Sidak post hoc test, with p < 0.05 considered significant.
Results
Flow Field Characterization
Neutrophil rolling on selectins is dependent upon the shear level and normally occurs under venous levels of shear (50–1000 s−1).25,27 In order to determine the fluid velocity and shear rate profiles in the microfluidic channels, both theoretical and experimental analyses were performed. The theoretical velocity profiles in the microfluidic channels were calculated using the Navier–Stokes equation for a rectangular channel. This equation can be simplified to and solved for the velocity at a position y and z from the center of the channel38:
| 1 |
Here, y is the position from the center of the channel moving towards the side walls, z is the height position from the center of the channel, a and b are half of the width and height of the channel respectively, µ is the viscosity, L is the length of the channel, and p is the pressure. Integration of Eq. (1) results in a solution for the volumetric flow rate:
| 2 |
Rearranging Eq. (2) for the pressure drop (dp/dx) and substituting into Eq. (1) allows for the determination of theoretical velocity profiles over the width and height of the channel. Figure 3 shows the theoretical fluid velocities determined for three regions of the microfluidic channel: the low shear upstream region, the high shear constriction region, and the low shear downstream region. As shown by the theoretical curves (Fig. 3), in the low shear regions of the channel, the rectangular design produced a constant velocity profile over approximately 90% of the channel, creating a uniform wall shear rate. In contrast, the constricted region exhibited a parabolic velocity profile in both the y and z directions, creating a range of velocities depending on the cell position. The experimental velocity profiles were determined by performing μPIV, using a synchronized, double pulsed PIV system to track the positions of fluorescent particles. Figure 3 shows representative velocity profiles in the xy plane that were acquired by μPIV for the upstream region (Fig. 3a), constricted region (Fig. 3b), and downstream region (Fig. 3c) of a microchannel.
Figure 3.

Representative Horizontal Velocity Vectors and Profiles in a Constricted Microfluidic Channel. The velocity vector maps (top panel) are shown for a Type C constricted microfluidic device at (a) a position upstream of the constriction, (b) in the middle of the constricted region, and (c) downstream of the constriction for z = 30 µm. The bottom panel compares the theoretical values for the velocity profiles to the experimentally measured velocity profiles near the wall for the upstream and downstream locations and throughout the constricted region.
In order to measure the 3-D velocity profile, the focal plane of the microscope was moved vertically from near the bottom wall to the center of the channel, and velocity measurements in the xy plane were taken at several different heights. Measurements near the wall, while theoretically ideal for wall shear rate calculations, are known to be difficult to measure accurately and tend to be more prone to error.37 Thus, velocities were measured at several z positions away from the wall. Because of the symmetry present in the flow profile, approximately half of the channel height was measured in the upstream/downstream regions, past the maximum velocities at the center. Figure 4 shows the results of the μPIV measurements in the upstream, downstream, and constricted regions of a microfluidic device and compares them to the theoretical predictions. As can be seen, we observed good agreement between the upstream (Fig. 4a) and downstream (Fig. 4b) velocity profiles with the theoretical profiles, and between the µPIV measured and theoretical velocity profile in the constricted region (Fig. 4c). The similarities between the upstream and downstream velocity profiles in the constricted channels suggest that any pressure drop due to the constricted regions had a minimal effect on the downstream velocity profile. We also observed good agreement between the theoretical and experimental curves for straight channel microfluidic devices (Supplementary Fig. S1), and no significant difference was observed in the velocity profiles of the upstream and downstream regions.
Figure 4.
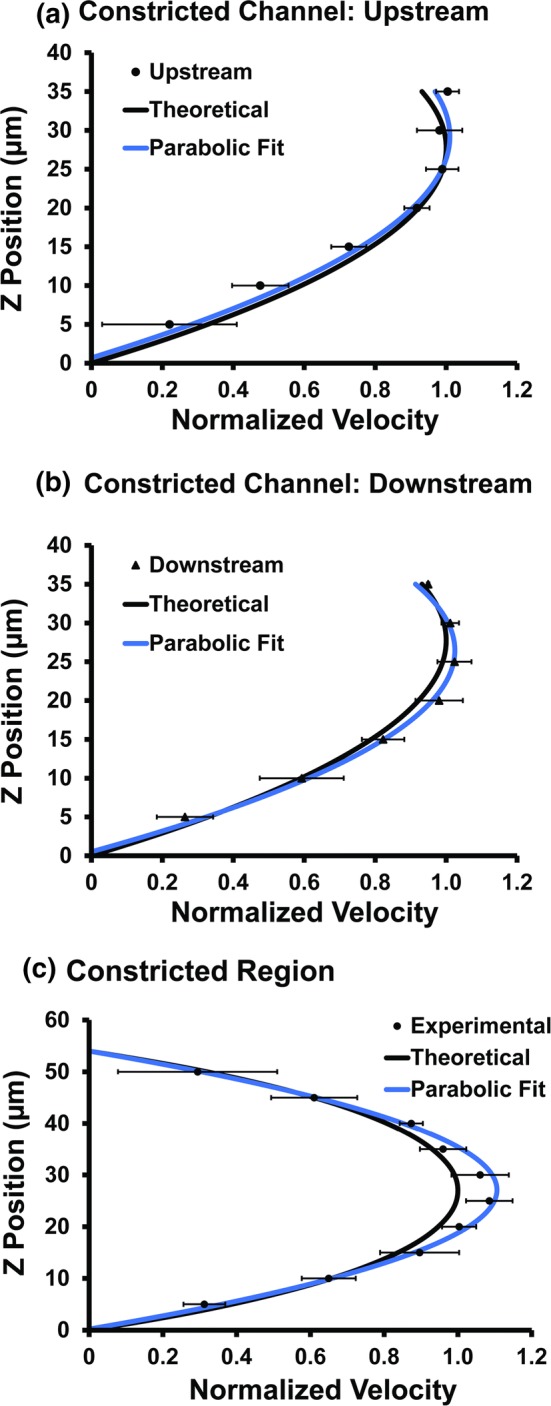
Vertical velocity profiles in a constricted microfluidic channel. Experimental velocity profiles measured by μPIV in a constricted microfluidic channel (Type C) at an (a) upstream, (b) downstream, and (c) constricted locations are compared to the analytical solution for flow through a rectangular channel and a second-order polynomial fit to the experimental velocity measurements.
Wall shear rates were calculated by fitting a parabolic regression to the measured velocities to estimate the curvature.21,32,37 The derivative of this second order fit, plugging in the z position at the wall (0 µm), provides the wall shear rate. Parabolic fits of the upstream and downstream regions of the straight microfluidic channels (Fig. S1) provided an estimated shear rate for the upstream region of 122 ± 30 s−1 and a shear rate of 123 ± 14 s−1 for the downstream region. These values were similar to the theoretical value of 125 s−1. For the constricted microfluidic channels, the parabolic fits of the upstream and downstream regions of the constricted microfluidic channel (Fig. 4) provided estimated shear rates of 111 ± 21 s−1 (upstream) and 124 ± 16 s−1 (downstream), which were similar to the theoretical value of 125 s−1. Parabolic fitting of the µPIV measurements in the constricted regions estimated the wall shear rate to be 5900 ± 300 s−1. Based on the µPIV data the exposure times in the different channels were estimated to be 100, 210, 310, and 390 ms (Fig. 1).
Effect of Transient High Shear Exposure on Neutrophil Rolling
To investigate the effect of transient high shear exposure on neutrophil rolling behavior, isolated neutrophils were perfused through the microfluidic devices and allowed to roll on P-selectin coated regions upstream and downstream of the constriction at a wall shear rate of 125 s−1. Figure 5 shows representative plots of a frame-by-frame analysis of the fluctuations in the rolling velocities of neutrophils rolling on P-selectin upstream (Fig. 5a) and downstream (Fig. 5b) of a constricted region having a high shear exposure time of 310 ms. Neutrophil rolling on the P-selectin coated region upstream of the constriction displayed a relatively constant rolling velocity with a limited number of large velocity spikes (> 15 µm/s) and a substantial number of pauses. In contrast, at the P-selectin coated region downstream of the constriction, neutrophil rolling was faster and characterized by a more variable rolling behavior, which consisted of a large number of velocity spikes and only a handful of pauses. Figure 5c shows a cumulative histogram of the rolling velocities measured at the upstream and downstream P-selectin coated regions. As indicated by a shift to the right, the mean rolling velocity of neutrophils rolling after high shear exposure (i.e., downstream region) was faster than neutrophil rolling prior to high shear exposure (i.e., upstream region).
Figure 5.

Effect of high shear exposure time on the rolling properties of neutrophils upstream and downstream of the constricted region. Instantaneous velocities of representative neutrophils rolling on P-selectin in the (a) upstream and (b) downstream regions of a Type C constricted microfluidic channel. The dotted line in each plot represents the average rolling velocity. Upstream and downstream shear rate = 125 s−1, high shear exposure time = 310 ms. (c) Cumulative histogram and average rolling velocities for the individual cells are shown in (a) and (b). (d) Average rolling velocities or (e) average velocity variances of neutrophils rolling on P-selectin at upstream and downstream locations in a straight channel (0 ms high shear exposure) and four constricted microfluidic channels with varying high shear exposure times are shown. Suspensions of neutrophils were perfused at an upstream and downstream shear rate of 125 s−1. The velocities in panel (d) are average rolling velocities for at least five different channels and donors. Bars represent the standard error of the mean.
To probe whether this observation that transient high shear exposure caused neutrophils to roll faster, and was dependent upon the exposure time, we perfused neutrophils through a complementary set of microfluidic channels with varying lengths (3.9–15.0 mm) of the constricted region, and we measured neutrophil rolling velocities upstream and downstream of the constriction. The lengths of these constricted regions are comparable to the lengths reported for coronary lesions (12.49 ± 7.52 mm)20 and to the stenosis lengths (> 15 mm) used as a criteria for defining diffuse coronary artery disease (CAD).52 The resultant high shear exposure times in our microfluidic devices ranged from 100 to 390 ms. As a control, we also perfused neutrophils through straight channel microfluidics. Figure 5d shows the mean rolling velocities and variance of velocities of neutrophils rolling on P-selectin coated regions upstream and downstream of a constriction. When neutrophils were exposed to a constant low shear rate (125 s−1) in microfluidics with a straight channel geometry, we observed no statistical difference between the upstream and downstream rolling velocities. Exposure of neutrophils to high shear (5900 s−1) for 100 or 210 ms showed small increases (1.2 fold and 1.3 fold) in their downstream rolling velocity; however, these increases were not statistically significant (p > 0.05). Increasing the high shear exposure time to 310 ms led to a 1.5 fold increase in the rolling velocity while an exposure time of 390 ms resulted in a 1.4 fold increase. Analysis of the variances of the upstream and downstream rolling velocities (Fig. 5e) showed a similar trend in that the degree of rolling irregularity increased with exposure time. Taken together these results suggest that transient exposure to high shear causes neutrophils to roll faster and less uniformly.
Effect of Transient High Shear Exposure on PSGL-1 Levels
One potential explanation for the increased neutrophil rolling velocities observed is that exposure to high shear may induce shedding or redistribution of PSGL-1, the native ligand on neutrophils for P-selectin. In support of this suggestion are the reports that fluid shear can activate and induce the cleavage of other neutrophil receptors such as CD181,7,15,45,55 and the formyl peptide receptor (FPR).33 Likewise, activation of neutrophils can lead to shedding and/or redistribution of PSGL-1,5,11 as well as L-selectin.23 It should be noted, however, that there are no reports that PSGL-1 is shed due to high shear exposure.
To examine the possible role of PSGL-1 shedding as the mechanism inducing faster rolling velocities in the downstream region of the devices, PSGL-1 levels were examined via flow cytometry. Figure 6 shows that there was no difference in the PSGL-1 levels for unsheared neutrophils, neutrophils perfused through a straight channel at a constant low shear rate (125 s−1), and through a high shear (5900 s−1) constricted microfluidic channel with a 310 ms exposure time. As a positive control, we also performed flow cytometric analysis of PSGL-1 levels on neutrophils exposed to PMA, which has been shown to reduce PSGL-1 levels.11,18 Similar to these previous studies, we also detected a significant drop (~ 50%) in PSGL-1 levels upon exposure to PMA. These results suggest that PSGL-1 shedding was not the cause for the increased rolling velocities following shear.
Figure 6.
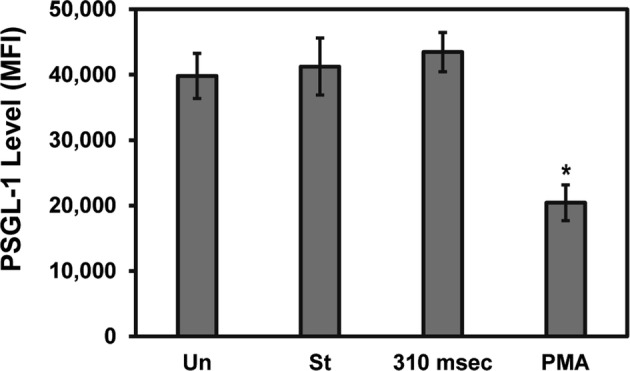
Effect of transient high shear exposure on surface levels of PSGL-1. Suspensions of isolated neutrophils were perfused through straight (St) and a constricted (310 ms) channel microfluidic devices, the effluents collected and labeled with an anti-PSGL-1 antibody (PL1) followed by a secondary antibody, and the expression level of PSGL-1 on the surface of neutrophils was analyzed by flow cytometry. Unsheared (Un) samples or samples incubated with 10 nM PMA served as negative and positive controls. The data is shown as the mean fluorescent intensity ± standard error of the mean and is representative of five independent experiments with different donors. Statistical significance of the differences between the samples and the unsheared sample was measured using ANOVA with a Sidak post hoc test (*p < 0.05).
Effect of Transient High Shear Exposure on GSP-6 Coated Bead Rolling
A second possible explanation for the increase in rolling velocities downstream of the constriction is that, despite the agreement between the upstream and downstream PIV measurements, there may be small differences in the upstream and downstream shear rates. To test this possibility, we performed a complementary set of experiments in which we perfused GSP-6 coated polystyrene microspheres through the 310 ms constricted channels and examined their rolling behavior. Frame-by-frame analysis of the rolling microspheres showed that they exhibited an irregular velocity profile at both the upstream (Fig. 7a) and downstream (Fig. 7b) P-selectin coated regions. Analysis of the upstream and downstream cumulative velocity profiles (Fig. 7c) showed no shift, suggesting no difference in the rolling velocities following high shear exposure. These observations were statistically confirmed by comparing the mean rolling velocities (Fig. 7d) and velocity variances (Fig. 7e) for a total of 60 beads rolling on the upstream and downstream P-selectin coated regions. Since the rolling velocity of GSP-6 coated beads is more sensitive to changes in shear rate,43,54 these results provide strong evidence that the rolling velocity changes observed with neutrophils were not due to differences in the upstream and downstream shear rates.
Figure 7.

Rolling properties of GSP-6 coated beads upstream and downstream of the constricted region. Instantaneous velocities of GSP-6 coated polystyrene beads (D = 10 µm) rolling on P-selectin in the (a) upstream and (b) downstream regions of a Type C constricted microfluidic channel. The dotted line in each plot represents the average rolling velocity. Upstream and downstream shear rate = 125 s−1, high shear exposure time = 310 ms. (c) Cumulative histogram and average rolling velocities for the individual beads shown in (a) and (b). (d) Average rolling velocities or (e) average velocity variances of GSP-6 beads rolling on P-selectin at upstream and downstream locations. The velocities in panel (d) are average rolling velocities for at least 60 beads. Bars represent the standard error of the mean.
Conclusions
In this study, we describe the development of a simple microfluidic method for investigating the effects of transient high shear exposure on neutrophil behavior. This technique has the advantage of (i) utilizing small amounts of sample; (ii) providing precise control over the shear rate and exposure time; and (iii) allowing for instantaneous measurement of leukocyte rolling velocity following transient high shear exposure. We demonstrate that exposure of neutrophils to high shear (5900 s−1) led to increases in the rolling velocity, which became statistically significant for exposure times > 310 ms. At this time, the exact cause of the increase in rolling velocity following transient high shear exposure is unknown. One possible explanation is that high shear exposure causes the neutrophil’s cytoskeleton to rearrange and stiffen. Previous studies using fixed cells and PSGL-1 coated beads have demonstrated that the elastic nature of microvilli40 and cell deformation42,54 are important regulators of neutrophil rolling velocity. As cells lose the ability to deform, the contact area available for selectin binding is reduced, which leads to faster and more unstable rolling velocities. In support of this explanation are reports that adherent leukocytes will retract pseudopods and become stiff upon shear exposure.10,30 We believe that cell stiffening is a likely explanation and we are undertaking investigations to examine these subtle morphologic cell alterations.
The importance of our findings is underscored by the fact that leukocyte rolling velocity determines the amount of time that leukocytes are in direct contact with the blood vessel wall to integrate multiple signals (e.g., chemokines, integrin ligands) that direct their infiltration into tissue and innate immune function. For example, using a mouse model of TNF-α-induced inflammation, Ley and coworkers demonstrated that slow leukocyte rolling (i.e., long rolling times) was necessary for efficient leukocyte recruitment.22,28 Our observation that transient exposure to high shear causes neutrophils to roll faster is surprising and would suggest that leukocyte transit time and recruitment would be reduced. Reduced leukocyte recruitment would contribute to a defect in fighting infection and wound healing. At this time, information on the effects of transient exposure to high shear present in both pathological conditions and blood-contacting medical devices is sparse. Thus, assays that can detect instantaneous changes in leukocyte behavior, such as rolling velocity, are important for studying leukocyte biology and improving medical device performance.
Electronic supplementary material
Below is the link to the electronic supplementary material.
Acknowledgments
Research reported in this publication was supported by the National Heart, Lung, and Blood Institute of the National Institutes of Health under Award Number R44HL114246 and R21HL132286. The content is solely the responsibility of the authors and does not necessarily represent the official views of the National Institutes of Health.
Conflict of interest
Trevor A. Snyder is an employee of VADovations Inc. C. S. Lewis, N. Z. Alsmadi, and D. W. Schmidtke have no conflict of interest to declare.
Ethical standards
All human subjects research was carried out in accordance with institutional guidelines approved by the University of Texas at Dallas Internal Review Board. All procedures followed were in accordance with the Helsinki Declaration of 1975, as revised in 2000. Informed consent was obtained from all donors included in the study. No animal studies were carried out by the authors for this article.
References
- 1.Akenhead ML, Fukuda S, Schmid-Schönbein GW, Shin HY. Fluid shear-induced cathepsin B release in the control of Mac1-dependent neutrophil adhesion. J. Leukoc. Biol. 2017;102:117–126. doi: 10.1189/jlb.3A0716-317RR. [DOI] [PMC free article] [PubMed] [Google Scholar]
- 2.Alon R, Chen S, Puri KD, Finger EB, Springer TA. The kinetics of L-selectin Tethers and the mechanics of selectin-mediated rolling. J. Cell Biol. 1997;138:1169–1180. doi: 10.1083/jcb.138.5.1169. [DOI] [PMC free article] [PubMed] [Google Scholar]
- 3.Atherton A, Born GV. Relationship between the velocity of rolling granulocytes and that of the blood flow in venules. J. Physiol. 1973;233:157–163. doi: 10.1113/jphysiol.1973.sp010303. [DOI] [PMC free article] [PubMed] [Google Scholar]
- 4.Borregaard N. Neutrophils, from marrow to microbes. Immunity. 2010;33:657–670. doi: 10.1016/j.immuni.2010.11.011. [DOI] [PubMed] [Google Scholar]
- 5.Bruehl RE, et al. Leukocyte activation induces surface redistribution of P-selectin glycoprotein ligand-1. J. Leukoc. Biol. 1997;61:489–499. doi: 10.1002/jlb.61.4.489. [DOI] [PubMed] [Google Scholar]
- 6.Carter J, Hristova K, Harasaki H, Smith WA. Short exposure time sensitivity of white cells to shear stress. ASAIO J. 2003;49:687–691. doi: 10.1097/01.MAT.0000094194.93742.A7. [DOI] [PubMed] [Google Scholar]
- 7.Chen AY, DeLano FA, Valdez SR, Ha JN, Shin HY, Schmid-Schönbein GW. Receptor cleavage reduces the fluid shear response in neutrophils of the spontaneously hypertensive rat. Am. J. Physiol. 2010;299:C1441–C1449. doi: 10.1152/ajpcell.00157.2010. [DOI] [PMC free article] [PubMed] [Google Scholar]
- 8.Coghill PA, Kesselhuth EK, Shimp EA, Khismatullin DB, Schmidtke DW. Effects of microfluidic channel geometry on leukocyte rolling assays. Biomed. Microdevices. 2013;15:183–193. doi: 10.1007/s10544-012-9715-y. [DOI] [PubMed] [Google Scholar]
- 9.Coughlin MF, Schmid-Schönbein GW. Pseudopod projection and cell spreading of passive leukocytes in response to fluid shear stress. Biophys. J. 2004;87:2035–2042. doi: 10.1529/biophysj.104.042192. [DOI] [PMC free article] [PubMed] [Google Scholar]
- 10.Coughlin MF, Sohn DD, Schmid-Schönbein GW. Recoil and stiffening by adherent leukocytes in response to fluid shear. Biophys. J. 2008;94:1046–1051. doi: 10.1529/biophysj.107.107102. [DOI] [PMC free article] [PubMed] [Google Scholar]
- 11.Davenpeck KL, Brummet ME, Hudson SA, Mayer RJ, Bochner BS. Activation of human leukocytes reduces surface P-selectin glycoprotein ligand-1 (PSGL-1, CD162) and adhesion to P-selectin in vitro. J. Immunol. 2000;165:2764–2772. doi: 10.4049/jimmunol.165.5.2764. [DOI] [PubMed] [Google Scholar]
- 12.Finger EB, Puri KD, Alon R, Lawrence MB, von Andrian UH, Springer TA. Adhesion through L-selectin requires a threshold hydrodynamic shear. Nature. 1996;379:266–269. doi: 10.1038/379266a0. [DOI] [PubMed] [Google Scholar]
- 13.Fraser KH, Zhang T, Taskin ME, Griffith BP, Wu ZJ. A quantitative comparison of mechanical blood damage parameters in rotary ventricular assist devices: shear stress, exposure time and hemolysis index. J. Biomech. Eng. 2012;134:81002. doi: 10.1115/1.4007092. [DOI] [PMC free article] [PubMed] [Google Scholar]
- 14.Fridlender ZG, Albelda SM. Tumor-associated neutrophils: friend or foe? Carcinogenesis. 2012;33:949–955. doi: 10.1093/carcin/bgs123. [DOI] [PubMed] [Google Scholar]
- 15.Fukuda S, Schmid-Schönbein GW. Regulation of CD18 expression on neutrophils in response to fluid shear stress. Proc. Natl. Acad. Sci. USA. 2003;100:13152–13157. doi: 10.1073/pnas.2336130100. [DOI] [PMC free article] [PubMed] [Google Scholar]
- 16.Fukuda S, Yasu T, Kobayashi N, Ikeda N, Schmid-Schönbein GW. Contribution of fluid shear response in leukocytes to hemodynamic resistance in the spontaneously hypertensive rat. Circ. Res. 2004;95:100–108. doi: 10.1161/01.RES.0000133677.77465.38. [DOI] [PubMed] [Google Scholar]
- 17.Fukuda S, Yasu T, Predescu DN, Schmid-Schönbein GW. Mechanisms for regulation of fluid shear stress response in circulating leukocytes. Circ. Res. 2000;86:e13–e18. doi: 10.1161/01.RES.86.1.e13. [DOI] [PubMed] [Google Scholar]
- 18.Gardiner EE, De Luca M, McNally T, Michelson AD, Andrews RK, Berndt MC. Regulation of P-selectin binding to the neutrophil P-selectin counter-receptor P-selectin glycoprotein ligand-1 by neutrophil elastase and cathepsin G. Blood. 2001;98:1440–1447. doi: 10.1182/blood.V98.5.1440. [DOI] [PubMed] [Google Scholar]
- 19.Gordon RJ, et al. Prospective, multicenter study of ventricular assist device infections. Circulation. 2013;127:691–702. doi: 10.1161/CIRCULATIONAHA.112.128132. [DOI] [PMC free article] [PubMed] [Google Scholar]
- 20.Iguchi T, et al. Impact of lesion length on functional significance in intermediate coronary lesions. Clin. Cardiol. 2013;36:172–177. doi: 10.1002/clc.22076. [DOI] [PMC free article] [PubMed] [Google Scholar]
- 21.Joseph P, Tabeling P. Direct measurement of the apparent slip length. Phys. Rev. E. 2005;71:35303. doi: 10.1103/PhysRevE.71.035303. [DOI] [PubMed] [Google Scholar]
- 22.Jung U, Norman KE, Scharffetter-Kochanek K, Beaudet AL, Ley K. Transit time of leukocytes rolling through venules controls cytokine-induced inflammatory cell recruitment in vivo. J. Clin. Invest. 1998;102:1526–1533. doi: 10.1172/JCI119893. [DOI] [PMC free article] [PubMed] [Google Scholar]
- 23.Jutila MA, Rott L, Berg EL, Butcher EC. Function and regulation of the neutrophil MEL-14 antigen in vivo: comparison with LFA-1 and MAC-1. J. Immunol. 1989;143:3318–3324. [PubMed] [Google Scholar]
- 24.Kambas K, Mitroulis I, Ritis K. The emerging role of neutrophils in thrombosis—the journey of TF through NETs. Front. Immunol. 2012;3:385. doi: 10.3389/fimmu.2012.00385. [DOI] [PMC free article] [PubMed] [Google Scholar]
- 25.Kim MB, Sarelius IH. Role of shear forces and adhesion molecule distribution on P-selectin-mediated leukocyte rolling in postcapillary venules. Am. J. Physiol. Heart Circ. Physiol. 2004;287:H2705–H2711. doi: 10.1152/ajpheart.00448.2004. [DOI] [PubMed] [Google Scholar]
- 26.Kroll MH, Hellums JD, McIntire LV, Schafer AI, Moake JL. Platelets and shear stress. Blood. 1996;88:1525–1541. [PubMed] [Google Scholar]
- 27.Kunkel EJ, Chomas JE, Ley K. Role of primary and secondary capture for leukocyte accumulation in vivo. Circ. Res. 1998;82:30–38. doi: 10.1161/01.RES.82.1.30. [DOI] [PubMed] [Google Scholar]
- 28.Kunkel EJ, Dunne JL, Ley K. Leukocyte arrest during cytokine-dependent inflammation in vivo. J. Immunol. 2000;164:3301–3308. doi: 10.4049/jimmunol.164.6.3301. [DOI] [PubMed] [Google Scholar]
- 29.Lawrence M, Kansas G, Kukel E, Ley K. Threshold levels of fluid shear promote leukocyte adhesion through selectins (CD62L, P, E) J. Cell Biol. 1997;136:717–727. doi: 10.1083/jcb.136.3.717. [DOI] [PMC free article] [PubMed] [Google Scholar]
- 30.Makino A, Glogauer M, Bokoch GM, Chien S, Schmid-Schönbein GW. Control of neutrophil pseudopods by fluid shear: role of Rho family GTPases. Am. J. Physiol. Cell Physiol. 2005;288:C863–C871. doi: 10.1152/ajpcell.00358.2004. [DOI] [PubMed] [Google Scholar]
- 31.Mayadas TN, Cullere X, Lowell CA. The multifaceted functions of neutrophils. Annu. Rev. Pathol. 2014;9:181–218. doi: 10.1146/annurev-pathol-020712-164023. [DOI] [PMC free article] [PubMed] [Google Scholar]
- 32.Meinhart CD, Wereley ST, Santiago JG. PIV measurements of a microchannel flow. Exp. Fluids. 1999;27:414–419. doi: 10.1007/s003480050366. [DOI] [Google Scholar]
- 33.Mitchell MJ, King MR. Shear-induced resistance to neutrophil activation via the formyl peptide receptor. Biophys. J. 2012;102:1804–1814. doi: 10.1016/j.bpj.2012.03.053. [DOI] [PMC free article] [PubMed] [Google Scholar]
- 34.Mitchell MJ, Lin KS, King MR. Fluid shear stress increases neutrophil activation via platelet-activating factor. Biophys. J. 2014;106:2243–2253. doi: 10.1016/j.bpj.2014.04.001. [DOI] [PMC free article] [PubMed] [Google Scholar]
- 35.Moazzam F, DeLano FA, Zweifach BW, Schmid-Schönbein GW. The leukocyte response to fluid stress. Proc. Natl. Acad. Sci. USA. 1997;94:5338–5343. doi: 10.1073/pnas.94.10.5338. [DOI] [PMC free article] [PubMed] [Google Scholar]
- 36.Neeves KB, Diamond SL. A membrane-based microfluidic device for controlling the flux of platelet agonists into flowing blood. Lab Chip. 2008;8:701–709. doi: 10.1039/b717824g. [DOI] [PMC free article] [PubMed] [Google Scholar]
- 37.Nguyen CV, Fouras A, Carberry J. Improvement of measurement accuracy in micro PIV by image overlapping. Exp. Fluids. 2010;49:701–712. doi: 10.1007/s00348-010-0837-9. [DOI] [Google Scholar]
- 38.Nguyen NT, Wereley S. Fundamentals and Applications of Microfluidics. Boston: Artech House; 2006. p. 111. [Google Scholar]
- 39.Papaionnou TG, Stefanadis C. Vascular wall shear stress: basic principles and methods. Hell. J. Cardiol. 2005;46:9–15. [PubMed] [Google Scholar]
- 40.Park EY, et al. Comparison of PSGL-1 microbead and neutrophil rolling: microvillus elongation stabilizes P-selectin bond clusters. Biophys. J. 2002;82:1835–1847. doi: 10.1016/S0006-3495(02)75534-3. [DOI] [PMC free article] [PubMed] [Google Scholar]
- 41.Piccard H, Muschel RJ, Opdenakker G. On the dual roles and polarized phenotypes of neutrophils in tumor development and progression. Crit. Rev. Oncol. Hematol. 2012;82:296–309. doi: 10.1016/j.critrevonc.2011.06.004. [DOI] [PubMed] [Google Scholar]
- 42.Ramachandran V, Williams M, Yago T, Schmidtke DW, McEver RP. Dynamic alterations of membrane tethers stabilize leukocyte rolling on P-selectin. Proc. Natl. Acad. Sci. USA. 2004;101:13519–13524. doi: 10.1073/pnas.0403608101. [DOI] [PMC free article] [PubMed] [Google Scholar]
- 43.Rodgers SD, Camphausen RT, Hammer DA. Sialyl Lewis(x)-mediated, PSGL-1-independent rolling adhesion on P-selectin. Biophys. J. 2000;79:694–706. doi: 10.1016/S0006-3495(00)76328-4. [DOI] [PMC free article] [PubMed] [Google Scholar]
- 44.Shimp EA, Alsmadi NZ, Cheng T, Lam KH, Lewis CS, Schmidtke DW. Effects of shear on P-selectin deposition in microfluidic channels. Biomicrofluidics. 2016;10:24128. doi: 10.1063/1.4944823. [DOI] [PMC free article] [PubMed] [Google Scholar]
- 45.Shin HY, Simon SI, Schmid-Schönbein GW. Fluid shear-induced activation and cleavage of CD18 during pseudopod retraction by human neutrophils. J. Cell. Physiol. 2008;214:528–536. doi: 10.1002/jcp.21235. [DOI] [PubMed] [Google Scholar]
- 46.Shive MS, Salloum ML, Anderson JM. Shear stress-induced apoptosis of adherent neutrophils: a mechanism for persistence of cardiovascular device infections. Proc. Natl. Acad. Sci. USA. 2000;97:6710–6715. doi: 10.1073/pnas.110463197. [DOI] [PMC free article] [PubMed] [Google Scholar]
- 47.Shoham S, Miller LW. Cardiac assist device infections. Curr. Infect. Dis. Rep. 2009;11:268–273. doi: 10.1007/s11908-009-0040-4. [DOI] [PubMed] [Google Scholar]
- 48.Son Y. Determination of shear viscosity and shear rate from pressure drop and flow rate relationship in a rectangular channel. Polymer (Guildf). 2007;48:632–637. doi: 10.1016/j.polymer.2006.11.048. [DOI] [Google Scholar]
- 49.Song X, et al. Design and transient computational fluid dynamics study of a continuous axial flow ventricular assist device. ASAIO J. 2004;50:215–224. doi: 10.1097/01.MAT.0000124954.69612.83. [DOI] [PubMed] [Google Scholar]
- 50.Spijker HT, Graaff R, Boonstra PW, Busscher HJ, Van Oeveren W. On the influence of flow conditions and wettability on blood material interactions. Biomaterials. 2003;24:4717–4727. doi: 10.1016/S0142-9612(03)00380-6. [DOI] [PubMed] [Google Scholar]
- 51.Strony J, Beaudoin A, Brands D, Adelman B. Analysis of shear stress and hemodynamic factors in a model of coronary artery stenosis and thrombosis. Am. J. Physiol. 1993;265:H1787–H1796. doi: 10.1152/ajpheart.1993.265.5.H1787. [DOI] [PubMed] [Google Scholar]
- 52.Syeda B, Gottsauner-Wolf M, Denk S, Pichler P, Khorsand A, Glogar D. Arterial compliance: a diagnostic marker for atherosclerotic plaque burden? Am. J. Hypertens. 2003;16:356–362. doi: 10.1016/S0895-7061(03)00037-2. [DOI] [PubMed] [Google Scholar]
- 53.von Brühl M-L, et al. Monocytes, neutrophils, and platelets cooperate to initiate and propagate venous thrombosis in mice in vivo. J. Exp. Med. 2012;209:819–835. doi: 10.1084/jem.20112322. [DOI] [PMC free article] [PubMed] [Google Scholar]
- 54.Yago T, et al. Distinct molecular and cellular contributions to stabilizing selectin-mediated rolling under flow. J. Cell Biol. 2002;158:787–799. doi: 10.1083/jcb.200204041. [DOI] [PMC free article] [PubMed] [Google Scholar]
- 55.Zhang X, Zhan D, Shin HY. Integrin subtype-dependent CD18 cleavage under shear and its influence on leukocyte-platelet binding. J. Leukoc. Biol. 2013;93:251–258. doi: 10.1189/jlb.0612302. [DOI] [PubMed] [Google Scholar]
Associated Data
This section collects any data citations, data availability statements, or supplementary materials included in this article.