

Abstract
Organisms use endogenous clocks to adapt to the rhythmicity of the environment and to synchronize social activities. Although the circadian cycle is implicated in aging, it is unknown whether natural variation in its function contributes to differences in lifespan between populations and whether the circadian clock of specific tissues is key for longevity. We have sequenced the genomes of Drosophila melanogaster strains with exceptional longevity that were obtained via multiple rounds of selection from a parental strain. Comparison of genomic, transcriptomic, and proteomic data revealed that changes in gene expression due to intergenic polymorphisms are associated with longevity and preservation of skeletal muscle function with aging in these strains. Analysis of transcription factors differentially modulated in long-lived versus parental strains indicates a possible role of circadian clock core components. Specifically, there is higher period and timeless and lower cycle expression in the muscle of strains with delayed aging compared to the parental strain. These changes in the levels of circadian clock transcription factors lead to changes in the muscle circadian transcriptome, which includes genes involved in metabolism, proteolysis, and xenobiotic detoxification. Moreover, a skeletal muscle-specific increase in timeless expression extends lifespan and recapitulates some of the transcriptional and circadian changes that differentiate the long-lived from the parental strains. Altogether, these findings indicate that the muscle circadian clock is important for longevity and that circadian gene variants contribute to the evolutionary divergence in longevity across populations.
Aging is a multifactorial process governed by environmental, behavioral, genetic, and epigenetic factors (López-Otín et al. 2013). Research over the past decades has led to the identification of longevity-regulating genes and has demonstrated a role in aging for several evolutionarily conserved signaling pathways and physiological processes (DiLoreto and Murphy 2015).
The circadian cycle underlays the daily oscillation of many biological functions and has emerged as one of the important processes that regulate aging (Mattis and Sehgal 2016; Giebultowicz 2018). Many cellular and systemic homeostatic functions are altered when the circadian cycle is perturbed, including metabolic homeostasis (Xu et al. 2011; Barber et al. 2016; Harfmann et al. 2016; Paschos and FitzGerald 2017), regeneration (Karpowicz et al. 2013; Dierickx et al. 2018), the host response to bacterial infections (Stone et al. 2012), and xenobiotic detoxification (Zhang et al. 2018). Moreover, several age-related human diseases have been linked to defects in the circadian cycle, such as cancer (Masri and Sassone-Corsi 2018) and neurodegeneration (Krishnan et al. 2009, 2012; Musiek et al. 2013; Musiek and Holtzman 2016; Hood and Amir 2017).
In addition to the central clock in the suprachiasmatic nucleus, clocks in peripheral tissues have emerged as important regulators of systemic circadian functions (Xu et al. 2008). In skeletal muscle, many genes involved in glucose and lipid metabolism are regulated in a circadian manner (Hodge et al. 2015; Harfmann et al. 2016; Dyar et al. 2018; Perrin et al. 2018). Moreover, the skeletal muscle circadian clock has important roles in systemic homeostasis (Harfmann et al. 2015; Hodge et al. 2015, 2019; Schroder et al. 2015), as demonstrated by the finding that disruption of circadian rhythms in muscle leads to derangement of systemic glucose homeostasis and altered sleep in mice (Harfmann et al. 2016; Ehlen et al. 2017).
Similar to the pivotal role of skeletal muscle in regulating systemic metabolic homeostasis and circadian functions (Harfmann et al. 2015, 2016; Ehlen et al. 2017), skeletal muscle has also emerged as an important tissue for lifespan determination in multiple species (Gates et al. 2007; Hanson and Hakimi 2008; Pedersen and Febbraio 2008; Demontis and Perrimon 2010; Vrailas-Mortimer et al. 2011; Demontis et al. 2013a, 2014; Keipert et al. 2013; Stenesen et al. 2013; Rai and Demontis 2016). The progressive functional deterioration of skeletal muscle starts from an early age and precedes the age-related systemic decline in proteostasis and tissue integrity in Drosophila (Demontis and Perrimon 2010) and Caenorhabditis elegans (Herndon et al. 2002), suggesting that skeletal muscle aging precedes and influences the aging of other tissues. Moreover, epidemiological studies in humans have established that age-related skeletal muscle weakness is the best predictor of mortality and morbidity (Metter et al. 2002; Ruiz et al. 2008), further confirming the importance of skeletal muscle for systemic aging. However, despite its importance, the genetic and environmental/behavioral mechanisms that govern skeletal muscle aging are incompletely understood (Demontis et al. 2013b; Piccirillo et al. 2014).
As for human centenarians (Milman and Barzilai 2015), the analysis of natural variation in aging across diverse populations of simple model organisms has led to important insights into the genetic determinants of aging and sarcopenia (Barzilai et al. 2012). In the fruit fly Drosophila melanogaster, in addition to comparing differences in aging and lifespan across natural populations (Mackay 2002; Geiger-Thornsberry and Mackay 2004; Durham et al. 2014; Carbone et al. 2016), the short generation time and ease of maintenance has allowed the laboratory evolution of strains that diverge in aging traits from the parental population (Rose 1984; Rose and Graves 1989; Arking 2001). For example, the O (Old) Drosophila strains have been established via several rounds of laboratory selection for delayed senescence from the parental B (Base) strain (Rose 1984; Rose and Graves 1989).
Although such experimental selection in the lab may not recapitulate the evolution of aging traits in wild populations (Sgrò and Partridge 2001), the use of O lines and other lab-evolved strains has led to important insights into genetic determinants of aging (Wilson et al. 2006, 2013; Carnes et al. 2015; Sujkowski et al. 2015; Parkhitko et al. 2016). However, most of these studies have focused on whole organism analyses and have not investigated tissue-specific aging.
On this basis, we have examined whether skeletal muscle function is better preserved during aging in strains experimentally selected for longevity and whether analyses of the molecular changes that have occurred in the skeletal muscle of such strains can provide insight into anti-aging signaling pathways relevant for sarcopenia.
Results
Drosophila O strains selected for longevity have reduced muscle functional decay with aging
We have employed Drosophila strains with extended lifespan generated through artificial selection for postponed senescence (Rose 1984; Rose and Graves 1989) to test whether longevity associates with delayed skeletal muscle aging in these strains. As previously shown (Rose 1984; Rose and Graves 1989), O1 and O3 flies live longer than parental B3 flies (Fig. 1A). O lines also have decreased age-related skeletal muscle functional decay, as indicated by negative geotaxis (climbing), spontaneous locomotion, flight, and jumping assays (Fig. 1). Specifically, the percentage of flies with climbing capacity decreases with aging in B3 flies but is better preserved in the O lines (Fig. 1B). Moreover, spontaneous locomotion does not differ at 1 wk of age when comparing the O lines with B3 flies (Fig. 1C). However, it decreases with aging in B3 flies but not in O lines (Fig. 1D). Similarly, at 6 wk of age (equivalent to the median lifespan of B3 flies), ∼50% of B3 flies are not capable of flying, while the remainder show poor flight capacity. However, at the same age, the O1 and O3 lines show only few nonflyers, whereas more than 50% of flies retain moderate to good flight capacity (Fig. 1E). This is also reflected in the weighted average flight index, a score indicating the extent of flight performance (Fig. 1F; see Methods). Lastly, the jumping ability of old B3 flies decreases to 40% relative to young B3 flies, while the O1 and O3 genotypes have no significant decline in jumping performance at old age compared to young adults (Fig. 1G).
Figure 1.

Drosophila long-lived O lines are protected from age-related skeletal muscle functional decay. (A) Lifespan extension in the O lines versus B3. B3 flies had a median lifespan of 42 d (n = 180), whereas O1 (n = 273) and O3 (n = 213) flies had a median lifespan of 72 and 76 d, respectively (P < 0.05). (B) With aging, the B3 line displays a progressive increase in the ratio of flies unable to climb, as estimated with negative geotaxis assays (P < 0.05), whereas the O lines are partly protected. (C,D) Analysis of spontaneous locomotion indicates that, although there is no substantial difference in young age (1 wk old) (C), O lines have increased spontaneous locomotion and rhythmicity in old age (6 wk old) (D), compared with the parental B3 strain (P < 0.05; n[batches of 10 flies] = 10). (E,F) Flight defects arise with aging in B3 but less so in the O lines, as also demonstrated by the flight index (F), which is calculated considering all classes of flyers shown in E; n = 100–102, SEM, (***) P < 0.001. (G) Jump ability declines with aging in B3 flies but not in O1 and O3 flies; n = 25, SEM, (***) P < 0.001.
These assays probe the function of distinct sets of skeletal muscles, i.e., the leg muscles for climbing and spontaneous locomotion, the direct and indirect flight muscles for flight, and the tergal depressor of trochanter muscle for jumping. On this basis, these assays indicate a general preservation of skeletal muscle function with aging in the O lines when compared to the parental B3 parental strain (Fig. 1).
In addition to muscle functional decline, muscle mass loss is a prominent feature of aging in humans (Nair 2005). However, measurement of the cross-sectional area of indirect flight muscles indicates that age-related decline in skeletal muscle mass is highly variable in Drosophila and that the O lines do not differ in this aspect from the B3 line (Fig. 2A).
Figure 2.
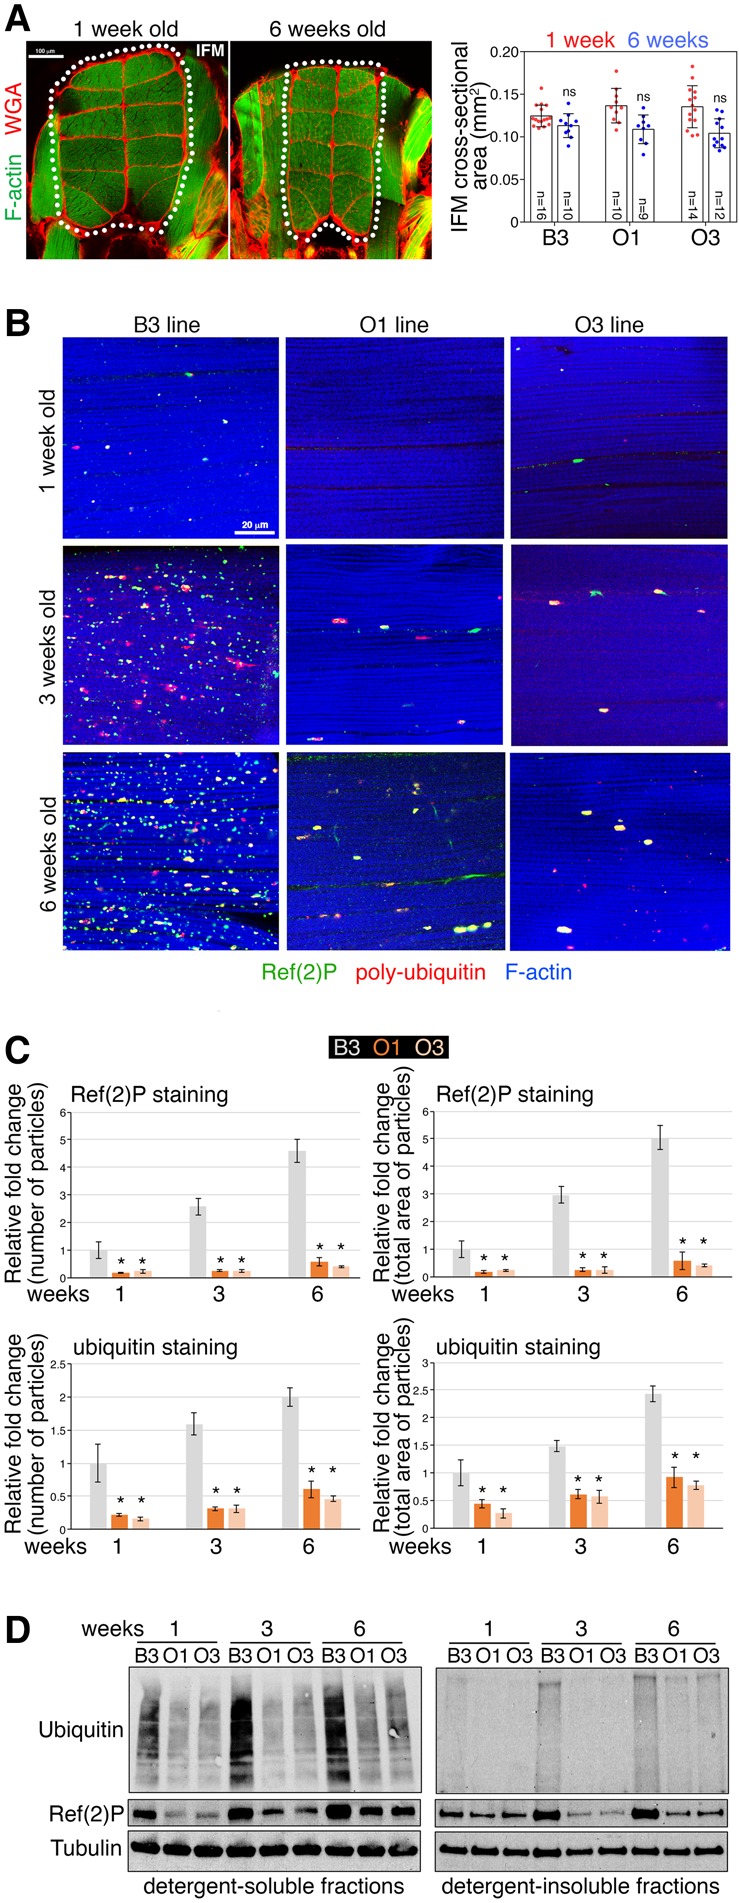
Modulation of muscle cross-sectional area and protein quality control in O and B lines during aging. (A) Changes in muscle size are variable and typically not significant during Drosophila aging. Sections of Drosophila thoraces from B3 flies at 1 and 6 wk stained with phalloidin, to detect F-actin (green), and with Alexa555-WGA (wheat germ agglutinin), to detect the extracellular matrix (red). Age-related changes in the cross-sectional area of the 12 longitudinal indirect flight muscles (IFM; outlined) are not statistically significant due to high variability (SD, n = 9–16). These findings indicate that muscle mass loss is not a robust feature of aging in Drosophila and that it does not differ between O and B lines. (B) Immunostaining of indirect flight muscle from the O and B lines reveals an age-related accumulation of Ref(2)P-positive (green) poly-ubiquitin (red) protein aggregates in the muscles of B3 flies, whereas this does not occur to the same extent in the O lines, as demonstrated by the quantifications shown in C, which report the number and total area of particles (protein aggregates) normalized by tissue area; (*) P < 0.05; n = 10–25; SEM. (D) Western blots of skeletal muscle fractions similarly indicate that there is a lower increase with aging of poly-ubiquitin protein aggregates in the muscles of the O lines compared to the B3 (ubiquitin and Ref[2]P signals detected in detergent-insoluble fractions), whereas there is no change in the ubiquitin and Ref(2)P levels detected in the detergent-soluble fractions.
Several molecular derangements occur during aging in Drosophila and human skeletal muscle (Demontis et al. 2013b). A prominent one consists of the decline of proteostasis and the consequent accumulation of dysfunctional proteins, which negatively impacts muscle contractile functions (Demontis and Perrimon 2010; Jiao and Demontis 2017). To examine whether O1 and O3 flies are protected from age-related proteostatic defects, we utilized immunostaining for polyubiquitinated protein aggregates and confocal microscopy. In B3 flies, there was age-related accumulation of polyubiquitinated Ref(2)P (also known as p62)-positive protein aggregates, which was reduced in O flies (Fig. 2B,C). Similar results were obtained via the analysis of detergent-soluble and -insoluble fractions of skeletal muscles, which also revealed an age-dependent increase in the levels of insoluble polyubiquitinated proteins, corresponding to protein aggregates (Demontis and Perrimon 2010), in the B3 line but less so in the O lines (Fig. 2D).
Together, these data indicate that, in agreement with human epidemiological studies (Metter et al. 2002; Ruiz et al. 2008), preservation of skeletal muscle protein quality and function is associated with longevity. On this basis, we next sought to determine the genetic basis for longevity and decreased muscle functional senescence in the O line by performing genomic and transcriptomic analyses.
Numerous genetic polymorphisms differentiate the O from the parental B strain
To identify the genetic mutations that differentiate the O lines from the parental B3 strain, whole-genome sequencing was performed, and the B3, O1, and O3 genotypes were compared against the Drosophila reference genome. From this analysis, there were many genomic variants that were discovered (Fig. 3A), with the largest class consisting of single nucleotide polymorphisms (SNPs, ∼1 million/genotype). A few large variants (>400 bp) were also identified and attributed to deletions, insertions, inversions, and interchromosomal translocations (Fig. 3A; Supplemental Table S1).
Figure 3.

Whole-genome sequencing identifies genetic variants associated with longevity and protection from age-related skeletal muscle functional decay. (A) Circos plot representing the distribution of genomic variants across the euchromatic genome in 20-kb bins. Large intrachromosomal and interchromosomal rearrangements are shown in green and blue, respectively. (B) The distribution of the number of variants by the nucleotide length for the B3, O1, and O3 genotypes relative to the dm3 Drosophila reference genome shows a relatively large proportion of short, in particular single nucleotide polymorphisms. The Venn diagram shows variants that have significantly different allelic frequencies and that are not overlapping between genotypes. Variants unique to the long-lived (O1 and O3) or control (B3) genotypes are shown in cyan and red, respectively, and account for a total of 241,550 variants potentially associated with delayed aging. (C) The proportion of the 241,550 genotype-unique variants and their genomic localization relative to gene sequences. While a large proportion, 64.93%, of total variants are present within a gene sequence, only 3.24% of longevity-associated variants are present within the coding sequence and therefore could potentially affect translation as either missense, nonsense, or frameshift mutations. (D,E) Genotype-unique variants within ±10 kb of either the transcription start site (TSS) and the transcription end site (TES). There is a large increase in variant density immediately prior to the TSS and immediately following the TES.
To identify genomic variants associated with lifespan, we selected those occurring with differential frequency in O1/O3 (considered jointly) versus B3. This analysis identified 173,869 genomic variants unique to the B3 genotype and therefore potentially having a negative impact on lifespan, and 67,681 variants that occurred both in O1 and O3 and that are therefore putative longevity regulators (Fig. 3B). Genomic variants associated with lifespan appeared to be distributed throughout the chromosomes (Fig. 3A), albeit with lower density on the 4th and X Chromosomes, likely owing, respectively, to the significantly smaller size of the 4th chromosome and to the reduced recombination rate of the X Chromosome (Schaffner 2004).
Analysis of the genomic distribution of the 241,550 genotype-specific variants differentially associated with lifespan indicated that 64.93% are within gene boundaries (genic), whereas the rest (35.07%) are intergenic (Fig. 3C). However, the majority (61.69%) of variants within a gene were not within coding sequences but rather in intervening untranslated regions, including 5′ and 3′ UTRs and introns. Missense mutations within the coding region accounted for 3.14% of variants, while frameshift (FS) and nonsense (NS) mutations accounted for only 0.05% and 0.01%, respectively. Most of the FS and NS mutations occurred toward the end of the coding sequence, suggesting that protein function may not be overtly affected. Moreover, of the 129 FS mutations and 30 NS mutations detected, only two FS and one NS mutations are enriched in the O lines compared to B3. Of these, the FS mutations occurred in two genes not previously implicated in aging, i.e., Magi, a molecular scaffolding protein involved in the organization of adherens junctions, and CG15705, of unknown function.
The NS mutation truncated the four C-terminal amino acid residues of REPTOR (CG13624), a transcription factor that modulates gene expression in response to Tor (Target of rapamycin) activity (Tiebe et al. 2015), which is a prominent regulator of aging and lifespan across species (Zoncu et al. 2011). Because the C terminus of REPTOR displays a putative type II binding motif (FVL) for PDZ domains (Demontis et al. 2006), which is missing in the truncated REPTOR expressed by the O lines (Supplemental Table S1), REPTOR's function may be affected and contribute to the differences in longevity observed between the B and O lines.
However, because most mutations occurred in noncoding genic regions, we hypothesized that these may have a more pervasive role in regulating the lifespan of the O lines versus B3 by affecting transcriptional regulatory sequences and, consequently, by modulating gene expression. We therefore examined the distribution of genomic variants relative to transcription start sites (TSSs) (Fig. 3D) and transcription end sites (TESs) (Fig. 3E), as previously done (Massouras et al. 2012). There was a sharp increase in the density of variants within 1 kb from the TSS (Fig. 3D), suggesting that these genomic variants affect the proximal promoter and consequently gene expression. There was an enrichment also in proximity of the TES (Fig. 3E), a region that can regulate transcription by interacting with enhancers, silencers, and insulators.
Overall, these studies suggest that genomic variants potentially associated with lifespan determination may primarily act via the modulation of gene expression rather than by affecting protein sequence and function.
Changes in muscle gene expression differentiate the O lines from the parental B3 strain
Because of the possibility that genomic variants associated with lifespan affect transcriptional regulatory sequences (Fig. 3), we next examined the skeletal muscle transcriptomes of the B3, O1, and O3 flies in young (1 wk old) and old (6 wk old) age (Fig. 4; Supplemental Table S2). Principal component analysis (PCA) of RNA-seq data indicated that the O1 and O3 strains are highly interrelated, as they cluster together in both young and old age, separately from the B3 genotype (Fig. 4A). Consistently, the gene expression changes induced in O1 versus B3 and in O3 versus B3 are similar (r2 = 0.4705), indicating a shared pattern of transcriptional regulation in long-lived lines (Fig. 4B).
Figure 4.

RNA-sequencing identifies gene expression changes associated with protection from skeletal muscle aging. (A,B) PCA mapping identifies clustering of O1 and O3, compared with B3, suggesting that there are genomic variants that affect gene expression consistently in O1 and O3 versus B3, as also indicated by the comparison of the log ratios of O1 versus B3, and O3 versus B3 (B). (C,D) Several genes are differentially regulated, including some already implicated in longevity in Drosophila, such as Hsp26 and takeout. (E) Genes differentially expressed include: genes involved in glutathione transferase activity (red cluster), which are down-regulated in O genotypes; genes involved in innate immunity, secreted factors, the proteasome, and chaperones (yellow cluster), which are induced by aging in the B3 but not in the O lines; genes necessary for proteolysis and peptidase and lipase activity (green cluster), which are down-regulated in B3 with aging; and genes that are up-regulated in O lines at all ages (blue cluster), which include genes necessary for mitochondrial ATP synthesis, oxidative phosphorylation, and cytochrome P450 activity. (F) Similar gene categories are also identified by hub analysis of the most regulated genes that differentiate the O lines from the parental B3.
Several genes are up-regulated in the O lines versus B3 (Fig. 4C–F), some of which are known to extend lifespan when overexpressed. These include takeout, which regulates juvenile hormone activity (Flatt and Kawecki 2007; Bauer et al. 2010; Yamamoto et al. 2013), and the cytoplasmic chaperone Hsp26 (Wang et al. 2004). Beyond the role of individual genes and consistent with the finding that all chromosomes of the O strains contribute to their longevity (Hutchinson et al. 1991), hierarchical clustering of RNA-seq data indicates that multiple genes and biological processes are differentially regulated in a strain-specific manner and by aging. Specifically, secreted proteins, proteasome components, peptidases, chaperones, and genes involved in innate immunity and mitochondrial function were among those most differentially regulated in the O lines versus B3 (Fig. 4E,F). The expression of peptidases and proteases (which cooperate with the proteasome in protein degradation [Bhutani et al. 2007]) declines during aging in the B3 line, but it is well maintained in the O lines (Fig. 4E). Conversely, there is a strong age-induced up-regulation of proteasome gene expression in muscles of B3 flies but not in O lines (Fig. 4E). This presumably represents a stress response to declining proteostasis (Girardot et al. 2006) which is not induced in the O lines. Moreover, whereas the expression of genes involved in mitochondrial respiration declines with aging in the B3 line, it is well maintained in the O lines (Fig. 4E), suggesting that improved mitochondrial function could contribute to longevity and proteostasis (Musci et al. 2018).
Altogether, the regulated expression of many gene categories relevant for aging likely contributes to the longevity of O lines.
Distinct proteomic changes occur in the skeletal muscle of O and B3 lines
To examine whether transcriptional changes detected by RNA-seq lead to corresponding proteomic changes, TMT mass-spectrometry was used to analyze skeletal muscle from the O and B lines in young and old age (Supplemental Table S3). In young age, there was similarity in the proteomic changes induced in O1 and O3, compared with B3 (Fig. 5A), as observed for transcriptional changes (Fig. 4). Consistent with different aging trajectories of O and B lines (Figs. 1–3), the proteomic changes that were induced by aging in the O lines were largely different from those induced in the parental B3 line (Fig. 5A). Specifically, proteins involved in innate immunity/inflammation, the proteasome, and glutathione metabolism were induced in the B3 line during aging, presumably as part of a stress response to declining proteostasis (Fig. 2), whereas this did not occur in the O lines (Fig. 5B). Conversely, proteins involved in mitochondrial translation and respiration had higher levels in O versus B lines (Fig. 5B), similar to the modulation of the corresponding mRNA levels (Fig. 4).
Figure 5.

Changes in the muscle proteome differentiate the B3 from the O lines. (A) TMT mass-spectrometry indicates that there is similarity in the regulation of muscle protein levels in O1 and O3 versus B3 in young age. Proteomic changes induced by aging differ in O1 and O3 versus B3, consistent with O lines having different aging trajectories than B3 (Figs. 1–4). (B) Proteins differentially regulated in the skeletal muscle of O and B lines with aging are represented by similar categories as in Figure 4. (C,D) In line with previous studies, there is limited correlation between mRNA and protein levels in young age, and this is largely lost with aging in all strains (D). This finding suggests a possible preponderance of post-transcriptional mechanisms in the determination of proteome composition in old age. r2 correlation coefficients are indicated.
Disconnect of the muscle transcriptome and proteome with aging
Previous studies in different model organisms have shown that the correlation between mRNA and protein levels is lower than generally assumed (Gygi et al. 1999; Ghazalpour et al. 2011; Yeung 2011). In addition to technical differences in the coverage, dynamic range, and substrate bias of proteomic versus genomic approaches, posttranscriptional mechanisms have been suggested to reduce the correlation between the transcriptome and the proteome (Gygi et al. 1999; Ghazalpour et al. 2011; Yeung 2011).
To determine whether gene expression changes that differentiate the O lines from the B3 line correspondingly lead to proteomic changes, we compared the mRNA and protein levels in the O lines to the B3 (Supplemental Table S4). In line with studies in other organisms (Gygi et al. 1999; Ghazalpour et al. 2011; Yeung 2011), in young age there is an overall limited correlation (r2 = 0.239 and 0.317) between the transcriptional and proteomic changes that are present in the O lines versus the B3 (Fig. 5C). However, there is an increasing disconnection (i.e., worse r2 values, r2 = 0.001–0.016) between mRNA and protein levels in old age, as inferred from the analysis of age-induced transcriptional and proteomic changes in the muscle of O1, O3, and B3 flies (Fig. 5D). Because technical limitations should equally impact both young and old samples, it is unlikely that technical differences between proteomics versus genomics are the sole explanation for the wider gap between the transcriptome and the proteome that is observed in old versus young age. This suggests that posttranscriptional mechanisms such as mRNA splicing, protein translation, and protein degradation, which are known to be deranged during skeletal muscle aging (Demontis et al. 2013b), may progressively widen the discrepancy between the transcriptome and the proteome during aging. Although the disconnect between the transcriptome and the proteome may represent an important component of aging, both the B3 and O lines are affected (Fig. 5D), suggesting that it is not responsible for the increased lifespan and reduced muscle functional decay seen in the O lines versus the B3 line.
In summary, mass-spectrometry studies suggest that proteomic changes correlate with gene expression changes more in young age than in old age. On this basis, gene expression changes observed in young age may more likely be responsible for the different aging trajectories of the O lines versus B3.
Differential expression of circadian clock core components in the muscle of O and B lines
Considering that transcriptional changes differentiate the O lines from the B3 and contribute to proteomic changes (Figs. 4, 5), we next examined whether there are transcription factors that could contribute to the observed gene expression changes. For these analyses, the differential expression of all 613 transcription factors and transcriptional regulators detected by RNA-seq was examined.
Ets21C, a transcription factor previously implicated in the response to infection (Chambers et al. 2012) and gut regeneration (Mundorf et al. 2019), is the most down-regulated transcription factor in the O lines compared with the B3 (Fig. 6A). However, homozygous Ets21C null flies have a maximum and median lifespan similar to that of isogenic controls (Supplemental Fig. S1), suggesting that it is not a determinant of longevity under standard housing conditions.
Figure 6.

Core components of the circadian clock are differentially expressed in the skeletal muscle of long-lived O lines. (A) Differential expression of transcription factors and transcriptional regulators in the skeletal muscle of O1 versus B3. The x-axis shows the log ratio of gene expression changes, whereas the y-axis indicates the significance score, which is equivalent to the −log10(P-value). Ets21C has low expression in O1 compared with B3. Core components of the circadian clock are the transcription factors that are most highly regulated. (B) Expression profile of circadian clock components at different time points in the day (zeitgeber ZT 0, 6, 12, 18, 24). In the O lines, there is increased expression of timeless (tim), period (per), and PAR-domain protein 1 (Pdp1) at ZT12. Conversely, cycle (cyc) expression is reduced at all time points in O lines. n = 3, SD, (*) P < 0.05, (**) P < 0.01, (***) P < 0.001. (C) O lines have higher Timeless protein levels at ZT18 compared to B3.
There was divergence in the expression of transcriptional regulators that constitute the circadian clock (Fig. 6A). Specifically, timeless (tim) and period (per) were the most up-regulated transcription factors in the O lines (Fig. 6A). Further testing confirmed that there is higher timeless (tim), period (per), and PAR-domain protein 1 (Pdp1) expression in the O lines at ZT12, compared with the B3 line, and lower cycle (cyc) expression (Fig. 6B). Moreover, western blots with anti-Timeless antibodies indicate that there are higher Timeless protein levels at ZT18 in the O lines, compared to the B3 parental line (Fig. 6C).
A complex formed by Cycle and Clock normally induces timeless and period expression, which in turn form a complex that reduces Clock-Cycle activity (scheme in Fig. 6A). However, because cycle has overall reduced mRNA levels in O versus B3, it is not likely to be responsible for the increased timeless and period expression that is found in the O lines. Examination of genomic regions for circadian core clock components indicates the presence of several genetic polymorphisms in proximal promoters, UTRs, and intronic regions of timeless and other circadian core clock genes (Supplemental Table S5). These polymorphisms may underlie the differential expression of timeless and other circadian core clock components in O versus B lines.
Adjustment of the circadian muscle transcriptome in O versus B lines
Because of the profound changes in the expression of circadian clock components (Fig. 6), we next examined the circadian transcriptome of O and B3 lines (Fig. 7A; Supplemental Table S6). Identification of cyclic genes (adjP < 0.05) with the JTK_CYCLE algorithm (Hughes et al. 2010) revealed differences between the O3 and the B3 lines (Fig. 7B–D; Supplemental Table S7). Specifically, 808 genes are cyclic in B3 but not in O3 (Fig. 7B), such as genes involved in the function of mitochondria, Rab GTPases, and DNA repair (Fig. 7C).
Figure 7.

Adaptation of the muscle circadian transcriptome in long-lived O lines. (A) Hierarchical clustering of the muscle gene expression changes occurring at different time points (ZT) in the day. All genes that are statistically defined as cyclic (adjP < 0.05) in at least one JTK analysis were included. (B) Comparison of cyclic genes detected in the muscle of B3 versus O3 lines reveals distinct gene sets that are strain-specific or shared across strains. GO categories that describe rhythmic genes that are B3-specific (C), that cycle in both B3 and O3 (D), and that cycle only in O3 (E) are shown. (F) Examples of genes with increased rhythmicity in the O lines, compared with B3. SD is shown with (*) P < 0.05, (***) P < 0.001. In A–F, n = 3 for each time point and genotype.
A common set of 563 genes cyclically oscillates in both the B3 and O3 lines (Fig. 7B), including genes involved in proteolysis (peptidase M13), endocrine signaling (juvenile hormone binding), and metabolism of xenobiotics, glutathione, carbohydrates, and lipids (Fig. 7D).
Conversely, 2161 acquired de novo rhythmicity in the O3 line (Fig. 7B,E). The Gene Ontology categories that describe these genes include oxidoreductase activity, amino acid transport, transcription, and metabolism (Fig. 7E,F). In summary, the O3 and B3 lines display divergent circadian muscle transcriptomes, which may causally contribute to differences in their lifespan.
Lifespan extension and circadian adaptations by muscle-specific timeless overexpression
Because the circadian muscle transcriptome and timeless expression are differentially regulated in O versus B lines (Figs. 6, 7), we next tested whether these contribute to the longevity of the O lines.
For these studies, the UAS/Gal4 system and the skeletal muscle-specific Mhc-Gal4 (Schuster et al. 1996) were employed to increase the expression of timeless in Drosophila muscles (Fig. 8A,B). An approximately sixfold increase in timeless gene expression was obtained at 29°C (Fig. 8A), whereas an approximately twofold increase was seen at 25°C (Fig. 8B), similar to the change in timeless expression between the O lines and B3 (Fig. 6A,B).
Figure 8.

Muscle-specific timeless overexpression extends lifespan and reshapes the muscle circadian transcriptome. (A) Lifespan extension with muscle-specific timeless overexpression (Mhc > timOE) compared to isogenic controls (29°C; P < 0.05; Mhc > timOE n = 70; +/timOE n = 43; Mhc>+ n = 52; +/+ n = 40). (B) Similar results are obtained at 25°C by comparing Mhc > timOE with flies with mCherry overexpression (Mhc > cherryOE) and UAS transgene-alone controls (P < 0.05; Mhc > timOE n = 276; +/timOE n = 255; Mhc > cherryOE n = 381; +/cherryOE n = 315). The level of timeless overexpression obtained with UAS/Gal4 in shown in A,B. (C) Analysis of gene expression changes induced by timeless overexpression reveals that there are some genes significantly and consistently regulated in Mhc > timOE and O flies versus their respective controls (n = 3; genes with P < 0.05 in both genotypes are shown). (D) Comparison of cyclic genes detected in the muscle of Mhc > timOE versus Mhc>+ flies reveals distinct gene sets that are genotype-specific or shared. GO categories describing the cyclic genes that are specific for Mhc>+ are shown (E), as well as the GO categories for genes that cycle in both Mhc>+ and Mhc > timOE (F), and that cycle only in Mhc > timOE (G). Genes that similarly oscillate in O3 versus B3 and Mhc > timOE versus Mhc>+ are identified by double arrows (<<) whereas single arrows (<) highlight GO categories that are shared by multiple gene sets in (E–G).
Survival analysis indicated that timeless overexpression extends lifespan compared to isogenic controls, both at 25°C and 29°C (Fig. 8A,B). Lastly, the gene expression changes induced by muscle-specific overexpression of timeless were analyzed and revealed that a subset of genes were significantly and consistently modulated in Mhc > timOE and O flies (Fig. 8C; Supplemental Table S8). These included Hsp26, a chaperone that regulates lifespan (Wang et al. 2004), and genes involved in xenobiotic detoxification (Cyp12d1-d) and DNA repair (mre11). Conversely, the antimicrobial peptides CecA1 and CecA2 were down-regulated upon timeless overexpression and in O lines (Fig. 8C). This suggests that higher timeless expression partially contributes to the transcriptional changes that differentiate the O lines from B3.
Because there is divergence in the circadian muscle transcriptomes of the O and B lines, we next asked whether increased timeless levels contribute to such changes. To this purpose, we used the JTK_CYCLE algorithm (Hughes et al. 2010) to define cyclic genes in Mhc > timOE and control Mhc>+ flies (Fig. 8D; Supplemental Table S9). There were 1229, 902, and 1837 genes that were cyclic (adjP < 0.05) only in control flies, in both conditions, and only upon timeless overexpression, respectively (Fig. 8D–G). There were some genes with de novo rhythmicity in O3 versus B3 (Fig. 7E) that also acquired rhythmicity upon timeless overexpression (Fig. 8G). These included genes involved in transcription, modulation of Rho GTPases, inositol phosphate metabolism, amino acid transport, and helicases (Fig. 8G). Conversely, genes encoding for SH3-domain-containing proteins were cyclic in the muscle of B3 but not of O3 lines and, similarly, they were cyclic in the muscle of control Mhc>+ but not of Mhc > timOE flies (Fig. 8E). Together, these findings indicate that higher timeless expression contributes to shape the circadian transcriptome and to determine the longevity of O lines.
On this basis, we next asked whether increased timeless expression and modulation of circadian clock component expression is commonly observed in long-lived versus short-lived strains. For these qRT-PCR analyses, we first compared the long-lived La strains with the parental Ra strain (Arking 2001; Sujkowski et al. 2015). As observed for the O versus B lines (Fig. 6), we find that long-lived La lines have increased timeless and period expression at ZT12, compared to the parental Ra stock (Fig. 9A).
Figure 9.

Analysis of clock component gene expression in skeletal muscle from Drosophila strains with different lifespans. (A) Analysis of long-lived La flies and parental Ra flies and of (B) DGRP lines with distinct median lifespan indicates that the expression of timeless and of other circadian clock components sometimes correlates with increased lifespan; SEM with n = 3; (*) P < 0.05. This suggests that increased timeless expression in muscle correlates with but is not a strict prerequisite for lifespan extension. Increased vri expression also correlates with lifespan extension in both La and Ra lines (A) and DGRP lines (B).
Secondly, we compared the expression levels of timeless and other circadian cycle core components across 12 Drosophila Genetic Reference Panel (DGRP) fly stocks with different lifespans. Among the six long-lived stocks, there were two stocks with significantly higher timeless expression at ZT6 (Fig. 9B). Together, these findings suggest that changes in timeless expression frequently associate with lifespan extension but that longevity can also be achieved via other pathways, independently of changes in timeless.
Discussion
We have found that experimental selection of Drosophila strains for exceptional longevity is associated with changes in the expression of circadian clock components (Figs. 6, 9), altered circadian gene expression in skeletal muscle (Fig. 7), and the maintenance of robust circadian activity patterns in old age (Fig. 1C,D). Specifically, muscle of the O lines show decreased cycle expression and higher timeless and period mRNA levels, which associate with changes in the rhythmicity of several circadian genes and with the acquisition of rhythmic expression for some genes that are normally not circadian (Figs. 6–8). These findings suggest that the O lines developed a variant pattern of circadian expression that impacts only some genes, rather than the overall circadian transcriptome. Consistent with a contribution of timeless to this regulation, overexpression of timeless to levels similar to those seen in the O lines leads to changes in the circadian transcriptome. In particular, some of the genes with de novo rhythmicity that differentiate muscles with timeless overexpression from controls similarly oscillate in the O lines but not in the parental B3 strain (Figs. 7, 8).
Changes in the pattern of gene rhythmicity have been observed also in other contexts. For example, aging and exposure to oxidative stress increase or promote de novo rhythmicity for some stress-response genes in Drosophila heads (Kuintzle et al. 2017). Therefore, adaptations in circadian gene expression that affect only limited gene sets may represent a common and context-tailored response to homeostatic challenges.
On this basis, an adaptation of the circadian cycle (Figs. 7, 8) is possibly involved in the longevity of O lines, as well as circadian-independent functions of clock components that are differentially modulated in O versus B lines (Fig. 6). In particular, the higher transcriptional oscillation of timeless in the O lines versus the B3 line (Fig. 6) may contribute to lifespan extension. This hypothesis is based on the observation that the amplitude of timeless expression increases upon DR (Katewa et al. 2016) and declines with aging (Luo et al. 2012; Rakshit et al. 2012) and that loss of timeless shortens lifespan and accelerates age-related locomotor decline in Drosophila (Vaccaro et al. 2017). Moreover, our study indicates also that constantly higher levels of timeless are sufficient for longevity and for inducing rhythmic expression of some genes (Fig. 8), consistent with the observation that timeless overexpression in the whole organism and in some peripheral tissues (fat body, gut, and malpighian tubules) extends lifespan (Katewa et al. 2016).
In addition to lifespan, timeless has been reported to be necessary for the response to dietary restriction (Katewa et al. 2016), although this dependency appears to be variable and context-specific (Ulgherait et al. 2016). Moreover, Timeless regulates diverse processes relevant for aging that occur in several tissues (Young et al. 2015; Tsoumtsa et al. 2017; Shen et al. 2018). On this basis, the longevity of O lines likely depends on the action of Timeless in multiple tissues (Katewa et al. 2016; Solovev et al. 2019). In this respect, our findings indicate also that skeletal muscle timeless contributes to longevity (Fig. 8), in line with previous studies that have defined an important role for the skeletal muscle clock in mice (Harfmann et al. 2015, 2016; Hodge et al. 2015, 2019; Schroder et al. 2015; Ehlen et al. 2017).
In addition to providing insight into the link between aging and the muscle circadian clock in Drosophila, our study suggests that longevity may co-evolve with circadian cycle variants. Typically, variations in the circadian cycle emerge as specific adaptations to the environment and to social clues, such as avoiding predators or working with peers (Tauber et al. 2007; Bulla et al. 2016; Kaiser et al. 2016). On this basis, it is possible that the modulation of aging is a by-product of circadian variants that provide an advantage for coping with environmental and social challenges. In the case of the O lines, these fly stocks were established via the selective mating of late survivors within the parental B population (Rose 1984). Therefore, it is possible that changes in the expression of circadian core components were selected in the O lines because of their capacity to preserve activity levels, social interactions, and reproduction during aging.
In summary, our findings indicate that variation in the muscle circadian clock contributes to shaping aging traits and to the evolutionary divergence in longevity across individuals and populations.
Methods
Fly stocks and survival analysis
The Drosophila melanogaster strains experimentally selected for delayed senescence (O1 and O3) and the parental B3 strain were maintained as previously described (Rose 1984; Wilson et al. 2006; Parkhitko et al. 2016). The normal-lived progenitor Ra strain and the long-lived La strain were previously described (Arking 2001) and were validated according to the expression of genes (Mal-B1 and Pepck2) known to be regulated in these strains (Sujkowski et al. 2015). In addition, the following Bloomington stock center DGRP lines were also examined, for which lifespan data are available (Ivanov et al. 2015): #25199, #28189, #28142, #28138, #55017, #28243, #28200, #28218, #28150, #28226, #28278, #28276.
Fly stocks used in lifespan experiments are Mhc-Gal4 (Schuster et al. 1996), UAS-timeless (2nd chromosome insertion; from Dr. Amita Sehgal), and UAS-mCherry (BL#35787).
For all experiments, male flies were collected within 24 h from eclosion and reared at standard density (25 per vial) on cornmeal/soy flour/yeast fly food at 60% humidity, 12 h:12 h light:dark cycles, and 25°C. For one survival experiment in Figure 8A, flies were kept at 29°C, as indicated. Survival analysis was done as before (Demontis et al. 2014) and is described in detail in the Supplemental Methods.
Assays for muscle function (flight, negative geotaxis, jumping, and spontaneous locomotion)
Assays for muscle function were done as previously described to probe flight (Drummond et al. 1991), negative geotaxis (Demontis and Perrimon 2010), jumping (Wells et al. 1996), and spontaneous locomotion (Katewa et al. 2012), and are described in detail in the Supplemental Methods.
Skeletal muscle immunostaining and confocal microscopy
Fly thoraces were dissected, fixed, and immunostained as described previously (Demontis and Perrimon 2010; Hunt and Demontis 2013) with rabbit anti-poly-ubiquitin (FK2; Enzo Life Sciences, #BML-PW8810-0100) and Anti-Ref(2)P antibodies (Abcam, #178840). Alexa635-phalloidin was used to detect F-actin. Supplemental Methods report detailed information on the analysis of confocal images and of skeletal muscle size.
Genomic sequencing
The whole-genome sequencing of nine pooled DNA samples, each from four individual flies, was performed on an Illumina HiSeq 2000 according to the manufacturer's instructions (Illumina). The 101-bp paired-end reads were trimmed for adapters, filtered against quality (Phred-like Q20 or greater) and length (50 bp or longer), and aligned to a Drosophila melanogaster assembly Berkeley Drosophila Genome Project (BDGP) Release 5 reference sequence (dm3), with Release 5.46 annotation (July 2012) from FlyBase (http://flybase.org). The genotypes were called at all positions for each sample where there were high-quality sequence bases (Phred-like Q25 or greater) at a minimum variant allele coverage of two paired-end reads, using CLC Genomics Workbench v7.5.1 (CLC Bio). The statistically significant (P < 0.05) variants between longevity and control groups, but not between two longevity groups, were selected using a t-test on the variant frequencies among three replicates from each of the three sample groups. Each variant was annotated either with a relative position within a gene or to the transcription start site or the transcription end site of a gene, whichever is the closest, using an in-house script (Supplemental Code S1). The numbers of variants in every 10-bp window were further summarized for variant density relative to the position of TSSs and TESs. For each missense mutation, the protein sequence divergence leading to potential damage of protein function was evaluated using the BLOSUM matrix (Henikoff and Henikoff 1992). Circular visualization of genomic data was done with Circos (Krzywinski et al. 2009).
qRT-PCR
qRT-PCR was performed as previously described (Demontis et al. 2014). Total RNA was extracted with the TRIzol reagent (Life Technologies) from Drosophila thoraces, consisting primarily of skeletal muscle, from >20 male flies/replicate, followed by reverse transcription with the iScript cDNA synthesis kit (Bio-Rad). qRT-PCR was performed with SYBR Green and a CFX96 apparatus (Bio-Rad). Three biological replicates were used for each genotype and time point. α-Tubulin at 84B was used as a normalization reference. The comparative CT method was used for relative quantitation of mRNA levels. The oligos used are listed in Supplemental Table S10.
RNA-sequencing
Total RNA was extracted from Drosophila thoraces, which consist primarily of skeletal muscle, as described above. Three or more biological replicates were prepared for RNA-seq with the TruSeq stranded mRNA library preparation kit (Illumina) and sequenced on the Illumina HiSeq 4000 platform, with six samples in each lane. Multiplexing was done on a per flowcell basis. Approximately 100 million reads were obtained for each sample. FASTQ sequences derived from mRNA paired-end 100-bp sequences were mapped to the Drosophila melanogaster genome (BDGP5) with the STAR aligner (version 2.5.3a) (Dobin et al. 2013). The percentage of read mapping was on average 92.39%, with a range of 84.41%–99.11%.
Transcript level data were counted using HTSeq (version 0.6.1p1) (Anders et al. 2015) based on the BDGP5 GTF release 75. The TMM method (Robinson et al. 2010) was used to calculate the normalization factors. Then, linear modeling was carried out on the log2(CPM) (count per million) values where the mean-variance relationship is accommodated using precision weights calculated by the voom function (Law et al. 2014) of the limma package in R 3.2.3 (R Core Team 2013; Ritchie et al. 2015). A q-value (FDR) was calculated for multiple comparison adjustments of RNA-seq data. The lmFit, eBayes, and contrasts.fit functions from the limma package were used for the linear modeling. The UAS/Gal4 system analyses were done by limma package in R 3.2.3. Statistical analyses for O and B strains at 1 and 6 wk of age, correlations, and PCA visualizations were performed using log2(FPKM) values in Partek Genomic Suite 6.6 (www.partek.com/partek-genomics-suite/).
Network hub genes were identified from selected genes (P < 0.05 of interaction of age and genotype in two-way ANOVA and fold change > 2 by genotype comparison) (Supplemental Table S11) using a STATA MP/11.2 (www.stata.com) script that returns pairwise correlations where |rho| >0.7 (Supplemental Code S2). The script then further selects hub genes with link count >50 and average absolute rho > 0.8 for the hub gene visualization (Fig. 4F), which was obtained with STRING (Szklarczyk et al. 2019) by visualizing only high-confidence interactions (minimum interaction score >0.7), and color coded based on GO terms. The gene sets were analyzed by DAVID (Database for Annotation Visualization and Integrated Discovery) (Huang da et al. 2009) to identify enriched functional classes of genes.
Computational analyses of cyclic genes
Circadian transcriptomes were obtained from muscles of 1-wk-old flies. Cyclic genes were identified by using log2(FPKM) values transformed after the addition of 2 to prevent negative numbers and reduce the effect of low-expressing genes. The JTK_CYCLEv3.1 code (Hughes et al. 2010) for R (3.2.3) was applied to log2(FPKM) data for each genotype separately, adjusting for uneven cohorts to account for excluded outliers as needed. The statistically significant genes were determined by the Benjamini–Hochberg adjusted P-values.
For hierarchical clustering, the mean of log2(FPKM) was obtained for each strain (O1, O3, and B3) and time point (ZT0, ZT6, ZT12, ZT18). Statistically significant genes in at least one JTK analysis (adjP < 0.05) were included. These means were then hierarchically clustered by gene while preserving the order of time and strain using Partek 6.6 Genomic Suites.
Proteome profiling by TMT-LC/LC-MS/MS
This analysis was performed essentially following our previously optimized method (Bai et al. 2017) and is described in detail in the Supplemental Methods.
Western blotting
Western blots for monitoring Timeless protein levels were done according to standard procedures (Hunt et al. 2015) by using anti-TIM (Garbe et al. 2013; Jang et al. 2015) and anti-tubulin antibodies (Cell Signaling Technologies, #2125). The band corresponding to Timeless protein (∼150 kDa) was confirmed to be specific via the analysis of positive controls (Supplemental Fig. S2).
Statistical analyses
All experiments were performed with biological triplicates unless otherwise indicated. The unpaired two-tailed Student's t-test was used to compare the means of two independent groups to each other. A one-way ANOVA with Tukey's post hoc test was used for multiple comparisons of more than two groups of normally distributed data. A two-way ANOVA was used when two treatments were applied. Survival data was analyzed with OASIS2 (Han et al. 2016) using Fisher's exact test at 50% mortality (medial lifespan). The “n” for each experiment can be found in the figure legends and represents independently generated samples, including individual flies for lifespan and muscle function assays, and batches of flies or fly thoraces for other assays. Bar graphs represent the mean ±SEM or ±SD, as indicated in the figure legend. Throughout the figures, asterisks indicate a significant P-value (*P < 0.05). Statistical analyses were done with Excel and GraphPad Prism.
Data access
All raw and processed RNA sequencing data generated in this study have been deposited to the NCBI Gene Expression Omnibus (GEO; http://www.ncbi.nlm.nih.gov/geo/) under accession number GSE129922. The genomic DNA sequencing data generated in this study have been deposited to the NCBI BioProject database (http://www.ncbi.nlm.nih.gov/bioproject/) under accession number PRJNA533450. The mass spectrometry proteomics data generated in this study have been deposited to the ProteomeXchange Consortium via the PRIDE partner repository (https://www.ebi.ac.uk/pride/archive/) with the data set identifier PXD014223. These and other primary data are provided in Supplemental Tables S1–S12.
Supplementary Material
Acknowledgments
We thank Drs. Amita Sehgal, Trudy Mackay, and Robert Arking, the VDRC, and the Bloomington stock centers for fly stocks and antibodies. We also thank the Light Microscopy facility and the Hartwell Center for Bioinformatics and Biotechnology at St. Jude Children's Research Hospital. This work was supported by research grants to F.D. from The Glenn Foundation for Medical Research, The Ellison Medical Foundation (New Scholar in Aging award), The American Federation for Aging Research (AFAR), The American Parkinson Disease Association, The Hartwell Foundation (Individual Biomedical Research award), and the National Institute on Aging of the National Institutes of Health (NIH) (R01AG055532). Research at St. Jude Children's Research Hospital is supported by the American Lebanese Syrian Associated Charities (ALSAC). L.C.H. was supported by a Glenn/AFAR Postdoctoral Fellowship for Translational Research on Aging. The mass spectrometry analysis was performed in the St. Jude Children's Research Hospital Center for Proteomics and Metabolomics, partially supported by NIH Cancer Center Support grant P30CA021765 and by NIH grant R01AG047928 (J.P.).
Author contributions: L.C.H., J.J., D.R., M.C., M.R.-M., and F.D. performed the experiments and analyzed data; Y.-D.W. analyzed genomic DNA sequencing data; D.F. and Y.F. analyzed RNA-seq data; A.S. analyzed confocal microscopy images; V.R.P. and J.P. performed and analyzed mass spectrometry experiments; and F.D. supervised the project and wrote the manuscript.
Footnotes
[Supplemental material is available for this article.]
Article published online before print. Article, supplemental material, and publication date are at http://www.genome.org/cgi/doi/10.1101/gr.246884.118.
References
- Anders S, Pyl PT, Huber W. 2015. HTSeq—a Python framework to work with high-throughput sequencing data. Bioinformatics 31: 166–169. 10.1093/bioinformatics/btu638 [DOI] [PMC free article] [PubMed] [Google Scholar]
- Arking R. 2001. Gene expression and regulation in the extended longevity phenotypes of Drosophila. Ann N Y Acad Sci 928: 157–167. 10.1111/j.1749-6632.2001.tb05645.x [DOI] [PubMed] [Google Scholar]
- Bai B, Tan H, Pagala VR, High AA, Ichhaporia VP, Hendershot L, Peng J. 2017. Deep profiling of proteome and phosphoproteome by isobaric labeling, extensive liquid chromatography, and mass spectrometry. Methods Enzymol 585: 377–395. 10.1016/bs.mie.2016.10.007 [DOI] [PMC free article] [PubMed] [Google Scholar]
- Barber AF, Erion R, Holmes TC, Sehgal A. 2016. Circadian and feeding cues integrate to drive rhythms of physiology in Drosophila insulin-producing cells. Genes Dev 30: 2596–2606. 10.1101/gad.288258.116 [DOI] [PMC free article] [PubMed] [Google Scholar]
- Barzilai N, Guarente L, Kirkwood TB, Partridge L, Rando TA, Slagboom PE. 2012. The place of genetics in ageing research. Nat Rev Genet 13: 589–594. 10.1038/nrg3290 [DOI] [PubMed] [Google Scholar]
- Bauer J, Antosh M, Chang C, Schorl C, Kolli S, Neretti N, Helfand SL. 2010. Comparative transcriptional profiling identifies takeout as a gene that regulates life span. Aging (Albany NY) 2: 298–310. 10.18632/aging.100146 [DOI] [PMC free article] [PubMed] [Google Scholar]
- Bhutani N, Venkatraman P, Goldberg AL. 2007. Puromycin-sensitive aminopeptidase is the major peptidase responsible for digesting polyglutamine sequences released by proteasomes during protein degradation. EMBO J 26: 1385–1396. 10.1038/sj.emboj.7601592 [DOI] [PMC free article] [PubMed] [Google Scholar]
- Bulla M, Valcu M, Dokter AM, Dondua AG, Kosztolányi A, Rutten AL, Helm B, Sandercock BK, Casler B, Ens BJ, et al. 2016. Unexpected diversity in socially synchronized rhythms of shorebirds. Nature 540: 109–113. 10.1038/nature20563 [DOI] [PubMed] [Google Scholar]
- Carbone MA, Yamamoto A, Huang W, Lyman RA, Meadors TB, Yamamoto R, Anholt RR, Mackay TF. 2016. Genetic architecture of natural variation in visual senescence in Drosophila. Proc Natl Acad Sci 113: E6620–E6629. 10.1073/pnas.1613833113 [DOI] [PMC free article] [PubMed] [Google Scholar]
- Carnes MU, Campbell T, Huang W, Butler DG, Carbone MA, Duncan LH, Harbajan SV, King EM, Peterson KR, Weitzel A, et al. 2015. The genomic basis of postponed senescence in Drosophila melanogaster. PLoS One 10: e0138569 10.1371/journal.pone.0138569 [DOI] [PMC free article] [PubMed] [Google Scholar]
- Chambers MC, Lightfield KL, Schneider DS. 2012. How the fly balances its ability to combat different pathogens. PLoS Pathog 8: e1002970 10.1371/journal.ppat.1002970 [DOI] [PMC free article] [PubMed] [Google Scholar]
- Demontis F, Perrimon N. 2010. FOXO/4E-BP signaling in Drosophila muscles regulates organism-wide proteostasis during aging. Cell 143: 813–825. 10.1016/j.cell.2010.10.007 [DOI] [PMC free article] [PubMed] [Google Scholar]
- Demontis F, Habermann B, Dahmann C. 2006. PDZ-domain-binding sites are common among cadherins. Dev Genes Evol 216: 737–741. 10.1007/s00427-006-0097-0 [DOI] [PubMed] [Google Scholar]
- Demontis F, Piccirillo R, Goldberg AL, Perrimon N. 2013a. The influence of skeletal muscle on systemic aging and lifespan. Aging Cell 12: 943–949. 10.1111/acel.12126 [DOI] [PMC free article] [PubMed] [Google Scholar]
- Demontis F, Piccirillo R, Goldberg AL, Perrimon N. 2013b. Mechanisms of skeletal muscle aging: insights from Drosophila and mammalian models. Dis Model Mech 6: 1339–1352. 10.1242/dmm.012559 [DOI] [PMC free article] [PubMed] [Google Scholar]
- Demontis F, Patel VK, Swindell WR, Perrimon N. 2014. Intertissue control of the nucleolus via a myokine-dependent longevity pathway. Cell Rep 7: 1481–1494. 10.1016/j.celrep.2014.05.001 [DOI] [PMC free article] [PubMed] [Google Scholar]
- Dierickx P, Van Laake LW, Geijsen N. 2018. Circadian clocks: from stem cells to tissue homeostasis and regeneration. EMBO Rep 19: 18–28. 10.15252/embr.201745130 [DOI] [PMC free article] [PubMed] [Google Scholar]
- DiLoreto R, Murphy CT. 2015. The cell biology of aging. Mol Biol Cell 26: 4524–4531. 10.1091/mbc.E14-06-1084 [DOI] [PMC free article] [PubMed] [Google Scholar]
- Dobin A, Davis CA, Schlesinger F, Drenkow J, Zaleski C, Jha S, Batut P, Chaisson M, Gingeras TR. 2013. STAR: ultrafast universal RNA-seq aligner. Bioinformatics 29: 15–21. 10.1093/bioinformatics/bts635 [DOI] [PMC free article] [PubMed] [Google Scholar]
- Drummond DR, Hennessey ES, Sparrow JC. 1991. Characterisation of missense mutations in the Act88F gene of Drosophila melanogaster. Mol Gen Genet 226: 70–80. 10.1007/BF00273589 [DOI] [PubMed] [Google Scholar]
- Durham MF, Magwire MM, Stone EA, Leips J. 2014. Genome-wide analysis in Drosophila reveals age-specific effects of SNPs on fitness traits. Nat Commun 5: 4338 10.1038/ncomms5338 [DOI] [PubMed] [Google Scholar]
- Dyar KA, Lutter D, Artati A, Ceglia NJ, Liu Y, Armenta D, Jastroch M, Schneider S, de Mateo S, Cervantes M, et al. 2018. Atlas of circadian metabolism reveals system-wide coordination and communication between clocks. Cell 174: 1571–1585.e11. 10.1016/j.cell.2018.08.042 [DOI] [PMC free article] [PubMed] [Google Scholar]
- Ehlen JC, Brager AJ, Baggs J, Pinckney L, Gray CL, DeBruyne JP, Esser KA, Takahashi JS, Paul KN. 2017. Bmal1 function in skeletal muscle regulates sleep. eLife 6: e26557 10.7554/eLife.26557 [DOI] [PMC free article] [PubMed] [Google Scholar]
- Flatt T, Kawecki TJ. 2007. Juvenile hormone as a regulator of the trade-off between reproduction and life span in Drosophila melanogaster. Evolution 61: 1980–1991. 10.1111/j.1558-5646.2007.00151.x [DOI] [PubMed] [Google Scholar]
- Garbe DS, Fang Y, Zheng X, Sowcik M, Anjum R, Gygi SP, Sehgal A. 2013. Cooperative interaction between phosphorylation sites on PERIOD maintains circadian period in Drosophila. PLoS Genet 9: e1003749 10.1371/journal.pgen.1003749 [DOI] [PMC free article] [PubMed] [Google Scholar]
- Gates AC, Bernal-Mizrachi C, Chinault SL, Feng C, Schneider JG, Coleman T, Malone JP, Townsend RR, Chakravarthy MV, Semenkovich CF. 2007. Respiratory uncoupling in skeletal muscle delays death and diminishes age-related disease. Cell Metab 6: 497–505. 10.1016/j.cmet.2007.10.010 [DOI] [PubMed] [Google Scholar]
- Geiger-Thornsberry GL, Mackay TF. 2004. Quantitative trait loci affecting natural variation in Drosophila longevity. Mech Ageing Dev 125: 179–189. 10.1016/j.mad.2003.12.008 [DOI] [PubMed] [Google Scholar]
- Ghazalpour A, Bennett B, Petyuk VA, Orozco L, Hagopian R, Mungrue IN, Farber CR, Sinsheimer J, Kang HM, Furlotte N, et al. 2011. Comparative analysis of proteome and transcriptome variation in mouse. PLoS Genet 7: e1001393 10.1371/journal.pgen.1001393 [DOI] [PMC free article] [PubMed] [Google Scholar]
- Giebultowicz JM. 2018. Circadian regulation of metabolism and healthspan in Drosophila. Free Radic Biol Med 119: 62–68. 10.1016/j.freeradbiomed.2017.12.025 [DOI] [PMC free article] [PubMed] [Google Scholar]
- Girardot F, Lasbleiz C, Monnier V, Tricoire H. 2006. Specific age-related signatures in Drosophila body parts transcriptome. BMC Genomics 7: 69 10.1186/1471-2164-7-69 [DOI] [PMC free article] [PubMed] [Google Scholar]
- Gygi SP, Rochon Y, Franza BR, Aebersold R. 1999. Correlation between protein and mRNA abundance in yeast. Mol Cell Biol 19: 1720–1730. 10.1128/MCB.19.3.1720 [DOI] [PMC free article] [PubMed] [Google Scholar]
- Han SK, Lee D, Lee H, Kim D, Son HG, Yang JS, Lee SV, Kim S. 2016. OASIS 2: online application for survival analysis 2 with features for the analysis of maximal lifespan and healthspan in aging research. Oncotarget 7: 56147–56152. 10.18632/oncotarget.11269 [DOI] [PMC free article] [PubMed] [Google Scholar]
- Hanson RW, Hakimi P. 2008. Born to run; the story of the PEPCK-Cmus mouse. Biochimie 90: 838–842. 10.1016/j.biochi.2008.03.009 [DOI] [PMC free article] [PubMed] [Google Scholar]
- Harfmann BD, Schroder EA, Esser KA. 2015. Circadian rhythms, the molecular clock, and skeletal muscle. J Biol Rhythms 30: 84–94. 10.1177/0748730414561638 [DOI] [PMC free article] [PubMed] [Google Scholar]
- Harfmann BD, Schroder EA, Kachman MT, Hodge BA, Zhang X, Esser KA. 2016. Muscle-specific loss of Bmal1 leads to disrupted tissue glucose metabolism and systemic glucose homeostasis. Skelet Muscle 6: 12 10.1186/s13395-016-0082-x [DOI] [PMC free article] [PubMed] [Google Scholar]
- Henikoff S, Henikoff JG. 1992. Amino acid substitution matrices from protein blocks. Proc Natl Acad Sci 89: 10915–10919. 10.1073/pnas.89.22.10915 [DOI] [PMC free article] [PubMed] [Google Scholar]
- Herndon LA, Schmeissner PJ, Dudaronek JM, Brown PA, Listner KM, Sakano Y, Paupard MC, Hall DH, Driscoll M. 2002. Stochastic and genetic factors influence tissue-specific decline in ageing C. elegans. Nature 419: 808–814. 10.1038/nature01135 [DOI] [PubMed] [Google Scholar]
- Hodge BA, Wen Y, Riley LA, Zhang X, England JH, Harfmann BD, Schroder EA, Esser KA. 2015. The endogenous molecular clock orchestrates the temporal separation of substrate metabolism in skeletal muscle. Skelet Muscle 5: 17 10.1186/s13395-015-0039-5 [DOI] [PMC free article] [PubMed] [Google Scholar]
- Hodge BA, Zhang X, Gutierrez-Monreal MA, Cao Y, Hammers DW, Yao Z, Wolff CA, Du P, Kemler D, Judge AR, et al. 2019. MYOD1 functions as a clock amplifier as well as a critical co-factor for downstream circadian gene expression in muscle. eLife 8: e43017 10.7554/eLife.43017 [DOI] [PMC free article] [PubMed] [Google Scholar]
- Hood S, Amir S. 2017. The aging clock: circadian rhythms and later life. J Clin Invest 127: 437–446. 10.1172/JCI90328 [DOI] [PMC free article] [PubMed] [Google Scholar]
- Huang da W, Sherman BT, Lempicki RA. 2009. Systematic and integrative analysis of large gene lists using DAVID bioinformatics resources. Nat Protoc 4: 44–57. 10.1038/nprot.2008.211 [DOI] [PubMed] [Google Scholar]
- Hughes ME, Hogenesch JB, Kornacker K. 2010. JTK_CYCLE: an efficient nonparametric algorithm for detecting rhythmic components in genome-scale data sets. J Biol Rhythms 25: 372–380. 10.1177/0748730410379711 [DOI] [PMC free article] [PubMed] [Google Scholar]
- Hunt LC, Demontis F. 2013. Whole-mount immunostaining of Drosophila skeletal muscle. Nat Protoc 8: 2496–2501. 10.1038/nprot.2013.156 [DOI] [PubMed] [Google Scholar]
- Hunt LC, Xu B, Finkelstein D, Fan Y, Carroll PA, Cheng PF, Eisenman RN, Demontis F. 2015. The glucose-sensing transcription factor MLX promotes myogenesis via myokine signaling. Genes Dev 29: 2475–2489. 10.1101/gad.267419.115 [DOI] [PMC free article] [PubMed] [Google Scholar]
- Hutchinson EW, Shaw AJ, Rose MR. 1991. Quantitative genetics of postponed aging in Drosophila melanogaster. II. Analysis of selected lines. Genetics 127: 729–737. [DOI] [PMC free article] [PubMed] [Google Scholar]
- Ivanov DK, Escott-Price V, Ziehm M, Magwire MM, Mackay TF, Partridge L, Thornton JM. 2015. Longevity GWAS using the Drosophila genetic reference panel. J Gerontol A Biol Sci Med Sci 70: 1470–1478. 10.1093/gerona/glv047 [DOI] [PMC free article] [PubMed] [Google Scholar]
- Jang AR, Moravcevic K, Saez L, Young MW, Sehgal A. 2015. Drosophila TIM binds importin α1, and acts as an adapter to transport PER to the nucleus. PLoS Genet 11: e1004974 10.1371/journal.pgen.1004974 [DOI] [PMC free article] [PubMed] [Google Scholar]
- Jiao J, Demontis F. 2017. Skeletal muscle autophagy and its role in sarcopenia and organismal aging. Curr Opin Pharmacol 34: 1–6. 10.1016/j.coph.2017.03.009 [DOI] [PubMed] [Google Scholar]
- Kaiser TS, Poehn B, Szkiba D, Preussner M, Sedlazeck FJ, Zrim A, Neumann T, Nguyen LT, Betancourt AJ, Hummel T, et al. 2016. The genomic basis of circadian and circalunar timing adaptations in a midge. Nature 540: 69–73. 10.1038/nature20151 [DOI] [PMC free article] [PubMed] [Google Scholar]
- Karpowicz P, Zhang Y, Hogenesch JB, Emery P, Perrimon N. 2013. The circadian clock gates the intestinal stem cell regenerative state. Cell Rep 3: 996–1004. 10.1016/j.celrep.2013.03.016 [DOI] [PMC free article] [PubMed] [Google Scholar]
- Katewa SD, Demontis F, Kolipinski M, Hubbard A, Gill MS, Perrimon N, Melov S, Kapahi P. 2012. Intramyocellular fatty-acid metabolism plays a critical role in mediating responses to dietary restriction in Drosophila melanogaster. Cell Metab 16: 97–103. 10.1016/j.cmet.2012.06.005 [DOI] [PMC free article] [PubMed] [Google Scholar]
- Katewa SD, Akagi K, Bose N, Rakshit K, Camarella T, Zheng X, Hall D, Davis S, Nelson CS, Brem RB, et al. 2016. Peripheral circadian clocks mediate dietary restriction-dependent changes in lifespan and fat metabolism in Drosophila. Cell Metab 23: 143–154. 10.1016/j.cmet.2015.10.014 [DOI] [PMC free article] [PubMed] [Google Scholar]
- Keipert S, Ost M, Chadt A, Voigt A, Ayala V, Portero-Otin M, Pamplona R, Al-Hasani H, Klaus S. 2013. Skeletal muscle uncoupling-induced longevity in mice is linked to increased substrate metabolism and induction of the endogenous antioxidant defense system. Am J Physiol Endocrinol Metab 304: E495–E506. 10.1152/ajpendo.00518.2012 [DOI] [PubMed] [Google Scholar]
- Krishnan N, Kretzschmar D, Rakshit K, Chow E, Giebultowicz JM. 2009. The circadian clock gene period extends healthspan in aging Drosophila melanogaster. Aging (Albany NY) 1: 937–948. 10.18632/aging.100103 [DOI] [PMC free article] [PubMed] [Google Scholar]
- Krishnan N, Rakshit K, Chow ES, Wentzell JS, Kretzschmar D, Giebultowicz JM. 2012. Loss of circadian clock accelerates aging in neurodegeneration-prone mutants. Neurobiol Dis 45: 1129–1135. 10.1016/j.nbd.2011.12.034 [DOI] [PMC free article] [PubMed] [Google Scholar]
- Krzywinski M, Schein J, Birol I, Connors J, Gascoyne R, Horsman D, Jones SJ, Marra MA. 2009. Circos: an information aesthetic for comparative genomics. Genome Res 19: 1639–1645. 10.1101/gr.092759.109 [DOI] [PMC free article] [PubMed] [Google Scholar]
- Kuintzle RC, Chow ES, Westby TN, Gvakharia BO, Giebultowicz JM, Hendrix DA. 2017. Circadian deep sequencing reveals stress-response genes that adopt robust rhythmic expression during aging. Nat Commun 8: 14529 10.1038/ncomms14529 [DOI] [PMC free article] [PubMed] [Google Scholar]
- Law CW, Chen Y, Shi W, Smyth GK. 2014. voom: precision weights unlock linear model analysis tools for RNA-seq read counts. Genome Biol 15: R29 10.1186/gb-2014-15-2-r29 [DOI] [PMC free article] [PubMed] [Google Scholar]
- López-Otín C, Blasco MA, Partridge L, Serrano M, Kroemer G. 2013. The hallmarks of aging. Cell 153: 1194–1217. 10.1016/j.cell.2013.05.039 [DOI] [PMC free article] [PubMed] [Google Scholar]
- Luo W, Chen WF, Yue Z, Chen D, Sowcik M, Sehgal A, Zheng X. 2012. Old flies have a robust central oscillator but weaker behavioral rhythms that can be improved by genetic and environmental manipulations. Aging Cell 11: 428–438. 10.1111/j.1474-9726.2012.00800.x [DOI] [PMC free article] [PubMed] [Google Scholar]
- Mackay TF. 2002. The nature of quantitative genetic variation for Drosophila longevity. Mech Ageing Dev 123: 95–104. 10.1016/S0047-6374(01)00330-X [DOI] [PubMed] [Google Scholar]
- Masri S, Sassone-Corsi P. 2018. The emerging link between cancer, metabolism, and circadian rhythms. Nat Med 24: 1795–1803. 10.1038/s41591-018-0271-8 [DOI] [PMC free article] [PubMed] [Google Scholar]
- Massouras A, Waszak SM, Albarca-Aguilera M, Hens K, Holcombe W, Ayroles JF, Dermitzakis ET, Stone EA, Jensen JD, Mackay TF, et al. 2012. Genomic variation and its impact on gene expression in Drosophila melanogaster. PLoS Genet 8: e1003055 10.1371/journal.pgen.1003055 [DOI] [PMC free article] [PubMed] [Google Scholar]
- Mattis J, Sehgal A. 2016. Circadian rhythms, sleep, and disorders of aging. Trends Endocrinol Metab 27: 192–203. 10.1016/j.tem.2016.02.003 [DOI] [PMC free article] [PubMed] [Google Scholar]
- Metter EJ, Talbot LA, Schrager M, Conwit R. 2002. Skeletal muscle strength as a predictor of all-cause mortality in healthy men. J Gerontol A Biol Sci Med Sci 57: B359–B365. 10.1093/gerona/57.10.B359 [DOI] [PubMed] [Google Scholar]
- Milman S, Barzilai N. 2015. Dissecting the mechanisms underlying unusually successful human health span and life span. Cold Spring Harb Perspect Med 6: a025098 10.1101/cshperspect.a025098 [DOI] [PMC free article] [PubMed] [Google Scholar]
- Mundorf J, Donohoe CD, McClure CD, Southall TD, Uhlirova M. 2019. Ets21c governs tissue renewal, stress tolerance, and aging in the Drosophila intestine. Cell Rep 27: 3019–3033.e5. 10.1016/j.celrep.2019.05.025 [DOI] [PMC free article] [PubMed] [Google Scholar]
- Musci RV, Hamilton KL, Miller BF. 2018. Targeting mitochondrial function and proteostasis to mitigate dynapenia. Eur J Appl Physiol 118: 1–9. 10.1007/s00421-017-3730-x [DOI] [PMC free article] [PubMed] [Google Scholar]
- Musiek ES, Holtzman DM. 2016. Mechanisms linking circadian clocks, sleep, and neurodegeneration. Science 354: 1004–1008. 10.1126/science.aah4968 [DOI] [PMC free article] [PubMed] [Google Scholar]
- Musiek ES, Lim MM, Yang G, Bauer AQ, Qi L, Lee Y, Roh JH, Ortiz-Gonzalez X, Dearborn JT, Culver JP, et al. 2013. Circadian clock proteins regulate neuronal redox homeostasis and neurodegeneration. J Clin Invest 123: 5389–5400. 10.1172/JCI70317 [DOI] [PMC free article] [PubMed] [Google Scholar]
- Nair KS. 2005. Aging muscle. Am J Clin Nutr 81: 953–963. 10.1093/ajcn/81.5.953 [DOI] [PubMed] [Google Scholar]
- Parkhitko AA, Binari R, Zhang N, Asara JM, Demontis F, Perrimon N. 2016. Tissue-specific down-regulation of S-adenosyl-homocysteine via suppression of dAhcyL1/dAhcyL2 extends health span and life span in Drosophila. Genes Dev 30: 1409–1422. 10.1101/gad.282277.116 [DOI] [PMC free article] [PubMed] [Google Scholar]
- Paschos GK, FitzGerald GA. 2017. Circadian clocks and metabolism: implications for microbiome and aging. Trends Genet 33: 760–769. 10.1016/j.tig.2017.07.010 [DOI] [PMC free article] [PubMed] [Google Scholar]
- Pedersen BK, Febbraio MA. 2008. Muscle as an endocrine organ: focus on muscle-derived interleukin-6. Physiol Rev 88: 1379–1406. 10.1152/physrev.90100.2007 [DOI] [PubMed] [Google Scholar]
- Perrin L, Loizides-Mangold U, Chanon S, Gobet C, Hulo N, Isenegger L, Weger BD, Migliavacca E, Charpagne A, Betts JA, et al. 2018. Transcriptomic analyses reveal rhythmic and CLOCK-driven pathways in human skeletal muscle. eLife 7: e34114 10.7554/eLife.34114 [DOI] [PMC free article] [PubMed] [Google Scholar]
- Piccirillo R, Demontis F, Perrimon N, Goldberg AL. 2014. Mechanisms of muscle growth and atrophy in mammals and Drosophila. Dev Dyn 243: 201–215. 10.1002/dvdy.24036 [DOI] [PMC free article] [PubMed] [Google Scholar]
- R Core Team. 2013. R: a language and environment for statistical computing. R Foundation for Statistical Computing, Vienna. https://www.R-project.org/. [Google Scholar]
- Rai M, Demontis F. 2016. Systemic nutrient and stress signaling via myokines and myometabolites. Annu Rev Physiol 78: 85–107. 10.1146/annurev-physiol-021115-105305 [DOI] [PubMed] [Google Scholar]
- Rakshit K, Krishnan N, Guzik EM, Pyza E, Giebultowicz JM. 2012. Effects of aging on the molecular circadian oscillations in Drosophila. Chronobiol Int 29: 5–14. 10.3109/07420528.2011.635237 [DOI] [PMC free article] [PubMed] [Google Scholar]
- Ritchie ME, Phipson B, Wu D, Hu Y, Law CW, Shi W, Smyth GK. 2015. limma powers differential expression analyses for RNA-sequencing and microarray studies. Nucleic Acids Res 43: e47 10.1093/nar/gkv007 [DOI] [PMC free article] [PubMed] [Google Scholar]
- Robinson MD, McCarthy DJ, Smyth GK. 2010. edgeR: a Bioconductor package for differential expression analysis of digital gene expression data. Bioinformatics 26: 139–140. 10.1093/bioinformatics/btp616 [DOI] [PMC free article] [PubMed] [Google Scholar]
- Rose MR. 1984. Laboratory evolution of postponed senescence in Drosophila melanogaster. Evolution 38: 1004–1010. 10.1111/j.1558-5646.1984.tb00370.x [DOI] [PubMed] [Google Scholar]
- Rose MR, Graves JL Jr. 1989. Minireview: what evolutionary biology can do for gerontology. J Gerontol 44: B27–B29. 10.1093/geronj/44.2.B27 [DOI] [PubMed] [Google Scholar]
- Ruiz JR, Sui X, Lobelo F, Morrow JR Jr, Jackson AW, Sjostrom M, Blair SN. 2008. Association between muscular strength and mortality in men: prospective cohort study. BMJ 337: a439 10.1136/bmj.a439 [DOI] [PMC free article] [PubMed] [Google Scholar]
- Schaffner SF. 2004. The X chromosome in population genetics. Nat Rev Genet 5: 43–51. 10.1038/nrg1247 [DOI] [PubMed] [Google Scholar]
- Schroder EA, Harfmann BD, Zhang X, Srikuea R, England JH, Hodge BA, Wen Y, Riley LA, Yu Q, Christie A, et al. 2015. Intrinsic muscle clock is necessary for musculoskeletal health. J Physiol 593: 5387–5404. 10.1113/JP271436 [DOI] [PMC free article] [PubMed] [Google Scholar]
- Schuster CM, Davis GW, Fetter RD, Goodman CS. 1996. Genetic dissection of structural and functional components of synaptic plasticity. II. Fasciclin II controls presynaptic structural plasticity. Neuron 17: 655–667. 10.1016/S0896-6273(00)80198-1 [DOI] [PubMed] [Google Scholar]
- Sgrò CM, Partridge L. 2001. Laboratory adaptation of life history in Drosophila. Am Nat 158: 657–658. 10.1086/323592 [DOI] [PubMed] [Google Scholar]
- Shen X, Li M, Mao Z, Yu W. 2018. Loss of circadian protein TIMELESS accelerates the progression of cellular senescence. Biochem Biophys Res Commun 503: 2784–2791. 10.1016/j.bbrc.2018.08.040 [DOI] [PubMed] [Google Scholar]
- Solovev I, Dobrovolskaya E, Shaposhnikov M, Sheptyakov M, Moskalev A. 2019. Neuron-specific overexpression of core clock genes improves stress-resistance and extends lifespan of Drosophila melanogaster. Exp Gerontol 117: 61–71. 10.1016/j.exger.2018.11.005 [DOI] [PubMed] [Google Scholar]
- Stenesen D, Suh JM, Seo J, Yu K, Lee KS, Kim JS, Min KJ, Graff JM. 2013. Adenosine nucleotide biosynthesis and AMPK regulate adult life span and mediate the longevity benefit of caloric restriction in flies. Cell Metab 17: 101–112. 10.1016/j.cmet.2012.12.006 [DOI] [PMC free article] [PubMed] [Google Scholar]
- Stone EF, Fulton BO, Ayres JS, Pham LN, Ziauddin J, Shirasu-Hiza MM. 2012. The circadian clock protein timeless regulates phagocytosis of bacteria in Drosophila. PLoS Pathog 8: e1002445 10.1371/journal.ppat.1002445 [DOI] [PMC free article] [PubMed] [Google Scholar]
- Sujkowski A, Bazzell B, Carpenter K, Arking R, Wessells RJ. 2015. Endurance exercise and selective breeding for longevity extend Drosophila healthspan by overlapping mechanisms. Aging (Albany NY) 7: 535–552. 10.18632/aging.100789 [DOI] [PMC free article] [PubMed] [Google Scholar]
- Szklarczyk D, Gable AL, Lyon D, Junge A, Wyder S, Huerta-Cepas J, Simonovic M, Doncheva NT, Morris JH, Bork P, et al. 2019. STRING v11: protein–protein association networks with increased coverage, supporting functional discovery in genome-wide experimental datasets. Nucleic Acids Res 47: D607–D613. 10.1093/nar/gky1131 [DOI] [PMC free article] [PubMed] [Google Scholar]
- Tauber E, Zordan M, Sandrelli F, Pegoraro M, Osterwalder N, Breda C, Daga A, Selmin A, Monger K, Benna C, et al. 2007. Natural selection favors a newly derived timeless allele in Drosophila melanogaster. Science 316: 1895–1898. 10.1126/science.1138412 [DOI] [PubMed] [Google Scholar]
- Tiebe M, Lutz M, De La Garza A, Buechling T, Boutros M, Teleman AA. 2015. REPTOR and REPTOR-BP regulate organismal metabolism and transcription downstream of TORC1. Dev Cell 33: 272–284. 10.1016/j.devcel.2015.03.013 [DOI] [PMC free article] [PubMed] [Google Scholar]
- Tsoumtsa LL, Torre C, Trouplin V, Coiffard B, Gimenez G, Mege JL, Ghigo E. 2017. Antimicrobial capacity of the freshwater planarians against S. aureus is under the control of Timeless. Virulence 8: 1160–1169. 10.1080/21505594.2016.1276689 [DOI] [PMC free article] [PubMed] [Google Scholar]
- Ulgherait M, Chen A, Oliva MK, Kim HX, Canman JC, Ja WW, Shirasu-Hiza M. 2016. Dietary restriction extends the lifespan of circadian mutants tim and per. Cell Metab 24: 763–764. 10.1016/j.cmet.2016.11.002 [DOI] [PMC free article] [PubMed] [Google Scholar]
- Vaccaro A, Issa AR, Seugnet L, Birman S, Klarsfeld A. 2017. Drosophila clock is required in brain pacemaker neurons to prevent premature locomotor aging independently of its circadian function. PLoS Genet 13: e1006507 10.1371/journal.pgen.1006507 [DOI] [PMC free article] [PubMed] [Google Scholar]
- Vrailas-Mortimer A, del Rivero T, Mukherjee S, Nag S, Gaitanidis A, Kadas D, Consoulas C, Duttaroy A, Sanyal S. 2011. A muscle-specific p38 MAPK/Mef2/MnSOD pathway regulates stress, motor function, and life span in Drosophila. Dev Cell 21: 783–795. 10.1016/j.devcel.2011.09.002 [DOI] [PMC free article] [PubMed] [Google Scholar]
- Wang HD, Kazemi-Esfarjani P, Benzer S. 2004. Multiple-stress analysis for isolation of Drosophila longevity genes. Proc Natl Acad Sci 101: 12610–12615. 10.1073/pnas.0404648101 [DOI] [PMC free article] [PubMed] [Google Scholar]
- Wells L, Edwards KA, Bernstein SI. 1996. Myosin heavy chain isoforms regulate muscle function but not myofibril assembly. EMBO J 15: 4454–4459. 10.1002/j.1460-2075.1996.tb00822.x [DOI] [PMC free article] [PubMed] [Google Scholar]
- Wilson RH, Morgan TJ, Mackay TF. 2006. High-resolution mapping of quantitative trait loci affecting increased life span in Drosophila melanogaster. Genetics 173: 1455–1463. 10.1534/genetics.105.055111 [DOI] [PMC free article] [PubMed] [Google Scholar]
- Wilson RH, Lai CQ, Lyman RF, Mackay TF. 2013. Genomic response to selection for postponed senescence in Drosophila. Mech Ageing Dev 134: 79–88. 10.1016/j.mad.2012.11.003 [DOI] [PMC free article] [PubMed] [Google Scholar]
- Xu K, Zheng X, Sehgal A. 2008. Regulation of feeding and metabolism by neuronal and peripheral clocks in Drosophila. Cell Metab 8: 289–300. 10.1016/j.cmet.2008.09.006 [DOI] [PMC free article] [PubMed] [Google Scholar]
- Xu K, DiAngelo JR, Hughes ME, Hogenesch JB, Sehgal A. 2011. The circadian clock interacts with metabolic physiology to influence reproductive fitness. Cell Metab 13: 639–654. 10.1016/j.cmet.2011.05.001 [DOI] [PMC free article] [PubMed] [Google Scholar]
- Yamamoto R, Bai H, Dolezal AG, Amdam G, Tatar M. 2013. Juvenile hormone regulation of Drosophila aging. BMC Biol 11: 85 10.1186/1741-7007-11-85 [DOI] [PMC free article] [PubMed] [Google Scholar]
- Yeung ES. 2011. Genome-wide correlation between mRNA and protein in a single cell. Angew Chem Int Ed Engl 50: 583–585. 10.1002/anie.201005969 [DOI] [PubMed] [Google Scholar]
- Young LM, Marzio A, Perez-Duran P, Reid DA, Meredith DN, Roberti D, Star A, Rothenberg E, Ueberheide B, Pagano M. 2015. TIMELESS forms a complex with PARP1 distinct from its complex with TIPIN and plays a role in the DNA damage response. Cell Rep 13: 451–459. 10.1016/j.celrep.2015.09.017 [DOI] [PMC free article] [PubMed] [Google Scholar]
- Zhang SL, Yue Z, Arnold DM, Artiushin G, Sehgal A. 2018. A circadian clock in the blood-brain barrier regulates xenobiotic efflux. Cell 173: 130–139.e10. e110 10.1016/j.cell.2018.02.017 [DOI] [PMC free article] [PubMed] [Google Scholar]
- Zoncu R, Efeyan A, Sabatini DM. 2011. mTOR: from growth signal integration to cancer, diabetes and ageing. Nat Rev Mol Cell Biol 12: 21–35. 10.1038/nrm3025 [DOI] [PMC free article] [PubMed] [Google Scholar]
Associated Data
This section collects any data citations, data availability statements, or supplementary materials included in this article.