

Abstract
We studied how afferent nerve activity affects the in vivo maturation of a fast glutamatergic CNS synapse, the calyx of Held. To address this question, we exploited the distinct presynaptic Ca2+ channel subtypes governing transmitter release at the cochlear inner hair cell (IHC)–spiral neuron synaptic junction compared with those at higher synapses along the auditory pathways. We characterized the functional properties of calyx synapses in wild type (wt) compared with those developing in CaV1.3 subunit-deficient (CaV1.3−/−) mice. CaV1.3−/− mice are deaf because of an absence of glutamate release from IHC, which results in a complete lack of cochlea-driven nerve activity. Presynaptic Ca2+ channel properties, Ca2+ dependence of exocytosis, number of readily releasable quanta, and AMPA mEPSCs were unchanged in postnatal day 14 (P14) to P17 calyx synapses of CaV1.3−/− mice. However, synaptic strength was augmented because presynaptic action potentials were broader, leading to increased quantal release, consistent with lower paired-pulse ratios and stronger depression during repetitive synaptic stimulation. Furthermore, asynchronous release after trains was elevated presumably because of higher residual Ca2+ accumulating in the presynaptic terminals. Finally, we measured larger NMDA EPSCs with higher sensitivity to the NR2B subunit-specific antagonist ifenprodil in P14–P17 synapses of CaV1.3−/− compared with wt mice. These results suggest that auditory activity is required for the adjustment of synaptic strength as well as for the downregulation of synaptic NMDA receptors during postnatal development of the calyx of Held. In contrast, properties of the presynaptic release machinery and postsynaptic AMPA receptors are unaffected by chronic changes in the level of afferent activity at this synapse.
Keywords: development, EPSC, MNTB, calyx of Held, maturation, synaptic plasticity
Introduction
The morphological and functional refinement of synapses in the mammalian CNS during early postnatal development is controlled by a collection of genetic and epigenetic factors. Nerve activity and neurotransmitter release may serve epigenetic functions by promoting or inhibiting synaptogenesis (Kirov and Harris, 1999; Marty et al., 2000), regulating the pattern of innervation (Chattopadhyaya et al., 2004), and decreasing or increasing the strength of synaptic connections (Turrigiano et al., 1998; Murthy et al., 2001; Thiagarajan et al., 2005) by modulating expression, trafficking, degradation, and function of synaptic proteins (Rao and Craig, 1997; O'Brien et al., 1998; Ehlers, 2000; Townsend et al., 2004).
In contrast to the wealth of data describing multiple effects of pharmacologically silencing activity on synaptic transmission in cultured synaptic networks, much less is known about the consequences of chronically changing the levels of physiological activity on synapses developing in vivo (Wu et al., 1996; Vale and Sanes, 2000; Oleskevich and Walmsley, 2002; Clem and Barth, 2006). We addressed this question in a giant glutamatergic synapse of the auditory brainstem, the calyx of Held. During early postnatal development, this synapse undergoes a multiplicity of morphological and functional modifications, which eventually transform it into a fast and reliable relay (Wu and Kelly, 1993; Taschenberger and von Gersdorff, 2000). Relatively little is known about the role of presynaptic afferent activity during this maturation process (Futai et al., 2001). Before hearing onset, synaptic activity in auditory brainstem circuitries is driven by spontaneous (Beutner and Moser, 2001) and after the onset of hearing primarily by sound-evoked glutamate release from cochlear hair cells. Transmitter release from cochlear inner hair cells (IHCs) is governed by voltage-gated L-type Ca2+ channels of the CaV1.3 subtype (Brandt et al., 2003), whereas N- and P/Q-type Ca channels control release in higher synapses along the auditory pathways (Iwasaki et al., 2000; Oleskevich and Walmsley, 2002). By comparing functional properties of postnatal day 14 (P14) to P17 calyx of Held synapses developing in the absence of spontaneous as well as sound-evoked cochlea-driven afferent activity in CaV1.3 subunit-deficient (CaV1.3−/−) mice (Platzer et al., 2000) with those developing in wild-type (wt) mice, we were able to determine whether previously described developmental changes in the functional properties of this synapse arise from intrinsic maturation processes or whether they are driven by afferent nerve activity.
Materials and Methods
Slice preparation.
CaV1.3 subunit-deficient mice were backcrossed for at least five generations into C57BL/6N genetic background and genotyped by PCR as described previously (Platzer et al., 2000). CaV1.3−/− or wt mice (C57BL/6N) were killed by decapitation and brainstem slices were obtained from P8–P17 animals essentially as described before (Taschenberger and von Gersdorff, 2000): the brainstem was quickly immersed in ice-cold low Ca2+ artificial CSF (aCSF) containing the following (in mm): 125 NaCl, 2.5 KCl, 3 MgCl2, 0.1 CaCl2, 25 glucose, 25 NaHCO3, 1.25 NaH2PO4, 0.4 ascorbic acid, 3 myo-inositol, 2 Na-pyruvate, pH 7.3 when bubbled with carbogen (95% O2, 5% CO2). The brainstem was glued onto the stage of a VT1000S vibratome (Leica, Nussloch, Germany) and 180- to 200-μm-thick slices were cut. Slices were transferred to an incubation chamber containing normal aCSF and maintained at 35°C for 30–40 min and thereafter kept at room temperature (22–24°C) for ≤4 h. The composition of normal aCSF was identical to low Ca2+ aCSF except that 1.0 mm MgCl2 and 2.0 mm CaCl2 were used.
Electrophysiology.
Whole-cell patch-clamp recordings were made from calyx of Held terminals and principal neurons of the medial nucleus of the trapezoid body (MNTB) using an EPC-10 amplifier (HEKA Elektronik, Lambrecht/Pfalz, Germany). Analog signals were digitized and stored on disk using Pulse 8.77 software (HEKA Elektronik) running on a personal computer. Sampling intervals and filter settings were ≤20 μs and 4.5 kHz, respectively. Cells were visualized by infrared-differential interference contrast microscopy through a 40× water-immersion objective (numerical aperture, 0.8) using an upright BX51WI microscope (Olympus, Hamburg, Germany) equipped with a 1.5×–2× premagnification and a VX45 CCD camera (PCO, Kelheim, Germany). All experiments were carried out at room temperature.
Patch pipettes were pulled from soft glass (World Precision Instruments, Sarasota, FL) on a PIP-5 puller (HEKA Elektronik). Pipettes were coated with dental wax to reduce stray capacitance. Open tip resistance was 1.5–3 MΩ for postsynaptic and 3–5 MΩ for presynaptic recordings. Access resistance (RS) was ≤20 MΩ for presynaptic and ≤10 MΩ for postsynaptic recordings. RS was routinely compensated 50% during presynaptic and 75–95% during postsynaptic voltage-clamp experiments.
For measuring presynaptic Ca2+ currents (ICa(V)) and membrane capacitance (ΔCm), pipettes were filled with a solution containing the following (in mm): 130 Cs-gluconate, 30 TEA-Cl, 10 HEPES, 0.05 BAPTA, 5 Na2-phosphocreatine, 4 ATP-Mg, 0.3 GTP, pH 7.3 with CsOH. The bath solution was supplemented with 1 μm TTX, 100 μm 4-AP, and 40 mm TEA-Cl to suppress voltage-activated sodium and potassium currents. ΔCm was measured using a software lock-in amplifier (HEKA Pulse 8.77) by adding a 1 kHz sine-wave voltage command (amplitude ± 35 mV) to the holding potential (Vh) of −80 mV. ΔCm was obtained from the averaged Cm value during a 50 ms time window ≥190 ms after the end of the depolarizations. Terminals with a leak current >120 pA or slowly decaying tail currents after ICa(V) were discarded from the analysis.
Presynaptic calyceal action potentials (APs) were elicited by afferent fiber stimulation via a bipolar stimulation electrode placed halfway between the brainstem midline and the MNTB. Stimulation pulses (100 μs duration) were applied using a stimulus isolator unit (A.M.P.I., Jerusalem, Israel), with the output voltage set to 1–2 V above threshold (≤35 V). APs were measured in the current-clamp mode of the EPC-10 after adjusting the fast-capacitance cancellation while in cell-attached mode. For measuring calyceal APs, pipettes were filled with a solution consisting of the following (in mm): 75 K-gluconate, 75 KCl, 10 HEPES, 5 EGTA, 10 Na2-phosphocreatine, 4 ATP-Mg, 0.3 GTP, pH 7.3 with KOH.
Postsynaptic neurons receiving calyceal input were identified from orthodromic APs recorded extracellularly. EPSCs were measured using a pipette solution consisting of the following (in mm): 150 CsCl, 10 TEA-Cl, 10 HEPES, 5 EGTA, 4 ATP-Mg, 0.3 GTP, pH 7.3 with CsOH. For each AP-evoked EPSC (eEPSC), the series resistance (RS) value was updated and stored with the data using the automated RS compensation routine implemented in Pulse. Residual Rs errors were compensated off-line for postsynaptic recordings. NMDA eEPSCs were recorded at Vh = +40 mV. In P14–P17 mice, the peak amplitudes of AMPA eEPSCs frequently exceeded 20 nA at Vh more negative than −40 mV. Except for analysis of their kinetic properties and determining the release time course, AMPA eEPSCs were therefore routinely recorded at Vh = −40 mV to reduce driving force and completely inactivate voltage-gated Na currents in postsynaptic MNTB neurons. Miniature EPSCs (mEPSCs) were recorded at Vh = −70 mV. Bicuculline methiodide (25 μm) and strychnine (2 μm) were routinely included in the bath solution to block inhibitory synaptic currents. TTX was obtained from Alomone Labs (Jerusalem, Israel). Bicuculline, strychnine, 2,3-dioxo-6-nitro-1,2,3,4-tetrahydro-benzo[f]quinoxaline-7-sulfonamide (NBQX), and ifenprodil were from Tocris Bioscience (Ellisville, MO). All other salts and chemicals were from Sigma (St. Louis, MO).
Data analysis.
All off-line analysis was performed with IgorPro 5 software (WaveMetrics, Lake Oswego, OR). Presynaptic AP-evoked Ca2+ influx was simulated using a Hodgkin-Huxley (HH)-type model essentially as described by Borst and Sakmann (1998a) except that the reversal potential of ICa(V) was set to +45 mV. Presynaptic AP waveforms measured at P14–P17 were used to drive the model. The time course of the average activation parameter m2 was solved numerically using a fifth-order Runge-Kutta-Fehlberg algorithm implemented in IgorPro.
For analysis of eEPSCs, traces were corrected for remaining series-resistance errors using the RS values stored in the data files (software kindly provided by E. Neher, MPI Biophysical Chemistry, Göttingen, Germany) (supplemental Fig. 1, available at www.jneurosci.org as supplemental material). Miniature EPSCs (mEPSCs) were detected using a sliding template algorithm (Taschenberger et al., 2005). The mEPSC template length of 4 ms allowed detection of nonoverlapping mEPSCs up to a maximum rate of 250 events/s. The release time course (r(t)) was determined by deconvolving eEPSCs with idealized mEPSC waveforms obtained from the same synapses. Deconvolution was performed in the frequency domain using discrete Fourier transforms implemented in IgorPro. The Fourier transform of eEPSC (F{eEPSC}) was divided by that of the quantal response (F{mEPSC}), and the release rate was obtained from the inverse Fourier transform of this quotient: r(t) = F−1{F{eEPSC}/F{mEPSC}} (Van der Kloot, 1988). Ensemble fluctuation analysis of repetitively elicited EPSCs (≥30, typically 100 repetitions) was performed essentially as described previously (Scheuss et al., 2002). The ensemble mean (Ī) of eEPSC amplitudes (I) was calculated according to the following:
 |
and the variance (Var) of EPSC amplitude distributions was calculated segment-wise by applying the minimum possible segment size of n = 2:
 |
where r denotes the individual repetition, and R denotes the total number of sweeps. All average data are reported as mean ± SEM. For statistical tests, we assumed that the measured quantities were normally distributed and used a two-tailed Student's t test. Differences were termed significant if p < 0.05 that they occurred by chance.
Results
Mice begin to detect air-conducted sound during the second postnatal week (Mikaelian and Ruben, 1964; Kikuchi and Hilding, 1965). At P10, only a small fraction of mice pups show auditory brainstem responses after click stimulation. This number reaches 100% at around P13 (Futai et al., 2001). Because we wanted to study how spontaneous and sound-evoked afferent nerve activity shapes the maturation process at the calyx of Held, most of our analysis was performed after the onset of hearing of air-conducted sound on synapses of P14–P17 wt mice compared with CaV1.3−/− mice of the same age. In some cases, we compared the functional properties of P14–P17 synapses with those obtained before hearing onset (P8–P11).
Presynaptic Ca2+ currents and exocytosis in calyceal terminals from CaV1.3−/− mice
Immature calyces of Held express a mixture of ω-agatoxin IVA-sensitive P/Q-type and ω-conotoxin GVIA-sensitive N-type Ca2+ currents (ICa(V)). The latter component is developmentally downregulated such that from P13, ICa(V) is completely blocked by ω-agatoxin IVA (Iwasaki et al., 2000). Consistent with the lack of pharmacological evidence for the expression of presynaptic L-type Ca2+ channels, we found that neither amplitudes nor kinetic properties were different between ICa(V) recorded in P14–P17 terminals of CaV1.3−/− mice and that of wt mice (Fig. 1A). When measured during 10 ms depolarizations, peak amplitudes of ICa(V) varied between 0.81 nA and 2.05 nA among different terminals (for average amplitudes, see Table 1). ICa(V) started to activate at a membrane potential of approximately −30 mV. Its current–voltage relationship was indistinguishable between CaV1.3−/− and wt mice (Fig. 1B) and was similar to that described for P8–P10 rat calyces (Borst and Sakmann, 1998a).
Figure 1.

Similar properties of voltage-gated Ca2+ currents in calyceal terminals of wt and CaV1.3 subunit-deficient mice. A, Presynaptic ICa(V) recorded in calyx of Held terminals of wt (black) and CaV1.3−/− (red) mice. Calyx terminals were identified by a change in Cm in response to short depolarizations indicating intact vesicle exocytosis. Terminals were voltage-clamped (Vh = −80 mV) and depolarized to 0 mV for 10 ms. Capacitive transients were subtracted on-line using a P/5 protocol. Small transients remaining after on-line subtraction are blanked for clarity. B, Current–voltage relationship of presynaptic ICa(V) in calyx of Held terminals of wt (black) and CaV1.3−/− (red) mice. Peak ICa(V) was measured during depolarizations (10 ms) from Vh to −40 … +40 mV. Average amplitudes of ICa(V) and its voltage dependence were virtually indistinguishable, suggesting absence of the CaV1.3 subunit from calyces terminals. C, Facilitation of ICa(V) during trains of AP-like depolarizations. C1, ICa(V) trains of 15 step depolarizations (1 ms, 0 mV, 200 Hz) recorded in terminals of wt (black) and CaV1.3−/− (red) mice (left). For comparison, first and last ICa(V) are shown superimposed (right). C2, Average time course and amplitude of facilitation were similar in wt (black) and CaV1.3−/− (red) mice. Error bars represent SEM in this and subsequent figures.
Table 1.
Functional properties of synaptic transmission in P14–P17 calyx of Held synapses of CaV1.3−/−compared with those of wt mice
| Parameter | wt | CaV1.3−/− | Significance level |
|---|---|---|---|
| Calyceal ICa(V) | |||
| Amplitude (0 mV) (nA) | 1.20 ± 0.14 (9) | 1.23 ± 0.08 (11) | n.s. |
| Facilitation (200 Hz) | |||
| Amplitude (%) | 42.0 ± 6.2 (8) | 33.0 ± 5.7 (9) | n.s. |
| τfacilitation (ms) | 9.7 ± 1.1 (8) | 9.8 ± 2.0 (9) | n.s. |
| Calyceal AP | |||
| Half-width (μs) | 193.4 ± 8.9 (14) | 222.1 ± 8.4 (16) | p < 0.05 |
| Amplitude (mV) | 139.4 ± 1.9 (14) | 139.3 ± 3.0 (16) | n.s. |
| EPSCAMPA | |||
| Amplitude (nA)a | 10.7 ± 0.65 (75) | 16.70 ± 0.82 (86) | p < 0.001 |
| CV | 0.077 ± 0.004 | 0.059 ± 0.005 | p < 0.01 |
| Rise time (20–80%) (ms)b | 0.146 ± 0.003 (33) | 0.152 ± 0.004 (33) | n.s. |
| Decayb | |||
| τfast (ms) | 0.35 ± 0.01 (30) | 0.39 ± 0.02 (33) | p < 0.05 |
| τslow (ms) | 3.29 ± 0.36 (30) | 2.37 ± 0.18 (33) | p < 0.05 |
| afast (%)c | 95.9 ± 0.3 (30) | 89.2 ± 0.8 (33) | p < 0.001 |
| Weighted τm (ms)d | 0.46 ± 0.03 (30) | 0.57 ± 0.03 (33) | p < 0.05 |
| Recovery time constant (s)e | 5.9 ± 0.8 (8) | 3.4 ± 0.5 (10) | p < 0.05 |
| mEPSC | |||
| Frequency (s−1) | 10 ± 2 (25) | 12 ± 1 (37) | n.s. |
| Amplitude (pA) | 47.1 ± 2.6 (25) | 46.2 ± 2.4 (37) | n.s. |
| Rise time (20–80%) (μs) | 92.9 ± 2.9 (25) | 87.2 ± 1.6 (37) | n.s. |
| Decay time constant (ms) | |||
| τfast | 0.27 ± 0.01 (25) | 0.25 ± 0.01 (37) | n.s. |
| τslow | 1.38 ± 0.13 (25) | 1.14 ± 0.06 (37) | n.s. |
| afast (%)c | 86.6 ± 1.5 (25) | 84.4 ± 0.9 (37) | n.s. |
| weighted τm (ms)d | 0.40 ± 0.03 (25) | 0.38 ± 0.01 (37) | n.s. |
| Quantal parameters | |||
| Ff | 0.31 ± 0.03 (30) | 0.49 ± 0.03 (42) | p < 0.001 |
| RRPf | 1456 ± 129 (30) | 1595 ± 227 (42) | n.s. |
| EPSCNMDA | |||
| Amplitude (nA)g | 1.62 ± 0.21 (76) | 4.15 ± 0.45 (63) | p < 0.001 |
| Decay time constant (ms)g | 50.5 ± 1.7 (74) | 60.7 ± 2.3 (60) | p < 0.001 |
| EPSCNMDA/EPSCAMPAh | 0.12 ± 0.01 (55) | 0.23 ± 0.02 (58) | p < 0.001 |
| Ifenprodil block (%) | 17.2 ± 3.5 (14) | 38.2 ± 3.7 (7) | p < 0.01 |
Number of synapses tested is given in parentheses. n.s., Not significant.
aMeasured at Vh = −40 mV.
bMeasured at Vh = −70 mV.
cRelative amplitude of the fast decay component.
dWeighted mean decay time constant τm = afast × τfast + aslow × τslow, where afast and aslow are the relative amplitudes of the fast and slow decay components, respectively.
eTime course of recovery from depression was estimated using conditioning 100 Hz trains.
fEstimated from synaptic depression during 100 Hz trains (Taschenberger et al., 2002).
gMeasured at Vh = +40 mV.
hEPSCNMDA and EPSCAMPA were measured at Vh = +40 mV and Vh = −40 mV, respectively.
A characteristic signature of calyceal ICa(V) is its frequency-dependent facilitation when elicited repetitively using short action-potential-like depolarizations (Borst and Sakmann, 1998b; Cuttle et al., 1998). This facilitation is mainly supported by calcium channels of the P/Q-type because it is absent from CaV2.1-subunit-deficient mice (Inchauspe et al., 2004; Ishikawa et al., 2005). To exclude changes in the fractions of N- and P/Q-type Ca2+ channels contributing to presynaptic ICa(V) in wt and CaV1.3−/− mice, we measured activity-dependent facilitation of ICa(V) using 200 Hz trains of 1 ms step depolarizations (0 mV). As illustrated in Figure 1C, amplitudes of ICa(V) facilitated during the first five to seven depolarizations and remained stable thereafter. Neither time course nor magnitude of ICa(V) facilitation were significantly different between CaV1.3−/− and wt mice. Average values of ICa(V) facilitation during 200 Hz trains are given in Table 1.
Having established similar properties of ICa(V), we next compared amplitudes of exocytotic responses and their Ca2+ dependence using presynaptic membrane capacitance measurements. To convert ΔCm values into vesicle numbers, we assumed a single vesicle capacitance of 80 aF (Taschenberger et al., 2002). Figure 2A illustrates changes in Cm, membrane resistance (ΔRm), and series resistance (ΔRs) evoked by short depolarizations (0 mV) of 5–33 ms duration in two representative terminals. We restricted our analysis to step depolarizations of ≤33 ms duration to prevent slowly decaying inward currents after ICa(V), which were frequently associated with longer lasting depolarizations and complicated ΔCm estimates. To ascertain that the measured ΔCm reflects vesicle exocytosis after presynaptic Ca2+ influx, we measured ICa(V) and the corresponding ΔCm as a function of membrane potential (Vm) in a subset of calyces. Figure 2B shows that ICa(V) and ΔCm exhibited similar voltage dependence. Both peaked at Vm −10 to 0 mV. ΔCm declined at Vm >0 mV as a result of smaller ICa(V) because of the reduced driving force regardless of a fully activated Ca2+ conductance.
Figure 2.

Similar kinetics and Ca2+ dependence of exocytosis in calyceal terminals of wt and CaV1.3−/− mice. A, Presynaptic ICa(V) recorded during depolarizations of 5, 17, and 33 ms duration from Vh = −80 mV to 0 mV (left) and corresponding changes in membrane capacitance (Cm, top traces), membrane resistance (Rm, middle traces), and series resistance (Rs, bottom traces) (right). ΔCm was estimated from averaged Cm values measured during a 50 ms time window ≥190 ms after the end of depolarizations. B, Average ICa(V) (B2) and corresponding average ΔCm values (B1) plotted against Vm for step depolarizations of 10 ms duration obtained from wt (black) and CaV1.3−/− (red) mice. Note the similar voltage dependence of ICa(V) and ΔCm. C, Average ΔCm values plotted against measured Ca2+ charge (QCa) during presynaptic depolarizations of variable duration (1, 2, 3, 5, 9, 17, and 33 ms). Pooled data from wt (black) and CaV1.3−/− (red) calyces (P14–P17). Dotted lines represent extrapolations using the first ΔCm/QCa ratio obtained with an AP-like depolarization (1 ms, 0 mV). For longer stimuli, ΔCm/QCa decreases, presumably because of vesicle depletion.
Figure 2C shows the relationship between ΔCm and presynaptic Ca2+ influx (QCa) obtained by pooling data from P14–P17 terminals of CaV1.3−/− (n = 10) and wt (n = 9) mice. In both groups, ΔCm increased similarly with larger QCa. For short AP-like depolarizations (1 ms, 0 mV), we obtained ΔCm values of 23.3 ± 5.6 fF (291 ± 70 vesicles) and 25.5 ± 4.9 fF (319 ± 61 vesicles) for wt and CaV1.3−/− mice, respectively. The corresponding ΔCm/QCa ratios were 37 fF/pC and 31 fF/pC for wt and CaV1.3−/− mice, respectively (Fig. 2B, dotted lines), which is close to values reported for P12–P14 rats (46 fF/pC) (Taschenberger et al., 2002). For longer depolarizations, ΔCm values started to saturate presumably because of vesicle depletion. For the longest step depolarizations, we measured similar ΔCm values of 261 ± 56 fF (3269 ± 706 vesicles) and 199 ± 47 fF (2488 ± 589 vesicles) in terminals of wt and CaV1.3−/− mice, respectively.
Presynaptic AP waveform in CaV1.3−/− mice
Together, the experiments described above suggest that a given presynaptic AP waveform elicits a similar presynaptic Ca2+ influx and releases a similar number of vesicles in terminals from wt and CaV1.3−/− mice. However, the time course of calyceal APs changes during development (Taschenberger and von Gersdorff, 2000). Because the AP waveform is a powerful regulator of presynaptic Ca2+ influx and thereby of release probability (Borst and Sakmann, 1999), it was important to test whether calyceal APs of CaV1.3−/− mice would differ from those recorded in wt terminals. When measured between P14 and P17, the half-width of presynaptic APs ranged from ∼140 to ∼300 μs (Fig. 3A1), which is significantly shorter compared with younger calyces (Fig. 3A2). In terminals of CaV1.3−/− mice, APs tended to be broader (p < 0.05) (Fig. 3A1, Table 1). Because the Ca2+ influx evoked by a single, mature (P14–P17) calyceal AP is difficult to quantify using single-electrode voltage clamp (Borst and Sakmann, 1998a), we adopted an HH-type model of ICa(V) derived by Borst and Sakmann (1998a) to elucidate the impact of variable AP duration on AP-evoked release. The model was driven by the wt AP waveform shown in Figure 3A with its time course slightly compressed or expanded such that the AP half-width ranged from 120 to 300 μs (Fig. 3B1). The time course of the activation parameter m2 was then solved numerically (Fig. 3B2), which allowed us to predict presynaptic ICa(V) (Fig. 3B3) associated with the various AP waveforms. Figure 3C illustrates that QCa depended roughly linearly on AP half-width. To obtain a relationship between AP half-width and relative eEPSC size, we normalized QCa to the value obtained with an AP having about average half-width (200 μs) and assumed EPSC ∝ QCa3. Raising QCa to the third power takes into account a presumably less steep Ca2+ dependence of release in more mature terminals (Fedchyshyn and Wang, 2005) compared with immature ones (Bollmann et al., 2000; Schneggenburger and Neher, 2000). When the measured AP half-width values were plotted along this function (Fig. 3C), the average eEPSC amplitudes were ∼67% larger in CaV1.3−/− compared with wt mice.
Figure 3.

Wider action potentials in calyceal terminals of CaV1.3−/− mice. A1, Whole-cell current-clamp recordings of APs evoked by afferent fiber stimulation in calyces of wt (black) and CaV1.3−/− (red) mice. Both recordings were obtained after hearing onset. Resting membrane potential (Vr) was typically approximately −80 mV. Stimulus artifacts blanked for clarity. Note the similar amplitude but slower kinetics and longer duration of the calyceal AP in the CaV1.3−/− mouse. A2, Comparison of the presynaptic APs shown in A1 to an immature AP waveform (wt P8). B, The wt AP shown in A1 was used to drive an HH-type model (Borst and Sakmann, 1998a) to estimate presynaptic Ca2+ influx. To simulate variable AP duration, APs were expanded or compressed in time (B1). The time course of the activation parameter m2 was then solved numerically (B2), and the corresponding ICa(V) was calculated (B3). Peak m2 values ranged from 0.36 to 0.84, yielding QCa of 0.13–0.55 pC. C, Dependence of simulated QCa (left axis, dotted line) and relative EPSC size (right axis, solid line) on AP half-width. For half-width values ranging from 120 to 300 μs, the simulations predicted a nearly linear dependence of QCa on AP width. Relative EPSC size was estimated by normalizing QCa to the value obtained with a wt AP of average half-with (200 μs) and raising this quantity to the third power. Measured values of AP half-width (solid symbols) were plotted along this function to illustrate the highly nonlinear dependence of EPSC size on AP width. The simulations predicted a 1.67-fold larger average eEPSC size (open symbols) for CaV1.3−/− mice (C, right axis).
Enhanced synaptic strength in CaV1.3−/− mice
Our modeling-based estimates for AP-induced presynaptic Ca2+ influx led us to predict an enhanced release from calyces of CaV1.3−/− compared with wt mice. We measured synaptic strength by recording AMPA eEPSCs (EPSCAMPA) to test this prediction. Figure 4A shows AP-evoked EPSCs from synapses of wt and CaV1.3−/− mice before and after hearing onset. From P8–P11 to P14–P17, the average weighted decay time constants τm decreased similarly in wt mice (from 1.50 ± 0.21 to 0.46 ± 0.03 ms) and in CaV1.3−/− mice (from 1.33 ± 0.30 to 0.57 ± 0.03 ms) (Fig. 4C), and amplitudes of EPSCAMPA increased (Futai et al., 2001; Joshi and Wang, 2002) (Fig. 4B). At P14–P17, τm was significantly larger in CaV1.3−/− mice because of an increased contribution of τslow to the EPSC decay (Table 1). The observed increase in EPSCAMPA was much stronger in Cav1.3−/− synapses developing in the absence of cochlea-driven afferent nerve activity (Fig. 4B). At P14–P17, their average amplitudes were ∼1.6 times larger in CaV1.3−/− compared with wt mice (p < 0.001) (Table 1). To discriminate between a presynaptic or postsynaptic locus of the enhanced transmission, we analyzed the variability of AMPA eEPSC amplitudes. For a binomial model of release, the coefficient of variation (CV) depends exclusively on the presynaptic parameters p and N (Christensen and Martin, 1970):
 |
Raising quantal content (M = N·p) by increasing N, p, or both is thus expected to lower CV. In contrast, if enhanced AMPA transmission in CaV1.3−/− mice were attributable purely to an increased quantal size (q), CV would remain constant. The significantly smaller CV in synapses of CaV1.3−/− mice (Table 1) suggests that higher quantal content contributed to the enhanced AMPA transmission. To calculate M, we estimated q from average amplitudes of spontaneously occurring mEPSCs at the respective age (Table 1). We observed similar developmental changes in mEPSC amplitudes and their decay kinetics in wt and CaV1.3−/− mice (supplemental Fig. 2, available at www.jneurosci.org as supplemental material). Amplitudes of mEPSCs increased from P8–P11 to P14–P17 from 32 ± 1 pA (n = 8) to 47 ± 3 pA (n = 25) and from 36 ± 2 pA (n = 8) to 46 ± 2 pA (n = 37) in wt and CaV1.3−/− mice, respectively. At the same time, their weighted decay time constants τm decreased from 437 ± 49 μs to 399 ± 30 μs and from 497 ± 51 μs to 377 ± 14 μs for wt and CaV1.3−/− mice, respectively. Because the average mEPSC amplitudes were thus comparable for both groups, we estimated a 1.7 times larger average quantal content for eEPSCs in synapses of CaV1.3−/− P14–P17 mice (431 ± 26 quanta [n = 75] vs 733 ± 36 quanta [n = 86], for wt vs CaV1.3−/− mice, respectively; p < 0.001).
Figure 4.
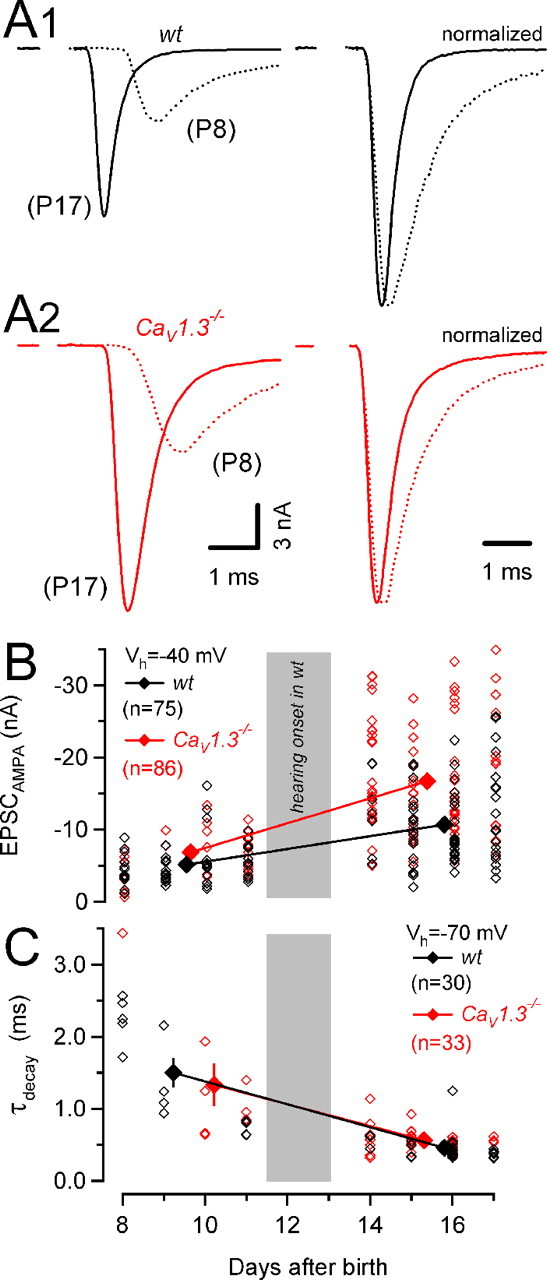
Larger AMPA eEPSC peak amplitudes in synapses of CaV1.3−/− mice. A, Representative AMPA receptor-mediated eEPSCs evoked by afferent fiber stimulation in synapses of wt (A1, left) and CaV1.3−/− (A2, left) mice (Vh = −40 mV). The right panel shows the same traces after normalizing their amplitudes. eEPSCs were aligned at their onsets to facilitate comparison of rise and decay kinetics. Kinetic properties of eEPSC in synapses of wt and those of CaV1.3−/− mice were similar. B, Scatter plot of AMPA EPSC peak amplitudes versus age. EPSC peak amplitudes varied over a widespread range at any developmental stage. However, the largest EPSCs were consistently recorded in synapses from CaV1.3−/− mice. At P14–P17, AMPA EPSCs from CaV1.3−/− mice (red) were on average 56% larger than those recorded in wt mice (black). C, Scatter plot of the weighted decay time constants of AMPA EPSCs. Developmental acceleration of AMPA EPSC kinetics proceeded similarly in wt and CaV1.3−/− mice.
Because the time course of AP-evoked glutamate release speeds up about twofold at the developing rat calyx of Held synapse (Taschenberger et al., 2005), we next analyzed the release time course in P14–P17 mouse synapses (Fig. 5A). Deconvolution of AMPA eEPSCs with average single vesicle responses (mEPSCs) obtained from the same synapses was performed in the frequency domain using FFT routines (Van der Kloot, 1988). This analysis implies that for single eEPSCs, any current component activated by glutamate spillover is negligible at this age. With an average half-width of only 259 ± 11 μs (n = 17) and 255 ± 12 μs (n = 17) for wt and CaV1.3−/− synapses (Fig. 5A3), respectively, the release transient was ∼40% briefer compared with P8–P10 (Bollmann et al., 2000; Schneggenburger and Neher, 2000) and ∼20% briefer compared with P12–P14 (Taschenberger et al., 2005) rat calyces. Although the rise and initial decay of the release transient were virtually indistinguishable between wt and CaV1.3−/− mice, an additional late and more slowly decaying component was detectable in the latter. This slow release component is consistent with the slightly slower decay of EPSCAMPA in CaV1.3−/− mice (Table 1) and may reflect late release caused by the broader calyceal APs (Fig. 3A). Alternatively, it may represent glutamate spillover caused by the higher average quantal content of eEPSCs in synapses of CaV1.3−/− mice (see below).
Figure 5.
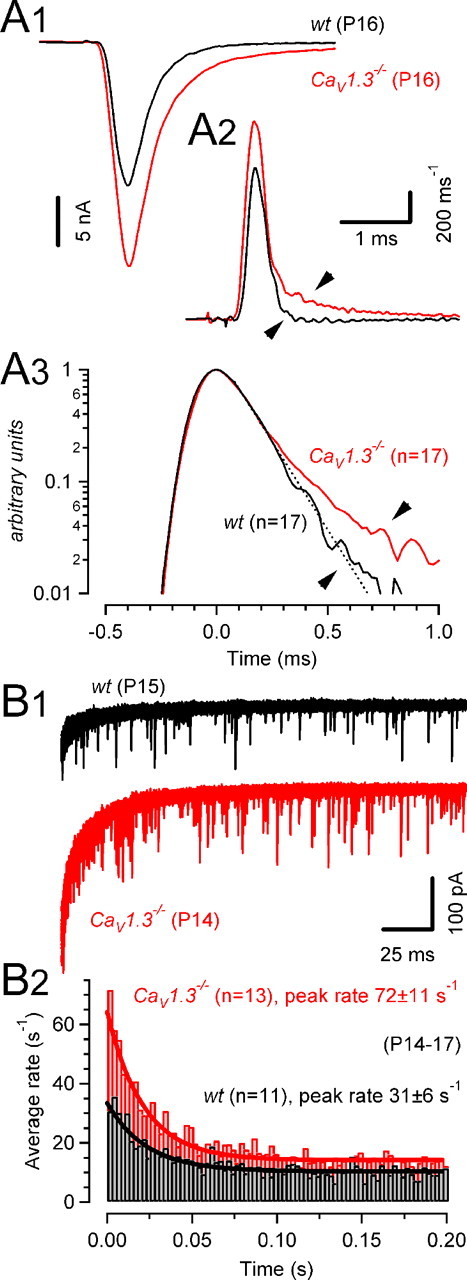
Time course of phasic and asynchronous release. A, Release time course (A2) during EPSCs evoked by afferent-fiber stimulation was estimated by deconvolving AMPA eEPSCs (A1) with mEPSC waveforms obtained from the same synapse. Illustrated are two representative recordings in a wt (P16, black) and a CaV1.3−/− (P16, red) mouse. A3, Average release functions obtained from wt (black) and CaV1.3−/− (red) mice plotted on a semi-logarithmic scale. Peak amplitudes of the release function were normalized and aligned at t = 0 ms before averaging. Except for a deviation during the late phase (indicated by the arrow-heads in A2 and A3), the kinetics of AP-evoked release in CaV1.3−/− mice was similar to that in P14–P17 wt mice. The dotted line represents exponential fit with a decay time constant of τ = 138 μs. B1, Asynchronous release after conditioning trains of 10 EPSCs (100 Hz) in a P15 wt (black) and a P14 CaV1.3−/− (red) mouse (30 consecutive sweeps superimposed). B2, Summary data from wt (black) and CaV1.3−/− (red) mice. Immediately after the conditioning trains, asynchronous release was transiently elevated. Peak release rates were on average more than twofold higher in CaV1.3−/− mice (p < 0.005). Solid lines represent exponential fits with decay time constants of 23 ms (wt) and 21 ms (CaV1.3−/−).
As described above, we estimated the Ca2+ influx during single calyceal APs of CaV1.3−/− mice to be slightly larger compared with wt mice. During AP trains, such elevated QCa may accumulate and, assuming similar Ca2+ buffering and extrusion kinetics in wt and CaV1.3−/− mice, result in higher residual Ca2+ levels in the latter. Asynchronous release driven by such temporarily elevated Ca2+ after high-frequency stimulation may therefore differ between wt and CaV1.3−/− synapses. To evaluate this possibility, we quantified the rates of asynchronously released quanta after 100 Hz trains consisting of 10 EPSCs (Fig. 5B). Asynchronous release events after such trains were superimposed on a slowly decaying postsynaptic current component (Fig. 5B1). The time course of this current could be fitted by a double-exponential function with a fast time constant (wt, 5 ± 0.3 ms; CaV1.3−/−, 4 ± 0.2 ms) probably related to τslow of the AMPA EPSC decay and a slow time constant (wt, 49 ± 3 ms; CaV1.3−/−, 52 ± 8 ms), presumably reflecting the clearance of residual glutamate (Taschenberger et al., 2005) and/or deactivation of a small NMDA EPSC component. The frequency of spontaneously occurring mEPSCs was comparable between synapses of wt and those of CaV1.3−/− mice (Table 1) but slightly higher than that previously reported for P12–P14 rats (2.8 s−1) (Taschenberger et al., 2005). Asynchronous release after trains increased approximately threefold over the rate of spontaneous release in wt mice (Fig. 5B, black traces). In contrast, in synapses of CaV1.3−/− mice, asynchronous release increased transiently approximately sixfold over the rate of spontaneous mEPSCs (p < 0.01) (Fig. 5B, red traces) before quickly returning to the resting rate [decay time constant τdecay = 29 ± 4 ms and 26 ± 5 ms for wt (n = 9) and CaV1.3−/− (n = 12), respectively]. For comparison, we quantified asynchronous release in wt synapses after application of a very low concentration of TEA (150 μm). Under these conditions, AMPA EPSC peak amplitudes increased by 96 ± 19%, and peak rates of asynchronous release after 100 Hz trains amounted to 58 ± 16 s−1 (n = 4; data not shown). This rate is nearly two times higher than that measured under control conditions in wt synapses and close to the peak rates measured in CaV1.3−/− synapses (Fig. 5B).
Elevated release probability in calyx of Held synapses of CaV1.3−/− mice
Higher quantal content observed for AP-evoked EPSCs in CaV1.3−/− synapses may be caused by an increased fraction (F) of readily releasable quanta consumed by a single AP and/or a larger total number of vesicles available for release [readily releasable pool (RRP)]. However, presynaptic capacitance recordings yielded no evidence in favor of an increased RRP, whereas the slightly broader AP waveform in CaV1.3−/− mice is consistent with an increased F (Fig. 3). We therefore sought to compare F between P14–P17 synapses of wt and CaV1.3−/− mice. Changes in F often correlate with changes in paired pulse ratio (PPR = EPSC2/EPSC1) (Debanne et al., 1996; Dobrunz and Stevens, 1997; Oleskevich et al., 2000). For interstimulus intervals (ISIs) of 10 ms, we found a strong correlation between the size of EPSC1 and PPR among synapses from wt and from CaV1.3−/− mice (Fig. 6A3). PPRs were significantly lower in CaV1.3−/− synapses over a broad range of ISIs (100–3.3 ms), indicative of higher F in CaV1.3−/− mice. In wt synapses, PPRs increased slightly from 0.74 to 0.90 with decreasing ISI. In contrast, PPRs declined for shorter ISIs in CaV1.3−/− synapses (from 0.62 to 0.48) (Fig. 6A3).
Figure 6.
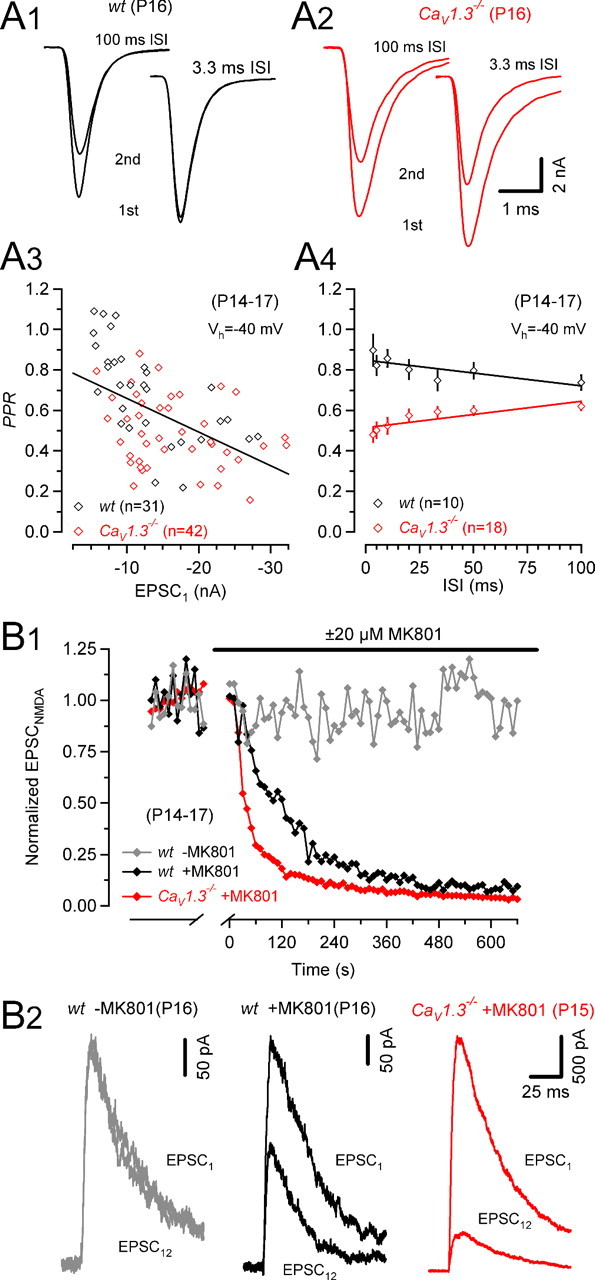
Higher probability of release in CaV1.3−/− mice. A, Paired-pulse ratios for various ISIs of P14–P17 synapses of wt (black) and CaV1.3−/− (red) mice. Representative recordings from a P16 wt (A1) and P16 CaV1.3−/− (A2) mouse. A3, Scatter plot of PPRs versus EPSC1 amplitudes (10 ms ISI) for wt (red) and CaV1.3−/− mice illustrating correlation between initial EPSC size and measured paired-pulse depression (r = 0.514; p < 0.001). A4, PPRs were generally smaller in CaV1.3−/− mice indicative of a higher release probability. With decreasing ISIs, PPRs increased in wt mice (r = −0.772; p = 0.04) presumably because of a facilitation of EPSC2. In CaV1.3−/− mice, PPRs decreased for shorter ISIs (r = 0.834; p = 0.02) possibly because AMPAR desensitization contributed to the reduction of EPSC2. Linear regressions in A3 and A4 are represented by the solid lines. B, Blocking time course of NMDA EPSCs by MK801 (20 μm). B1, NMDA EPSCs recorded at Vh = +40 mV (interstimulus interval 10 s) in the presence of 2 μm NBQX. After recording control EPSCs for 3 min, stimulation was stopped, and perfusion was switched to MK801 containing bath solution. MK801 was allowed to equilibrate in the recording chamber for 2 min before resuming fiber stimulation. The blocking time course was faster in the P16 CaV1.3−/− (red) compared with the P16 wt (black) mouse. For comparison, the time course of NMDA EPSC amplitudes was recorded in a P16 wt synapse in the absence of MK801 (gray). B2, First and 12th NMDA EPSCs recorded after resuming stimulation superimposed for comparison. Note the more complete block in the synapse from a CaV1.3−/− (red) compared with the wt (red) mouse.
Assuming that the measured paired-pulse depression resulted purely from vesicle depletion and neglecting other contributions that may affect PPR such as presynaptic facilitation and postsynaptic receptor desensitization, we can approximate F according to
 |
where Δt represents the interstimulus interval and τ the time constant of recovery from vesicle depletion. Analyzing the PPRs obtained using ISIs of 100–50 ms for which the contribution of postsynaptic receptor desensitization is expected to be small at this age (Taschenberger et al., 2005) and synaptic facilitation has decayed to a minimum, we obtained F = 0.26–0.20 and F = 0.38–0.42 for wt (n = 11) and CaV1.3−/− (n = 27) synapses, respectively. A similar analysis performed in P8–P11 synapses yielded larger F estimates (0.44–0.46 and 0.47–0.55 for wt [n = 12] and CaV1.3−/− [n = 7] synapses, respectively) consistent with a developmental decrease in release probability as reported for the rat (Iwasaki and Takahashi, 2001; Taschenberger et al., 2002). We emphasize that these F values represent upper limits if AMPAR desensitization contributed to the relative reduction of EPSC2 especially in CaV1.3−/− mice in which M was high. Vesicle recruitment during the 50–100 ms ISI is negligible because recovery after synaptic depression induced by conditioning 100 Hz trains is slow throughout development (≥3.5 s). At P14–P17, the vesicle recruitment after conditioning 100 trains was, however, significantly (p < 0.05) faster in CaV1.3−/− compared with wt mice (supplemental Fig. 3, available at www.jneurosci.org as supplemental material) (P8–P11, 3.9 ± 0.3 s and 3.5 ± 0.4 s; P14–P17, 5.9 ± 0.8 s and 3.4 ± 0.5 s for wt and CaV1.3−/− mice, respectively).
Increased release probability may be associated with a faster progressive block of EPSCNMDA by the use-dependent NMDAR antagonist (+)-5-methyl-10,11-dihydro-5H-dibenzo [a,d] cyclohepten-5,10-imine maleate (MK801) (Hessler et al., 1993; Rosenmund et al., 1993). To corroborate a hypothesized higher release probability in CaV1.3−/− mice, we therefore measured the blocking rate of NMDA EPSCs at Vh = 40 mV and in the presence of 2 μm NBQX to completely abolish AMPA currents (Fig. 6B). After acquiring control NMDA EPSCs, stimulation was stopped, and 20 μm MK801 was added to the bath. Stimulation was resumed 2 min later. During 0.1 Hz stimulation, EPSCNMDA declined exponentially in the presence of MK801 with an average time constant of 139 ± 8 s in wt synapses and 94 ± 13 s in CaV1.3−/− synapses (p < 0.05, Fig. 6B1). Representative examples of NMDA EPSCs recorded in control Ringer and after eliciting 12 presynaptic APs in MK801 containing bath solution are shown in Figure 6B2. The stimulation protocol did not induce significant “run-up” or “run-down” of NMDA EPSCs because in the absence of MK801, NMDA EPSC amplitudes were on average 101 ± 7% of control immediately after resuming stimulation and 97 ± 10% of control at the end of the experiments (n = 9). Together with the lower PPRs, the faster blocking of NMDA EPSCs in CaV1.3−/− synapses lends therefore additional support to the previous notion of an elevated release probability in CaV1.3−/− mice.
Mature calyx of Held synapses can reliably operate at frequencies of several hundreds of hertz (Wu and Kelly, 1993). A developmental reduction of F (Iwasaki and Takahashi, 2001; Taschenberger et al., 2002) seems to be beneficial to achieve such high transmission rates. When measuring eEPSC trains elicited by high-frequency stimulation (Fig. 7), we noticed significantly stronger synaptic depression in CaV1.3−/− synapses. In addition, in wt, but never in CaV1.3−/− synapses, synaptic depression was frequently converted to facilitation of the initial eEPSCs for stimulus frequencies of 100 Hz and above (100 Hz, 4 of 30 synapses; 300 Hz, 4 of 9 synapses) (Fig. 7, compare A2 and B2). Average results for 7–10 wt and 8–12 CaV1.3−/− synapses are illustrated in Figure 7C. Both stimulation frequencies (30 and 300 Hz) resulted in significantly stronger synaptic depression in synapses that developed in the absence of cochlea-driven afferent nerve activity. Steady-state amplitudes (EPSCSS) obtained from the average of the last three EPSCs during the trains are plotted versus stimulation frequency in Figure 7D. EPSCSS declined much steeper with increasing stimulation frequency in CaV1.3−/− compared with wt synapses. For stimulus frequencies ≤100 Hz, the contribution of AMPA receptor desensitization to synaptic depression was relatively minor because ensemble fluctuation analysis indicated only a small reduction of quantal size for EPSCSS [wt, 96 ± 8% of EPSC1 (n = 10) and CaV1.3−/−, 81 ± 8% of EPSC1 (n = 9)] (Taschenberger et al., 2005).
Figure 7.
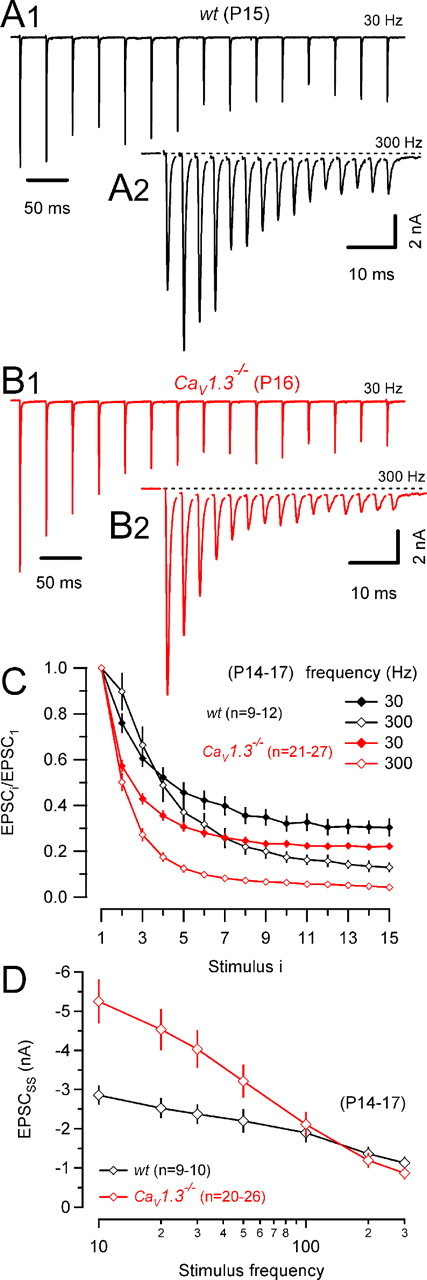
Stronger synaptic depression in CaV1.3−/− mice. A, B, Trains of 15 EPSCs evoked by afferent-fiber stimulation in a wt (A) and a CaV1.3−/− (B) mouse using stimulus frequencies of 30 Hz (A1, B1) and 300 Hz (A2, B2). Dotted lines in A2 and B2 represent baseline current (0 pA) and are shown to indicate a sustained eEPSC component, which slowly developed during high-frequency trains and presumably reflects AMPAR and/or NMDAR activation by residual glutamate. C, Pooled data for wt (black) and CaV1.3−/− (red) mice. EPSC amplitudes were normalized to the peak amplitude of the initial eEPSCs. Note the stronger depression in CaV1.3−/− mice for both stimulus frequencies. D, Steady-state EPSC amplitudes versus stimulus frequency. Pooled data for wt (black) and CaV1.3−/− (red) mice. In CaV1.3−/− mice, EPSCss was almost twofold larger for low-frequency stimulation but declined more steeply with increasing frequency. EPSCss was estimated from the average amplitude of the last three EPSCs during the trains.
Delayed downregulation of synaptic NMDA receptors in CaV1.3−/− mice
During early postnatal development of the rat and mouse calyx of Held synapse, NMDA EPSC (EPSCNMDA) amplitudes decrease steeply (Taschenberger and von Gersdorff, 2000; Futai et al., 2001; Joshi and Wang, 2002). Because cochlear ablation retards this downregulation (Futai et al., 2001), the latter process is likely to be, at least in part, controlled by cochlea-driven nerve activity. We therefore compared the properties of EPSCNMDA recorded before and after the onset of hearing in synapses of wt mice with those recorded in CaV1.3−/− mice (Figs. 8, 9). Amplitudes of wt NMDA EPSCs decreased strongly from P8 to P17 [∼75% reduction, from 6.34 ± 0.44 nA (n = 52) to 1.62 ± 0.21 nA (n = 74)] (Fig. 8A,C) (Futai et al., 2001; Joshi and Wang, 2002), whereas in CaV1.3−/− mice, the downregulation of EPSCNMDA was less pronounced [∼25% reduction, from 5.52 ± 0.46 nA (n = 17) to 4.15 ± 0.44 nA (n = 63)]. To test whether enhanced release can fully account for the larger EPSCNMDA size in CaV1.3−/− mice, we measured EPSCNMDA/EPSCAMPA ratios in a subset of P14–P17 synapses. This ratio was significantly (p < 0.001) higher in CaV1.3−/− mice, suggesting differences in postsynaptic receptor expression (Fig. 8B, Table 1). An acceleration of the decay kinetics of NMDA EPSCs was seen in both groups during postnatal development from P8 to P17 (Fig. 8D). The decay of EPSCNMDA was ∼30% faster at P14–P17 (Table 1) compared with P8–P11 (wt, 72 ± 4 ms, n = 52; CaV1.3−/−, 85 ± 5 ms, n = 17).
Figure 8.

Delayed developmental decrease of NMDA EPSCs in CaV1.3−/− mice. A, EPSCs recorded at Vh = +40 mV in synapses of wt (A1, black) and CaV1.3−/− (A2, red) mice before (dotted lines) and after (solid lines) hearing onset. A3, Same traces after normalizing their AMPA EPSC peaks to compare NMDA/AMPA EPSC ratios. B, Average values of NMDA/AMPA EPSC ratios for P14–P17 synapses were significantly larger in CaV1.3−/− mice (red). EPSC amplitudes were measured at Vh = −40 mV (EPSCAMPA) and Vh = +40 mV (EPSCNMDA). C, Scatter plot of EPSCNMDA versus age. During development, NMDA EPSC peak amplitudes decreased strongly in synapses of wt (black) but only little in those of CaV1.3−/− mice (red). EPSCNMDA was measured >10 ms after the AMPA EPSC peak when the fast EPSC component had decayed to <1% of its peak. At P14–P17, average peak amplitudes of EPSCNMDA were more than three times larger in CaV1.3−/− (4.2 ± 0.45 nA) compared with wt synapses (1.6 ± 0.21 nA). D, Decay time constants of EPSCNMDA decreased similarly during development in wt and CaV1.3−/− mice.
Figure 9.

Persistent sensitivity of EPSCNMDA to the NR2B specific antagonist ifenprodil in synapses of CaV1.3−/− mice. A1, Inhibition by ifenprodil (10 μm) of NMDA EPSCs in wt synapses before (P8, open circles) and after (P15, filled circles) hearing onset. Individual traces recorded before and after drug application are shown superimposed in A2. Bath application of ifenprodil resulted in a robust decrease of NMDA EPSCs in P8–P11 synapses of wt mice. The fractional block was largely reduced at P14–P17. B1, Experiments similar to those illustrated in A in CaV1.3−/− mice (P9, open circles; P14, filled circles). Representative EPSCs are shown in B2. In synapses from CaV1.3−/− mice, the sensitivity to ifenprodil persisted throughout development, suggesting expression of a larger fraction of NR2B subunit-containing NMDARs even at P14–P17. In all experiments illustrated in A and B, the bath solution contained 2 μm NBQX to completely block EPSCAMPA and Vh was +40 mV.
In many central glutamatergic synapses, the relative loss of synaptic NMDARs correlates with changes in subunit expression (Williams et al., 1993; Monyer et al., 1994; Sheng et al., 1994; Shi et al., 1997; Liu et al., 2004). To test for such developmental regulation, we made use of the NR2B subtype-specific NMDA antagonist ifenprodil (Williams, 1993). Figure 9A illustrates that the component of the EPSCNMDA blocked by ifenprodil (10 μm) decreased during development in wt synapses [from 30.6 ± 2.2% (n = 18) to 17.2 ± 3.5% (n = 14) block, p < 0.01]. In CaV1.3−/− mice, the ifenprodil-sensitive component was indistinguishable from wt at P8–P11 (29.5 ± 9.0%; n = 4). In contrast to wt synapses, it was not reduced at P14–P17 but even showed a trend (p = 0.32) toward a small increase (38.2 ± 3.7%; n = 7) (Fig. 9B).
Together, these data suggest that afferent nerve activity promotes a preferential pruning of NR2B subunit-containing NMDARs from subsynaptic sites. This pruning process seems delayed in the absence of cochlea-driven afferent nerve activity. NR2A and NR2B subunits confer different kinetic properties to the NMDAR channel (Monyer et al., 1994; Takahashi et al., 1996). Indeed, we found that NMDA EPSCs decayed significantly slower in CaV1.3−/− synapses (Table 1). However, because of the similar acceleration of the NMDA EPSC decay kinetics from P8 to P17 seen in both wt (from 72 ± 4 ms to 50 ± 2 ms) as well as CaV1.3−/− (from 85 ± 5 ms to 61 ± 2 ms) mice (Fig. 8D), it is likely that the developmental speed-up of transmitter clearances at the calyx of Held (Taschenberger et al., 2005) contributed to the faster decay time constants measured at P14–P17.
Discussion
The principle aim of this study was to compare the in vivo maturation of a large glutamatergic CNS synapse, the calyx of Held, developing in the presence of normal (wt) or greatly reduced (CaV1.3−/−) levels of physiological afferent nerve activity. This allowed us to identify whether previously described developmental changes in the functional properties of this synapse arise from intrinsic maturation processes or whether they are driven by afferent nerve activity. We chose the CaV1.3−/− mouse model to address this question because (1) CaV1.3−/− mice are deaf because of an absence of L-type Ca2+ currents in cochlear IHCs (Platzer et al., 2000; Brandt et al., 2003). (2) On the light microscopy level, the morphology of IHCs and spiral ganglion cells is preserved at least up to P14, and no gross disturbances in vestibular function and structure were found up to P35 (Platzer et al., 2000; Dou et al., 2004). (3) Glutamate release at later synapses along the auditory pathways is triggered by N-, P/Q-, and R-type Ca2+ channels (Iwasaki et al., 2000; Oleskevich and Walmsley, 2002) and does not rely on expression of CaV1.3 (Fig. 2). Our analysis of presynaptic properties and synaptic transmission in CaV1.3−/− mice indicates similar properties of the exocytotic machinery but enhanced synaptic strength attributable to an elevated release probability and a delayed downregulation of synaptic NMDARs.
A straightforward approach to gain insight into the role of physiological nerve activity in regulating transmission at the calyx of Held synapses is to silence auditory nerve input by cochlear ablation (Futai et al., 2001). However, cochlear removal in young animals induces extensive axonal rewiring and a variety of transneuronal degenerative effects within the auditory brainstem (Hashisaki and Rubel, 1989; Russell and Moore, 1995; for review, see Rubel and Fritzsch, 2002). To overcome these problems, we used a different approach by making use of the fact that Ca2+ channels governing transmitter release in IHCs are distinct from those found at higher synapses. A possible caveat of the use of CaV1.3−/− mice could be that, in addition to controlling release in IHCs, CaV1.3 L-type channels expressed in cell bodies and dendrites of auditory neurons could exert important regulatory functions linked to synapse development and refinement. Indeed, L-type Ca2+ channels account for one-third of the somatic high-voltage-activated Ca2+ current in bushy cells of the rat anteroventral cochlear nucleus (Doughty et al., 1998), but the molecular identity of those channels is unknown.
We assumed that CaV1.3−/− calyx synapses develop in the presence of greatly reduced levels of afferent nerve activity and would thus serve as an excellent model system. Sound-evoked auditory brainstem responses are missing in CaV1.3−/− subunit-deficient mice (Platzer et al., 2000). However, some neurons of the ventral cochlear nucleus exhibit high spontaneous discharge rates even in the absence of sound (Friauf and Ostwald, 1988; Smith et al., 1991; Kopp-Scheinpflug et al., 2003). It is uncertain whether intact transmission at the IHC–spiral neuron synapse is required for spontaneous activity at the level of the VCN. Most of it appears to be cochlea driven, because almost all activity in the VCN disappears immediately after cochlear destruction (Koerber et al., 1966). Little is known about spontaneous activity in the rodent auditory pathway before hearing onset. At this age, cochlear IHCs spontaneously generate Ca2+ APs (Kros et al., 1998; Glowatzki and Fuchs, 2000), which trigger glutamate release (Beutner and Moser, 2001) and possibly APs in the auditory nerve. Because sound-evoked as well as spontaneous activity before hearing onset and possibly also thereafter rely on intact glutamate release from cochlear IHCs, it is reasonable to assume that levels and temporal pattern of nerve activity differ greatly between calyx of Held synapses of wt and CaV1.3−/− mice.
Developmental refinement of presynaptic properties in the absence of afferent nerve activity
Our data indicate that some developmental refinement of presynaptic properties occurs regardless of the presence or absence of cochlea-driven nerve activity. In P14–P17 terminals for example, calyceal APs in both wt and CaV1.3−/− mice were significantly faster than those recorded in younger mice (Fedchyshyn and Wang, 2005) and rats (Taschenberger and von Gersdorff, 2000). In developing rat calyces, the amplitude of ICa(V) increases and Ca2+ channels differ between immature and mature calyces regarding their subtypes (Iwasaki and Takahashi, 1998). A rearrangement of Ca2+ channels with respect to their spatial distribution relative to release sites is also likely (Fedchyshyn and Wang, 2005) because the efficiency of exocytosis (ΔCm/QCa) increases by a factor of ∼1.6 from P5 to P14 (Taschenberger et al., 2002). Evidence obtained from EM analysis as well as presynaptic Cm recordings and analysis of synaptic depression during high-frequency trains at various stages of development further suggest that the RRP increases in rat calyces of Held (Schneggenburger et al., 1999; Iwasaki and Takahashi, 2001; Satzler et al., 2002; Taschenberger et al., 2002). In the present study, Ca2+ currents in CaV1.3−/− calyces were indistinguishable from those in wt mice. Moreover, neither ΔCm/QCa ratios nor RRP size estimates based on amplitudes of capacitance jumps (Fig. 2) or eEPSC recordings (Table 1) were different between wt and CaV1.3−/− mice at P14–P17. Considering its extensive developmental refinement, it seems surprising that the presynaptic release machinery of the calyx terminal is rather robust and many functional properties are little affected by chronic changes of activity levels.
The level of afferent nerve activity regulates release probability
At the rat calyx of Held (Iwasaki and Takahashi, 2001; Taschenberger et al., 2002) and other central glutamatergic synapses (Bolshakov and Siegelbaum, 1995; Reyes and Sakmann, 1999; Brenowitz and Trussell, 2001), the release probability decreases during postnatal development (but see Oleskevich et al., 2004; Youssoufian et al., 2005). Using an approach applied previously to the neuromuscular junction (Elmqvist and Quastel, 1965; Christensen and Martin, 1970), we estimate that F drops from 0.56 to 0.31 in wt and from 0.72 to 0.49 in CaV1.3−/− mice (data not shown). These values are comparable with our estimates based on PPRs that also indicated a decreasing F. A relatively low F in P14–P17 calyx synapses is further suggested by presynaptic ΔCm recordings, which showed that single AP-like depolarizations released only a small fraction of the available vesicles (Fig. 2). Regardless of the method applied to determine F, we always estimated its value to be higher in CaV1.3−/− than in wt mice. Interestingly, this also holds for P8–P11 synapses, suggesting a possible role of cochlea-driven spontaneous nerve activity in regulating F.
An unexpected finding of this study was the slower presynaptic AP waveform in CaV1.3−/− mice. This difference may be linked to changes in K+ channels expression, which may be regulated by intracellular Ca2+ (Gan et al., 1996). Notably, the tonotopic organization of MNTB principal neurons with respect to their expression of voltage-gated K+ channels is disrupted in congenitally deaf mice (Leao et al., 2006). Furthermore, high-frequency acoustic stimulation can rapidly modulate the firing pattern of MNTB neurons by dephosporylating voltage-gated K+ channels (Song et al., 2005). Based on previous evidence obtained in rat calyces (Borst and Sakmann, 1998a, 1999; Taschenberger and von Gersdorff, 2000), our own modeling (Fig. 3), and because of the similar release efficiency (ΔCm/QCa), we consider it likely that the difference in presynaptic AP waveform between wt and CaV1.3−/− mice represents the main mechanism underlying the higher release probability in the latter. Augmented presynaptic Ca2+ influx is further suggested by the increased asynchronous release after trains (Fig. 5B) and the accelerated recovery from depression in CaV1.3−/− mice (Table 1), both properties are well known to be modulated by intraterminal Ca2+ concentration. Presynaptic mechanisms responsible for an upregulation of synaptic strength after synaptic disuse have been described for other glutamatergic synapses before. Unlike endbulb synapses of the mouse VCN, which showed increased release probability after chronic reduction in activity levels (Oleskevich and Walmsley, 2002), cultured glutamatergic hippocampal synapses responded with an upregulation of the RRP size to pharmacological silencing (Murthy et al., 2001).
Postsynaptic AMPA and NMDA receptors show different sensitivity to chronic changes in afferent nerve activity
The strengthening of AMPA transmission at calyx synapses developing in vivo in the absence of cochlea-driven nerve activity was mainly attributable to increased glutamate release. In contrast, in vitro silencing synaptic activity in cultured cortical networks with TTX or glutamate receptor antagonists resulted in larger quantal amplitudes (Turrigiano et al., 1998). At the calyx of Held, AMPA mEPSC amplitudes increased similarly during development in wt and CaV1.3−/− mice. Moreover, considering the similar developmental acceleration of mEPSC and eEPSC decay kinetics seen in wt and CaV1.3−/− mice and assuming that these changes reflect differences in AMPAR subunit composition, we may conclude that, at the calyx of Held, the developmental regulation of postsynaptic AMPAR expression is largely unaffected by the level of afferent nerve activity. Thus, different rules may apply for activity-dependent regulation of synaptic strength at different glutamatergic synapses (Burrone et al., 2002) and/or at different stages of development (Wierenga et al., 2006). In contrast, the downregulation and developmental switch in subunit expression for synaptic NMDARs seems to be at least partly activity dependent, because it is delayed in the absence of cochlea-driven nerve activity.
Footnotes
This work was supported by Deutsche Forschungsgemeinschaft Grant GRK 632/3 and Austrian Science Fund Grant P17159. We are grateful to E. Neher for continuous support. We thank T. Sakaba, N. Hosoi, and S. Young for valuable discussions and critically reading this manuscript and F. Würriehausen for expert advice on programming.
References
- Beutner D, Moser T. The presynaptic function of mouse cochlear inner hair cells during development of hearing. J Neurosci. 2001;21:4593–4599. doi: 10.1523/JNEUROSCI.21-13-04593.2001. [DOI] [PMC free article] [PubMed] [Google Scholar]
- Bollmann JH, Sakmann B, Borst JG. Calcium sensitivity of glutamate release in a calyx-type terminal. Science. 2000;289:953–957. doi: 10.1126/science.289.5481.953. [DOI] [PubMed] [Google Scholar]
- Bolshakov VY, Siegelbaum SA. Regulation of hippocampal transmitter release during development and long-term potentiation. Science. 1995;269:1730–1734. doi: 10.1126/science.7569903. [DOI] [PubMed] [Google Scholar]
- Borst JG, Sakmann B. Calcium current during a single action potential in a large presynaptic terminal of the rat brainstem. J Physiol. 1998a;506:143–157. doi: 10.1111/j.1469-7793.1998.143bx.x. [DOI] [PMC free article] [PubMed] [Google Scholar]
- Borst JG, Sakmann B. Facilitation of presynaptic calcium currents in the rat brainstem. J Physiol. 1998b;513:149–155. doi: 10.1111/j.1469-7793.1998.149by.x. [DOI] [PMC free article] [PubMed] [Google Scholar]
- Borst JG, Sakmann B. Effect of changes in action potential shape on calcium currents and transmitter release in a calyx-type synapse of the rat auditory brainstem. Philos Trans R Soc Lond B Biol Sci. 1999;354:347–355. doi: 10.1098/rstb.1999.0386. [DOI] [PMC free article] [PubMed] [Google Scholar]
- Brandt A, Striessnig J, Moser T. CaV1.3 channels are essential for development and presynaptic activity of cochlear inner hair cells. J Neurosci. 2003;23:10832–10840. doi: 10.1523/JNEUROSCI.23-34-10832.2003. [DOI] [PMC free article] [PubMed] [Google Scholar]
- Brenowitz S, Trussell LO. Maturation of synaptic transmission at end-bulb synapses of the cochlear nucleus. J Neurosci. 2001;21:9487–9498. doi: 10.1523/JNEUROSCI.21-23-09487.2001. [DOI] [PMC free article] [PubMed] [Google Scholar]
- Burrone J, O'Byrne M, Murthy VN. Multiple forms of synaptic plasticity triggered by selective suppression of activity in individual neurons. Nature. 2002;420:414–418. doi: 10.1038/nature01242. [DOI] [PubMed] [Google Scholar]
- Chattopadhyaya B, Di Cristo G, Higashiyama H, Knott GW, Kuhlman SJ, Welker E, Huang ZJ. Experience and activity-dependent maturation of perisomatic GABAergic innervation in primary visual cortex during a postnatal critical period. J Neurosci. 2004;24:9598–9611. doi: 10.1523/JNEUROSCI.1851-04.2004. [DOI] [PMC free article] [PubMed] [Google Scholar]
- Christensen BN, Martin AR. Estimates of probability of transmitter release at the mammalian neuromuscular junction. J Physiol (Lond) 1970;210:933–945. doi: 10.1113/jphysiol.1970.sp009250. [DOI] [PMC free article] [PubMed] [Google Scholar]
- Clem RL, Barth A. Pathway-specific trafficking of native AMPARs by in vivo experience. Neuron. 2006;49:663–670. doi: 10.1016/j.neuron.2006.01.019. [DOI] [PubMed] [Google Scholar]
- Cuttle MF, Tsujimoto T, Forsythe ID, Takahashi T. Facilitation of the presynaptic calcium current at an auditory synapse in rat brainstem. J Physiol. 1998;512:723–729. doi: 10.1111/j.1469-7793.1998.723bd.x. [DOI] [PMC free article] [PubMed] [Google Scholar]
- Debanne D, Guerineau NC, Gahwiler BH, Thompson SM. Paired-pulse facilitation and depression at unitary synapses in rat hippocampus: quantal fluctuation affects subsequent release. J Physiol. 1996;491:163–176. doi: 10.1113/jphysiol.1996.sp021204. [DOI] [PMC free article] [PubMed] [Google Scholar]
- Dobrunz LE, Stevens CF. Heterogeneity of release probability, facilitation, and depletion at central synapses. Neuron. 1997;18:995–1008. doi: 10.1016/s0896-6273(00)80338-4. [DOI] [PubMed] [Google Scholar]
- Dou H, Vazquez AE, Namkung Y, Chu H, Cardell EL, Nie L, Parson S, Shin HS, Yamoah EN. Null mutation of alpha1D Ca2+ channel gene results in deafness but no vestibular defect in mice. J Assoc Res Otolaryngol. 2004;5:215–226. doi: 10.1007/s10162-003-4020-3. [DOI] [PMC free article] [PubMed] [Google Scholar]
- Doughty JM, Barnes-Davies M, Rusznak Z, Harasztosi C, Forsythe ID. Contrasting Ca2+ channel subtypes at cell bodies and synaptic terminals of rat anterioventral cochlear bushy neurones. J Physiol. 1998;512:365–376. doi: 10.1111/j.1469-7793.1998.365be.x. [DOI] [PMC free article] [PubMed] [Google Scholar]
- Ehlers MD. Reinsertion or degradation of AMPA receptors determined by activity-dependent endocytic sorting. Neuron. 2000;28:511–525. doi: 10.1016/s0896-6273(00)00129-x. [DOI] [PubMed] [Google Scholar]
- Elmqvist D, Quastel DM. A quantitative study of end-plate potentials in isolated human muscle. J Physiol (Lond) 1965;178:505–529. doi: 10.1113/jphysiol.1965.sp007639. [DOI] [PMC free article] [PubMed] [Google Scholar]
- Fedchyshyn MJ, Wang LY. Developmental transformation of the release modality at the calyx of held synapse. J Neurosci. 2005;25:4131–4140. doi: 10.1523/JNEUROSCI.0350-05.2005. [DOI] [PMC free article] [PubMed] [Google Scholar]
- Friauf E, Ostwald J. Divergent projections of physiologically characterized rat ventral cochlear nucleus neurons as shown by intra-axonal injection of horseradish peroxidase. Exp Brain Res. 1988;73:263–284. doi: 10.1007/BF00248219. [DOI] [PubMed] [Google Scholar]
- Futai K, Okada M, Matsuyama K, Takahashi T. High-fidelity transmission acquired via a developmental decrease in NMDA receptor expression at an auditory synapse. J Neurosci. 2001;21:3342–3349. doi: 10.1523/JNEUROSCI.21-10-03342.2001. [DOI] [PMC free article] [PubMed] [Google Scholar]
- Gan L, Perney TM, Kaczmarek LK. Cloning and characterization of the promoter for a potassium channel expressed in high frequency firing neurons. J Biol Chem. 1996;271:5859–5865. doi: 10.1074/jbc.271.10.5859. [DOI] [PubMed] [Google Scholar]
- Glowatzki E, Fuchs PA. Cholinergic synaptic inhibition of inner hair cells in the neonatal mammalian cochlea. Science. 2000;288:2366–2368. doi: 10.1126/science.288.5475.2366. [DOI] [PubMed] [Google Scholar]
- Hashisaki GT, Rubel EW. Effects of unilateral cochlea removal on anteroventral cochlear nucleus neurons in developing gerbils. J Comp Neurol. 1989;283:465–473. doi: 10.1002/cne.902830402. [DOI] [PubMed] [Google Scholar]
- Hessler NA, Shirke AM, Malinow R. The probability of transmitter release at a mammalian central synapse. Nature. 1993;366:569–572. doi: 10.1038/366569a0. [DOI] [PubMed] [Google Scholar]
- Inchauspe CG, Martini FJ, Forsythe ID, Uchitel OD. Functional compensation of P/Q by N-type channels blocks short-term plasticity at the calyx of Held presynaptic terminal. J Neurosci. 2004;24:10379–10383. doi: 10.1523/JNEUROSCI.2104-04.2004. [DOI] [PMC free article] [PubMed] [Google Scholar]
- Ishikawa T, Kaneko M, Shin HS, Takahashi T. Presynaptic N-type and P/Q-type Ca2+ channels mediating synaptic transmission at the calyx of Held of mice. J Physiol (Lond) 2005;568:199–209. doi: 10.1113/jphysiol.2005.089912. [DOI] [PMC free article] [PubMed] [Google Scholar]
- Iwasaki S, Takahashi T. Developmental changes in calcium channel types mediating synaptic transmission in rat auditory brainstem. J Physiol. 1998;509:419–423. doi: 10.1111/j.1469-7793.1998.419bn.x. [DOI] [PMC free article] [PubMed] [Google Scholar]
- Iwasaki S, Takahashi T. Developmental regulation of transmitter release at the calyx of Held in rat auditory brainstem. J Physiol (Lond) 2001;534:861–871. doi: 10.1111/j.1469-7793.2001.00861.x. [DOI] [PMC free article] [PubMed] [Google Scholar]
- Iwasaki S, Momiyama A, Uchitel OD, Takahashi T. Developmental changes in calcium channel types mediating central synaptic transmission. J Neurosci. 2000;20:59–65. doi: 10.1523/JNEUROSCI.20-01-00059.2000. [DOI] [PMC free article] [PubMed] [Google Scholar]
- Joshi I, Wang LY. Developmental profiles of glutamate receptors and synaptic transmission at a single synapse in the mouse auditory brainstem. J Physiol (Lond) 2002;540:861–873. doi: 10.1113/jphysiol.2001.013506. [DOI] [PMC free article] [PubMed] [Google Scholar]
- Kikuchi K, Hilding D. The development of the organ of Corti in the mouse. Acta Otolaryngol. 1965;60:207–222. doi: 10.3109/00016486509127003. [DOI] [PubMed] [Google Scholar]
- Kirov SA, Harris KM. Dendrites are more spiny on mature hippocampal neurons when synapses are inactivated. Nat Neurosci. 1999;2:878–883. doi: 10.1038/13178. [DOI] [PubMed] [Google Scholar]
- Koerber KC, Pfeiffer RR, Warr WB, Kiang NY. Spontaneous spike discharges from single units in the cochlear nucleus after destruction of the cochlea. Exp Neurol. 1966;16:119–130. doi: 10.1016/0014-4886(66)90091-4. [DOI] [PubMed] [Google Scholar]
- Kopp-Scheinpflug C, Fuchs K, Lippe WR, Tempel BL, Rubsamen R. Decreased temporal precision of auditory signaling in Kcna1-null mice: an electrophysiological study in vivo. J Neurosci. 2003;23:9199–9207. doi: 10.1523/JNEUROSCI.23-27-09199.2003. [DOI] [PMC free article] [PubMed] [Google Scholar]
- Kros CJ, Ruppersberg JP, Rusch A. Expression of a potassium current in inner hair cells during development of hearing in mice. Nature. 1998;394:281–284. doi: 10.1038/28401. [DOI] [PubMed] [Google Scholar]
- Leao RN, Sun H, Svahn K, Berntson A, Youssoufian M, Paolini AG, Fyffe RE, Walmsley B. Topographic organization in the auditory brainstem of juvenile mice is disrupted in congenital deafness. J Physiol (Lond) 2006;571:563–578. doi: 10.1113/jphysiol.2005.098780. [DOI] [PMC free article] [PubMed] [Google Scholar]
- Liu XB, Murray KD, Jones EG. Switching of NMDA receptor 2A and 2B subunits at thalamic and cortical synapses during early postnatal development. J Neurosci. 2004;24:8885–8895. doi: 10.1523/JNEUROSCI.2476-04.2004. [DOI] [PMC free article] [PubMed] [Google Scholar]
- Marty S, Wehrle R, Sotelo C. Neuronal activity and brain-derived neurotrophic factor regulate the density of inhibitory synapses in organotypic slice cultures of postnatal hippocampus. J Neurosci. 2000;20:8087–8095. doi: 10.1523/JNEUROSCI.20-21-08087.2000. [DOI] [PMC free article] [PubMed] [Google Scholar]
- Mikaelian D, Ruben RJ. Development of hearing in the normal CBA-J mouse. Acta Otolaryngol. 1964;59:451–461. [Google Scholar]
- Monyer H, Burnashev N, Laurie DJ, Sakmann B, Seeburg PH. Developmental and regional expression in the rat brain and functional properties of four NMDA receptors. Neuron. 1994;12:529–540. doi: 10.1016/0896-6273(94)90210-0. [DOI] [PubMed] [Google Scholar]
- Murthy VN, Schikorski T, Stevens CF, Zhu Y. Inactivity produces increases in neurotransmitter release and synapse size. Neuron. 2001;32:673–682. doi: 10.1016/s0896-6273(01)00500-1. [DOI] [PubMed] [Google Scholar]
- O'Brien RJ, Kamboj S, Ehlers MD, Rosen KR, Fischbach GD, Huganir RL. Activity-dependent modulation of synaptic AMPA receptor accumulation. Neuron. 1998;21:1067–1078. doi: 10.1016/s0896-6273(00)80624-8. [DOI] [PubMed] [Google Scholar]
- Oleskevich S, Walmsley B. Synaptic transmission in the auditory brainstem of normal and congenitally deaf mice. J Physiol (Lond) 2002;540:447–455. doi: 10.1113/jphysiol.2001.013821. [DOI] [PMC free article] [PubMed] [Google Scholar]
- Oleskevich S, Clements J, Walmsley B. Release probability modulates short-term plasticity at a rat giant terminal. J Physiol. 2000;524:513–523. doi: 10.1111/j.1469-7793.2000.00513.x. [DOI] [PMC free article] [PubMed] [Google Scholar]
- Oleskevich S, Youssoufian M, Walmsley B. Presynaptic plasticity at two giant auditory synapses in normal and deaf mice. J Physiol (Lond) 2004;560:709–719. doi: 10.1113/jphysiol.2004.066662. [DOI] [PMC free article] [PubMed] [Google Scholar]
- Platzer J, Engel J, Schrott-Fischer A, Stephan K, Bova S, Chen H, Zheng H, Striessnig J. Congenital deafness and sinoatrial node dysfunction in mice lacking class D L-type Ca2+ channels. Cell. 2000;102:89–97. doi: 10.1016/s0092-8674(00)00013-1. [DOI] [PubMed] [Google Scholar]
- Rao A, Craig AM. Activity regulates the synaptic localization of the NMDA receptor in hippocampal neurons. Neuron. 1997;19:801–812. doi: 10.1016/s0896-6273(00)80962-9. [DOI] [PubMed] [Google Scholar]
- Reyes A, Sakmann B. Developmental switch in the short-term modification of unitary EPSPs evoked in layer 2/3 and layer 5 pyramidal neurons of rat neocortex. J Neurosci. 1999;19:3827–3835. doi: 10.1523/JNEUROSCI.19-10-03827.1999. [DOI] [PMC free article] [PubMed] [Google Scholar]
- Rosenmund C, Clements JD, Westbrook GL. Nonuniform probability of glutamate release at a hippocampal synapse. Science. 1993;262:754–757. doi: 10.1126/science.7901909. [DOI] [PubMed] [Google Scholar]
- Rubel EW, Fritzsch B. Auditory system development: primary auditory neurons and their targets. Annu Rev Neurosci. 2002;25:51–101. doi: 10.1146/annurev.neuro.25.112701.142849. [DOI] [PubMed] [Google Scholar]
- Russell FA, Moore DR. Afferent reorganisation within the superior olivary complex of the gerbil: development and induction by neonatal, unilateral cochlear removal. J Comp Neurol. 1995;352:607–625. doi: 10.1002/cne.903520409. [DOI] [PubMed] [Google Scholar]
- Satzler K, Sohl LF, Bollmann JH, Borst JG, Frotscher M, Sakmann B, Lubke JH. Three-dimensional reconstruction of a calyx of Held and its postsynaptic principal neuron in the medial nucleus of the trapezoid body. J Neurosci. 2002;22:10567–10579. doi: 10.1523/JNEUROSCI.22-24-10567.2002. [DOI] [PMC free article] [PubMed] [Google Scholar]
- Scheuss V, Schneggenburger R, Neher E. Separation of presynaptic and postsynaptic contributions to depression by covariance analysis of successive EPSCs at the calyx of held synapse. J Neurosci. 2002;22:728–739. doi: 10.1523/JNEUROSCI.22-03-00728.2002. [DOI] [PMC free article] [PubMed] [Google Scholar]
- Schneggenburger R, Neher E. Intracellular calcium dependence of transmitter release rates at a fast central synapse. Nature. 2000;406:889–893. doi: 10.1038/35022702. [DOI] [PubMed] [Google Scholar]
- Schneggenburger R, Meyer AC, Neher E. Released fraction and total size of a pool of immediately available transmitter quanta at a calyx synapse. Neuron. 1999;23:399–409. doi: 10.1016/s0896-6273(00)80789-8. [DOI] [PubMed] [Google Scholar]
- Sheng M, Cummings J, Roldan LA, Jan YN, Jan LY. Changing subunit composition of heteromeric NMDA receptors during development of rat cortex. Nature. 1994;368:144–147. doi: 10.1038/368144a0. [DOI] [PubMed] [Google Scholar]
- Shi J, Aamodt SM, Constantine-Paton M. Temporal correlations between functional and molecular changes in NMDA receptors and GABA neurotransmission in the superior colliculus. J Neurosci. 1997;17:6264–6276. doi: 10.1523/JNEUROSCI.17-16-06264.1997. [DOI] [PMC free article] [PubMed] [Google Scholar]
- Smith PH, Joris PX, Carney LH, Yin TC. Projections of physiologically characterized globular bushy cell axons from the cochlear nucleus of the cat. J Comp Neurol. 1991;304:387–407. doi: 10.1002/cne.903040305. [DOI] [PubMed] [Google Scholar]
- Song P, Yang Y, Barnes-Davies M, Bhattacharjee A, Hamann M, Forsythe ID, Oliver DL, Kaczmarek LK. Acoustic environment determines phosphorylation state of the Kv3.1 potassium channel in auditory neurons. Nat Neurosci. 2005;8:1335–1342. doi: 10.1038/nn1533. [DOI] [PubMed] [Google Scholar]
- Takahashi T, Feldmeyer D, Suzuki N, Onodera K, Cull-Candy SG, Sakimura K, Mishina M. Functional correlation of NMDA receptor ε subunits expression with the properties of single-channel and synaptic currents in the developing cerebellum. J Neurosci. 1996;16:4376–4382. doi: 10.1523/JNEUROSCI.16-14-04376.1996. [DOI] [PMC free article] [PubMed] [Google Scholar]
- Taschenberger H, von Gersdorff H. Fine-tuning an auditory synapse for speed and fidelity: developmental changes in presynaptic waveform, EPSC kinetics, and synaptic plasticity. J Neurosci. 2000;20:9162–9173. doi: 10.1523/JNEUROSCI.20-24-09162.2000. [DOI] [PMC free article] [PubMed] [Google Scholar]
- Taschenberger H, Leao RM, Rowland KC, Spirou GA, von Gersdorff H. Optimizing synaptic architecture and efficiency for high-frequency transmission. Neuron. 2002;36:1127–1143. doi: 10.1016/s0896-6273(02)01137-6. [DOI] [PubMed] [Google Scholar]
- Taschenberger H, Scheuss V, Neher E. Release kinetics, quantal parameters and their modulation during short-term depression at a developing synapse in the rat CNS. J Physiol (Lond) 2005;568:513–537. doi: 10.1113/jphysiol.2005.093468. [DOI] [PMC free article] [PubMed] [Google Scholar]
- Thiagarajan TC, Lindskog M, Tsien RW. Adaptation to synaptic inactivity in hippocampal neurons. Neuron. 2005;47:725–737. doi: 10.1016/j.neuron.2005.06.037. [DOI] [PubMed] [Google Scholar]
- Townsend M, Liu Y, Constantine-Paton M. Retina-driven dephosphorylation of the NR2A subunit correlates with faster NMDA receptor kinetics at developing retinocollicular synapses. J Neurosci. 2004;24:11098–11107. doi: 10.1523/JNEUROSCI.1207-04.2004. [DOI] [PMC free article] [PubMed] [Google Scholar]
- Turrigiano GG, Leslie KR, Desai NS, Rutherford LC, Nelson SB. Activity-dependent scaling of quantal amplitude in neocortical neurons. Nature. 1998;391:892–896. doi: 10.1038/36103. [DOI] [PubMed] [Google Scholar]
- Vale C, Sanes DH. Afferent regulation of inhibitory synaptic transmission in the developing auditory midbrain. J Neurosci. 2000;20:1912–1921. doi: 10.1523/JNEUROSCI.20-05-01912.2000. [DOI] [PMC free article] [PubMed] [Google Scholar]
- Van der Kloot W. Estimating the timing of quantal releases during end-plate currents at the frog neuromuscular junction. J Physiol (Lond) 1988;402:595–603. doi: 10.1113/jphysiol.1988.sp017224. [DOI] [PMC free article] [PubMed] [Google Scholar]
- Wierenga CJ, Walsh MF, Turrigiano GG. Temporal regulation of the expression locus of homeostatic plasticity. J Neurophysiol. 2006;96:2127–2133. doi: 10.1152/jn.00107.2006. [DOI] [PubMed] [Google Scholar]
- Williams K. Ifenprodil discriminates subtypes of the N-methyl-d-aspartate receptor: selectivity and mechanisms at recombinant heteromeric receptors. Mol Pharmacol. 1993;44:851–859. [PubMed] [Google Scholar]
- Williams K, Russell SL, Shen YM, Molinoff PB. Developmental switch in the expression of NMDA receptors occurs in vivo and in vitro. Neuron. 1993;10:267–278. doi: 10.1016/0896-6273(93)90317-k. [DOI] [PubMed] [Google Scholar]
- Wu G, Malinow R, Cline HT. Maturation of a central glutamatergic synapse. Science. 1996;274:972–976. doi: 10.1126/science.274.5289.972. [DOI] [PubMed] [Google Scholar]
- Wu SH, Kelly JB. Response of neurons in the lateral superior olive and medial nucleus of the trapezoid body to repetitive stimulation: intracellular and extracellular recordings from mouse brain slice. Hear Res. 1993;68:189–201. doi: 10.1016/0378-5955(93)90123-i. [DOI] [PubMed] [Google Scholar]
- Youssoufian M, Oleskevich S, Walmsley B. Development of a robust central auditory synapse in congenital deafness. J Neurophysiol. 2005;94:3168–3180. doi: 10.1152/jn.00342.2005. [DOI] [PubMed] [Google Scholar]