Abstract
Although it is known that neural selectivity for species-specific vocalizations changes during development, the mechanisms underlying such changes are not known. This study followed the development of mechanisms underlying selectivity for the direction and rate of frequency-modulated (FM) sweeps in the auditory cortex of the pallid bat, a species that uses downward FM sweeps to echolocate. In the adult cortex, direction and rate selectivity arise as a result of different spectral and temporal properties of low-frequency inhibition (LFI) and high-frequency inhibition (HFI). A narrow band of delayed HFI shapes rate selectivity for downward FM sweeps. A broader band of early LFI shapes direction selectivity. Here we asked whether these differences in LFI and HFI are present at the onset of hearing in the echolocation range or whether the differences develop slowly. We also studied how the development of properties of inhibitory frequencies influences FM rate and direction selectivity. We found that adult-like FM rate selectivity is present at 2 weeks after birth, whereas direction selectivity matures 12 weeks after birth. The different developmental time course for direction and rate selectivity is attributable to the differences in the development of LFI and HFI. Arrival time and bandwidth of HFI are adult-like at 2 weeks. Average arrival time of LFI gradually becomes faster and bandwidth becomes broader between 2 and 12 weeks. Thus, two properties of FM sweeps that are important for vocalization selectivity follow different developmental time courses attributable to the differences in the development of underlying inhibitory mechanisms.
Keywords: development, inhibition, auditory cortex, FM sweeps, pallid bat, plasticity
Introduction
To understand the relative contributions of genes and experience to behavior, the development of neural mechanisms underlying selectivity for natural stimuli must be elucidated. In the auditory system, considerable emphasis has been placed on studying the development of selectivity for species-specific vocalizations. Vocalization-selective neurons are present in several vertebrate groups (Capranica, 1972; Fuzessery and Feng, 1983; Margoliash, 1986; Ohlemiller et al., 1996; Wang, 2000; Tian et al., 2001; Klug et al., 2002; Suta et al., 2003). In songbirds, it is known that vocalization selectivity undergoes developmental changes in parallel with maturation of vocalizations (Doupe and Konishi, 1991; Doupe, 1997; Solis and Doupe, 1997). Perhaps because of their complex, multi-syllable structure, the mechanisms that shape selectivity for songs are only beginning to be understood (Lewicki, 1996; Theunissen et al., 2000; Rosen and Mooney, 2006). How these mechanisms change during development is, however, unclear. The development of neural selectivity for vocalizations in mammals has not received as much attention. In addition to the complexity of communication calls, selectivity for single calls is less pronounced in the mammalian auditory system (Glass and Wollberg, 1983; Wang, 2000; Klug et al., 2002; Suta et al., 2003), making it difficult to determine mechanisms that shape vocalization selectivity and to study their developmental changes.
The bat echolocation system may be a useful model to address this issue because of the simplicity of echolocation calls and strong neural selectivity for its parameters. In this study, we have taken advantage of these factors to report on the development of mechanisms underlying vocalization selectivity in the auditory cortex of the pallid bat. The pallid bat auditory system shows strong selectivity for a simple vocalization, the downward frequency-modulated (FM) sweep used in echolocation (Fuzessery and Hall, 1996). Nearly 70% of auditory cortex neurons are selective for the sweep rate and direction of the echolocation pulse (Razak and Fuzessery, 2002). FM direction and rate selectivity in the pallid bat cortex depend on spectrotemporal properties of low-frequency inhibition (LFI) and high-frequency inhibition (HFI) (Razak and Fuzessery, 2006). An early-arriving broadband LFI shapes direction selectivity, whereas a delayed narrowband HFI shapes rate selectivity for downward sweeps. Adult-like FM rate and direction selectivity, and the differences in the properties of LFI and HFI, may be present at the time the pallid bat starts to hear echolocation frequencies, suggesting an experience-independent shaping of components of echolocation behavior. Alternately, these differences may emerge slowly, allowing a possible role for experience. The goal of this study was to distinguish between these possibilities.
Another motivation for studying FM sweeps is that such sounds are common components of species-specific vocalizations, including human speech. In the auditory cortex, selectivity for the rate and direction of FM sweeps is present in many species (Suga, 1965a–c; Heil et al., 1992; Mendelson et al., 1993; Tian and Rauschecker, 1994; Kowalski et al., 1995; Nelken and Versnel, 2000; Hart et al., 2003). Understanding the development of mechanisms that shape this selectivity in the pallid bat cortex may therefore have general applicability to vocalization processing in other auditory systems.
Materials and Methods
Recordings were obtained from both hemispheres of the auditory cortex in pallid bat pups that were born and raised in the University of Wyoming animal facility. Pregnant bats were netted in New Mexico and maintained in cages. The bats were fed mealworms raised on ground Purina (St. Louis, MO) rat chow. The room was heated and maintained on a reversed 12 h light/dark cycle. As pups were born, they were moved, with their mothers, to a nursery cage that housed pups born within 2–3 d of each other. Pups and moms were maintained in these cages until the day of recording from the pups. All of the data reported were from single-unit recordings obtained from pups between 2 and 12 weeks. Brown et al. (1978) showed using evoked potential recordings from the inferior colliculus that, at 10 d of age, hearing in the pallid bat is limited to frequencies <40 kHz, with a steep increase in thresholds above 40 kHz and no responses >45 kHz. At 12 d of age, responses can be obtained for frequencies up to 70 kHz, but the thresholds for frequencies >40 kHz are between 12 and 40 dB higher in pups than adults. Between 12 and 24 d, the audiograms become adult-like. These data suggest that, at 2 weeks, hearing in the echolocation range has been present for 2–3 d albeit at a lower sensitivity in pups than adults. Thus, the 2–12 week age range studied here encompasses the time when the pups start listening to frequencies >40 kHz (2 weeks), to when they begin using echolocation in flight (4–5 weeks), and to when they are fully weaned (8–10 weeks) (Brown et al., 1978). All procedures followed the animal welfare guidelines required by the National Institutes of Health and Institutional Animal Care and Use Committee. All adult data shown for comparison in this study were reported previously by Razak and Fuzessery (2006).
Surgical procedures.
The procedures used in pups were identical to those used in adults and reported previously (Razak and Fuzessery, 2002). Briefly, recordings were obtained from bats that were lightly anesthetized with Metofane (methoxyflurane) inhalation, followed by an intraperitoneal injection of pentobarbital sodium (30 μg/g body weight) and acepromazine (2 μg/g body weight). To expose the auditory cortex, the head was held in a bite bar, a midline incision was made in the scalp, and the muscles over the dorsal surface of the skull were reflected to the sides. The front of the skull was scraped clean, and a layer of glass microbeads was applied, followed by a layer of dental cement. The bat was then placed in a Plexiglas restraining device. A cylindrical aluminum head pin was inserted through a cross bar over the bat's head and cemented to the previously prepared region of the skull. This pin served to hold the bat's head secure during the recording session. An exposure was made by excising a piece of skull over the location with best frequencies (BFs) above 30 kHz, known to be selective for FM sweeps. The size of the exposure was usually ∼2 × 2 mm2. Exposed muscle was covered with petroleum jelly (Vaseline), and the exposed brain surface was covered with paraffin oil to prevent desiccation.
Recording procedures.
Experiments were conducted in a heated (85–90°F), soundproofed chamber lined with anechoic foam. Bats were kept lightly anesthetized throughout the course of the experiments with Metofane and additional pentobarbital sodium (one-third of presurgical dose) injections. Stimuli were generated using Modular Instruments (Westchester, PA) and Tucker-Davis Technologies (Gainesville, FL) digital hardware and custom-written software (Fuzessery et al., 1991). The waveforms were amplified with a stereo amplifier and presented as closed-field stimuli through Infinity emit-K ribbon tweeters fitted with funnels that were inserted into the bat's pinnae and sealed there with petroleum jelly. This procedure attenuated speaker intensity level at the opposite ear by ≥30 dB (Fuzessery, 1996). The speaker-funnel frequency response curve was measured with a Brüel and Kjær (Norcross, GA) ⅛ inch microphone placed at the tip of the funnel. The response was flat from 10 to 20 kHz, showed a gradual increase of 20 dB between 20 and 35 kHz, and was flat from 35 to 60 kHz. Using glass microelectrodes (1 m NaCl, 2–5 MΩ impedance), recordings were obtained at depths between 200 and 500 μm. Penetrations were made orthogonal to the surface of the cortex. Response magnitudes and poststimulus time histograms were acquired and stored with the use of a Modular Instruments high-speed clock controlled by custom software. Responses were quantified as the total number of action potentials elicited over 20 stimulus presentations. All results were from single-unit recordings, identified based on the consistency of action potential amplitude, and waveform displayed on an oscilloscope.
Data acquisition.
Because the objective of this study was to determine the development of mechanisms underlying FM rate and direction selectivity, we focused exclusively on the high-frequency FM sweep-selective region (Razak and Fuzessery, 2002, 2006). Once a neuron with BF >30 kHz and with strong response to FM sweeps, but not to noise, was isolated, the following response properties were determined:
Excitatory frequency tuning curve.
Pure tones (25–75 kHz, 5 ms duration, 1 ms rise/fall times, 1 Hz repetition rate) were used to determine the BF and excitatory frequency tuning curve. BF was defined as the frequency that elicited action potentials to at least five successive stimulus repetitions at the lowest intensity. The intensity was then increased in 5 or 10 dB steps to record the frequency–intensity combinations that produced excitatory responses.
FM rate and direction selectivity.
Rate selectivity was determined for downward FM sweeps. Rate selectivity was determined by first recording responses to downward sweeps of at least two different bandwidths (BWs) presented with durations of 0.5–70 ms. The sweep duration functions were then converted to rate selectivity functions by dividing the sweep BW by the sweep duration (kilohertz per milliseconds). Two criteria were used to classify a neuron as FM rate selective. First, there had to be a reduction of >50% in maximum response as the FM rate was reduced. Second, rate selectivity functions determined at different BWs had to be within 1 kHz/ms of one another along the flank of the function as responses declined to 50% of maximum response. Comparing rate tuning across FM sweeps with different BWs was essential for determining whether a neuron was truly rate tuned or simply sensitive to sweep duration.
To test for direction selectivity, the response to upward FM sweeps with the same range of duration and BW as the downward sweeps was recorded. A direction selectivity index (DSI) was calculated to quantify direction selectivity (O'Neill and Brimijoin, 2002). The formula used was as follows: DSI = (D − U)/(D +U), in which D and U are the maximum response magnitudes for downward and upward sweeps, respectively. The DSI of each neuron was calculated by comparing the maximum responses to upward and downward sweeps of the same BWs. In other words, the DSI was not necessarily calculated at the same sweep rate for the two sweep directions. Values of DSI can range between −1 and +1, with more positive values indicating higher selectivity for the downward direction. DSI values >0.6 are equivalent to the maximum response to the upward sweep being <25% of the maximum response to the downward sweep.
Two-tone inhibition over time tuning curves.
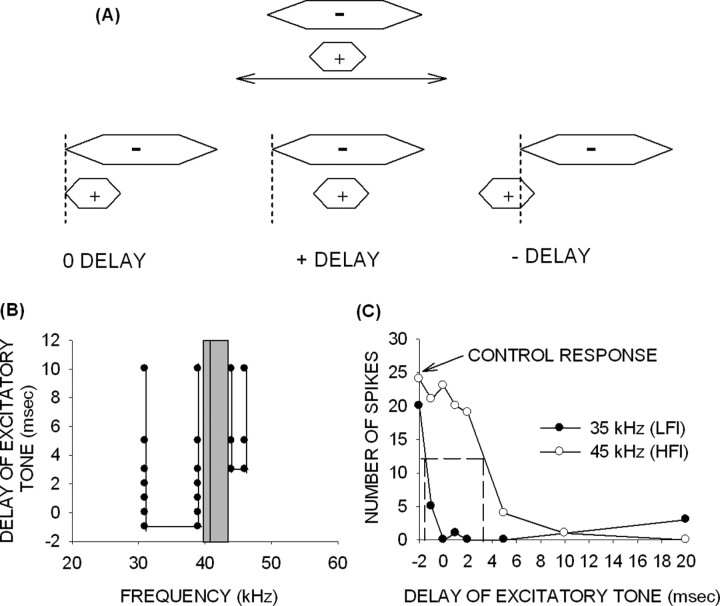
To determine the arrival time and BW of inhibition, a “two-tone inhibition over time” (TTI) method was used (Calford and Semple, 1995; Brosch and Schreiner, 1997; Gordon and O'Neill, 1998; Fuzessery et al., 2006; Razak and Fuzessery, 2006). Two tones, one excitatory and the other inhibitory, were presented with different delays between them (Fig. 1A). The frequency of the excitatory tone was set at the BF of the neuron and was presented at a single intensity 10–20 dB above threshold with duration of either 3 or 5 ms. The same duration (either 3 or 5 ms) was used for individual neurons. The inhibitory tone was presented at the same intensity and a longer duration (10 ms). Its frequency was varied between 5 and 70 kHz, and its onset time varied with respect to that of the excitatory tone. Below the BF, the frequency of the inhibitory tone was increased in 1 kHz steps. Because HFI was typically very narrow (∼2–3 kHz) (Razak and Fuzessery, 2006), the resolution was 0.1 kHz for testing HFI. The delay–frequency combinations that resulted in inhibition of response to the excitatory tone for at least four of five (80% inhibition) consecutive presentations served to map out the spectrum and arrival times of inhibitory frequencies. Inhibition that occurred only when the excitatory tone was delayed denoted delayed inhibition arriving after excitation. This is analogous to forward masking. Inhibition that occurred even when the excitatory tone was advanced demonstrated an early inhibition that arrived before excitation. This is analogous to backward masking.
Figure 1.
The TTI method was used to determine the BW and arrival time of inhibition. A, In this method, an excitatory tone was delayed or advanced with respect to an inhibitory tone. The intensity of the two tones was the same. Simultaneous onset of the two tones was denoted as 0 ms delay. Later (earlier) onset of the excitatory tone with respect to the inhibitory tone was denoted as positive (negative) delay. B, The TTI tuning curve shows frequency on the x-axis, and the delay of the excitatory tone on the y-axis. The gray bar shows the excitatory frequency tuning curves at the intensity at which the TTI test was performed. The vertical line shows the BF of the neuron. The filled circles were the delay–frequency combinations that caused inhibition of response to the BF tone. Inhibition occurring at negative delays arrived early, whereas inhibition occurring at positive delays arrived late. C, The 50% arrival time of inhibition was the delay of excitatory tone at which an inhibitory tone caused a 50% decrease in control response (BF tone alone response). The horizontal dashed line shows 50% of control response, and the vertical dashed lines indicate the 50% arrival time for two different inhibitory tones.
A TTI tuning curve (Fig. 1B) was constructed from the delay–frequency combinations that inhibited the response to the BF tone. On the y-axis, negative delays denote that the onset of the excitatory tone occurred before that of the inhibitory tone. Positive delays indicate that the onset of the excitatory tone occurred after that of the inhibitory tone. The x-axis shows frequencies of the inhibitory tones used. In the example shown (Fig. 1B), the gray bar denotes the range of excitatory frequencies of this neuron at the intensity at which the TTI test was performed. The vertical line denotes the BF (41 kHz) of the neuron. This neuron exhibited two bands of inhibitory frequencies. The band of LFI was centered at 35 kHz and had a BW of 8 kHz. LFI arrived early (delay of −1 ms). The band of HFI was centered at 45 kHz, had a BW of 2 kHz, and arrived late (delay of +3 ms).
To obtain more accurate quantification of the arrival times of inhibitory input, the TTI procedure was repeated with the best inhibitory frequency (center frequency of the inhibitory tuning curve) and the BF tone to determine the delay at which response magnitude decreased to 50% of the excitatory tone alone (control) response. This value was referred to as the “50% arrival time of inhibition.” In the example shown (Fig. 1C, same neuron as in B), the 50% arrival time of LFI (35 kHz) was −1.5 ms. The 50% arrival time of HFI (45 kHz) was +3.2 ms.
Data representation and analysis.
In this study, pups between 14 and 21 d old are referred to as 2–3 weeks. Three to 5 weeks refers to 22- to 35-d-old pups, 5–8 weeks refers to 36–60 d, and >12 weeks refers to pups that were between 90 and 120 d of age. Data from 69 neurons from seven pups in the 2–3 week group are included in this paper. In the 3–5 week group, 38 neurons were recorded from four pups. In the 5–8 week group, 32 neurons were recorded from three pups. In the >12 week group, data were obtained from 34 neurons from three pups. Adult data (61 neurons from seven bats) from Razak and Fuzessery (2006) are used for comparison with the developmental data. The response magnitudes reported were the number of action potentials in response to 20 stimulus repetitions at 1 Hz repetition rate. Error bars show SEM. One-way ANOVA with a Tukey's test for post hoc pairwise comparisons was used for statistical comparisons of mean ± SE between the adults and individual age groups; significant differences were inferred at a p < 0.05 level.
Results
Rate selectivity for downward FM sweeps was adult-like from 2–3 weeks after birth
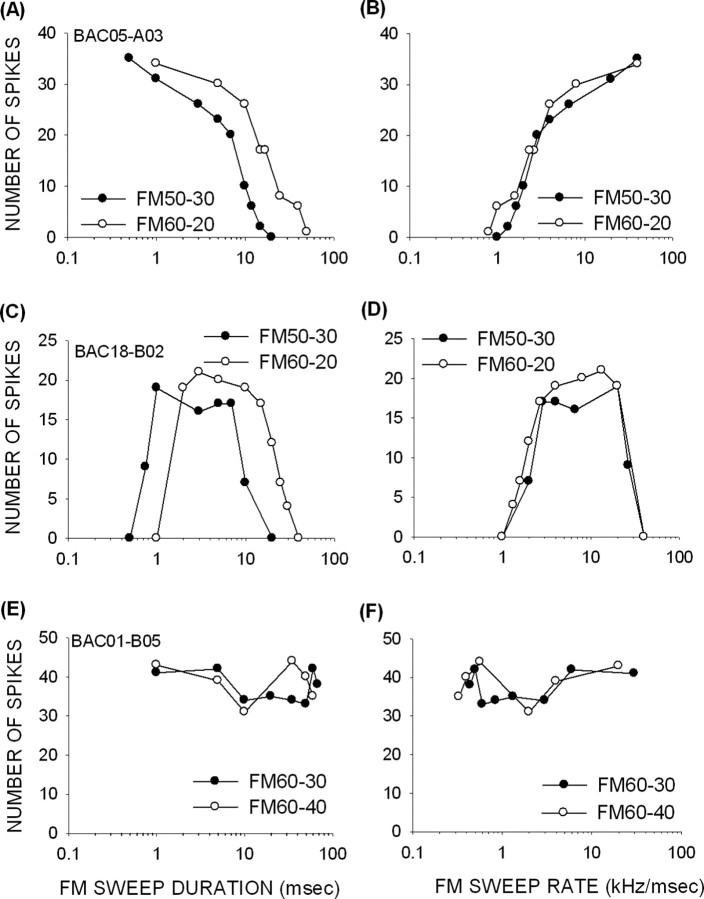
Downward FM rate selectivity was determined in neurons with BFs within the spectrum of the echolocation pulse (30–60 kHz), in pups between 2 and >12 weeks after birth. Three forms of sweep rate sensitivity were observed: fast pass (FP), bandpass (BP), and rate insensitive. An example of FP selectivity from the youngest pup tested (14 d old) is shown in Figure 2, A and B. The response declined as the sweep duration increased (Fig. 2A) and sweep rate consequently decreased (Fig. 2B). However, the response did not decline at the fastest rates tested. FM rate selectivity was similar for different BWs (Fig. 2B). A 50% cutoff rate was calculated for FP neurons as the rate at which response declined to 50% of maximum; in this example, the 50% cutoff rate was ∼3 kHz/ms (Fig. 2B).
Figure 2.
Examples of FM rate selectivity in pup cortex. The panels on the top and bottom show response to changing FM sweep duration and rate, respectively. A, B, A neuron from a 14-d-old pup that exhibited FP-type selectivity for FM rate. The duration functions (A) obtained at two different FM BWs do not overlap, but FM rate functions (B) obtained by dividing the BW of the sweep by the duration of the sweep do. This suggests that this neuron was selective for FM rate and not duration. C, D, A neuron from a 17-d-old pup that had BP selectivity for FM rate. E, F, A neuron from a 21-d-old pup that was nonselective for FM rate. The response of the neuron to different FM rates tested was within 50% of maximum response. The different symbols denote different FM sweep BWs tested.
An example of a neuron with BP rate selectivity, recorded from a 17-d-old pup, is shown in Figure 2, C and D. Note that responses declined below 50% of maximum response at both the fastest and slowest rates tested. Although BP neurons have 50% cutoffs on both sides of the peak, we quantify the 50% cutoff for slower rates because this value is predicted by properties of inhibition in adults (Razak and Fuzessery, 2006). The mechanisms shaping the 50% cutoff on the high rate side in adults are not known, and therefore we did not study them in pups. In addition to a 50% cutoff rate, a best FM rate was calculated in BP neurons as the center of the range of rates that produced >80% of maximum response. The best FM rate of the neuron in Figure 2D was 7 kHz/ms; the 50% cutoff rate was 2 kHz/ms. Finally, the neuron shown in Figure 2, E and F, was rate insensitive, because its response did not decrease below 50% of maximum response at all rates tested.
The percentage of FM rate-selective neurons in all age groups was similar to adult values (Fig. 3A) (χ2 test, p > 0.05). In the adult cortex, 75% of neurons are selective for FM sweep rate (Razak and Fuzessery, 2006). A similar percentage (76%) of cortical neurons exhibited FM rate selectivity even in the youngest group studied (2–3 weeks) (Fig. 3A). The absolute sweep rate values for which these neurons were selective were also similar between adults and pups. There was no significant difference between different age groups and adults in the average 50% cutoff rate of FP and BP neurons (2–3 weeks, 1.88 ± 0.26 kHz/ms; 3–5 weeks, 1.7 ± 0.56 kHz/ms; 5–8 weeks, 1.6 ± 0.23 kHz/ms; adult, 1.5 ± 0.2 kHz/ms; p > 0.05, one-way ANOVA with Tukey's test for post hoc pairwise comparison). The distribution of 50% cutoff rate (Fig. 3B) was similar across the different age groups. The average best FM rate of BP neurons was similar across all age groups (2–3 weeks, 4.5 ± 0.6 kHz/ms; 3–5 weeks, 3.8 ± 0.8 kHz/ms; adult, 3.6 ± 0.32 kHz/ms; p > 0.05, one-way ANOVA with Tukey's test for post hoc pairwise comparison). The distribution of best FM rates was similar across all age groups (Fig. 3C). The sample size of BP neurons in 5- to 8-week-old bats was too low to be included in the above comparisons. These data indicate that FM rate selectivity is adult-like in the pallid bat auditory cortex from 2 weeks after birth, coinciding with the age at which these bats first achieve adult-like hearing thresholds in the echolocation range.
Figure 3.
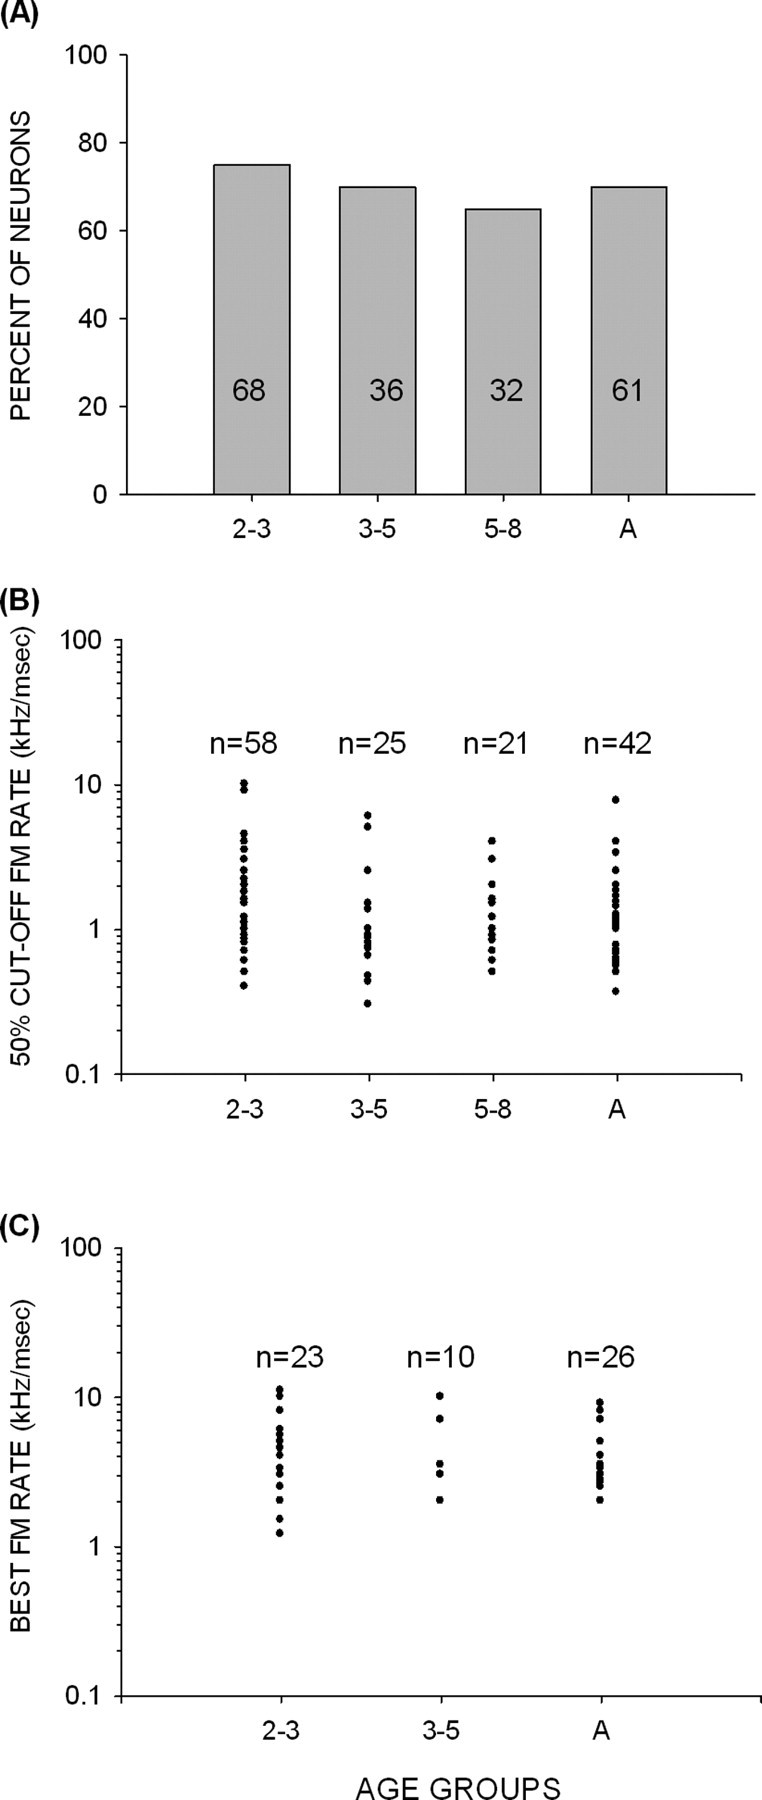
Development of FM rate selectivity in the pallid bat cortex. A, The percentage of neurons that were FM rate selective was adult-like in all of the age groups studied. B, In neurons with FP and BP selectivity, the distribution of FM rates at which response declined to 50% of maximum was similar across all age groups. C, In neurons with BP selectivity, the distribution of best FM rate was similar across all age groups. A, Adult.
Direction selectivity was not adult-like until 12 weeks of age
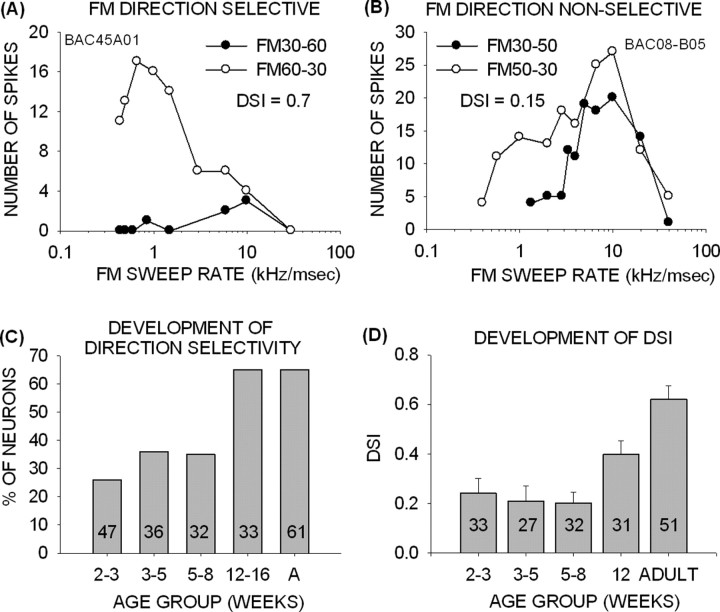
Direction-selective neurons (Fig. 4A) were defined as those in which the response to upward FM sweeps was <25% of the maximum response to downward FM sweeps with the same frequencies and BW. Neurons (Fig. 4B) whose response to upward FM sweeps was at least 25% of maximum response to downward FM sweeps for at least one FM rate were termed nonselective for FM direction. A DSI was used (see Materials and Methods) to quantify the difference in responses for the two sweep directions. A neuron with a maximum response to upward sweeps that is <25% of maximum response to downward sweeps has a DSI >0.6. The direction-selective neuron shown in Figure 4A had a DSI of 0.7, whereas the nonselective neuron (Fig. 4B) had a DSI of 0.15.
Figure 4.
FM direction selectivity is poor in pup cortex. A, This neuron was selective for the downward direction of FM sweep. Upward sweeps with the same BW elicited weak responses at all FM rates tested. B, This neuron was not selective for FM sweep direction. It responded well to both directions at certain rates. C, The percentage of direction-selective neurons was <35% up to 8 weeks after birth. Direction selectivity reached adult-like percentages in pups >12 weeks old. A, Adult. D, DSI in pups younger than 8 weeks was on average <0.3. In the >12-week-old group, DSI values were intermediate between the young pups and the adults.
In adult cortex, the majority of neurons (65%) have DSIs >0.6 (Razak and Fuzessery, 2006). This was not the case in pups. Direction selectivity was present in <25% of neurons in the 2- to 3-week-old pups (Fig. 4C). The percentage increased to 35% in pups between 3 and 8 weeks but was still considerably lower than in adults. There was no difference in percentage of direction-selective neurons between 2 and 8 weeks (χ2 test, p > 0.05). Average DSI was <0.25 up to 8 weeks (Fig. 4D, Table 1). By 12 weeks of age, the percentage of direction-selective neurons was adult-like (χ2 test, p > 0.05). Moreover, the percentage of direction-selective neurons in the 12 weeks and adult groups was significantly higher than in pups younger than 8 weeks (χ2 test, p < 0.05). However, even at 12 weeks, the DSI did not reach adult-like levels, showing that the preference for downward FM sweeps was weaker than that seen in adults (Fig. 4D, Table 1). The average DSI was higher in the 12-week-old bats than in younger pups (p < 0.05, t test), suggesting that some developmental increase in direction selectivity occurs during the period between 8 and 12 weeks. These data show that FM rate selectivity, but not direction selectivity, is adult-like in pup auditory cortex.
Table 1.
DSI values during development
| Age group (weeks) | Mean ± SE DSI |
|---|---|
| 2–3 | 0.24 ± 0.06 |
| 3–5 | 0.21 ± 0.06 |
| 5–8 | 0.2 ± 0.04 |
| 12 | 0.4 ± 0.06 |
| Adult | 0.62 ± 0.06 |
The remainder of this study addresses the development of the mechanisms underlying FM sweep rate and direction selectivity to determine why these two forms of selectivity have different developmental time courses.
Mechanisms of FM rate selectivity were adult-like from 2 weeks after birth
The presence of adult-like rate selectivity in the youngest pups suggested that the underlying mechanisms are mature at 2 weeks after birth. In adult cortex, rate selectivity for downward FM sweeps is created by a narrow band of HFI whose arrival is delayed with respect to excitatory input (Razak and Fuzessery, 2006). Because HFI is delayed, downward sweeps with fast rates allow excitation to arrive before inhibition, although excitatory frequencies in a downward sweep are encountered later than the HFI. Slower downward FM sweeps, however, allow sufficient time for the HFI to catch up with the excitatory input, and the response is suppressed. Delayed HFI thus acts as a fast-pass filter for shaping sweep rate selectivity.
The importance of delayed HFI in shaping downward FM sweep rate selectivity has been determined by three observations in the adult cortex (Razak and Fuzessery, 2006). First, neurons without HFI are not rate selective. Second, removal of HFI by starting a downward FM sweep within the excitatory frequency tuning curve eliminates rate selectivity. Third, the arrival time and BW of HFI can be used to accurately predict the rate selectivity of adult cortical neurons for downward sweeps. We tested whether all three observations were also true in pup cortex.
The same mechanisms that shape rate selectivity for downward sweeps in adults are also present in pups of all age groups. The example of Figure 5 shows that elimination of HFI from a downward sweep eliminates sweep rate tuning. The TTI tuning curve in this 14-d-old pup is shown in Figure 5A. The neuron had a BF of 46 kHz and a narrow, 2 kHz band of HFI centered at 51 kHz that arrived 7 ms after excitation. The arrival time of inhibition generated by 51 kHz that suppressed the control response by 50% was 2 ms (Fig. 5B). The neuron was rate selective for downward FM sweeps that included the HFI (60–40 kHz and 70–40 kHz in Fig. 5C). However, the neuron lost rate selectivity if the HFI was excluded by starting the sweep inside the excitatory tuning curve (49–29 kHz) (Fig. 5C). This test was performed on 74 neurons in pups from all age groups, and, in 95% of the neurons (n = 70), eliminating HFI from a downward sweep resulted in a loss of sweep rate sensitivity.
Figure 5.
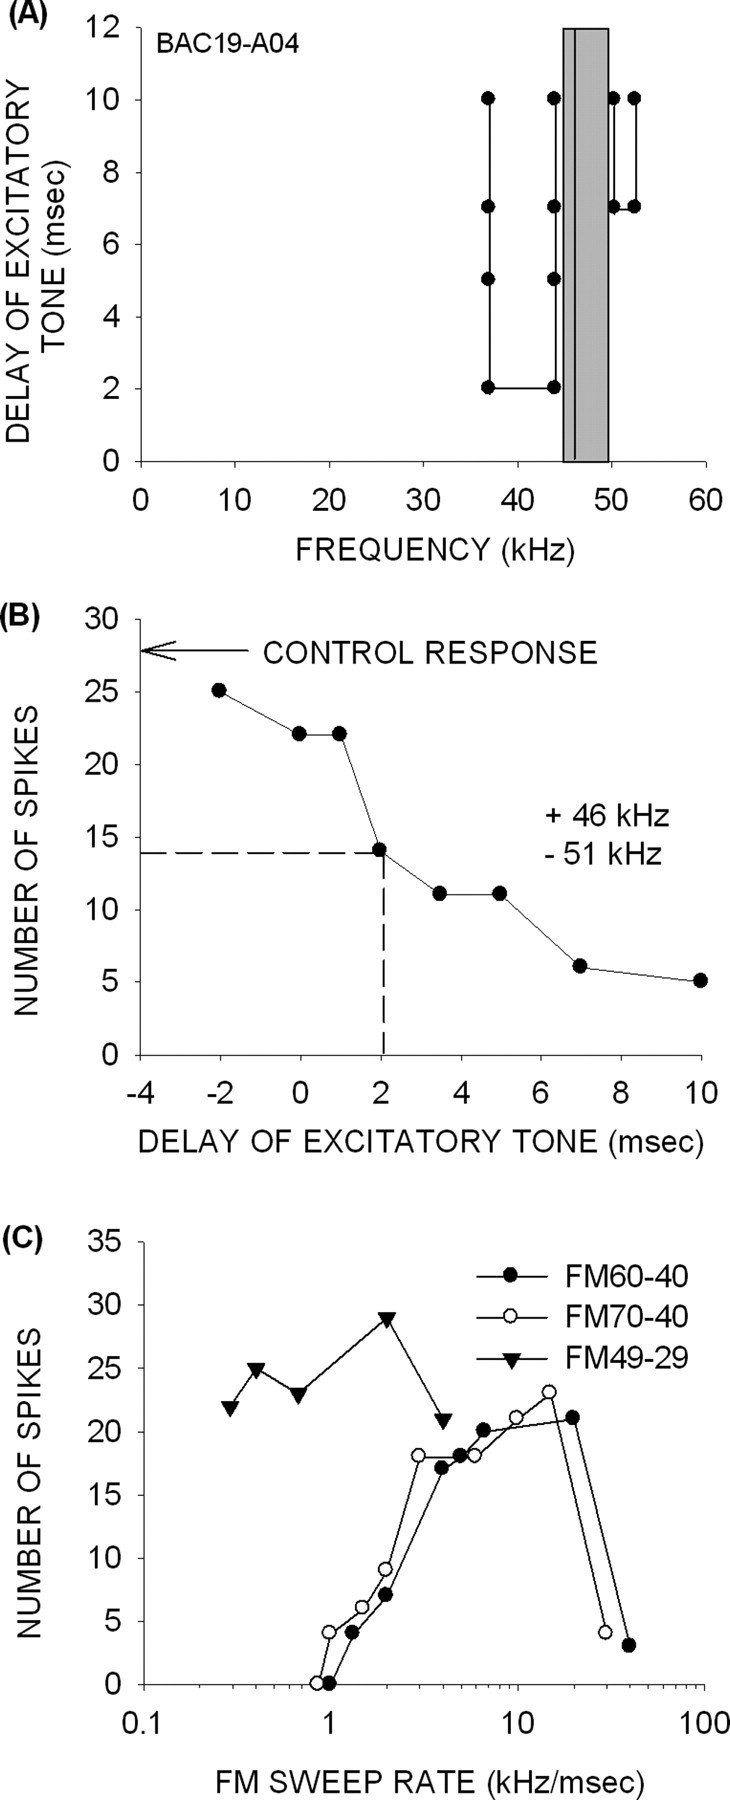
Mechanisms of FM rate selectivity in a 14-d-old pup. A, A neuron with BF of 46 kHz (vertical line) and excitatory tuning between 45 and 50 kHz (gray box). The BF tone had to be delayed by 7 ms with respect to HFI centered at 51 kHz for 80% inhibition to occur, showing that HFI arrived late. A band of LFI centered at 40 kHz arrived 2 ms late. B, The TTI curve shows that an inhibition of 50% from control response (arrow) was achieved when the excitatory tone (46 kHz) was delayed by 2 ms relative to the high-frequency inhibitory tone (51 kHz). The dashed lines indicate the delay at which response declines to 50% of control. C, The neuron was selective for the rate of downward FM sweeps that included the band of HFI (60–40 and 70–40 kHz). Rate selectivity was lost when the sweep excluded the HFI (49–29 kHz).
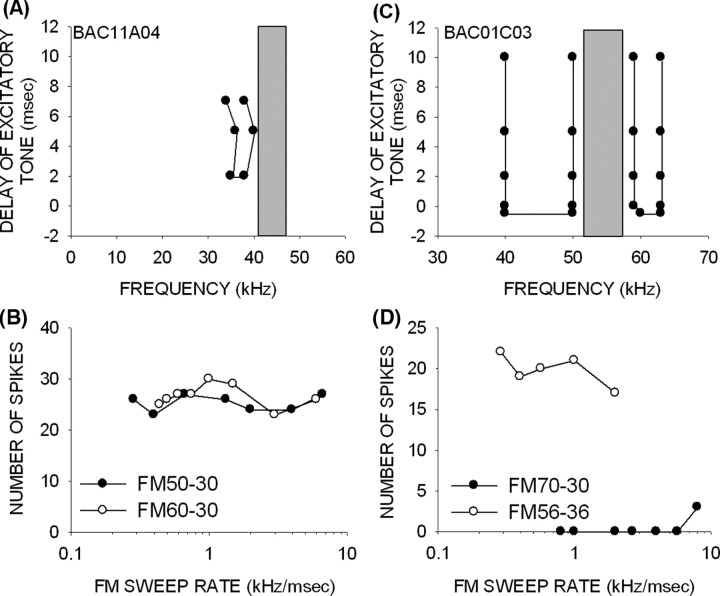
Also as in adults, all pup neurons without HFI (n = 17) were not sensitive to downward FM sweep rate (Fig. 6). The example neuron shown in Figure 6A did not exhibit HFI at any delay. The neuron was not selective for downward FM sweep rate at either of the sweep BWs tested (Fig. 6B).
Figure 6.
Importance of the presence and correct timing of HFI to rate selectivity for downward sweeps. A, B, A neuron (from a 43-d-old pup) without HFI was not selective for FM rates. The gray bar in A indicates the extent of the excitatory frequency tuning curve at the intensity with which the TTI test was performed. C, D, A neuron (from a 24-d-old pup) with fast HFI responded poorly to downward FM sweeps that included the HFI. The response was strong when the HFI was excluded from the downward sweep.
The neuron in Figure 6, C and D, illustrates the importance of the relative timing of excitatory and HFI input. This neuron, recorded from a 24-d-old bat, is unusual in that HFI arrived at the same time as excitation (Fig. 6C). Therefore, in a downward FM sweep, HFI would be expected to arrive before excitation and prevent a response. As expected, this neuron responded weakly to a downward sweep of 70–30 kHz only at the faster sweep rate tested (Fig. 6D). However, if HFI was eliminated from the downward sweep, as in a 56–36 kHz sweep (Fig. 6D), the neuron responded but, as expected, exhibited no rate selectivity.
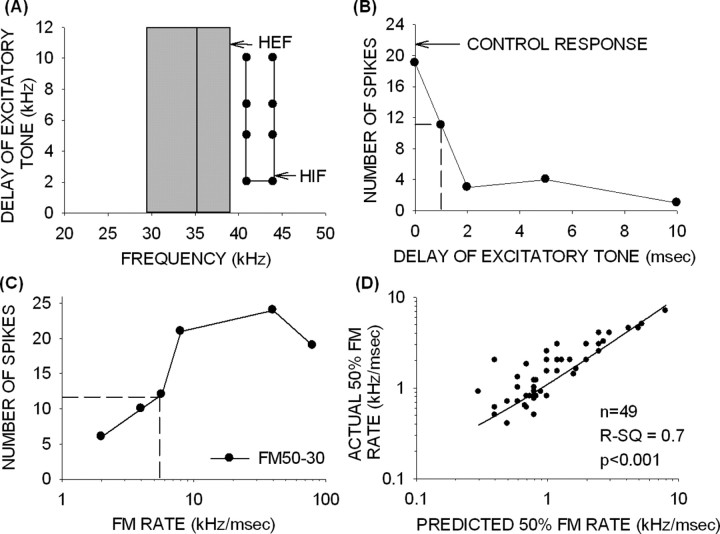
Finally, as in adults (Razak and Fuzessery, 2006), the BW and arrival time of HFI can be used to predict the 50% cutoff rate of downward FM rate-selective neurons in pups of all age classes. The prediction is explained using an example shown in Figure 7A–C. The equation used to predict the rate at which the response decreased to 50% of maximum for slower FM rates is as follows: 50% cutoff rate (kHz/ms) = (HIF − HEF)/(50% arrival time of inhibition), where HIF is the highest inhibitory frequency and HEF is the highest excitatory frequency. The 50% arrival time of inhibition was the delay between the excitatory and inhibitory frequencies that caused a 50% suppression of control response to the excitatory tone alone. The actual 50% cutoff was determined from the FM rate selectivity functions (Fig. 7C). In the example neuron (Fig. 7A), the difference between the HIF (44 kHz) and the HEF (39 kHz) was 5 kHz. The delay of inhibition that caused a 50% reduction in response to the excitatory tone was 1 ms (Fig. 7B). For downward FM sweeps faster than 5 kHz/1 ms (= 5 kHz/ms), excitation would occur before inhibition. In sweeps with rates slower than 5 kHz/ms, inhibition would occur before or together with excitation and reduce responses.
Figure 7.
Arrival time and BW of HFI predict 50% cutoff rate in pup neurons. A–C, An example used to illustrate the method used to predict the 50% cutoff rate. From the delay–frequency tuning curve of each neuron (A), the spectral distance between the HIF and the HEF was estimated. In this example, HIF − HEF was 5 kHz. From the TTI curve (B), the arrival time of inhibition that caused 50% suppression from control response was estimated. In this example, 50% arrival time was 1 ms. The predicted 50% cutoff rate for this neuron was 5 kHz/1 ms = 5 kHz/ms. The measured rate selectivity functions (C) show that the 50% cutoff for this neuron was 5.5 kHz/ms, supporting the prediction. The horizontal dashed line is the 50% response, and the vertical dashed line shows the time at which response decreased to 50% of control. D, A summary plot based on data from 49 pup cortical neurons shows a good correlation (r2 = 0.7; p < 0.001) between the predicted and actual 50% cutoff rates.
This prediction was quite accurate in this neuron (Fig. 7C). The actual 50% cutoff rate of this neuron was 5.5 kHz/ms. A similar prediction was made in 49 neurons in pups of all age groups in which the HFI BW, 50% arrival time, and rate selectivity data were available (Fig. 7D). There was a strong correlation (r2 = 0.7; p < 0.05) between the predicted and the actual 50% cutoff rates, adding support to the view that delayed HFI underlies downward FM rate selectivity in pup cortex, as it does in adult cortex.
The average arrival times and BWs of HFI were similar in pups and adults. HFI was delayed in almost all neurons with HFI in all age groups (Fig. 8A–C). The neuron shown in Figure 6, C and D, was the only exception. The mean ± SE arrival time of HFI was not different between any of the age groups (Fig. 8D, Table 2) (p > 0.05, one-way ANOVA, Tukey's test for post hoc pairwise comparisons). BW of HFI also displayed similar distributions (Fig. 8E–G) and mean values (Fig. 8H, Table 2) at all ages (p > 0.05, one-way ANOVA, Tukey's test for post hoc pairwise comparisons). As in adults, the BW of HFI was narrower than 5 kHz in >75% of neurons from 2 weeks onward. These data demonstrate that HFI shapes downward FM sweep rate selectivity and that the selectivity for sweep rate is adult-like in 2-week-old pups because properties of HFI are also adult-like at 2 weeks.
Figure 8.
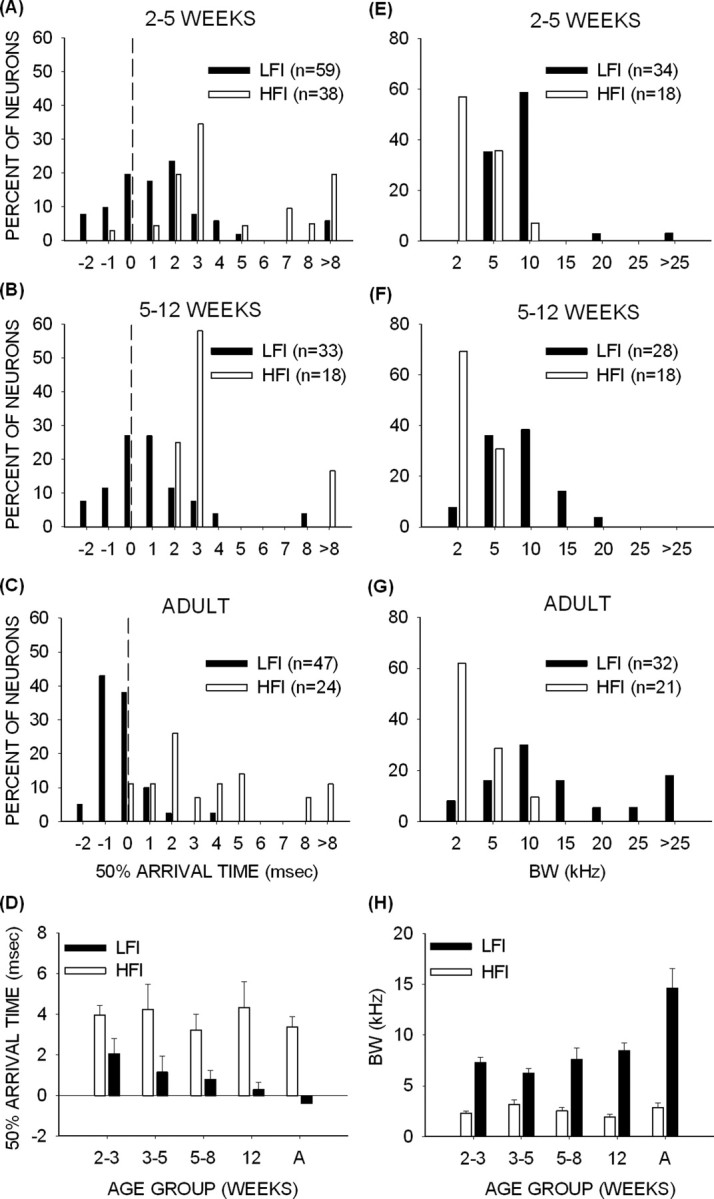
Development of arrival time and BW of LFI and HFI. A–C, Distribution of 50% arrival times at 2–5 weeks (A), 5–12 weeks (B), and in adults (C). The dashed vertical line indicates 0 ms arrival time. Negative (positive) delays show that inhibition arrived earlier (later) than excitation in the TTI test. It can be seen that most adult neurons had early LFI arrival times. The 2–5 week pups had more neurons with delayed LFI arrival times. The 5–12 week pups had nearly equal number of neurons with delayed and early LFI arrival times. HFI was delayed in almost all of the neurons in pup and adult cortex. D, The mean ± SE 50% arrival time during development shows that the average LFI arrival time became faster during development, whereas the HFI arrival time did not change significantly. E–G, Distribution of BW of inhibition at 2–5 weeks (E), 5–12 weeks (F), and in adults (G). More adult than pup neurons had LFI BW >10 kHz. The distribution of HFI BW was similar in pups and adults. H, The mean ± SE BW of inhibition during development shows that the LFI BW was on average broader in adults than pups. There was no difference in HFI BW between pups and adults. A, Adult.
Table 2.
Mean ± SE arrival time and bandwidth of HFI and LFI during development
| 2–3 weeks | 3–5 weeks | 5–8 weeks | 12 weeks | Adults | |
|---|---|---|---|---|---|
| HFI arrival time (ms) | 4 ± 0.45 | 4.2 ± 1.2 | 4.2 ± 1.4 | 4.3 ± 1.2 | 3.4 ± 0.5 |
| LFI arrival time (ms) | 2.1 ± 0.7 | 1.1 ± 0.8 | 1.1 ± 0.6 | 0.28 ± 0.3 | −0.4 ± 0.2 |
| HFI bandwidth (kHz) | 2.3 ± 0.2 | 3.4 ± 0.5 | 2 ± 0.3 | 2 ± 0.3 | 2.8 ± 0.4 |
| LFI bandwidth (kHz) | 7.2 ± 0.5 | 6.3 ± 0.5 | 6.7 ± 1.5 | 8.4 ± 0.8 | 14.6 ± 1.8 |
Mechanisms underlying FM direction selectivity become adult-like during development
In the adult cortex, selectivity for the downward sweep direction is created by a broad band of LFI that arrives earlier, or approximately the same time, as excitation (Razak and Fuzessery, 2006). Upward FM sweeps encountering the broad LFI band cause inhibitory inputs to arrive before excitation, resulting in suppressed responses. Two observations support this assertion. First, removal of LFI from the upward sweep by starting the sweep inside the excitatory tuning curve results in a loss of direction selectivity. Second, there is a strong correlation between the arrival time of inhibition and DSI. Most neurons with early LFI show strong direction selectivity, whereas neurons with delayed LFI exhibit poor direction selectivity.
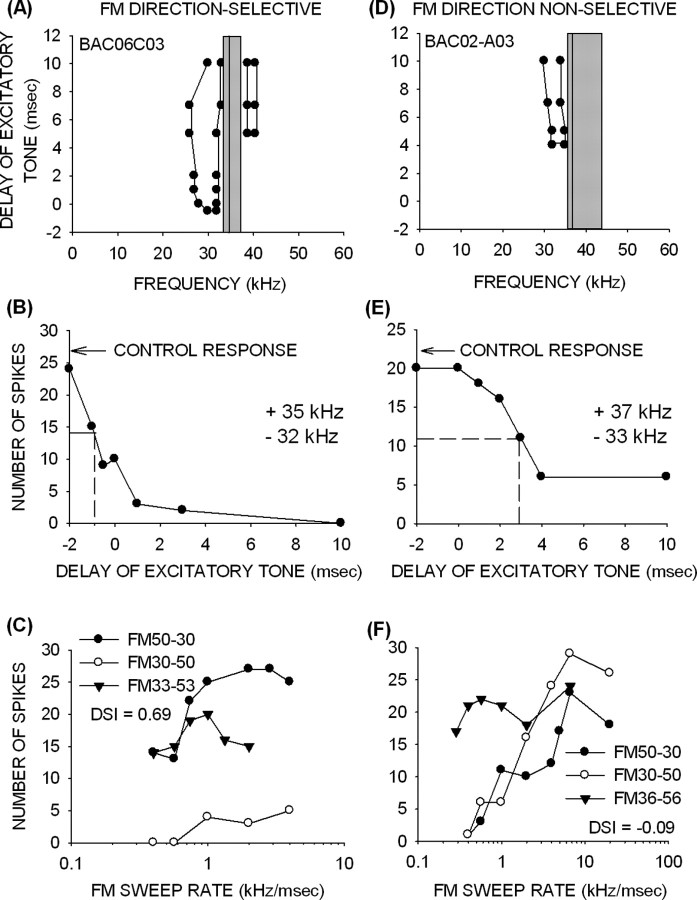
As in adults, pup cortical neurons with early LFI were direction selective (Fig. 9A–C). The TTI tuning curve from a 24-d-old pup (Fig. 9A) shows that a band of LFI centered at 31 kHz arrived 0.5 ms before excitation. The excitatory tone had to be advanced by 1 ms relative to the inhibitory tone to produce a reduction of 50% in response (Fig. 9B), demonstrating that LFI arrived earlier than excitation. This neuron was selective for FM sweep direction (Fig. 9C) (DSI of 0.69). An upward sweep that included the band of LFI (30–50 kHz) elicited weak responses. However, removal of the LFI from the upward sweep (33–53 kHz) resulted in a strong response to the upward sweep and, consequently, a loss of direction selectivity. This test was performed on 67 direction-selective neurons across all age classes; in 96% (n = 64), the elimination of LFI from an upward sweep resulted in a strong response to the sweep. This test provides evidence that LFI was responsible for creating selectivity for a downward FM sweep direction.
Figure 9.
Mechanisms of direction selectivity. A, A neuron (from a 24-d-old pup) with an early arriving band of LFI centered at 31 kHz. The HFI arrived 5 ms late. B, The response was suppressed to 50% of control even when the excitatory tone was presented 1 ms earlier than the inhibitory tone, showing that inhibition generated by the 32 kHz tone arrived early. C, This neuron was direction selective, with DSI of 0.69. The upward sweep that included the LFI (30–50 kHz) elicited weak responses. However, responses to an upward FM sweep that excluded the LFI (33–53 kHz) were within 30% of maximum response to the downward sweep. D, A neuron (from a 18-d-old pup) with delayed LFI. The LFI centered at 33 kHz was delayed by at least 4 ms after the excitatory input. E, A 50% suppression of response to the excitatory tone was produced only when the inhibitory tone was advanced by 3 ms. F, This neuron was not direction selective (DSI of −0.09) but was rate selective for the upward sweeps that included the LFI (30–50 kHz). Starting the upward sweep inside the excitatory tuning curve (36–56 kHz) caused rate selectivity for upward sweeps to be eliminated (F). The vertical gray bars in A and D illustrate the excitatory frequency tuning at the intensity at which the TTI test was conducted. The vertical lines in A and D indicate the BF of the neuron. Dashed lines in B and E indicate the arrival time of 50% inhibition.
Neurons with delayed LFI were not direction selective. In the example shown (Fig. 9D), the band of LFI centered at 33 kHz was delayed. Inhibition of 50% was observed when the excitatory tone was delayed by 3 ms (Fig. 9E). This neuron was classified as nonselective for sweep direction (DSI of −0.09), because the maximum response to upward and downward FM sweeps was similar (Fig. 9F). The response of this neuron to upward sweeps declined for slow rates. The rate selectivity for upward sweeps is attributable to the delayed LFI because elimination of LFI (36–56 kHz sweep) from the upward sweep eliminates rate selectivity for the upward sweep. This is the same mechanism that creates rate selectivity for downward sweeps. All neurons (n = 30, across all pup age groups) with delayed LFI exhibited rate-selective response to upward sweeps and the exclusion of the LFI from the upward sweep eliminated rate selectivity in all of these neurons.
Finally, a few pup neurons (n = 7) had no LFI. As expected, none of these neurons were direction selective. The neuron shown in Figure 10 exhibited delayed HFI, but none of the frequencies below the BF were inhibitory at any delay (Fig. 10A). This neuron responded equally well to both the upward and downward sweeps (Fig. 10B). These data suggest that the presence of an early LFI is critical for direction selectivity.
Figure 10.
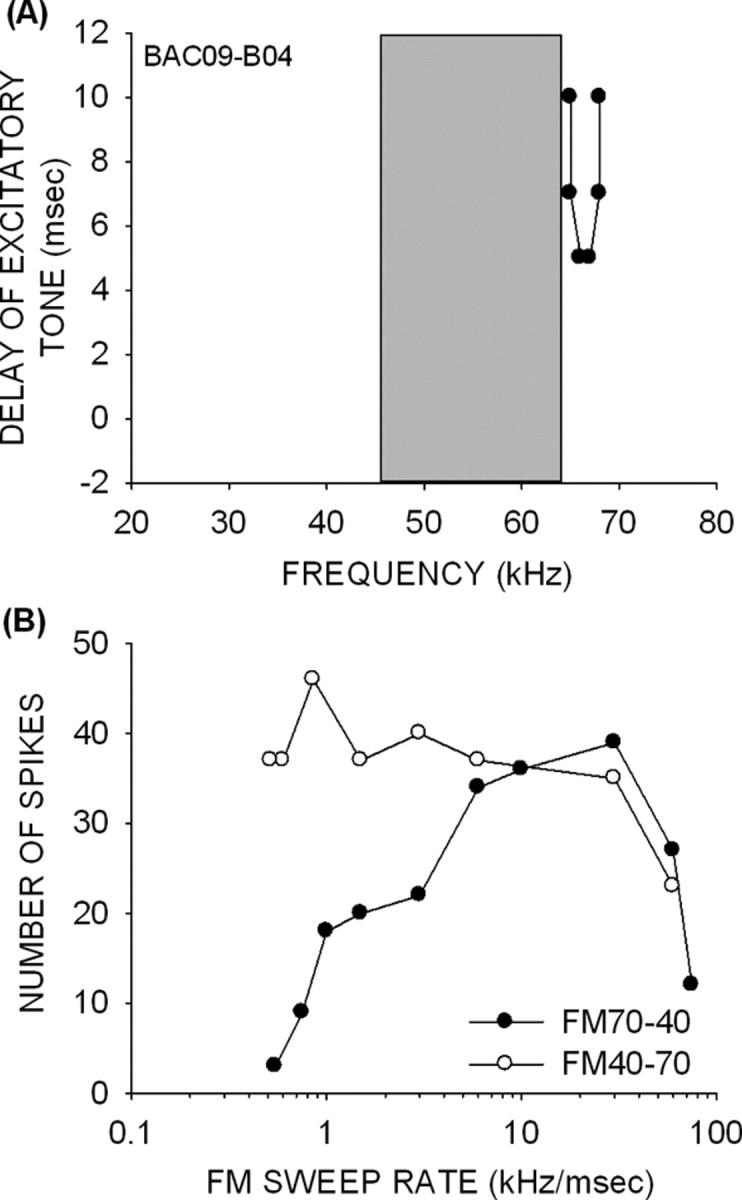
A neuron (from a 49-d-old pup) without LFI (A) and with poor direction selectivity (B).
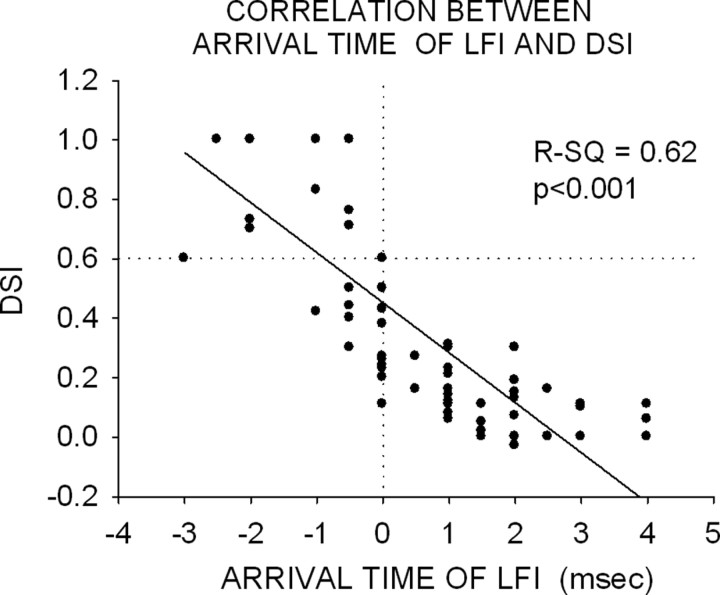
A strong correlation was observed between arrival time of LFI and DSI (Fig. 11) (r2 = 0.62; p < 0.05, all pup neurons pooled together). All neurons with delayed arrival time of LFI had DSIs <0.6. Most neurons with an early arrival time of LFI had DSIs >0.6. This correlation was similar to that observed in adult cortex (Razak and Fuzessery, 2006). However, a significantly higher percentage of neurons with delayed LFI were found in the pups than in the adults (Fig. 8A–C) (χ2 test, p < 0.001). In pups, 57% of neurons (n = 53, across all age groups) exhibited delayed LFI compared with 15% (n = 40) in adults. The average arrival time of LFI became faster between 2 and 3 weeks and adulthood (Fig. 8D, Table 2). In pups, the mean ± SE arrival time was slower in the 2–3 and 3–5 week age groups compared with adults (Fig. 8D) (p < 0.05, one-way ANOVA, Tukey's test for post hoc pairwise comparisons). Although a trend was observed for a decrease from the 2–3 week to 3–5 and 5–8 week groups, the differences were not significant (p > 0.05). Similarly, no difference was observed between the 5–8 week, 12 week, and adult groups (p > 0.05). These data suggest that the average arrival time of LFI is slow at 2–5 weeks and becomes adult-like after 5 weeks.
Figure 11.
Arrival time of LFI is correlated with direction selectivity. The vertical dotted line separates neurons with early and delayed arrival time of LFI. The horizontal dotted line separates neurons with <20% response to upward versus the downward FM sweeps (DSI >0.6) from neurons whose responses to the two sweep directions were within 80% of each other (DSI <0.6). The figure shows data from all pup age groups. The arrival time of inhibition is the two-tone delay at which an inhibition of 50% of control response occurs. A strong correlation exists between arrival time of LFI and DSI. Importantly, most neurons with early arrival time had DSIs >0.6, and all neurons with delayed arrival time had DSIs <0.6.
Another property of LFI that is important for direction selectivity is the BW (Razak and Fuzessery, 2006). This is because, for a given sweep rate, the broader the BW of LFI, the earlier the inhibitory frequencies will be encountered by an upward sweep. This will translate into earlier arrival of LFI relative to excitation. In adults, the BW of LFI in nearly 75% of neurons (n = 36) was broader than 10 kHz (Fig. 8G). In pups, however, the BW of LFI was broader than 10 kHz in only 25% of neurons (n = 60, across all pup age groups). The difference between the two groups was significant (χ2 test, p < 0.01). The mean BW of LFI in each pup age group was different from adults (Fig. 8H, Table 2) (p < 0.05, one-way ANOVA, Tukey's test for post hoc pairwise comparisons). Unlike the arrival time, the BW of inhibition in the 12-week-old pups was similar to the BW in younger pups.
Finally, to determine changes in the absolute arrival times of excitatory and inhibitory inputs during development, the latency (average first spike latency) of the response to the BF tone was compared across different age groups (Fig. 12A). There was no difference in response latency between any two age groups or between pups and adults (p > 0.05, one-way ANOVA, Tukey's test for post hoc pairwise comparisons). These data suggest that the changes in relative arrival time of inhibitory inputs during development (Fig. 8D, Table 2) are not attributable to changes in the latency of response to excitatory tones. The invariance of latency in the pallid bat cortex during the developmental time period studied is in contrast to observations made in the cat cortex, in which response latency decreased to adult-like values after 3 weeks of age (Blatchley and Brugge, 1990).
Figure 12.
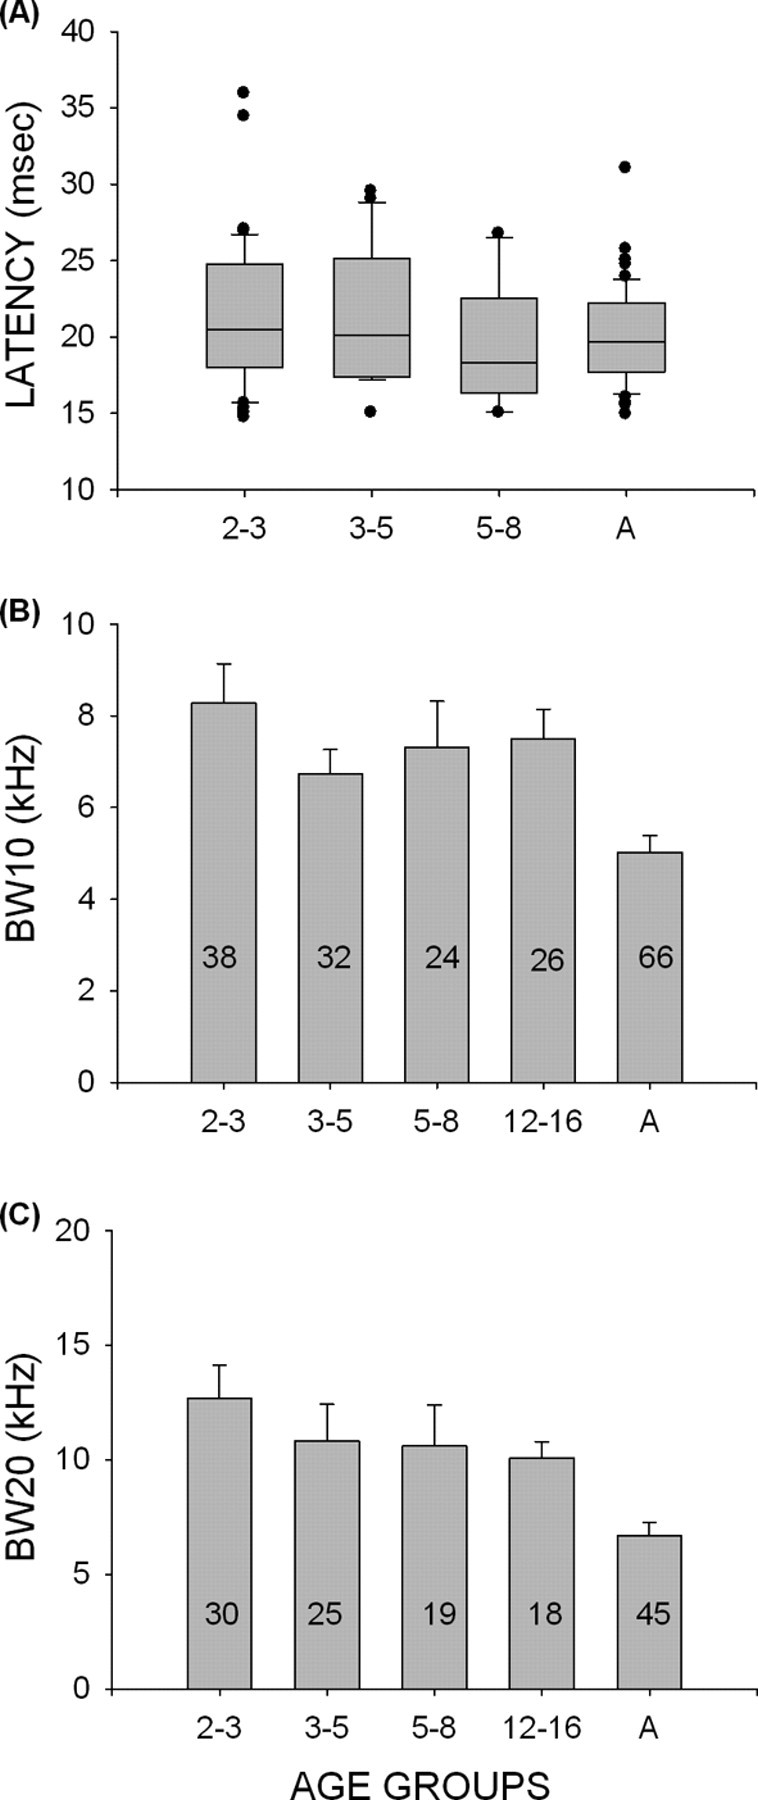
Development of excitatory latency and frequency tuning BW. A, The average first spike latency of response to the BF tone at 5–15 dB above threshold was not different between any of the age groups studied, including adults. B, C, Development of excitatory frequency tuning BW. At both 10 dB (B) and 20 dB (C) above minimum threshold for tones, the range of frequencies that elicited excitatory response was narrower in adults than in 2- to 3-week-old pups. The sample size (number of neurons) is shown inside the corresponding bar. A, Adult.
In summary, these data show that LFI shapes direction selectivity and that the properties of LFI are immature in pups. The developmental time courses of the arrival time of LFI, the percentage of direction-selective neurons, and DSI all follow similar trajectories. In addition, the increase in the BW of LFI from 2 weeks to adulthood will also contribute to the emergence of adult-like direction selectivity.
Other response properties
Properties such as excitatory frequency tuning BW and complexity of inhibitory frequency bands are not necessarily involved in shaping selectivity for sweep rate or direction, but they have been studied in the auditory cortices of other species (Eggermont, 1996; Zhang et al., 2001; Bonham et al., 2004; Pienkowski and Harrison, 2005). Here we provide developmental data from the pallid bat for comparison with data from other species. Excitatory frequency tuning BWs were determined at 10 and 20 dB above minimum thresholds. At both intensities, the average BW of the excitatory frequency tuning curve in the 2–3 week pup age group was significantly broader than in adults (Fig. 12B,C) (p < 0.001, one-way ANOVA, Tukey's test for post hoc pairwise comparisons). The 20 dB BW was also broader in the 3–5 week group compared with adults. All other pairwise comparisons revealed no significant differences, suggesting that excitatory BW at 10 dB above threshold was adult- like from 3 to 5 weeks, and the BW at 20 dB above threshold was adult-like from 5 to 8 weeks. As seen in other sensory systems, this shows that excitatory receptive field is refined during development in the auditory cortex of the pallid bat.
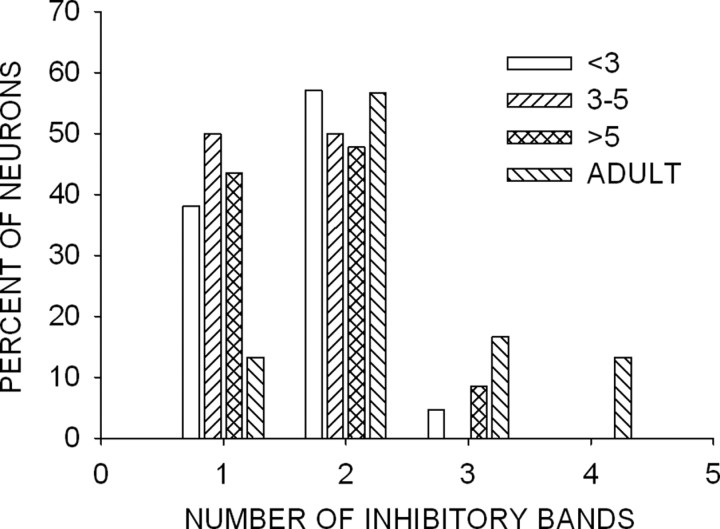
Neurons in the auditory cortex can exhibit complex inhibitory domains composed of several bands of inhibitory frequencies (Suga, 1965b; Kanwal et al., 1999; Loftus and Sutter, 2001). It is not known whether the adult-like number of inhibitory bands is present at hearing onset or whether its development is protracted. Pienkowski and Harrison (2005) reported that the complexity of cortical receptive fields increases during development in the chinchilla. In the pallid bat, adult cortical neurons can display as many as four discrete bands of inhibitory frequencies (Fig. 13). Nearly 50% of pup neurons had only one band of inhibitory frequencies (Fig. 6A) compared with only 12% in adults. The percentage of neurons with two bands of inhibition was similar across all pup age groups and adults (Fig. 5A). A higher percentage of adult cortical neurons exhibited more than three bands of inhibition. In nearly 50% (14 of 30) of adult cortical neurons, a band of inhibition was centered at 10–15 kHz (Razak and Fuzessery, 2006). However, only 3 of 56 (5%) neurons displayed a band of inhibition with frequencies below 30 kHz in pups (all age groups combined). These data show that the full complement of inhibitory frequencies in cortical neurons tuned in the echolocation range is not present in pups. Rather, this complexity develops at least 3 weeks after the emergence of the full audible range, leaving open the possibility that experience influences the development of inhibitory receptive fields.
Figure 13.
Developmental changes in the complexity of inhibitory frequencies. The histogram shows the percentage of neurons with one to four bands of inhibitory frequencies at all age groups.
Discussion
The main finding of this study is that there are temporal differences in the development of the inhibitory mechanisms that shape FM rate and direction selectivity. The HFI that shapes FM rate selectivity is adult-like at 2–3 weeks. In contrast, the LFI that shapes selectivity for the downward sweep direction emerges more slowly; arrival time is adult-like at 5 weeks, and BW is at 12 weeks. These differences in the development of LFI and HFI (Fig. 14) parallel different developmental time courses of rate and direction selectivity.
Figure 14.
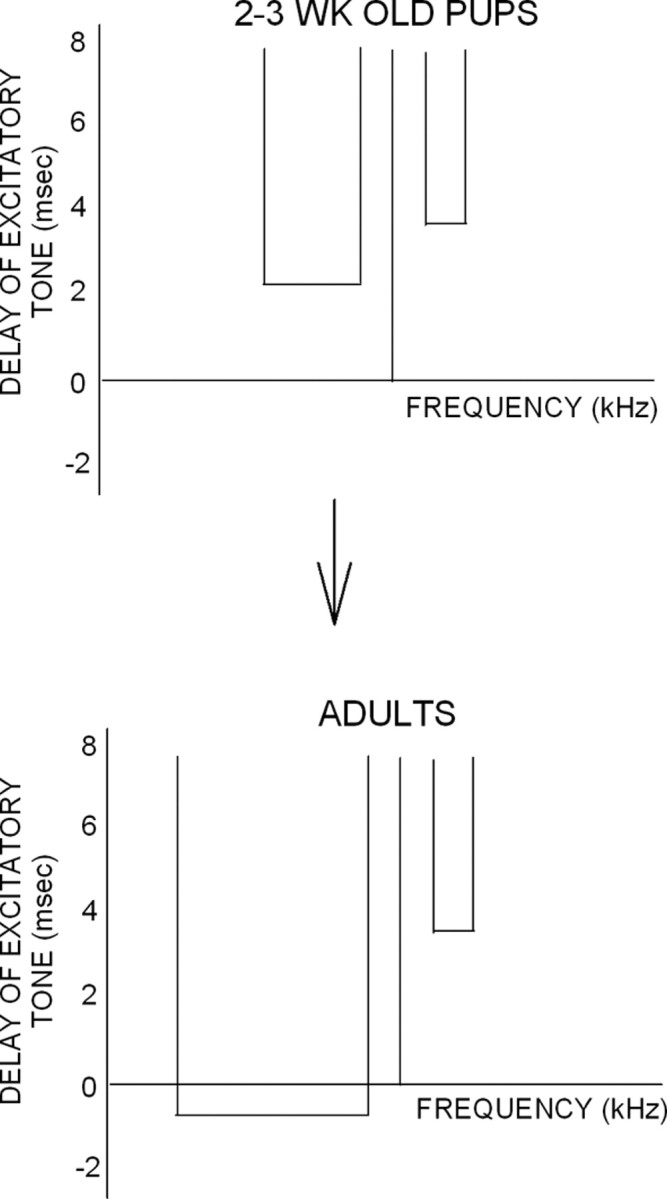
Schematic of asymmetric changes in the inhibitory receptive fields of cortical neurons during development. The arrival time and BW of HFI are adult-like from 2–3 weeks onward. On average, the arrival time of LFI becomes faster, and BW becomes broader between 2–3 weeks and adulthood. These differences in the developmental time course of HFI and LFI underlie differences in the development of FM rate and direction selectivity. Vertical lines represent the best frequency.
Hearing onset in the pallid bat occurs at 1 week, but the full audible range (5–80 kHz) is not represented until 2 weeks (Brown et al., 1978). Echolocation in flight occurs after 5–6 weeks (Brown, 1976). Thus, adult-like rate selectivity is present when pups first hear echolocation frequencies and well before their echolocation behavior matures. Adult echolocation calls contain downward FM sweeps with frequencies between 60 and 30 kHz, BWs between 20 and 30 kHz, and durations of 1.5–6 ms, corresponding to sweep rates between 5–20 kHz/ms. In 2- to 3-week-old pups, best FM rates were mostly between 2–12 kHz/ms, suggesting that experience with echolocation is not required for the development of the inhibitory mechanisms that shape adult-like rate selectivity.
In contrast, direction selectivity and the underlying LFI properties are slower to mature. The advancement of arrival times and broadening of BWs is critical for the emergence of selective responses to downward sweeps. The percentage of direction-selective neurons and the average DSI do not reach adult levels until 12 weeks, more than 1 month after pallid bats have taken flight. Because these pups were raised in cages, this long delay in the development of direction selectivity may be attributable to a lack of experience with echolocation. However, pups raised in a flight room and using echolocation showed a similar lack of adult-like direction selectivity at comparable ages (our unpublished observations), suggesting that experience with echolocation does not hasten development.
The development of direction selectivity may have both experience-independent and -dependent components. In the auditory forebrain of the chick (Heil et al., 1992) and rat (Zhang et al., 2003), direction selectivity varies with tonotopy. Low-frequency neurons are selective for upward sweeps, whereas those tuned to the upper end of the audible range prefer downward sweeps. In the rat, this selectivity is correlated with a weaker excitatory input and a stronger inhibitory input generated in the nonpreferred sweep direction (Zhang et al., 2003). This frequency-dependent asymmetry in excitatory and inhibitory inputs may result, in part, from experience-independent, topographically organized projections. If this is also the case in the pallid bat auditory cortex, it may explain the downward direction selectivity of cortical neurons representing the upper end of the audible range in the youngest bats tested. Moreover, none of these neurons were selective for sweeps in the upward direction, adding weight to the notion of an innate bias in topographic organization underlying the initial levels of direction selectivity.
The slow emergence of adult-like direction selectivity may result from the shaping of LFI properties by experience (Gao et al., 1999; Chang et al., 2005; Hensch and Fagiolini, 2005). One possible mechanism driving experience-dependent development of direction selectivity is spike-timing-dependent plasticity (STDP). In the visual system, direction selectivity can be shaped in optic tectum neurons by repeated presentation of stimuli moving in certain directions (Engert et al., 2002). Interestingly, the emergence of direction selectivity was dependent on the rate of stimulus movement, suggesting that the precise timing of presynaptic and postsynaptic activity was important for the development of direction selectivity.
During development of the pallid bat, the dominant patterned input to neurons tuned to echolocation pulses is likely to be downward FM sweeps. STDP mechanisms would favor the coincident presynaptic events created when arrival times of differentially tuned inputs are the inverse of their occurrence in a downward sweep, i.e., early low-frequency and delayed high-frequency input would be favored. Thus, repeated exposure to downward FM sweeps would favor inhibitory inputs that prevent responses to upward FM sweeps. In the tectum, glutamatergic inputs acting through NMDA receptors were asymmetrically modified to produce direction selectivity through well known Hebbian mechanisms (Mu and Poo, 2006). In the pallid bat cortex, however, it may be the strength of inhibitory inputs that are modified. How STDP mechanisms would operate at inhibitory synapses is less clear (but see Woodin et al., 2003).
General mechanisms underlying the development of vocalization selectivity
Present results, although focusing on the development of the neural circuitry serving echolocation, have a general applicability to studies of vocalization selectivity. The simple downward FM sweep of the echolocation pulse, despite its ultrasonic frequencies, can be considered an element of more complex vocalizations, because most communication signals contain FM components. The development of selectivity for species-specific vocalizations can be experience dependent, as is well documented in songbirds (Doupe and Konishi, 1991; Solis and Doupe, 2000). Inhibitory mechanisms play an important role in sensory system development in general (Humphrey and Saul, 1998; Zheng and Knudsen, 1999; Vale et al., 2003; Hensch and Fagiolini, 2005; Razak and Pallas, 2006) and vocalization selectivity in particular (Lewicki, 1996; Klug et al., 2002; Rosen and Mooney, 2003, 2006; Narayan et al., 2005). Our results show that plasticity in the timing and BW of inhibitory inputs underlies the development of selectivity for FM signals. Differences of a few milliseconds in the arrival time of sideband inhibition can have a significant impact on whether a neuron develops direction selectivity and for which sweep direction it will become selective. Similarly, the delay in the arrival of sideband inhibition, coupled with the BW of the sideband, shapes FM rate selectivity (Fig. 6C,D). Thus, small changes in the spectrotemporal properties of inhibitory inputs during development can create spectrotemporal filters for FM rate and direction. Plasticity in timing and BW of inhibitory inputs may prove to be a common mechanism for generating vocalization-selective neurons.
Comparisons with previous studies of cortical development
The development of spectrotemporal properties of inhibitory sidebands in the auditory cortex has been studied previously only in the rat (Chang et al., 2005). A comparison of this development in the rat and the pallid bat shows that inhibition undergoes considerable change, but the nature of this change differs. In the rat, the inhibitory BW narrows during development. In the pallid bat, at least within the cortical region serving echolocation, the change is asymmetrical. LFI BW broadens, whereas that of HFI does not change. These results suggest that there is not just one trend during the development of inhibitory inputs; inhibitory sidebands may sharpen or broaden, depending on the ultimate function of the cortical region. Both of these studies were conducted under barbiturate anesthesia, a condition that may raise concerns regarding possible changes in the strength of inhibition attributable to anesthesia during development. From these two studies, we can at least state that, if there is such an effect, it does not bias inhibitory BWs in a particular direction. Moreover, unless barbiturates influence various inhibitory frequencies differently, the main result of our study that properties of LFI, but not HFI, change during development is unlikely to be an artifact of barbiturate anesthesia.
The development of cortical excitatory frequency selectivity has been studied in several species (Eggermont, 1996; Zhang et al., 2001; Bonham et al., 2004; Pienkowski and Harrison, 2005). In the rat, cat, and chinchilla cortex, excitatory BWs continue to change during development. In the cat, frequency selectivity broadens with age. In the chinchilla cortex, the complexity of receptive field properties increases with age, with more adult neurons exhibiting multiple excitatory frequencies. In the rat, frequency selectivity sharpens. In the pallid bat, adult-like excitatory frequency tuning BWs at 10 dB above threshold are present at 3 weeks, whereas adult-like BWs at 20 dB require 5 weeks. These comparative data suggest that the development of cortical excitatory receptive fields in different species follows different time courses and may be differentially susceptible to developmental experience. They also indicate that excitatory tuning curves may either sharpen or broaden during development, varying by species and perhaps by cortical region within a species.
Implications for development of speech processing
These data have implications for understanding impairments of FM sweep processing. Deficits in the temporal interactions across frequency channels may underlie problems such as specific language impairments in humans (Merzenich et al., 1996). The knowledge of how these deficits develop, and how training with FM sweeps alleviates them, is important for clinical intervention. Present results suggest that small errors in the timing or BW of inhibitory inputs could result in deficits in processing FM sweeps. The knowledge of mechanisms underlying selectivity for FM sweeps in adult bats, and the normal development of these mechanisms, make the pallid bat a useful model for investigating how experience shapes FM sweep processing. Future studies will address the consequences of deprivation of normal echolocation experience on the development of inhibitory circuits underlying FM sweep selectivity.
Footnotes
This research was supported by National Institute on Deafness and Other Communication Disorders Grant DC05202 and IDeA Network of Biomedical Research Excellence Grant P20 RR0 16474-04. We thank T. Zumsteg for valuable comments on this manuscript, D. Richardson and J. Shaw for participating in various stages of this study, and G. McLellan for programming the software required for this study.
References
- Blatchley BJ, Brugge JF. Sensitivity to binaural intensity and phase differences in kitten inferior colliculus. J Neurophysiol. 1990;64:582–597. doi: 10.1152/jn.1990.64.2.582. [DOI] [PubMed] [Google Scholar]
- Bonham BH, Cheung SW, Godey B, Schreiner CE. Spatial organization of frequency response areas and rate/level functions in the developing AI. J Neurophysiol. 2004;91:841–854. doi: 10.1152/jn.00017.2003. [DOI] [PubMed] [Google Scholar]
- Brosch M, Schreiner CE. Time course of forward masking tuning curves in cat primary auditory cortex. J Neurophysiol. 1997;77:923–943. doi: 10.1152/jn.1997.77.2.923. [DOI] [PubMed] [Google Scholar]
- Brown P. Vocal communication in the pallid bat, Antrozous pallidus. Z Tierpsychol. 1976;41:34–54. doi: 10.1111/j.1439-0310.1976.tb00469.x. [DOI] [PubMed] [Google Scholar]
- Brown P, Grinnell AD, Harrison J. The development of hearing in the pallid bat, Antrozous pallidus. J Comp Physiol A Neuroethol Sens Neural Behav Physiol. 1978;126:169–182. [Google Scholar]
- Calford MB, Semple MN. Monaural inhibition in cat auditory cortex. J Neurophysiol. 1995;73:1876–1891. doi: 10.1152/jn.1995.73.5.1876. [DOI] [PubMed] [Google Scholar]
- Capranica RR. Why auditory neurophysiologists should be more interested in animal sound communication. Physiologist. 1972;15:55–60. [PubMed] [Google Scholar]
- Chang EF, Bao S, Imaizumi K, Schreiner C, Merzenich MM. Development of spectral and temporal response selectivity in the auditory cortex. Proc Natl Acad Sci USA. 2005;102:16460–16465. doi: 10.1073/pnas.0508239102. [DOI] [PMC free article] [PubMed] [Google Scholar]
- Doupe AJ. Song- and order-selective neurons in the songbird anterior forebrain and their emergence during vocal development. J Neurosci. 1997;17:1147–1167. doi: 10.1523/JNEUROSCI.17-03-01147.1997. [DOI] [PMC free article] [PubMed] [Google Scholar]
- Doupe AJ, Konishi M. Song-selective auditory circuits in the vocal control system of the zebra finch. Proc Natl Acad Sci USA. 1991;88:11339–11343. doi: 10.1073/pnas.88.24.11339. [DOI] [PMC free article] [PubMed] [Google Scholar]
- Eggermont JJ. Differential maturation rates for response parameters in cat primary auditory cortex. Aud Neurosci. 1996;2:309–327. [Google Scholar]
- Engert F, Tao HW, Zhang LI, Poo MM. Moving visual stimuli rapidly induce direction sensitivity of developing tectal neurons. Nature. 2002;419:470–475. doi: 10.1038/nature00988. [DOI] [PubMed] [Google Scholar]
- Fuzessery ZM. Monaural and binaural spectral cues created by the external ears of the pallid bat. Hear Res. 1996;95:1–17. doi: 10.1016/0378-5955(95)00223-5. [DOI] [PubMed] [Google Scholar]
- Fuzessery ZM, Feng AS. Mating call selectivity in the thalamus and midbrain of the leopard frog (Rana p. pipiens): single and multiunit responses. J Comp Physiol A Neuroethol Sens Neural Behav Physiol. 1983;150:333–344. [Google Scholar]
- Fuzessery ZM, Hall JC. The role of GABA in shaping frequency tuning and selectivity for FM sweep direction in the inferior colliculus. J Neurophysiol. 1996;76:1059–1073. doi: 10.1152/jn.1996.76.2.1059. [DOI] [PubMed] [Google Scholar]
- Fuzessery ZM, Gumtow RG, Lane R. A microcomputer-controlled system for use in auditory physiology. J Neurosci Methods. 1991;36:45–52. doi: 10.1016/0165-0270(91)90136-n. [DOI] [PubMed] [Google Scholar]
- Fuzessery ZM, Richardson MD, Coburn MS. Neural mechanisms underlying selectivity for the rate and direction of frequency-modulated sweeps in the inferior colliculus of the pallid bat. J Neurophysiol. 2006;96:1320–1336. doi: 10.1152/jn.00021.2006. [DOI] [PubMed] [Google Scholar]
- Gao WJ, Newman DE, Wormington AB, Pallas SL. Development of inhibitory circuitry in visual and auditory cortex of postnatal ferrets: immunocytochemical localization of GABAergic neurons. J Comp Neurol. 1999;409:261–273. doi: 10.1002/(sici)1096-9861(19990628)409:2<261::aid-cne7>3.0.co;2-r. [DOI] [PubMed] [Google Scholar]
- Glass I, Wollberg Z. Auditory cortex responses to sequences of normal and reversed squirrel monkey vocalizations. Brain Behav Evol. 1983;22:13–21. doi: 10.1159/000121503. [DOI] [PubMed] [Google Scholar]
- Gordon M, O'Neill WE. Temporal processing across frequency channels by FM selective auditory neurons can account for FM rate selectivity. Hear Res. 1998;122:97–108. doi: 10.1016/s0378-5955(98)00087-2. [DOI] [PubMed] [Google Scholar]
- Hart HC, Palmer AR, Hall DA. Amplitude and frequency-modulated stimuli activate common regions of human auditory cortex. Cereb Cortex. 2003;13:773–781. doi: 10.1093/cercor/13.7.773. [DOI] [PubMed] [Google Scholar]
- Heil P, Rajan R, Irvine DRF. Sensitivity of neurons in cat primary auditory cortex to tones and frequency modulated stimuli. II. Organization of response properties along the “isofrequency” dimension. Hear Res. 1992;63:135–156. doi: 10.1016/0378-5955(92)90081-w. [DOI] [PubMed] [Google Scholar]
- Hensch TK, Fagiolini M. Excitatory-inhibitory balance and critical period plasticity in developing visual cortex. Prog Brain Res. 2005;147:115–124. doi: 10.1016/S0079-6123(04)47009-5. [DOI] [PubMed] [Google Scholar]
- Humphrey AL, Saul AB. Strobe rearing reduces direction selectivity in area 17 by altering spatiotemporal receptive-field structure. J Neurophysiol. 1998;80:2991–3004. doi: 10.1152/jn.1998.80.6.2991. [DOI] [PubMed] [Google Scholar]
- Kanwal JS, Fitzpatrick DC, Suga N. Facilitatory and inhibitory frequency tuning of combination-sensitive neurons in the primary auditory cortex of mustached bats. J Neurophysiol. 1999;82:2327–2345. doi: 10.1152/jn.1999.82.5.2327. [DOI] [PubMed] [Google Scholar]
- Klug A, Bauer EE, Hanson JT, Hurley L, Meitzen J, Pollak GD. Response selectivity for species-specific calls in the inferior colliculus of Mexican free-tailed bats is generated by inhibition. J Neurophysiol. 2002;88:1941–1954. doi: 10.1152/jn.2002.88.4.1941. [DOI] [PubMed] [Google Scholar]
- Kowalski N, Versnel H, Shamma SA. Comparison of responses in the anterior and primary auditory fields of the ferret cortex. J Neurophysiol. 1995;73:1513–1523. doi: 10.1152/jn.1995.73.4.1513. [DOI] [PubMed] [Google Scholar]
- Lewicki MS. Intracellular characterization of song-specific neurons in the zebra finch auditory forebrain. J Neurosci. 1996;16:5854–5863. [PubMed] [Google Scholar]
- Loftus WC, Sutter ML. Spectrotemporal organization of excitatory and inhibitory receptive fields of cat posterior auditory field neurons. J Neurophysiol. 2001;86:475–491. doi: 10.1152/jn.2001.86.1.475. [DOI] [PubMed] [Google Scholar]
- Margoliash D. Preference for autogenous song by auditory neurons in a song system nucleus of the white-crowned sparrow. J Neurosci. 1986;6:1643–1661. doi: 10.1523/JNEUROSCI.06-06-01643.1986. [DOI] [PMC free article] [PubMed] [Google Scholar]
- Mendelson JR, Schreiner CE, Sutter ML, Grasse KL. Functional topography of cat primary auditory cortex: responses to frequency-modulated sweeps. Exp Brain Res. 1993;94:65–87. doi: 10.1007/BF00230471. [DOI] [PubMed] [Google Scholar]
- Merzenich MM, Jenkins WM, Johnston P, Schreiner C, Miller SL, Tallal P. Temporal processing deficits of language-learning impaired children ameliorated by training. Science. 1996;271:77–81. doi: 10.1126/science.271.5245.77. [DOI] [PubMed] [Google Scholar]
- Mu Y, Poo MM. Spike-timing dependent LTP/LTD mediates visual experience-dependent plasticity in a developing retinotectal system. Neuron. 2006;50:115–125. doi: 10.1016/j.neuron.2006.03.009. [DOI] [PubMed] [Google Scholar]
- Narayan R, Ergun A, Sen K. Delayed inhibition in cortical receptive fields and the discrimination of complex stimuli. J Neurophysiol. 2005;94:2970–2975. doi: 10.1152/jn.00144.2005. [DOI] [PubMed] [Google Scholar]
- Nelken I, Versnel H. Responses to linear and logarithmic frequency-modulated sweeps in ferret primary auditory cortex. Eur J Neurosci. 2000;12:549–562. doi: 10.1046/j.1460-9568.2000.00935.x. [DOI] [PubMed] [Google Scholar]
- Ohlemiller KK, Kanwal JS, Suga N. Facilitative responses to species-specific calls in cortical FM-FM neurons of the mustached bat. NeuroReport. 1996;7:1749–1755. doi: 10.1097/00001756-199607290-00011. [DOI] [PubMed] [Google Scholar]
- O'Neill WE, Brimijoin WO. Directional selectivity for FM sweeps in the suprageniculate nucleus of the mustached bat medial geniculate body. J Neurophysiol. 2002;88:172–187. doi: 10.1152/jn.00966.2001. [DOI] [PMC free article] [PubMed] [Google Scholar]
- Pienkowski M, Harrison RV. Tone frequency maps and receptive fields in the developing chinchilla auditory cortex. J Neurophysiol. 2005;93:454–466. doi: 10.1152/jn.00569.2004. [DOI] [PubMed] [Google Scholar]
- Razak KA, Fuzessery ZM. Functional organization of the pallid bat auditory cortex: emphasis on binural organization. J Neurophysiol. 2002;87:72–86. doi: 10.1152/jn.00226.2001. [DOI] [PubMed] [Google Scholar]
- Razak KA, Fuzessery ZM. Neural mechanisms underlying selectivity for the rate and direction of frequency modulated sweeps in the auditory cortex of the pallid bat. J Neurophysiol. 2006;96:1303–1319. doi: 10.1152/jn.00020.2006. [DOI] [PubMed] [Google Scholar]
- Razak KA, Pallas SL. Dark rearing reveals the mechanism underlying stimulus size tuning of superior colliculus neurons. Vis Neurosci. 2006;23:741–748. doi: 10.1017/S0952523806230062. [DOI] [PubMed] [Google Scholar]
- Rosen MJ, Mooney R. Inhibitory and excitatory mechanisms underlying auditory responses to learned vocalizations in the songbird nucleus HVC. Neuron. 2003;39:177–194. doi: 10.1016/s0896-6273(03)00357-x. [DOI] [PubMed] [Google Scholar]
- Rosen MJ, Mooney R. Synaptic interactions underlying song-selectivity in the avian nucleus HVC revealed by dual intracellular recordings. J Neurophysiol. 2006;95:1158–1175. doi: 10.1152/jn.00100.2005. [DOI] [PubMed] [Google Scholar]
- Solis MM, Doupe AJ. Anterior forebrain neurons develop selectivity by an intermediate stage of birdsong learning. J Neurosci. 1997;17:6447–6462. doi: 10.1523/JNEUROSCI.17-16-06447.1997. [DOI] [PMC free article] [PubMed] [Google Scholar]
- Solis MM, Doupe AJ. Compromised neural selectivity for song in birds with impaired sensorimotor learning. Neuron. 2000;25:109–121. doi: 10.1016/s0896-6273(00)80875-2. [DOI] [PubMed] [Google Scholar]
- Suga N. Analysis of frequency-modulated sounds by auditory neurones of echo-locating bats. J Physiol (Lond) 1965a;179:26–53. doi: 10.1113/jphysiol.1965.sp007648. [DOI] [PMC free article] [PubMed] [Google Scholar]
- Suga N. Functional properties of auditory neurones in the cortex of echolocating bats. J Physiol (Lond) 1965b;181:671–700. doi: 10.1113/jphysiol.1965.sp007791. [DOI] [PMC free article] [PubMed] [Google Scholar]
- Suga N. Responses of cortical auditory neurons to frequency modulated sounds in echo-locating bats. Nature. 1965c;206:890–891. doi: 10.1038/206890a0. [DOI] [PubMed] [Google Scholar]
- Suta D, Kvasnak E, Popelar J, Syka J. Representation of species-specific vocalizations in the inferior colliculus of the guinea pig. J Neurophysiol. 2003;90:3794–3808. doi: 10.1152/jn.01175.2002. [DOI] [PubMed] [Google Scholar]
- Theunissen FE, Sen K, Doupe AJ. Spectral-temporal receptive fields of nonlinear auditory neurons obtained using natural sounds. J Neurosci. 2000;20:2315–2331. doi: 10.1523/JNEUROSCI.20-06-02315.2000. [DOI] [PMC free article] [PubMed] [Google Scholar]
- Tian B, Rauschecker JP. Processing of frequency-modulated sounds in the cat's anterior auditory field. J Neurophysiol. 1994;71:1959–1975. doi: 10.1152/jn.1994.71.5.1959. [DOI] [PubMed] [Google Scholar]
- Tian B, Reser D, Durham A, Kustov A, Rauschecker JP. Functional specialization in rhesus monkey auditory cortex. Science. 2001;292:290–293. doi: 10.1126/science.1058911. [DOI] [PubMed] [Google Scholar]
- Vale C, Schoorlemmer J, Sanes DH. Deafness disrupts chloride transporter function and inhibitory synaptic transmission. J Neurosci. 2003;23:7516–7524. doi: 10.1523/JNEUROSCI.23-20-07516.2003. [DOI] [PMC free article] [PubMed] [Google Scholar]
- Wang X. On cortical coding of vocal communication sounds in primates. Proc Natl Acad Sci USA. 2000;97:11843–11849. doi: 10.1073/pnas.97.22.11843. [DOI] [PMC free article] [PubMed] [Google Scholar]
- Woodin MA, Ganguly K, Poo MM. Coincident pre- and postsynaptic activity modifies GABAergic synapses by postsynaptic changes in Cl− transporter activity. Neuron. 2003;39:807–820. doi: 10.1016/s0896-6273(03)00507-5. [DOI] [PubMed] [Google Scholar]
- Zhang LI, Bao S, Merzenich MM. Persistent and specific influences of early acoustic environments on primary auditory cortex. Nat Neurosci. 2001;4:1123–1130. doi: 10.1038/nn745. [DOI] [PubMed] [Google Scholar]
- Zhang LI, Tan AYY, Schreiner CE, Merzenich MM. Topography and synaptic shaping of direction selectivity in primary auditory cortex. Nature. 2003;424:201–205. doi: 10.1038/nature01796. [DOI] [PubMed] [Google Scholar]
- Zheng W, Knudsen EI. Functional selection of adaptive auditory space map by GABAA-mediated inhibition. Science. 1999;284:962–965. doi: 10.1126/science.284.5416.962. [DOI] [PubMed] [Google Scholar]


