

Abstract
Cerebellum-like structures process peripheral sensory information in combination with parallel fiber inputs that convey information about sensory and motor contexts. Activity-dependent changes in the strength of parallel fiber synapses act as an adaptive filter, removing predictable features of the sensory input. In the electrosensory lobe (ELL) of mormyrid fish, a main cellular site for this adaptive processing is the Purkinje-like medium ganglion (MG) cell. MG cells exhibit two types of spikes: narrow axon spikes (N spikes) and broad dendritic spikes (B spikes). N spikes shape ELL output by inhibiting efferent cells, whereas B spikes drive plasticity at parallel fiber synapses. Despite their critical role in plasticity, little is known about the relative importance of various classes of MG cell inputs in driving B spikes or to what extent B spikes can be controlled independently of N spikes. Using in vivo intracellular recordings, measurements of synaptic conductance, and pharmacological blockade of inhibition, we provide evidence for corollary discharge-evoked inhibition that exerts potent control over the timing and probability of B spikes with little apparent effect on N spikes. The timing of this inhibition corresponds to the period during which repeated occurrence of B spikes causes depression of corollary discharge-evoked synaptic responses and a reduction in N spikes. B spikes occurring before or after the period of inhibition lead to increases in corollary discharge-evoked excitation. Thus, by controlling the timing of B spikes, central inhibition shapes the output of MG cells through spike timing-dependent synaptic plasticity. Our findings are consistent with a model of ELL function in which feedback guides adaptive processing by regulating B spikes.
Keywords: inhibition, synaptic plasticity, spike timing, corollary discharge, electric fish, cerebellum
Introduction
Evidence from cerebellum-like structures in several species of fish suggests that plasticity at parallel fiber synapses is involved in removing predictable features from incoming sensory input (Bell, 1981, 2001; Bastian, 1996a; Bodznick et al., 1999). In the mormyrid electrosensory lobe (ELL), parallel fibers convey electric organ corollary discharge (EOCD) signals associated with the motor command that elicits the electric organ discharge. Previous studies have shown that pairing an electrosensory stimulus with the EOCD results in an EOCD-evoked negative image of the previously paired sensory response (Bell, 1981; Bell et al., 1997b). Addition of the negative image of predicted input to the actual input minimizes the expected sensory consequences of the fish's electric organ discharge (EOD), allowing unexpected signals to stand out more clearly.
Purkinje-like medium ganglion (MG) cells integrate disynaptic input from electroreceptors with massive central inputs conveyed by parallel fibers. Activity in MG cells shapes ELL output through inhibitory interactions with efferent cells. MG cells exhibit two types of spikes: large broad spikes (B spikes) of dendritic origin, and small narrow spikes (N spikes) of axonal origin. N spikes are much more frequent than B spikes and constitute the main output of MG cells, whereas B spikes are critical for plasticity. In vitro studies have demonstrated anti-Hebbian synaptic plasticity at parallel fiber synapses onto MG cells (Bell et al., 1997a; Han et al., 2000). The direction and magnitude of plasticity depends on the relative timing of presynaptic parallel fiber input and postsynaptic B spikes during pairing. Parallel fiber EPSPs are depressed if the postsynaptic B spike follows EPSP onset within 60 ms, but are potentiated after pairings at other delays. Thus, plastic changes in parallel fiber EPSPs evoked by the EOCD act to oppose postsynaptic activity that triggers a B spike. EOD-evoked reafferent input that is correlated with parallel fiber activity, and hence predictable, can thus be minimized (Roberts and Bell, 2000).
A number of questions regarding the role of MG cells in adaptive processing remain unresolved. Among these is the possibility of separate control of the two distinct spike types in MG cells. Separate sites of initiation suggest the possibility that N spikes and B spikes could be affected differentially by synaptic inputs. This study provides evidence for central inhibitory inputs that control the probability and timing of B spikes with little effect on MG cell N spike output. We also demonstrate how potentiation and depression of EOCD-evoked synaptic responses depend on the timing of B spikes. Together, these results suggest that central control over the timing of dendritic spikes provides a means to shape the output of MG cells through spike timing-dependent synaptic plasticity.
These observations may be important for understanding the role of MG cells in removing predictable features from ELL output. Because MG cells are interneurons and ELL efferent cells receive ascending electrosensory inputs independently of MG cells, a central feedback signal may be necessary for guiding appropriate modifications at parallel fiber–MG cell synapses. Independent central control over B spikes also suggests an unexpected similarity between parallel fiber synaptic plasticity in MG cells and mechanisms for supervised learning in the cerebellum (Ito, 2001).
Materials and Methods
Experimental preparation.
All experiments that were performed in this study adhere to the American Physiological Society Guiding Principles in the Care and Use of Animals and were approved by the Institutional Animal Care and Use Committee of Oregon Health and Sciences University. Mormyrid fish (7–12 cm in length) of the species Gnathonemus petersii were used in these experiments. Fish were anesthetized with tricaine methanesulfonate (MS:222; 1:25,000) and held against a foam pad. Skin on the dorsal surface of the head was removed and a long-lasting local anesthetic (0.75% Bupivacaine) was applied to the wound margins. A plastic rod was cemented to the anterior portion of the skull to hold the head rigid. The posterior portion of the skull was removed, and the underlying valvula cerebelli was reflected laterally to expose the molecular layer of the caudal lobe of the cerebellum and the eminentia granularis posterior (EGp). The EGp is a large mass of granule cells that covers most of the lateral and dorsal surface of ELL and is the source of molecular layer parallel fibers. Curare (d-tubocurarine) or gallamine triethiodide (Flaxedil) was given at the end of the surgery (∼20 μg/cm body length) and the anesthetic was removed. Aerated water was passed over the fish's gills for respiration. Paralysis blocks the effect of electromotoneurons on the electric organ, preventing the EOD, but the motor command signal that would normally elicit an EOD continues to be emitted by the electromotoneurons at a variable rate of 2–5 Hz. Under these conditions, it is possible to examine the EOCD responses of ELL neurons in isolation from the EOD that normally follows the motor command and to control the electrosensory input that the cells receive.
Input from electroreceptors is conveyed by two classes of mormyromast electroreceptor afferents that terminate in separate medial (MZ) and dorsolateral zones (DLZ) of ELL (Bell et al., 1989). Recordings were made primarily from neurons in the MZ. Previous studies have shown that cells of the DLZ are similar in most respects (Bell and Grant, 1992; Bell et al., 1997b), and we suspect that many of our present findings are applicable to the DLZ as well. MG cells were identified unambiguously in both intracellular and extracellular loose-patch recordings by the presence of two distinct spike types: termed narrow spikes (N spikes) and broad spikes (B spikes). MG cells are the only cell type in ELL that exhibit these two spike types (Grant et al., 1998). In addition, a subset of recorded cells were identified morphologically after labeling with biocytin. MG cells fall into two distinct classes (Han et al., 1999). MG1 cells have shallow basilar dendrites and are inhibited by electrosensory stimuli, whereas MG2 cells have deep basilar dendrites and are excited by electrosensory stimuli (Mohr et al., 2003a). Roughly two-thirds of the MG cells recorded in the present study could be classified as MG1 or MG2. Results were similar for the two classes unless stated otherwise.
Electrophysiology.
The EOD command signal was recorded with an Ag-AgCl wire placed over the electric organ. The command signal is the synchronized volley of electromotoneurons that would normally elicit an EOD in the absence of neuromuscular blockade. The command signal lasts ∼3 ms and consists of a small negative wave followed by three larger biphasic waves (see Fig. 1B, bottom). The latencies of central EOCD- or command-evoked responses were measured with respect to the negative peak of the first large biphasic wave in the command signal (time 0 or t0). In the absence of curare, the EOD occurs ∼4.5 ms after t0.
Figure 1.

Integration of peripheral electrosensory and central inputs in the mormyrid ELL. A, Schematic diagram illustrating the integration of peripheral electrosensory input and several sources of central inputs (red) in MG cells. MG cell N-spikes inhibit efferent cells, whereas B spikes drive plasticity at parallel fiber synapses. Feedback from the midbrain PE links ELL output with MG cells. B, Top, Whole-cell recording from an MG cell illustrating responses to three consecutive motor commands. Each motor command evokes a burst of N spikes. B spikes (arrow) occur on only a fraction of command cycles. Bottom, the electromotoneuron (EMN) volley recorded near the tail of the fish. In subsequent figures the latency of neural activity is referenced to the first negative peak of the EMN (dashed lines).
Using patch electrodes and a small amount of negative pressure, we were able to obtain well isolated extracellular recordings from ganglion layer units in which two distinct spike waveforms were clearly distinguishable. Recording depth, characteristic EOCD and electrosensory responses, and the presence of two spikes, one larger and much less frequent than the other, all suggest that these were MG cells and that the two spike waveforms correspond to N spikes and B spikes recorded intracellularly. Several of these units were labeled juxtacellularly with biocytin and could be identified as MG cells based on morphological criteria. Methods for juxtacellular labeling were similar to those described by Joshi and Hawken (2006).
Intracellular recordings from ELL neurons were made with both sharp microelectrodes and with the blind whole-cell patch method. Sharp electrodes were filled with 2% biocytin in 2 m potassium methyl sulfate (160–250 MΩ). Biocytin was injected into recorded cells by passing depolarizing intracellular current pulses at 1 Hz with a duty cycle of 50% and amplitudes of 1–1.2 nA for 5–12 min. Whole-cell recordings were made using methods similar to those described by Rose and Fortune (1996) and Margrie et al. (2002). Electrodes (10–15 mΩ) were filled with an internal solution containing the following (in mm): 122 K gluconate, 5.6 Mg gluconate, 10 HEPES, 5 Na2ATP, 2.5 MgCl2, and 0.0003 CaCl2, pH 7.2, 280–290 mOsm. No correction was made for liquid junction potentials. Pipettes were advanced through the brain with positive pressure (∼150 mbar) to prevent the tip from clogging. Brief current pulses were delivered to monitor changes in electrode resistance. Once the electrode reached the ventral molecular layer, as judged by changes in command-evoked field potentials, positive pressure was reduced (∼15 mbar) and the electrode was advanced in 2 μm steps. When an abrupt increase in electrode resistance was observed, positive pressure was removed. If electrode resistance increased further, hyperpolarizing current and a ramp of negative pressure was applied, leading in some cases to the formation of a gigaohm seal. Whole-cell configuration was achieved either by passing hyperpolarizing current or by additional negative pressure. Access resistance was typically 50–60 mΩ, ranging from 12–150 mΩ. Cell properties were similar in sharp microelectrode and whole-cell recordings, although spikes and postsynaptic responses were typically larger in whole-cell recordings and membrane potentials more stable. Only stable recordings with resting membrane potentials less than −50 mV were included for analysis. N-spike amplitudes ranged from 3 to 15 mV and B-spike amplitudes from 50 to 85 mV. Membrane potentials were digitized at 20 kHz (CED power1401 hardware and Spike2 software; Cambridge Electronics Design, Cambridge, UK). Data were analyzed off-line using Spike2 and Matlab (MathWorks, Natick, MA).
Electrosensory stimuli.
Electrosensory responses were evoked either by local stimulation of restricted areas of the skin or by global stimulation of the entire fish. Local stimuli were delivered by means of a bipolar stimulating electrode consisting of two small Ag-AgCl balls 6 mm apart. The electrode was held with the axis of the dipole perpendicular to the skin. Individual electroreceptors can be easily distinguished on the skin surface with an operating microscope, and the stimulating electrode could be placed close to individual receptors. Brief pulses of current (100 μs, 5–50 μA) were delivered through the electrode to activate electroreceptors. Global stimuli consisted of brief current pulses (100 μs, 0.2–2 mA) delivered between a small chlorided silver ball inserted through the mouth into the stomach of the fish and a second electrode placed in the water near the tail of the fish. This stimulus geometry activated all submerged electroreceptors and resembled the current flow during the actual EOD. Delivering stimulus pulses at 4.5 ms after the command mimicked the occurrence of the fish's own EOD. Effects of the sensory stimulus could be examined in isolation from EOCD responses by delivering stimuli either independently of the motor command or at long delays of 60–100 ms.
Conductance measurements.
Methods for conductance measurements were similar to those described previously (Anderson et al., 2000). Access resistance was determined offline by fitting voltage responses to hyperpolarizing current injections (−50 to −100 pA) with a double exponential. This allowed us to subtract the contribution of the electrode resistance from the recorded membrane potential. Responses to hyperpolarizing current injections were collected frequently during our recordings, and allowed us to detect offline any changes in access resistance that may have occurred. For calculating conductance, we averaged 50–100 command-evoked responses at several levels of injected current, from +50 to −300 pA. Most of our calculations were made using responses obtained at hyperpolarized membrane potentials, allowing us to avoid contamination by action potentials. Two to six levels of injected current were used for each cell. Relationships between injected current and membrane voltage were approximately linear, suggesting that voltage-dependent processes were not substantially engaged during our protocols. To assess the time course of changes in membrane conductance, we fitted the relationship between injected current and membrane potential with a line as follows: V(t) = Vrest(t) + Iinj/g(t), where g(t), the inverse of the slope of the line is the membrane conductance at time t after the command signal (t = 0). Assuming that changes in conductance are entirely synaptic, the total conductance calculated in this equation can be decomposed into excitatory and inhibitory components (Anderson et al., 2000). We set the reversal potential for the excitatory conductance to 0 mV and the reversal potential for the inhibitory conductance to −75 mV, this latter value being consistent with a predominant contribution of fast GABAA-mediated inhibition. Plus or minus 10 mV changes in these values had no substantial impact on our results.
Pharmacological blockade of inhibition.
Methods for micropressure injections were similar to those used by Bastian (1990). We used multibarreled glass pipettes with one barrel used for recording command-evoked field potentials, one for micropressure ejection of 1 mm bicuculline methiodide (Sigma) dissolved in saline, and one for micropressure ejection of either saline or alcian green dye. The total tip diameter was ∼10 μm. Ejection pressure was typically 30 psi and duration of pressure pulses was 20–30 ms. The locations of the injection pipette and the recording pipette were matched using the location of electrosensory receptive fields assessed by simultaneous recording of the electrosensory-evoked local field potentials. The multibarrel pipette was then retracted 50–500 μm so that its tip was located either in the ventral molecular layer, near the base of the MG cell apical dendrites and the presumptive site of B spike initiation, or in the dorsal molecular layer. The laminar location of the pipette tip could be judged precisely based on characteristic command-evoked field potentials (Bell et al., 1992) and was confirmed by histology in several cases in which alcian dye marks could be clearly visualized. After obtaining a loose-patch recording and measuring patterns of N spikes and B spikes for at least 100 s, a micropressure injection was made. Saline or dye injections had no noticeable effect on recorded cells. Effects of bicuculline injections were reversible and depended on close matching of electrosensory receptive fields of the recording and injection pipettes as well as on the laminar location of the injection pipette.
B-spike pairing experiments.
Plasticity of command-evoked synaptic responses was induced by evoking a B spike at a fixed delay with respect to the command. Delays ranged from 8 to 110 ms, where the delay was defined as the time to peak of the evoked B spike relative to the command signal. The rate of B-spike pairing was determined by the intervals between commands (typically 2–5 Hz), with each pairing lasting 2–4 min. Two to five different pairings were conducted in each cell. For sharp microelectrode recordings, experiments were conducted without bias current. N spikes were removed and underlying membrane potentials linearly interpolated to quantify changes in synaptic responses before and after pairing. In whole-cell recordings, we collected data at several levels of injected current (0 to −200 pA) before and after pairing. These provided us with samples of the membrane potential uncontaminated by spikes and also allowed us to separate changes in postsynaptic responses resulting from plasticity from changes caused by small shifts in membrane potential after pairing. Although we did notice a tendency for cells to be several millivolts more hyperpolarized after pairing, this effect was transient and did not contribute substantially to the large, temporally specific changes in postsynaptic responses that were presumably caused by associative plasticity. Pairing-induced changes were assessed by comparing averages of 100–150 command-evoked synaptic responses before and immediately after pairing. Changes in command-evoked synaptic responses diminished over the course of several minutes after pairing. Previous studies have shown that this decline is not a passive decay but rather a result of ongoing plastic changes driven by corollary discharge inputs (Bell, 1986).
Results
In nature, mormyrid fish normally emit between 1 and 50 EOD pulses per second. Nearby objects perturb this self-generated electrical field, resulting in small shifts in the latency of electroreceptor afferent spikes (Szabo and Hagiwara, 1967; Bell, 1990; Sawtell et al., 2006). This information is relayed via interneurons to MG cells as well as to efferent neurons of the ELL. MG cells also receive prominent central inputs from three main sources: EGp, the preeminential nucleus, and the juxtalobar nucleus (Bell et al., 1981) (Fig. 1A). Granule cells of EGp send their axons to ELL as parallel fibers. Parallel fibers convey EOCD, proprioceptive, descending electrosensory, and lateral line information. As discussed in the Introduction, parallel fiber synapses on MG cells show synaptic plasticity and probably mediate adaptive filtering of incoming sensory signals. The main projection of the preeminential nucleus to ELL is to the deep molecular layer where the proximal apical dendrites of MG and efferent cells are located. The preeminential nucleus receives ascending electrosensory input from ELL as well as input from higher electrosensory centers and is thus a major source of recurrent electrosensory input to ELL. Cells of the preeminential nucleus respond both to electrosensory input and to the EOCD (Sawtell et al., 2005). Finally, the juxtalobar nucleus provides fixed, precisely timed EOCD input to the soma and basilar dendrites of MG cells. Juxtalobar input appears to be primarily responsible for command-evoked EPSPs in these cells (Mohr et al., 2003b).
We recorded the responses of MG cells to the EOCD either in isolation or in combination with electrosensory stimuli. Typical EOCD- or command-evoked responses of an MG cell are illustrated by the whole cell recordings shown in Figure 1B. The command evokes an EPSP and a burst of small N spikes in MG cells, as described previously (Bell et al., 1997b). MG cells also exhibit B spikes, which are much less frequent and much larger than N spikes (Fig. 1B, arrow). N spikes have a lower threshold than B spikes when tested with intracellular current pulses (Mohr et al., 2003a). The lower threshold and smaller size of N spikes are consistent with their initiation in the thin initial segment of the MG cell axon followed by passive propagation to the soma.
Several lines of evidence suggest that B spikes are initiated in the soma or proximal dendrites and actively propagate through the molecular layer in MG cell apical dendrites. Broad unitary events, whose frequency and timing resemble those of B spikes recorded intracellularly, can also be recorded both intracellularly and extracellularly in the ELL molecular layer (Bell et al., 1997b). In addition, current source density analysis of evoked field potentials in vitro revealed a TTX-sensitive current sink that propagates from the ganglion layer outward through the molecular layer (Gomez et al., 2005).
Effects of broad spikes on narrow spike intervals
Using patch electrodes and a small amount of negative pressure, we were able to obtain well isolated extracellular recordings from ganglion layer units in which two distinct spike waveforms were clearly distinguishable (Fig. 2B). Recording depth, characteristic EOCD and electrosensory responses, and the presence of two spikes, one larger and much less frequent than the other, all suggest that these were MG cells and that the two spike waveforms correspond to N spikes and B spikes recorded intracellularly. Loose-patch recordings were easier to obtain than sharp microelectrode or whole-cell patch recordings and allowed us to examine patterns of N spikes and B spikes with less disturbance to the cell.
Figure 2.
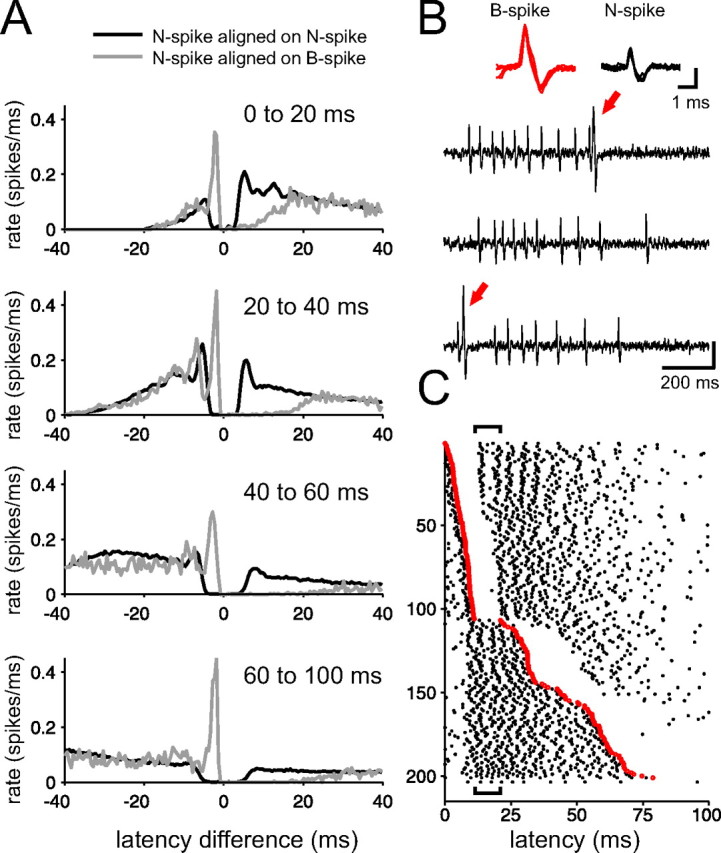
B-spike firing is associated with distinct N-spike interval patterns. A, Pooled N-spike histograms (n = 17 loose-patch extracellular recordings) aligned either on N spikes (black curves) or B spikes (gray curves) occurring within the time window after the command indicated in the top right of each panel. Structure in the black curves reflects the command-evoked N-spike burst. B spikes are associated with subsequent 10–20 ms pauses in N spikes, evident as differences in spike rate between the black and gray curves. Differences in the curves just before zero indicate that the interval between a B spike and a preceding N spike is substantially briefer than typical intervals between N spikes. B, Extracellular traces from the raster shown in C. Note the two distinct spike waveforms, shown expanded in the inset. B spikes (red arrows) are preceded by a N spike at a short interval and are followed by a pause in N-spike firing. Vertical calibrations: 400 μV. C, Raster illustrating command-evoked patterns of N spikes and B spikes in an MG cell; sweeps are ordered by the latency of the B spike. Only sweeps on which a B spike occurred are plotted. The B spike clearly interrupts the N-spike burst. Also note the absence of B-spike firing between 10 and 25 ms after the command (indicated by brackets).
Loose-patch extracellular recordings also allowed us to investigate the relationship between the occurrence of a B spike and the occurrences of N spikes. This relationship is typically obscured in intracellular recordings by the width of the B spike waveform. We compared N spike histograms aligned on the occurrence of N spikes (autocorrelograms) (Fig. 2A, black curves) with those aligned on the occurrence of B spikes (cross-correlograms) (Fig. 2A, gray curves) within four time windows after the command. Histograms represent pooled data from 17 cells. The occurrence of a B spike was always preceded by an N spike at an unusually short interval (∼2–4 ms) and was always followed by a (∼10–20 ms) pause in N-spike firing (Fig. 2A, gray curves). Because B spikes were typically infrequent, this pause is not evident in overall command-evoked patterns of N spikes. Both the short interval preceding a B spike and the subsequent pause in N-spike firing are evident in the raster shown in Figure 2C. Sweeps on which a B spike occurred are ordered by the latency of the B spike after the command signal. The occurrence of a B spike effectively interrupts or terminates the command-evoked N-spike burst.
The pause in N-spike firing could be a direct effect of membrane depolarization associated with the B spike (e.g., inactivation of voltage-gated sodium channels at the site of N-spike initiation). The duration of the pause was shorter when the B spike occurred in the midst of the command-evoked N-spike burst, suggesting that the pause could be overcome by strong excitation (Fig. 2A, 0–20 ms). The especially short interval between a B spike and the preceding N spike could simply be a consequence of the strong depolarization needed to evoke a B spike. It is also possible that depolarization resulting from the N spike itself could contribute directly to evoking a B spike. At any rate, the B spike seems to have a distinct signature (a very short interspike interval followed by a pause) that, if faithfully transmitted, could exert distinct postsynaptic effects on ELL efferent cells. Possible roles of B spikes in signaling merit study, but are not explored further here.
An additional feature that can be observed in the raster of Figure 2C is the pause in B-spike activity between 10 and 20 ms after the command (discontinuity of the red line, within the time period indicated by brackets above and below the raster). Interestingly, this B-spike pause occurs in the midst of the command-evoked N-spike burst, suggesting that EOCD inputs exert different effects on B spikes and N spikes. This observation is the starting point for the experiments and discussion to follow.
Synaptic inputs affect narrow spikes and broad spikes differentially
We examined command-evoked patterns of N spikes and B spikes with intracellular sharp-electrode and loose-patch extracellular recordings from MG cells. For intracellular recordings, no bias current was used and only stable recordings with resting membrane potentials more hyperpolarized than −55 mV were analyzed. Histograms for N spikes and B spikes were generated from responses to at least 300 commands (Fig. 3). Analysis was restricted to the first 150 ms of each command, because activity was only weakly modulated after this time. The command evoked a burst of N spikes (4.5 ± 2.8 spikes/command, n = 5, intracellular; 8.9 ± 3.4 spikes/command, n = 17, extracellular). The first spike in the N-spike burst was often more time-locked than the later spikes and separated by a pause from the following spikes (Fig. 3A,E). B spikes were far less frequent (0.08 ± 0.04 spikes/command, n = 5, intracellular; 0.14 ± 0.15 spikes/command, n = 17, extracellular), but in most cases the timing of their occurrence was nevertheless clearly related to the command. Intracellularly and extracellularly recorded patterns of N spikes and B spikes were qualitatively similar, although we did observe a significantly higher rate of N spikes in extracellular recordings (p < 0.02, t test).
Figure 3.
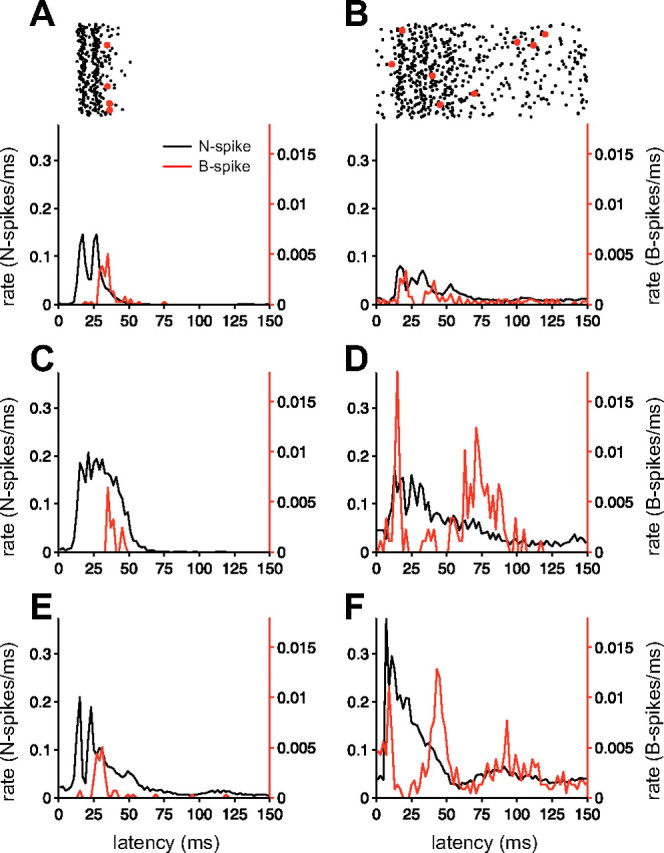
Command-evoked patterns of N spikes and B spikes. A, B, Patterns of N spikes and B spikes (red) evoked by the motor command in two MG cells recorded with sharp microelectrodes. Rasters (top) show a subset of sweeps used to construct the histograms. C–F, EOCD-evoked patterns of N spikes and B spikes in four additional MG cells recorded extracellularly. Left, B spikes are delayed relative to the peak of the N spike burst. Right, A pause in B-spike firing is evident concurrent with a high rate of N-spike firing. Bin width for histograms is 2 ms.
Two patterns of B spike responses were commonly observed. In some cells (n = 8), B spikes occurred most frequently after the peak of N spike excitation, evident as a clear peak in the B spike histograms between 25 and 50 ms after the command (Fig. 3, left column). Other cells (n = 10) also exhibited an earlier peak in B-spike probability ∼10 ms after the command (Fig. 3, right column). In this latter group, early and late peaks in B-spike probability were separated by a pause. Notably, these pauses occurred while the probability of N spikes remained high. Pauses were not caused by refractoriness, as we very rarely observed more than one B spike per command. The lower rate of B spikes versus N spikes is consistent with the higher threshold of B spikes, but this threshold difference alone cannot explain pauses in B spike firing concurrent with N spike bursts. As described in the next section, the pause in command-evoked B spike firing is caused by central inhibitory inputs that appear to control B spikes with comparatively little effect on N spikes.
In a subset of our extracellular recordings (n = 15), we also tested the effects of artificial electrosensory stimuli, either a local dipole stimulus in the cell's receptive field or a global EOD mimic, at the time when the EOD would have occurred in nature. A previous study showed that local electrosensory stimuli reduce the command-evoked N spike burst in MG1 cells but enhance the burst in MG2 cells (Mohr et al., 2003a) (see Materials and Methods for description of MG1 and MG2 cells). Our results are similar, although we found that electrosensory stimuli often had mixed effects: inhibition followed by excitation in MG1 cells and excitation followed by inhibition in MG2 cells. We also obtained evidence for spatial receptive field organization from several intracellular recordings from MG1 cells in which a local dipole stimulus evoked predominantly hyperpolarizing or depolarizing responses in one region of the skin but an opposite response from adjacent skin regions.
Most importantly for the present study, we found that the effects of an electrosensory stimulus on N spikes and B spikes were often strikingly disjoint. In some MG2 cells, an electrosensory stimulus evoked a strong increase in N spike firing with little increase or even a decrease in B spike firing (Fig. 4A). In other MG2 cells we saw the opposite, a modest excitation of N spikes accompanied by a large increase in B spikes (Fig. 4B). In some MG1 cells, a global electrosensory stimulus caused a decrease in the early portion of the command-evoked N spike burst along with an increase in early B spikes (Fig. 4C). Some MG cells exhibited changes in the temporal patterns of both N spikes and B spikes that were less obviously disjoint but still quite distinct (Fig. 4D). Although experiments using more natural patterns of electrosensory stimuli will be required to address the interesting question of what N-spike and B-spike patterns actually encode, the present results provide provides proof of principle evidence that sensory stimuli could affect N spikes and B spikes differentially.
Figure 4.
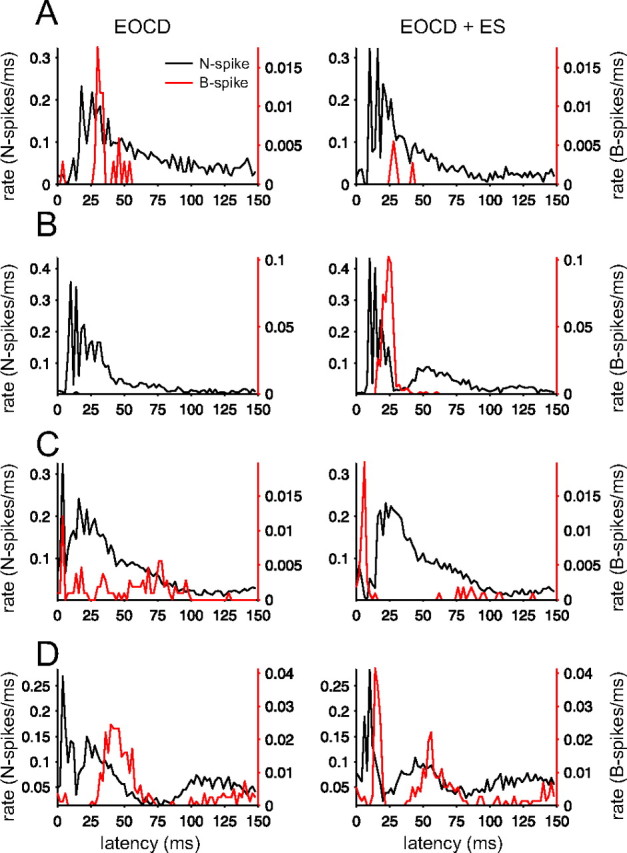
Electrosensory stimuli differentially affect N spikes and B spikes. Histograms for four cells show patterns of N spikes and B spikes evoked by the command (left) and the effects of an electrosensory stimulus (ES) delivered at the time of the naturally occurring EOD (right). Examples were chosen to illustrate that N spikes and B spikes can be differentially affected by simple stimuli [e.g., B spikes may decrease whereas N spikes increase (A) or vice versa (C)]. A local electrosensory stimulus was used in A, C, and D, and a global electrosensory stimulus for B. The earliest effect of an electrosensory stimulus in MG2 cells (A, B) is to increase the probability or decrease the latency of N spikes, whereas the earliest effect of an electrosensory stimulus in MG1 cells (C, D) is to decrease the probability or increase the latency of N spikes. Bin width for histograms is 2 ms.
For MG1 cells, we often observed that the most effective trigger for evoking B spikes was to turn an electrosensory stimulus off abruptly. This typically led to a transient increase in B spike probability and to a change in the pattern of command-evoked B spikes. This effect is illustrated for a representative cell in Figure 5. B spikes were initially infrequent during the command-evoked N-spike burst. Immediately after turning the electrosensory stimulus off, B spikes were more frequent and tended to occur at the peak of the N-spike burst. Note that whereas B-spike probability dramatically increases after turning the electrosensory stimulus off, the command-evoked N-spike burst is, for the most part, reduced (Fig. 5B, compare histograms 1–3). Similar results were obtained in five additional cells. In all cases, command-evoked B spikes were more frequent and more closely aligned with the N-spike burst after turning the electrosensory stimulus off, whereas patterns of command-evoked N spikes changed much less, indicating once again the independence of EOCD effects on the two types of spikes. Moreover, it appears that the effects of EOCD inputs on B spikes are not fixed, but rather, depend on the recent history of sensory stimulation.
Figure 5.
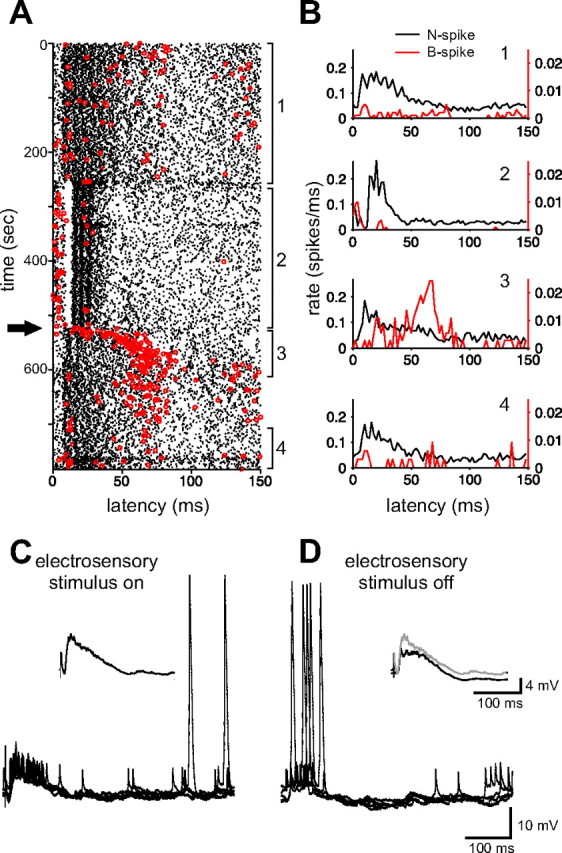
Command-evoked patterns of B spikes depend on the recent history of stimulation. A, Raster display from an MG1 cell showing N spikes (black dots) and B spikes (red dots) evoked by the command before (1) and after (3, 4) delivering a local electrosensory stimulus (2). Note that B spikes transiently occur at the peak of the N-spike burst immediately after the electrosensory stimulus is turned off (arrow). B, Histograms constructed from the four segments of the raster in A. Note the large increase in command-evoked B spikes accompanied by a decrease in command-evoked N spikes after turning the electrosensory stimulus off (compare 1, 3). C, D, Traces from a whole-cell recording from an MG1 cell in which a similar protocol was used and a similar increase in B spikes was observed. Five consecutive traces taken from the end of the stimulus period are overlaid traces in C, and five consecutive traces taken immediately after turning the electrosensory stimulus off are overlaid traces in D. Inset in C shows the average command-evoked EPSP with the stimulus on. Inset in D shows the average command-evoked EPSP with the stimulus on (gray trace) overlaid with the average command-evoked EPSP after turning the stimulus off (black trace). Note that although the command-evoked EPSP is larger when the electrosensory stimulus is on (compare average traces in the inset in D), B spikes are more frequent immediately after turning the electrosensory stimulus off.
In one additional MG1 cell, we observed a transient increase in B-spike probability along with more persistent increases in the N-spike burst and the command-evoked EPSP after turning off a local stimulus that evoked a strong inhibition. This result is consistent with pairing-induced increases in command-evoked excitation reported previously (Bell et al., 1997b). The absence of pairing-induced plasticity in the majority of MG1 cells tested in the present study is likely attributable to differences in stimulus parameters (i.e., intensity, spatial extent, and pairing duration).
Dissociation between the recorded membrane potential and B-spike firing is shown in intracellular recordings taken just before and just after turning off an electrosensory stimulus (Figs. 5C,D). The effect of a global electrosensory stimulus for this cell was an increase in the command-evoked EPSP; nevertheless, B spikes were infrequent and most often occurred well after the peak of command-evoked excitation (Fig. 5C). After turning the stimulus off, the command-evoked EPSP and associated N-spike burst were substantially reduced, yet B spikes were now more frequent and more likely to occur at the time of the command-evoked EPSP (Fig. 5D).
Together, these results show that both the EOCD alone and simple electrosensory stimuli can exert differential and even opposite effects on N spikes and B spikes, indicating some degree of independent synaptic control over N spikes and B spikes.
Evidence for inhibitory control of broad spikes
From a biophysical standpoint, differential effects of the EOCD and electrosensory stimuli on N spikes and B spikes within the same cell are possible given sufficient electrotonic distance between the initiation sites for the two spike types and different spatial distributions of excitatory and inhibitory inputs. Given the critical role of B spikes in driving synaptic plasticity in MG cells (Bell et al., 1997a; Han et al., 2000), we were interested in understanding more about how selective regulation of B spikes might be accomplished in ELL. For simplicity, we focus on understanding command-evoked patterns of N spikes and B spikes, leaving aside effects of electrosensory stimuli.
Command-evoked pauses in B spikes at the same time as command-evoked activation of N spike firing could be explained by spatially localized inhibition that transiently shunts excitation near the B spike initiation zone. This is suggested by the observation that the relationship between B spikes and membrane potential varied as a function of time after the command as illustrated for two different cells in Figure 6, A and B. A command-evoked EPSP and N-spike burst were observed in both cells, but most of these command-evoked depolarizations did not lead to a B spike. For the cells shown, a majority of the B spikes that did occur arose from substantially less depolarized membrane potentials (i.e., before or after the command-evoked EPSP). Dissociations between recorded membrane potential and apparent spike threshold or firing rate have been attributed to spatially localized effects of shunting inhibition in the visual cortex (Hirsch et al., 1998). Similarly, dissociations between B-spike firing and membrane potential that we observed in MG cells could be explained by a corollary discharge-evoked inhibition that was more effective near the site of B-spike initiation than at the recording site.
Figure 6.
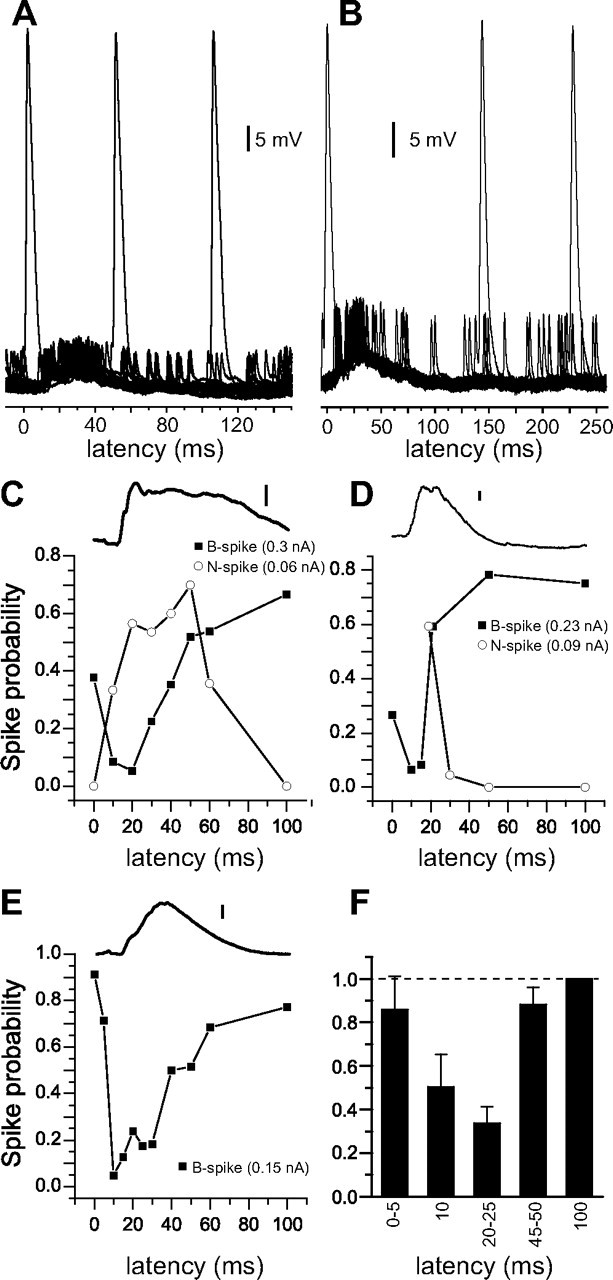
A decrease in B-spike probability concurrent with command-evoked excitation. A, B, Traces for 20 consecutive command-evoked responses overlaid from a whole-cell recording (A) and a sharp intracellular recording (B). B spikes often arise from less depolarized membrane potentials, either before or after the peak of command-evoked excitation. C–E, Probability of evoking B spikes (filled squares) and N spikes (open circles) with brief (12 ms) current injections delivered at various times after the command. Note the decreases in B-spike probability concurrent with command-evoked excitation. Averaged membrane potential traces for the same cell are shown above. Scale bars: 2 mV. F, Average profile of B-spike probability as a function of time after the command. Data from each cell were normalized to B-spike probability at 100 ms (n = 16). Error bars indicate SEM.
We measured the time course of the apparent B-spike inhibition with brief current pulses at different delays after the command and examined the probability of evoking a B spike at each delay. We injected current pulses of fixed duration and amplitude (12 ms; 0.15–0.75 nA) at times ranging from 0.1 to 100 ms after the command. Pulses were delivered on 10–30 consecutive commands followed by a brief rest period to minimize the induction of plasticity. Each timing was tested at least twice to rule out obvious nonstationarities. Roughly three-quarters of MG cells (16 of 21) exhibited a clear decrease in the probability of evoking a B spike when current injections were delivered concurrent with command-evoked excitation (n = 7 sharp microelectrode; n = 9 whole-cell). B-spike probability was lowest in these cells for current pulses injected between 10 and 25 ms after the command (Fig. 6C–E), roughly the same time period during which we observed pauses in B spikes evoked by the command. Differences in B-spike probability as a function of time after the command were large and also quite variable across cells. The highest probability (always early or late in the command cycle) differed from the lowest (always concurrent with command-evoked excitation) by 2- to 50-fold. On average, we observed a roughly threefold decrease in the probability of evoking a B spike for delays between 20 and 25 ms (Fig. 6F) (n = 16). In eight cells, we also used smaller current amplitudes to assess the probability of evoking a N spike (Fig. 6C,D). In all cases, N spikes were more likely to occur when pulses were delivered concurrent with the command-evoked EPSP.
Intrinsic membrane properties could give rise to a nonmonotonic relationship between membrane potential and B-spike probability. However, this possibility is unlikely to account for our results, because we always observed an increase in B-spike probability with increasing amplitude of injected current. Moreover, it was apparent from inspection of intracellular records that for any given delay after the command, B spikes were more likely to arise when the membrane potential at that delay was more depolarized. A more likely explanation is that command-evoked decrease in B-spike probability is caused by command-evoked inhibition that selectively affects the initiation of broad spikes. Inhibition could be masked in our recordings by concurrent excitation or could act “silently” by shunting excitatory inputs near the site of B-spike initiation.
We used two approaches to reveal the presence of command-evoked inhibition. First, we attempted to reveal IPSPs directly by depolarizing the cell, increasing the driving force for inhibition and reducing the driving force for concurrent excitation. Command-evoked IPSPs were evident at depolarized membrane potentials in whole-cell recordings from eight cells (Fig. 7D). On average, command-evoked IPSPs peaked later than command-evoked EPSPs (21.3 ± 3 vs 16.5 ± 4.5 ms; n = 8; p < 0.05). The onset of command-evoked IPSPs appeared to be later as well (8.5 ± 0.7 vs 5.4 ± 0.15 ms; n = 3; p < 0.05), although in most cases the precise time of onset was obscured by excitation that had not been completely reversed. In two of these cells, we also measured the time course of the decrease in B-spike probability assessed via current injection. In both cases, the time course of the command-evoked IPSP was similar to the time course of the decrease in B-spike probability (Fig. 7B).
Figure 7.
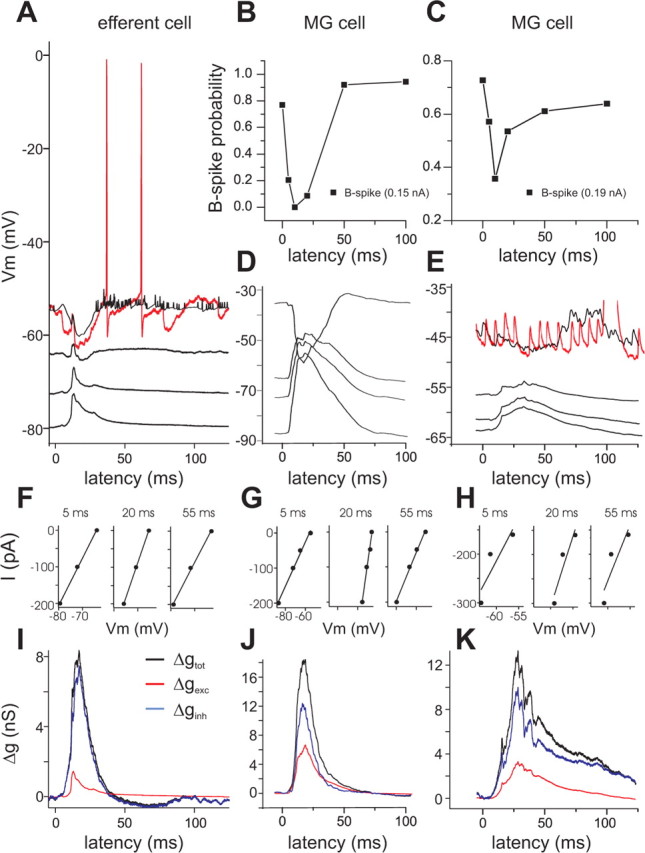
Concurrent command-evoked excitation and inhibition in ELL efferent and MG cells. Data in the left column are from a whole-cell recording from a representative ELL efferent cell (large fusiform cell). Data in the middle and right columns are from whole-cell recordings from two representative MG cells. A, Average (black) and individual traces (red) showing command-evoked synaptic responses at various levels of steady injected current. Command-evoked responses in efferent cells are clearly a mixture of excitation and inhibition and can be readily reversed with current injection. B, C, Both MG cells show a command-evoked decrease in the probability of evoking a B spike via brief current injection. D, E, Command-evoked synaptic responses at various levels of steady injected current for each MG cell. F–H, Relationship between injected current and recorded voltage at three times during the command cycle. I–K, Total (black), excitatory (red), and inhibitory (blue) command-evoked changes in synaptic conductance calculated from the average membrane potential traces shown in A, D, and E. Traces at the most depolarized membrane potentials were not used for conductance calculations. For the efferent cell shown in I, note the substantial command-evoked increase in conductance, dominated by changes in inhibition. Note the prominent command-evoked IPSP evident at depolarized membrane potentials for the MG cell in D but not for the cell in E. Both cells show an increase in inhibitory conductance that parallels the decrease in B-spike probability.
In other MG cells (n = 4), we observed a command-evoked decrease in the probability of eliciting a B spike with current injection, but were unable to clearly reveal an IPSP at depolarized membrane potentials (Fig. 7E). The absence of clear IPSPs in these cases could have been attributable to a significant distance between the recording site and the site of inhibition or to the presence of spikes and other voltage-activated conductances at more depolarized membrane potentials (Fig. 7E).
Strong command-evoked inhibition near the site of B-spike initiation should be evident in our recordings as a command-related increase in membrane conductance. Hence, our second approach was to measure command-evoked synaptic responses while injecting steady hyperpolarizing currents and then calculate the membrane conductance as a function of time after the command (see Materials and Methods). Briefly, at each point in time after the command, the relation between the injected current and the membrane potential was fitted with a line (Fig. 7F–H). Taking the inverse of the slope of this line at each point in time gives the time-varying membrane conductance (Fig. 7I–K, black curves). Assuming that command-evoked changes in conductance are entirely synaptic, we can decompose the total conductance change into inhibitory and excitatory synaptic components. We assume a reversal potential of 0 mV for excitatory inputs and −75 mV for inhibitory inputs, this latter value being consistent with a predominant contribution of fast GABAA-mediated inhibition. Similar methods have been used to reveal the effects of inhibition in neocortex (Hirsch et al., 1998; Anderson et al., 2000; Monier et al., 2003). This approach did not require depolarization of the cell and, thus, minimized contamination by spikes and other voltage-activated conductances.
We measured command-evoked changes in conductance in whole-cell recordings from both MG cells and ELL efferent cells. Data from efferent cells was valuable for comparison as both anatomical and physiological evidence indicate that efferent cells receive both command-evoked inhibition and excitation (Bell et al., 1997b). Efferent cells are the main targets of MG cell inhibition and their somas and proximal dendrites are densely covered by inhibitory terminals (Grant et al., 1996). Near rest, efferent cell command-evoked responses were typically a mix of small amplitude EPSPs and IPSPs. Command-evoked IPSPs usually preceded EPSPs and could be readily revealed with moderate depolarization (Fig. 7A). Consistent with these observations, we observed clear command-evoked increases in conductance in efferent cells (20–300%; n = 9) (Fig. 7I). In all cases, these changes were dominated by increases in inhibitory synaptic conductance.
Conductance measurements were made in six MG cells in which we also observed command-related decreases in B-spike probability, as assessed with brief current injections (Fig. 7B,C). A command evoked-IPSP could be clearly revealed by depolarization in only one of these cells (Fig. 7D). We observed command-evoked conductance increases ranging from 30–350% (101 ± 132%; n = 6). Large command-evoked increases in conductance are evident as decreases in the vertical spacing between the membrane potential traces concurrent with command-evoked excitation (Fig. 7D). The time course of the conductance increase roughly parallels the time course of the decrease in B-spike probability assessed via brief current injection (Figs. 7, compare B, J and C, K). Increases in inhibitory synaptic conductance were more prominent than increases in excitatory conductance in five of the six cells, although values for Ge and Gi were not significantly different on average.
The magnitude of conductance increases varied substantially across MG cells. Some of this variability could be attributable to differences in the visibility of conductance changes at the recording site. For example, some of our recordings may have been taken from dendrites rather than somas. Variability in the magnitude of conductance changes could also reflect differences across cells in the strength of command-evoked inhibition. The cell in which the most prominent IPSP was observed at depolarized membrane potentials also exhibited the largest conductance increase (>350%) as well as the largest decrease in B-spike probability with current injection (Fig. 7B). Overall, our conductance analysis as well as direct observation of command-evoked IPSPs provides clear evidence for simultaneous command-evoked excitation and inhibition in MG cells.
To establish a more direct link between inhibition and command-evoked decreases in B-spike probability, we measured command-evoked patterns of B spikes and N spikes before, during, and after pharmacological blockade of inhibition. A multibarreled pipette (one barrel for recording, one for micropressure ejection of 1 mm bicuculline methiodide, and one for micropressure ejection of either saline or alcian green dye) was positioned near the recording pipette (see Materials and Methods), either in the ventral molecular layer (VML), near the base of the MG cell apical dendrites and the presumptive site of B-spike initiation, or in the dorsal molecular layer (DML). After obtaining a loose-patch recording and measuring patterns of N spikes and B spikes for at least 100 s, a micropressure injection was made.
A raster display for a typical experiment in which bicuculline was injected in the VML is shown in Figure 8A. Before the injection, the command evoked a burst of N spikes. B spikes were infrequent and tended to occur either before or after the N-spike burst. Both the probability and temporal pattern of B spikes changed dramatically after injection (Fig. 8A, arrow). B spikes occurred on nearly every command cycle, with some commands now eliciting multiple B spikes. B-spike latency coincided with the onset of the N-spike burst immediately after injection and then moved gradually later. Effects of bicuculline on B spikes were transient, with the probability and pattern of B spikes returning close to baseline within 2–3 min. Notably, bicuculline appeared to have comparatively little effect on N spikes. Command-evoked bursts of N spikes were reduced immediately after bicuculline injection, but this was because of the large increase in B spikes (Fig. 2). Inspection of sweeps on which B spikes did not occur showed that the command-evoked burst of N spikes was not increased by bicuculline. Similar effects of VML bicuculline injection on command-evoked patterns of B spikes and N spikes were observed in five cells (Fig. 8B,G). Effects of bicuculline were also similar in two additional experiments in which a global electrosensory stimulus was delivered at the time of the naturally occurring EOD.
Figure 8.

Inhibitory blockade results in a spatially and temporally specific increase in B spikes without an increase in N spikes. A, Raster illustrating the effects of VML bicuculline injection in a representative MG cell. Time of the injection is indicated by the arrow. Immediately after injection, B spikes occur on nearly every command cycle and are closely aligned with the N-spike burst. N spikes are relatively unaffected by the injection. B, Pooled N-spike and B-spike histograms (n = 5) before (dashed lines) and 0–150 s after VML bicuculline injection. Left ordinate refers to N-spike rates (black lines) and right ordinate to B spike rates (red lines). B-spike probability increases dramatically after the injection. The decrease in N spikes is mostly attributable to the occurrence of the B spikes themselves. C, Pooled N-spike and B-spike histograms (n = 5) before (dashed lines) and 150–275 s after VML bicuculline injection. Postinjection, there was a significant decrease in N spikes between 10 and 50 ms after the command (n = 5; p < 0.001). D–F, Running averages (15 s window) of N-spike and B-spike rates (0–60 ms after the command) for three additional cells in which we compared the effects of bicuculline injections in the VML with more superficial DML injections. VML injections result in dramatic and selective increases in B spikes, whereas DML injections have little effect on B spikes. G, Running average (15 s window) of N-spike and B-spike rates (10–50 ms after the command) pooled for the same five cells shown in B and C. Note the increase in B spikes immediately after VML bicuculline injection and the small but persistent decrease in N spikes after injection.
Effects of bicuculline appeared to be quite local. If electrosensory receptive fields at the recording and injection sites did not closely match, no effects of bicuculline injection on B spikes were observed. Evidence for laminar specificity was obtained by comparing effects of VML and DML bicuculline injections in the same cells. DML injections resulted in modest increases in both N spikes (three of three cells) and B spikes (two of three cells) (Fig. 8D–F). VML injections in the same cells resulted in dramatic increase in B spikes with little effect or a slight decrease in N spikes (Fig. 8D–F). These data are consistent with potent and selective control over the timing and probability of B-spike firing by a precisely timed and spatially localized inhibition near the presumptive site of B-spike initiation in the VML. The spatial and temporal specificity of the changes in B spikes along with the minimal change in N spikes also suggest that nonspecific depolarizing effects of bicuculline are unlikely to account for our results (Kurt et al., 2006).
It is also interesting to note that the dramatic increase in B-spike probability and changes in their temporal pattern observed after VML bicuculline injection are similar to those observed in some MG1 cells after turning an electrosensory off abruptly (Fig. 5A, raster). This latter effect could be caused by a transient, stimulus-driven removal of command-evoked inhibition.
In addition to dramatic and immediate effects on B spikes, we also noticed a more gradual and persistent decline in the strength of the N-spike burst after VML bicuculline injections (Fig. 8A,D,G). To assess these changes, we compared command-evoked N-spike and B-spike patterns before and 150–275 s after bicuculline injections (Fig. 8C). After bicuculline injection, a small but highly significant decrease in N spikes is evident between 10 and 50 ms after the command, just after the peak of the N-spike burst (p < 0.001; n = 5). The decline in N spikes is unlikely to be the result of a general decrease in excitability, because B spikes were still modestly elevated above preinjection levels, and the decrease in the N-spike response was restricted to the interval between 20 and 40 ms after the command signal (Fig. 8C). We suggest that this temporally specific change in the N-spike response may reflect an associative depression of parallel fiber excitation driven by the large increase in command-evoked B spikes, as described further in the next section.
Broad spike timing shapes MG cell responses through synaptic plasticity
We were motivated to understand how B spikes are controlled by synaptic input because of previous studies showing that B-spike occurrence drives plasticity at parallel fiber synapses onto MG cells. In vitro studies have demonstrated that parallel fiber EPSPs are depressed after pairings in which EPSP onset precedes a B spike by 0–60 ms (Bell et al., 1997a). EPSP potentiation appeared to be nonassociative in these experiments in that it depended on the frequency of presynaptic stimulation but not on timing with respect to the postsynaptic B spike (Han et al., 2000). Granule cells that give rise to parallel fibers receive time-locked EOCD inputs arriving at a range of fixed delays relative to the command (Bell et al., 1992). Although the precise activity patterns of granule cells is not yet known, we assume that they too are active at specific times across the command cycle. Thus, B spikes can be paired with parallel fiber inputs in vivo, simply by repeatedly evoking a B spike via intracellular current injection at a fixed delay after the command. Previous in vivo studies have demonstrated that such pairing results in plasticity of command-evoked synaptic responses (Bell et al., 1993, 1997b), although the relationship between the timing of B spikes and the resulting change in command-evoked EPSPs was not thoroughly investigated.
We conducted 27 B-spike pairings at delays ranging from 8 to 110 ms after the command (n = 4 sharp microelectrode recordings; n = 3 whole-cell recordings) (for details, see Materials and Methods). Two to five different pairings were conducted in each cell. Nearly every pairing resulted in a clear change in the command-evoked synaptic response (25 of 27 pairings resulted in a significant change in the area of synaptic responses assessed 10–100 ms after the command; p < 0.05, paired t test), with the nature of the change depending on the timing of the B spike relative to the command. These effects are most evident in the difference traces, shown for three cells in the right columns of Figure 9A–C (black lines indicate the mean and gray shading indicates the SEM). Positive deflections represent pairing-induced potentiation and negative deflections represent pairing-induced depression. Pairings with a B spike early in the command cycle, before the peak of the command-evoked synaptic response, typically led to an enhancement of command-evoked depolarization after pairing. Pairings with a B spike near the peak of the command-evoked response led to a reduction of command-evoked depolarization that began just before the pairing delay and was sometimes followed by an enhancement (Fig. 9B,C, second row). Pairings with a B spike after the peak of the command-evoked response led to a hyperpolarization late in the command cycle and to an enhancement of early command-evoked depolarization. Effects of all 27 pairings are shown in Figure 9D (cool colors indicate depression and warm colors potentiation). Despite variability in the magnitude of plasticity across cells and possible order of pairing effects within cells, the temporal specificity of pairing-induced changes is still quite evident.
Figure 9.

B-spike timing shapes MG cell responses through synaptic plasticity. A–C, Effects of pairing on command-evoked synaptic responses in three representative cells. Data in A were obtained using sharp microelectrodes and data in B and C using whole-cell recording. Left columns, average command-evoked synaptic responses before (gray trace) and after (black trace) pairing with a B spike. Right columns, effects of plasticity are revealed in the difference between command-evoked responses before and after pairing (arrows indicates the times at which the B spike was paired; gray shading indicates the SEM). Downward deflections indicate depression and upward deflections indicate potentiation. Responses were typically depressed around the time of the paired B spike and often potentiated at times earlier or later in the command cycle. D, Difference traces for 27 pairings from seven cells, ordered by the B-spike delay (indicated by the black circles). Cool colors indicate depression and warm colors potentiation. Patterns of depression and potentiation depend on the timing of the B spike relative to the command. E, F, Histograms of command-evoked N spikes (black lines) and B spikes (red lines) illustrating changes in N-spike patterns resulting from pairing with B spikes evoked on only a fraction of command cycles. N-spike histograms were constructed from sweeps on which B spikes were not elicited. B-spike histograms include both spontaneous and evoked B spikes (top histogram in E and bottom histogram in F show spontaneous B-spike patterns for this cell). The 20 ms pairing shown in E results in a gradual decrease in the first peak of the N-spike burst (15–20 ms) and the sharpening of the second and third peaks. The 55 ms pairing shown in F results in a large reduction in the later components of the command-evoked N spike burst [compare N-spike histograms at the beginning (top) vs the end of the pairing period (middle)]. G, Color plot illustrating differences in N-spike patterns resulting from pairing with B spikes at various delays. Plot in G includes data shown in E and F, as indicated by time ranges in the top right corner of the histograms. Black dots indicate the occurrence of B spikes. Most B spikes resulted from intracellular current injections (black dots tightly clustered ∼5, 15, 30, and 100 ms after the command). Spontaneous B spikes occurred most frequently just before (0–20 ms) or just after (40–80 ms) the command-evoked N-spike burst. Warm colors indicate increases and cool colors decreases in spike counts relative to the last 60 s of the previous pairing. N-spike counts were averaged over 60 s. Note that B-spike pairings lead to a reduction in spike counts preceding the B spike and in some cases to an increase in spike counts after the B spike.
From a functional standpoint, plasticity of command-evoked synaptic responses is important insofar as it alters MG cell N-spike output. We conducted several additional pairing experiments designed to allow us to track the changes in N-spike patterns that resulted from changes in the timing of B spikes relative to the command. B spikes were again evoked via current injections at various fixed delay relative to the command, but on only a fraction of sweeps (∼1 B spike per 4–5 sweeps). To track changes in N spikes, we constructed N-spike histograms from sweeps on which B spikes were not elicited. Excerpts from one such experiment are shown in Figure 9E,F. Pairing with a B spike at a delay of 20 ms was accompanied by a progressive decline in the first peak of the N-spike burst and a progressive increase in later components of the response [Fig. 9E, compare N-spike histograms before (top) and after several minutes of pairing (bottom)]. Results of a subsequent pairing at a 55 ms delay are shown for the same cell in Figure 9F. Note the decline in the N-spike response over the course of several minutes of pairing (Fig. 9F, top vs middle histograms) and the recovery of response later in the experiment after pairings were concluded (Fig. 9F, bottom). These changes in N-spike patterns are consistent with patterns of depression and potentiation observed in command-evoked synaptic responses for similar B-spike delays.
Patterns of change for five sequential B-spike pairings in this same cell are illustrated in the color plot (Fig. 9G). N-spike histograms (5 ms bins across the sweep) were constructed from 60 s stretches of data. Only those sweeps on which B spikes did not occur were used for constructing histograms. The occurrence of a B spike is indicated by a black dot (both spontaneous B spikes and those evoked by intracellular current injection are plotted). Colored rectangles are the spike counts in the current bin minus the spike count in the corresponding bin at the end of the previous pairing period, or in the case of the first pairing, the last 60 s of the baseline period. Because spike counts are strongly modulated as a function of time during each command cycle, a subtraction procedure was necessary to visualize the relatively smaller changes in spike counts occurring over the course of the experiment as a result of the B-spike pairings. Colors represent increases (warm colors) or decreases (cool colors) in N-spike counts that occurred as a result of changing the timing of B spikes. As expected, changes in the timing of B spikes leads to temporally specific increases and decreases in N spikes similar to those observed for command-evoked synaptic responses.
These experiments also demonstrate that B spikes need not occur on every command cycle to induce plasticity. This is of obvious functional importance given that B spikes are infrequent in vivo. We observed substantial changes in N-spike patterns resulting from on the order of 100 B spikes. Probabilities of evoked B spikes in these experiments were still significantly higher than those typically evoked by the command but were comparable with those observed in some cells in which strong electrosensory stimuli were delivered (Figs. 4, 9E,F, compare B-spike probabilities). Thus, it seems quite possible that, under natural conditions, changes in B-spike patterns could drive functionally significant changes in N spike patterns on a timescale of minutes.
Together, the results of our pairing experiments suggest that changes in the timing and probability of B spikes could act to sculpt MG cell N-spike output through temporally specific increases and decreases in command-evoked excitation. The mechanism for this sculpting is presumably spike timing-dependent plasticity at parallel fiber synapses described previously in vitro, although pairing-induced changes observed in vivo could be attributable to plasticity occurring at other synapses as well (e.g., changes in the strength of command-evoked inhibition). In contrast to previous in vitro studies, we find that potentiation as well as depression of synaptic responses depends on the timing of B spikes.
Discussion
Postsynaptic spikes drive synaptic modifications in a number of brain regions (Roberts and Bell, 2002b; Dan and Poo, 2004). Spikes also underlie signaling between neurons, raising the question as to whether these two functions could be controlled separately. In several systems, including the hippocampus and neocortex, the propagation of spikes into the dendrites can be influenced by synaptic inputs (Tsubokawa and Ross, 1996; Magee and Johnston, 1997; Stuart and Hausser, 2001; Waters and Helmchen, 2004; Leung and Peloquin, 2006). Little is known, however, about the functional roles of dendritic spike regulation or whether it occurs in vivo. Here, we explore this issue in Purkinje-like MG cells of the mormyrid electrosensory lobe where spike timing-dependent synaptic plasticity has been well characterized at the cellular level, can be readily induced in vivo by sensory stimuli, and has been linked to systems level adaptive processing (Bell, 2001).
MG cells exhibit two types of spikes: narrow axon spikes and broad dendritic spikes. We have demonstrated how potentiation and depression of command-evoked synaptic responses depend on the timing of B spikes, thus illustrating how B spikes can shape N spike output through spike timing-dependent synaptic plasticity. We also show that synaptic inputs can influence these two spike types differentially. In particular, we find that central inhibitory inputs exert potent control over the timing and probability of B spikes, thus providing a mechanism for central control over synaptic plasticity.
Central source of broad spike control
Identifying the central source of B-spike inhibition may provide important clues regarding its significance for adaptive sensory processing. The laminar specificity of the effects of inhibitory blockade suggests that the site of B-spike inhibition is in the ventral molecular layer near the probable site of B-spike initiation. The midbrain preeminential nucleus (PE) is the most likely source of B-spike inhibition. PE is a large, higher order electrosensory nucleus that receives input from ELL efferent cells and projects back to the ventral molecular layer of ELL in a reciprocal and topographically precise manner (Bell et al., 1981). Moreover, PE cells exhibit command-evoked bursts of action potentials, the onset and duration of which roughly matches the timing of the pause in B-spike firing (von der Emde and Bell, 1996; Sawtell et al., 2005).
The command-driven inhibition of B spikes may have a functional role in maintaining the command driven depolarization that evokes a burst of N spikes. This burst of N spikes enhances the dynamic range of MG cells because it allows for both increases and decreases in sensory input to be signaled. Because pairing with a B spike depresses command driven EPSPs, the inhibition of the B spikes during the period of the burst is necessary for its maintenance, as demonstrated in a modeling study (Roberts and Bell, 2002a).
The maintenance of a command-driven burst of N spikes could be achieved with a fixed B-spike inhibition. Our evidence goes further, however, and suggests that B-spike inhibition is dynamic. A fixed, command-evoked B-spike inhibition could not account for the differential effects of electrosensory stimuli on N spikes and B spikes. For example, the simplest explanation for a stimulus-evoked increase in N spikes without a concomitant increase in B spikes (Fig. 4A) is that the electrosensory stimulus simultaneously excites N spikes and inhibits B spikes. Some neurons in the preeminential nucleus exhibit command-evoked bursts of action potentials that are enhanced by electrosensory stimuli (Sawtell et al., 2005) and, thus, could account for both command-and stimulus-evoked B-spike inhibition. We also observed that command-evoked B-spike patterns change abruptly depending on the recent history of electrosensory stimulation (Fig. 5A), again suggesting that central control over B spikes is dynamic.
Central control over B spikes may also involve excitation. Both excitatory and inhibitory terminals of preeminential axons are present in the ventral molecular layer (H. Meek, personal communication) and stimulation of the preeminential nucleus elicits both excitation and inhibition of ELL cells (Mohr et al., 2003b). Future studies will address these issues by observing B-spike patterns while manipulating activity in the preeminential nucleus.
Implications for adaptive filtering
Patterns of activity in electroreceptor afferents are affected both by objects in the world and by the fish's own behavior. For example, because the electric organ is located in the tail, swimming movements will modulate the amplitude of the EOD across the receptor surface. Changes in afferent activity caused by movements may be 10 or even 100 times larger than those induced by prey (Chen et al., 2005). Other sensory systems face similar challenges of distinguishing sensory inputs arising from their own movement from inputs caused by external events (von Holst and Mittelstaedt, 1950; Cullen, 2004).
Cerebellum-like circuitry can act as an adaptive filter, removing predictable features (such as those attributable to the animal's own behavior) from the sensory input (Bell, 2001) and similar functions have been hypothesized for the cerebellum itself (Miall et al., 1993; Kawato and Wolpert, 1998; Dean et al., 2002). In both cerebellum-like structures and in the cerebellum, parallel fibers carry signals that could be used to predict the sensory consequences of behavior. In the mormryid ELL parallel fibers carry proprioceptive, motor corollary discharge, and descending electrosensory information. In comparison to efferent cells, MG cells are more numerous, have more apical dendrites, and have dendrites with a greater density of spines (Meek et al., 1996). Thus, the majority of parallel fiber synaptic contacts are onto MG cells, and these cells must have a central role in adaptive processing in ELL.
However, MG cells affect the output of ELL only indirectly, via their inhibition of ELL efferent cells. For MG cells to be effective in removing predictable features of the sensory input they would seem to require feedback concerning the consequences of their influence on ELL efferent cells. Our results suggest that such feedback may be provided by recurrent control from the preeminential nucleus over plasticity in MG cells. Such a scheme would allow for the ongoing adjustment of N spike output guided by the output of ELL efferent cells.
Anti-Hebbian plasticity also appears to be present at parallel fiber-efferent cell synapses in the mormyrid ELL, and such plasticity could help remove predictable features from ELL output directly (Bell et al., 1997b). The need for integrating plasticity in MG cells with plasticity occurring elsewhere in ELL may provide an additional function for the recurrent control of MG cell plasticity that is hypothesized here.
A similar issue arises in the cerebellum-like dorsal cochlear nucleus of mammals, where Purkinje-like cartwheel cells receive parallel fiber input and terminate locally on efferent cells receiving input from the same parallel fibers (Oertel and Young, 2004). A recent study has demonstrated anti-Hebbian spike timing-dependent synaptic plasticity at parallel fiber synapses onto cartwheel cells and Hebbian spike timing-dependent synaptic plasticity at parallel fiber synapses onto efferent cells (Tzounopoulos et al., 2004). A goal for future studies will be to address the significance of plasticity at multiple sites within cerebellum-like circuits and to understand the functions served by Purkinje-like cells.
Schemes for adaptive processing are simpler in the cerebellum-like structures of gymnotid and elasmobranch fish because there are no intervening Purkinje-like cells as in the mormyrid ELL. Anti-Hebbian synaptic plasticity is present at synapses between parallel fibers and efferent cells in these fish, allowing cancellation to proceed directly (Bastian, 1996b; Bodznick et al., 1999).
Central control over synaptic plasticity independent of signaling
A striking feature of data presented here is the degree to which N spikes and B spikes are affected differentially by synaptic inputs. This decoupling is evident in command-evoked patterns of N spikes and B spikes, in changes in these patterns with electrosensory stimuli, and in the effects of blocking inhibition. Separate control over B spikes and N spikes may confer flexibility. Certain patterns or sources of input could drive plasticity with little immediate effect on signaling, whereas others could affect signaling without inducing plasticity. Control over B spikes may also provide a means to turn plasticity on and off or to alter its rate.
This arrangement is, in some respects, similar to the cerebellum, where complex spikes that drive plasticity at parallel fiber synapses are far less frequent than simple spikes and are driven by separate climbing fiber input from the inferior olive. It is hypothesized that climbing fibers serve an instructive role, perhaps signaling errors in motor performance or unexpected sensory events (Simpson et al., 1996) and that climbing fiber-induced long-term depression is a mechanism for supervised learning (Marr, 1969; Albus, 1971; Ito, 1984). Similarly, our results suggest that plasticity in MG cells is supervised by a central signal.
B spikes and N spikes are not entirely independent, however. Strong depolarizations will drive both N spikes and B spikes. Moreover, unlike Purkinje cell complex-spikes, B spike patterns are not entirely controlled by a single central input. We speculate that the central control over plasticity described here may provide a mechanism for learning that is intermediate between supervised and unsupervised.
Footnotes
This work was supported by National Institute of Mental Health Grants MH49792 and MH60996, National Science Foundation Grant IOB 0618212 to C.C.B., and by a National Research Service Award (NS049728-01) to N.B.S. We thank Patrick Roberts for helpful discussions and comments on this manuscript and Michael Long for advice on in vivo whole-cell recording.
References
- Albus JS. A theory of cerebellar function. Math Biosci. 1971;10:25–61. [Google Scholar]
- Anderson JS, Carandini M, Ferster D. Orientation tuning of input conductance, excitation, and inhibition in cat primary visual cortex. J Neurophysiol. 2000;84:909–926. doi: 10.1152/jn.2000.84.2.909. [DOI] [PubMed] [Google Scholar]
- Bastian J. The role of amino acid neurotransmitters in the descending control of electroreception. J Comp Physiol. 1990;172:409–423. doi: 10.1007/BF00213523. [DOI] [PubMed] [Google Scholar]
- Bastian J. Plasticity in an electrosensory system. I. General features of dynamic sensory filter. J Neurophysiol. 1996a;76:2483–2496. doi: 10.1152/jn.1996.76.4.2483. [DOI] [PubMed] [Google Scholar]
- Bastian J. Plasticity in an electrosensory system. II. Postsynaptic events associated with a dynamic sensory filter. J Neurophysiol. 1996b;76:2497–2507. doi: 10.1152/jn.1996.76.4.2497. [DOI] [PubMed] [Google Scholar]
- Bell CC. An efference copy modified by reafferent input. Science. 1981;214:450–453. doi: 10.1126/science.7291985. [DOI] [PubMed] [Google Scholar]
- Bell CC. Duration of plastic change in a modifiable efference copy. Brain Res. 1986;369:29–36. doi: 10.1016/0006-8993(86)90510-x. [DOI] [PubMed] [Google Scholar]
- Bell CC. Mormyromast electroreceptor organs and their afferents in mormyrid electric fish: III. Physiological differences between two morphological types of fibers. J Neurophysiol. 1990;63:319–332. doi: 10.1152/jn.1990.63.2.319. [DOI] [PubMed] [Google Scholar]
- Bell CC. Memory-based expectations in electrosensory systems. Curr Opin Neurobiol. 2001;11:481–487. doi: 10.1016/s0959-4388(00)00238-5. [DOI] [PubMed] [Google Scholar]
- Bell CC, Grant K. Corollary discharge effects and sensory processing in the mormyromast regions of the mormyrid electrosensory lobe: II. Cell types and corollary discharge plasticity. J Neurophysiol. 1992;68:859–875. doi: 10.1152/jn.1992.68.3.859. [DOI] [PubMed] [Google Scholar]
- Bell CC, Finger TE, Russell CJ. Central connections of the posterior lateral line lobe in mormyrid fish. Exp Brain Res. 1981;42:9–22. doi: 10.1007/BF00235724. [DOI] [PubMed] [Google Scholar]
- Bell CC, Zakon H, Finger TE. Mormyromast electroreceptor organs and their afferent fibers in mormyrid fish: I. Morphology. J Comp Neurol. 1989;286:391–407. doi: 10.1002/cne.902860309. [DOI] [PubMed] [Google Scholar]
- Bell CC, Grant K, Serrier J. Corollary discharge effects and sensory processing in the mormyrid electrosensory lobe: I. Field potentials and cellular activity in associated structures. J Neurophysiol. 1992;68:843–858. doi: 10.1152/jn.1992.68.3.843. [DOI] [PubMed] [Google Scholar]
- Bell CC, Caputi A, Grant K, Serrier J. Storage of a sensory pattern by anti-Hebbian synaptic plasticity in an electric fish. Proc Natl Acad Sci USA. 1993;90:4650–4654. doi: 10.1073/pnas.90.10.4650. [DOI] [PMC free article] [PubMed] [Google Scholar]
- Bell CC, Han VZ, Sugawara S, Grant K. Synaptic plasticity in a cerebellum-like structure depends on temporal order. Nature. 1997a;387:278–281. doi: 10.1038/387278a0. [DOI] [PubMed] [Google Scholar]
- Bell CC, Caputi A, Grant K. Physiology and plasticity of morphologically identified cells in the mormyrid electrosensory lobe. J Neurosci. 1997b;17:6409–6422. doi: 10.1523/JNEUROSCI.17-16-06409.1997. [DOI] [PMC free article] [PubMed] [Google Scholar]
- Bodznick D, Montgomery JC, Carey M. Adaptive mechanisms in the elasmobranch hindbrain. J of Exp Biol. 1999;202:1357–1364. doi: 10.1242/jeb.202.10.1357. [DOI] [PubMed] [Google Scholar]
- Chen L, House JL, Krahe R, Nelson ME. Modeling signal and background components of electrosensory scenes. J Comp Physiol. 2005;191:331–345. doi: 10.1007/s00359-004-0587-3. [DOI] [PubMed] [Google Scholar]
- Cullen KE. Sensory signals during active versus passive movement. Curr Opin Neurobiol. 2004;14:698–706. doi: 10.1016/j.conb.2004.10.002. [DOI] [PubMed] [Google Scholar]
- Dan Y, Poo MM. Spike timing-dependent plasticity of neural circuits. Neuron. 2004;44:23–30. doi: 10.1016/j.neuron.2004.09.007. [DOI] [PubMed] [Google Scholar]
- Dean P, Porrill J, Stone JV. Decorrelation control by the cerebellum achieves oculomotor plant compensation in simulated vestibulo-ocular reflex. Proc Biol Sci. 2002;269:1895–1904. doi: 10.1098/rspb.2002.2103. [DOI] [PMC free article] [PubMed] [Google Scholar]
- Gomez L, Kanneworff M, Budelli R, Grant K. Dendritic spike back propagation in the electrosensory lobe of Gnathonemus petersii. J Exp Biol. 2005;208:141–155. doi: 10.1242/jeb.01358. [DOI] [PubMed] [Google Scholar]
- Grant K, Meek J, Sugawara Y, Veron M, Denizot JP, Hafmans J, Serrier J, Szabo T. Projection neurons of the mormyrid electrosensory lateral line lobe: morphology, immunocytochemistry and synaptology. J Comp Neurol. 1996;375:18–42. doi: 10.1002/(SICI)1096-9861(19961104)375:1<18::AID-CNE2>3.0.CO;2-R. [DOI] [PubMed] [Google Scholar]
- Grant K, Sugawara S, Gomez L, Han VZ, Bell CC. The mormyrid electrosensory lobe in vitro: physiology and pharmacology of cells and circuits. J Neurosci. 1998;18:6009–6025. doi: 10.1523/JNEUROSCI.18-15-06009.1998. [DOI] [PMC free article] [PubMed] [Google Scholar]
- Han VZ, Bell CC, Grant K, Sugawara Y. Mormyrid electrosensory lobe in vitro: morphology of cells and circuits. J Comp Neurol. 1999;404:359–374. doi: 10.1002/(sici)1096-9861(19990215)404:3<359::aid-cne6>3.0.co;2-1. [DOI] [PubMed] [Google Scholar]
- Han VZ, Grant G, Bell CC. Reversible associative depression and nonassociative potentiation at a parallel fiber synapse. Neuron. 2000;27:611–622. doi: 10.1016/s0896-6273(00)00070-2. [DOI] [PubMed] [Google Scholar]
- Hirsch JA, Alonso JM, Reid RC, Martinez LM. Synaptic integration in striate cortical simple cells. J Neurosci. 1998;18:9517–9528. doi: 10.1523/JNEUROSCI.18-22-09517.1998. [DOI] [PMC free article] [PubMed] [Google Scholar]
- Ito M. The cerebellum and neural control. New York: Raven; 1984. [Google Scholar]
- Ito M. Cerebellar long-term depression: characterization, signal transduction, and functional roles. Physiol Rev. 2001;81:1143–1195. doi: 10.1152/physrev.2001.81.3.1143. [DOI] [PubMed] [Google Scholar]
- Joshi S, Hawken MJ. Loose-patch-juxtacellular recording in vivo—a method for functional characterization and labeling of neurons in macaque V1. J Neurosci Methods. 2006;156:37–49. doi: 10.1016/j.jneumeth.2006.02.004. [DOI] [PubMed] [Google Scholar]
- Kawato M, Wolpert D. Internal models for motor control. Novartis Found Symp. 1998;218:291–304. doi: 10.1002/9780470515563.ch16. [DOI] [PubMed] [Google Scholar]
- Kurt S, Crook JM, Ohl FW, Scheich H, Schulze H. Differential effects of iontophoretic in vivo application of the GABA(A)-antagonists bicuculline and gabazine in sensory cortex. Hear Res. 2006;212:224–235. doi: 10.1016/j.heares.2005.12.002. [DOI] [PubMed] [Google Scholar]
- Leung LS, Peloquin P. GABA(B) receptors inhibit backpropagating dendritic spikes in hippocampal CA1 pyramidal cells in vivo. Hippocampus. 2006;16:388–407. doi: 10.1002/hipo.20168. [DOI] [PubMed] [Google Scholar]
- Magee JC, Johnston D. A synaptically controlled, associative signal for Hebbian plasticity in hippocampal neurons. Science. 1997;275:209–213. doi: 10.1126/science.275.5297.209. [DOI] [PubMed] [Google Scholar]
- Margrie TW, Brecht M, Sakmann B. In vivo, low-resistance, whole-cell recordings from neurons in the anaesthetized and awake mammalian brain. Pflügers Arc. 2002;444:491–498. doi: 10.1007/s00424-002-0831-z. [DOI] [PubMed] [Google Scholar]
- Marr D. A theory of cerebellar cortex. J Physiol (Lond) 1969;202:437–471. doi: 10.1113/jphysiol.1969.sp008820. [DOI] [PMC free article] [PubMed] [Google Scholar]
- Meek J, Grant K, Sugawara S, Hafmans TGM, Veron M, Denizot JP. Interneurons of the ganglionic layer in the mormyrid electrosensory lateral line lobe: morphology, immunocytochemistry, and synaptology. J Comp Neurol. 1996;375:43–65. doi: 10.1002/(SICI)1096-9861(19961104)375:1<43::AID-CNE3>3.0.CO;2-O. [DOI] [PubMed] [Google Scholar]
- Miall RC, Weir DJ, Wolpert DM, Stein JF. Is the cerebellum a Smith Predictor? J Mot Behav. 1993;25:203–216. doi: 10.1080/00222895.1993.9942050. [DOI] [PubMed] [Google Scholar]
- Mohr C, Roberts PD, Bell CC. Cells of the mormyromast region of the mormyrid electrosensory lobe: I. Responses to the electric organ corollary discharge and to electrosensory stimuli. J Neurophysiol. 2003a;90:1193–1210. doi: 10.1152/jn.00211.2003. [DOI] [PubMed] [Google Scholar]
- Mohr C, Roberts PD, Bell CC. The mormyromast region of the mormyrid electrosensory lobe. II. Responses to input from central sources. J Neurophysiol. 2003b;90:1211–1223. doi: 10.1152/jn.00213.2003. [DOI] [PubMed] [Google Scholar]
- Monier C, Chavane F, Baudot P, Graham LJ, Fregnac Y. Orientation and direction selectivity of synaptic inputs in visual cortical neurons: a diversity of combinations produces spike tuning. Neuron. 2003;37:663–680. doi: 10.1016/s0896-6273(03)00064-3. [DOI] [PubMed] [Google Scholar]
- Oertel D, Young ED. What's a cerebellar circuit doing in the auditory system? Trends Neurosci. 2004;27:104–110. doi: 10.1016/j.tins.2003.12.001. [DOI] [PubMed] [Google Scholar]
- Roberts PD, Bell CC. Computational consequences of temporally asymmetric learning rules: II. Sensory image cancellation. J Comput Neurosci. 2000;9:67–83. doi: 10.1023/a:1008938428112. [DOI] [PubMed] [Google Scholar]
- Roberts PD, Bell CC. Active control of spike-timing dependent synaptic plasticity in an electrosensory system. J Physiol (Paris) 2002a;96:445–449. doi: 10.1016/S0928-4257(03)00022-6. [DOI] [PubMed] [Google Scholar]
- Roberts PD, Bell CC. Spike timing dependent synaptic plasticity in biological systems. Biol Cybern. 2002b;87:392–403. doi: 10.1007/s00422-002-0361-y. [DOI] [PubMed] [Google Scholar]
- Rose GJ, Fortune ES. New techniques for making whole-cell recordings from CNS neurons in vivo. Neurosci Res. 1996;26:88–94. doi: 10.1016/0168-0102(96)01074-7. [DOI] [PubMed] [Google Scholar]
- Sawtell NB, Mohr C, Bell CC. Recurrent feedback in the mormyrid electrosensory system: cells of the preeminential and lateral toral nuclei. J Neurophysiol. 2005;93:2090–2103. doi: 10.1152/jn.01055.2004. [DOI] [PubMed] [Google Scholar]
- Sawtell NB, Williams A, Roberts PD, von der EG, Bell CC. Effects of sensing behavior on a latency code. J Neurosci. 2006;26:8221–8234. doi: 10.1523/JNEUROSCI.1508-06.2006. [DOI] [PMC free article] [PubMed] [Google Scholar]
- Simpson J, Wylie DR, De Zeeuw CI. Climbing fiber signals and their consequence(s) Behav Brain Sci. 1996;19:368–383. [Google Scholar]
- Stuart GJ, Hausser M. Dendritic coincidence detection of EPSPs and action potentials. Nat Neurosci. 2001;4:63–71. doi: 10.1038/82910. [DOI] [PubMed] [Google Scholar]
- Szabo T, Hagiwara S. A latency-change mechanism involved in sensory coding of electric fish. Physiol Behav. 1967;2:331–335. [Google Scholar]
- Tsubokawa H, Ross WN. IPSPs modulate spike backpropagation and associated [Ca2+]i changes in the dendrites of hippocampal CA1 pyramidal neurons. J Neurophysiol. 1996;76:2896–2906. doi: 10.1152/jn.1996.76.5.2896. [DOI] [PubMed] [Google Scholar]
- Tzounopoulos T, Kim Y, Oertel D, Trussell LO. Cell-specific, spike timing-dependent plasticities in the dorsal cochlear nucleus. Nat Neurosci. 2004;7:719–725. doi: 10.1038/nn1272. [DOI] [PubMed] [Google Scholar]
- von der Emde G, Bell C. Nucleus preeminentialis of mormyrid fish, a center for recurrent electrosensory feedback. I. Electrosensory and corollary discharge responses. J Neurophysiol. 1996;76:1581–1596. doi: 10.1152/jn.1996.76.3.1581. [DOI] [PubMed] [Google Scholar]
- von Holst E, Mittelstaedt H. The principle of reafference. Naturwissenschaften. 1950;37:464–476. [Google Scholar]
- Waters J, Helmchen F. Boosting of action potential backpropagation by neocortical network activity in vivo. J Neurosci. 2004;24:11127–11136. doi: 10.1523/JNEUROSCI.2933-04.2004. [DOI] [PMC free article] [PubMed] [Google Scholar]