

Abstract
We examined the regenerative capacity of the adult zebrafish retina by intravitreal injection of a low ouabain concentration to rapidly damage the ganglion cell layer (GCL) and inner nuclear layer (INL) with minimal photoreceptor cell damage. By 24 h after ouabain injection, maximal numbers of terminal deoxynucleotidyl transferase-mediated biotinylated UTP nick end labeling (TUNEL)-positive cells were detected in the INL and GCL, with low numbers of TUNEL-positive cells in the outer nuclear layer. Immunolabeling revealed that ∼85% of the HuC/D-positive amacrine and ganglion cells were lost by 7 d post-ouabain injection (dpi). This ganglion cell loss was consistent with the small, but statistically significant, decrease in the optic nerve diameter. The regeneration response began within 1 dpi with increased proliferating cell nuclear antigen (PCNA) expression in both the INL and GCL. By 3 dpi, PCNA expression is primarily restricted to the Müller glia. By 5 dpi, most of the PCNA expression was localized to neuronal progenitors expressing the olig2:egfp transgene rather than the Müller glia. By 7 dpi, the neuronal progenitors began committing to the ganglion cell fate based on the coexpression of the atoh7:EGFP transgene and the zn5 antigen. The regeneration of ganglion and amacrine cells continued until 60 dpi, when they reached 75% of their uninjected control number. This demonstrates that inner retinal damage, without extensive photoreceptor damage, is sufficient to induce a regeneration response that is marked by the Müller glial cells reentering the cell cycle to produce neuronal progenitor cells that regenerate INL and ganglion cells in the zebrafish retina.
Keywords: retinal degeneration, retinal regeneration, retinal apoptosis, retinal progenitor, Müller glia, zebrafish
Introduction
Zebrafish (Danio rerio) is an important vertebrate model system in visual neuroscience (Bilotta and Saszik, 2001). The teleost retina exhibits persistent neurogenesis throughout its life from two distinct cellular sources (Johns, 1977; Otteson and Hitchcock, 2003). Stem cells scattered throughout the inner nuclear layer (INL) produce the rod precursor cells found in the outer nuclear layer (ONL), which are restricted to only differentiate into rods during persistent neurogenesis (Johns, 1982; Julian et al., 1998; Otteson et al., 2001). A stem cell population located at the circumferential marginal zone (CMZ) produces all of the remaining cell types (Johns and Easter, 1977; Johns, 1982).
These stem cell sources may behave differently during regeneration of the injured retina. Models to examine the extent and mechanisms involved in retinal regeneration have been developed using chick, goldfish, and zebrafish (Maier and Wolburg, 1979; Raymond et al., 1988; Fischer et al., 1998; Vihtelic and Hyde, 2000). In teleosts, the retinal neurons regenerated in response to surgical removal of retinal cells (Hitchcock et al., 1992; Cameron and Easter, 1995; Cameron and Carney, 2000), light- or laser-induced photoreceptor degeneration (Braisted et al., 1994; Vihtelic and Hyde, 2000; Wu et al., 2001; Vihtelic et al., 2006), toxin injection (Maier and Wolburg, 1979; Raymond et al., 1988; Negishi et al., 1991a,b; Braisted and Raymond, 1992), or retinal puncture (Fausett and Goldman, 2006). In all of these damage paradigms, INL cells were the source of the regenerated neurons. Recent data demonstrate that the Müller glia begin to proliferate and are very likely the source of the regenerated neurons (Braisted et al., 1994; Wu et al., 2001; Yurco and Cameron, 2005; Fausett and Goldman, 2006; Vihtelic et al., 2006). It was proposed in several of these studies that ONL cell death was required to trigger the initiation of the regeneration response in the teleost retina (Negishi et al., 1987; Raymond et al., 1988; Braisted and Raymond, 1992; Otteson and Hitchcock, 2003). In the postnatal chick, however, restricting toxin-induced cell death to the inner retina induced a regeneration response without any obvious damage to the ONL (Fischer and Reh, 2001).
We describe a model of inner retinal cell death to examine the selective regeneration of nonphotoreceptor neurons in the adult zebrafish retina. Rather than using a high intravitreal ouabain concentration to rapidly cause cell death in all nuclear layers (Maier and Wolburg, 1979; Raymond et al., 1988), we used a low ouabain concentration (2 μm) to essentially restrict the cell death to the inner retinal cells (ganglion and INL cells), without significantly affecting the photoreceptors. The early regeneration response involved the Müller glial cells reentering the cell cycle and producing proliferating neuronal progenitor cells that expressed enhanced green fluorescent protein (EGFP) in the Tg(olig2:egfp)vu12 transgenic line. The amacrine and ganglion cells regenerated, and the laminar organization of the retina was essentially restored within 60 d of the ouabain injection. These data suggest that selective regeneration of the inner zebrafish retina can be induced with very little, if any, damage to the photoreceptor cells.
Materials and Methods
Animals.
Zebrafish (D. rerio) were raised at 28.5°C in a 14/10 h light/dark regimen under an average illuminance of 200 lux using standard husbandry techniques (Westerfield, 1993). All experiments were performed using wild-type AB zebrafish at 7–12 months of age. Before enucleation, fish were anesthetized using 2-phenoxyethanol (1:1000 dilution). The fish were killed by decapitation under deep anesthesia. All experiments were conducted in accordance with the protocols approved by the animal use committee at the University of Notre Dame and the Association for Research in Vision and Ophthalmology statement on the use of animals in vision research.
Transgenic zebrafish lines.
Three different transgenic zebrafish lines were used in this study. The Tg(olig2:egfp)vu12 transgenic line expresses EGFP using an olig2 bacterial artificial chromosome clone (Shin et al., 2003). This transgene, which is not expressed in the undamaged adult retina, drives EGFP expression in the neuronal progenitor cells during the regeneration response (Kassen et al., 2007). The Tg(gfap:EGFP)nt transgenic line expresses EGFP from a 1.5 kb glial fibrillary acidic protein (gfap) genomic PCR product (Kassen et al., 2007). This transgene continually expresses EGFP in all of the Müller glial cells of the adult retina.
To generate the Tg(atoh7:EGFP)nt transgenic line, wild-type AB-strain genomic DNA was used as a template for PCR amplification of a 2654 bp product immediately upstream of the atonal homolog 7 (atoh7) translational start codon using Platinum TaqDNA Polymerase High Fidelity (Invitrogen, Carlsbad, CA). The forward (5′-GTCGACGTCACTTTCCTCGAGTTCAGAGG-3′) and reverse (5′-TCTAGAGTCACCGATGTTCTTGGGATG-3′) primers included SalI and XbaI restriction sites, respectively. PCR products were A-tailed and cloned into the pCR4.0-TOPO vector (Invitrogen). EGFP was cloned into a modified pT2KXIG vector (Kawakami et al., 1998) using BamHI and BglII (Thummel et al., 2005). The atoh7 promoter fragment was subcloned into the modified pT2KXIG expression vector using the SalI and XbaI restriction sites.
Plasmid DNA for injection was purified using the QIAGEN (Valencia, CA) Plasmid Maxi kit, extracted with phenol:chloroform (1:1), precipitated with ethanol, and resuspended in nuclease-free water. Tol2 transposase was transcribed in vitro from pCSTZ2.8 plasmid DNA (Kawakami et al., 1998) and prepared as described previously (Thummel et al., 2005). The pT2KXIG plasmid DNA containing the GFAP promoter and in vitro transcribed Tol2 mRNA were combined at a concentration of 25 ng/μl each and injected into two- to four-cell-stage embryos. Founders were identified by outcrossing F0 adults and screening the progeny for EGFP expression. Independent transgenic lines were generated from F1 transgene carriers. Expression of EGFP in the developing ganglion cells of the transgenic embryos was confirmed by immunolabeling embryonic retinal sections from 48 to 72 h after fertilization.
Ouabain treatment protocols.
Before each intravitreal injection, the approximate volume of the vitreal space was calculated using measurements taken with digital calipers as described by Raymond et al. (1988). The vitreal space was approximated to be the difference between the volume of the entire eye globe minus the volume of the lens. After this calculation, 0.2–0.5 μl of a freshly prepared 3.0 μm ouabain solution (MP Biomedicals, Solon, OH) was delivered into each eye through a small incision in the posterior cornea adjacent to the lens with a double-edged sapphire microknife (World Precision Instruments, Sarasota, FL). Delivery of the appropriate volume of ouabain was accomplished using a blunt-end 33 gauge Hamilton (Reno, NV) syringe. Control eyes were injected with an equivalent volume of 0.65% sterile saline. A final intravitreal concentration of 2.0 μm ouabain was selected for this study, based on preliminary histological and immunohistochemical analysis of ouabain concentrations ranging from 1 to 10 μm.
Histology and retinal morphometric analysis.
A summary of experimental protocols is presented in Table 1. To evaluate the morphology of ouabain-treated retinas, histological analysis was performed as detailed by Vihtelic and Hyde (2000). Eyes were enucleated, fixed overnight at 4°C in 2% formaldehyde/2.5% glutaraldehyde/100 mm sodium cacodylate, pH 7.4, and washed in 100 mm cacodylate for 30 min at room temperature. After a water rinse, the eyes were dehydrated through an ethanol series, placed in 1:1 xylene/ethanol and 100% xylene/Polybed 812, and finally placed into fresh Polybed 812 (Polysciences, Warrington, PA). The resin was polymerized at 60°C. Serial 3 μm sections were cut in the dorsal–ventral plane using a glass knife on a JB4 microtome and stained with 1% methylene blue/1% azure II.
Table 1.
Experimental protocols
| Experimental description | Retinas examined | Collection time points | Sampling methods |
|---|---|---|---|
| Retinal morphometry | 72 | 0, 1, 3, 5, 7, 14, 21, and 60 dpi | Various retinal morphometric measurements were made on the dorsal aspect of central retinal sections |
| TUNEL | 54 | 0, 3, and 8 hpi and 1, 3, 5, 7, 14, and 21 dpi | TUNEL-positive cells were counted across the dorsal aspect of central retinal sections |
| PCNA | 32 | 0, 1, 3, 4, 5, 7, 14, 21, and 60 dpi | PCNA-positive cells were counted across the dorsal aspect of central retinal sections |
| HuC/D | 32 | 0, 1, 3, 5, 7, 14, 21, and 60 dpi | HuC/D-positive cells were counted across the dorsal aspect of central retinal sections |
| EGFP | 28 | 0, 1, 3, 5, 7, 14, and 21 dpi | Tg(gfap:EGFP)nt transgenic fish were labeled for PCNA to assess Müller cell proliferation |
The five major experiments described in this manuscript are listed, along with the number of retinas and time points examined.
The changes in the retinal morphology that resulted from the ouabain-induced damage were quantified throughout a 60 d time course (Table 2). At each time point, measurements and cell counts were made from two retinal sections including or immediately adjacent to the optic nerve from at least eight different retinas. All measurements and cell counts in this manuscript were taken from the dorsal retina, which was defined as the retinal region between a point 100 μm from the optic nerve head and 100 μm from the CMZ. The retinal thickness was measured from the proximal-most identifiable nucleus in the ONL to the distal-most identifiable nucleus in the ganglion cell layer (GCL) or, when necessary because of degeneration, the last identifiable nucleus in the remaining inner retinal tissue. The same sections were also used to count the number of labeled nuclei present in each of the three retinal layers (ONL, INL, and GCL) when the individual layers could be identified. All statistical analyses were performed using SPSS 11.0 (SPSS, Chicago, IL). All datasets were analyzed with a one-way ANOVA (significance level, p ≤ 0.05) and post hoc multiple comparisons using Tukey's test.
Table 2.
Retinal morphometry
| Treatment duration (dpi) | No. of retinas/no. of measurements | Retinal morphometry mean values |
|||||
|---|---|---|---|---|---|---|---|
| Retinal thickness (μm) | Inner retina total no. of nuclei | ONL nuclei | INL nuclei | GCL nuclei | Total no. of nuclei | ||
| Control | 10/19 | 44.9 (5.9) | 849 (69.9) | 629 (50.3) | 737.5 (68.9) | 111.5 (21.3) | 1478 (106.5) |
| 1 | 8/15 | 78.8 (5.2) | 621.7 (68.6) | 642.9 (74.2) | 559.6 (61.0) | 62.1 (20.8) | 1264.6 (91.5) |
| 3 | 9/17 | 31.2 (6.4) | 206.9 (79.7) | 581.2 (97.7) | 206.9 (79.7) | 0.0 (0.0) | 788.1 (120.9) |
| 5 | 9/17 | 33.7 (6.7) | 330.7 (115.3) | 570.6 (90.9) | 330.7 (115.3) | 0.0 (0.0) | 901.3 (151.7) |
| 7 | 10/19 | 33.0 (6.9) | 485 (158.1) | 606.0 (125.2) | 485.0 (158.1) | 0.0 (0.0) | 1091.0 (216.7) |
| 14 | 9/17 | 29.9 (5.1) | 506.4 (47.9) | 587.3 (135.6) | 462.7 (56.9) | 43.6 (23.3) | 1093.6 (170.6) |
| 21 | 8/15 | 33.6 (6.0) | 493.2 (229.8) | 620.9 (104.2) | 435.0 (217.6) | 58.2 (24.9) | 1114.1 (314.7) |
| 60 | 9/17 | 37.6 (4.0) | 595 (65.7) | 674.5 (133.4) | 519 (71.5) | 76 (14.3) | 1269.5 (125.9) |
Morphometric measurements and cell counts were taken from two sections per dorsal retina from eight to 10 retinas per time point after ouabain injection. The dorsal retina is defined as the area 100 μm from the CMZ to 100 μm from the optic nerve head on sections including or adjacent to the optic nerve. Numbers in parentheses represent SD from the mean. The control represents retinas that were intravitreally injected with 0.65% saline and harvested immediately. No., Number.
To evaluate the loss of ganglion cells and their axons in ouabain-treated retinas, changes in the optic nerve head diameter were quantified throughout the 60 d time course. Histology was performed as described above. For each eye, three linear measurements of the optic nerve head diameter were determined from two central optic nerve sections. For each time point, the measurements from six independent eyes were averaged and statistically analyzed using SPSS 11.0. All datasets were analyzed with a one-way ANOVA (significance level, p ≤ 0.05) and post hoc multiple comparisons using Tukey's test.
Terminal deoxynucleotidyl transferase-mediated biotinylated UTP nick end labeling.
Apoptotic cells were identified in frozen retinal sections by streptavidin–fluorescein detection of biotinylated dUTP incorporation [TACS terminal deoxynucleotidyl transferase (TdT) kit; R & D Systems, Minneapolis, MN]. Retinal TdT-mediated biotinylated UTP nick end labeling (TUNEL)-positive nuclei were quantified at 0, 3, and 8 h and 1, 2, 3, 4, 5, 7, 14, and 21 d after intravitreal ouabain injection. Eyes were fixed in 3.7% formaldehyde/PBS for 4 h at room temperature. The eyes were rinsed with 1× PBS, cryoprotected in 30% sucrose/PBS, pH 7.4, transferred to 1:1 30% sucrose/PBS:tissue-freezing media (TFM) overnight at 4°C, and frozen embedded in 100% TFM. We generated 10 μm serial sections cut on the dorsal–ventral plane through the central retina beginning at the most anterior aspect of the lens. Cryosections were mounted onto Superfrost/Plus glass slides and air dried for 2 h at room temperature and stored at −80°C.
Sections were permeabilized with Neuropore (R & D Systems) for 75 min at room temperature, and TUNEL was performed at 37°C according to the manufacturer's protocol. For each section, all TUNEL-labeled nuclei across the entire dorsal retina were counted to produce an average number of TUNEL-positive nuclei per dorsal retinal section (Table 3). Positive and negative controls included adding TACS-nuclease and omitting the TdT enzyme, respectively.
Table 3.
TUNEL cell quantification
| Treatment duration | No. of retinas/no. of measurements | Avg. number of TUNEL-positive cells per retinal section |
||
|---|---|---|---|---|
| IRLs | ONL | Total | ||
| Control | 6/12 | 0.0 (0.0) | 0.0 (0.0) | 0.0 (0.0) |
| 3 hpi | 6/12 | 34.8 (8.1) | 0.0 (0.0) | 34.8 (8.1) |
| 8 hpi | 6/12 | 140.9 (23.3) | 0.0 (0.0) | 140.9 (23.3) |
| 1 dpi | 6/12 | 248.3 (58.2) | 9.7 (7.6) | 258 (65.9) |
| 3 dpi | 6/12 | 191.3 (15.6) | 9.4 (2.9) | 200.7 (18.6) |
| 5 dpi | 6/12 | 119.8 (24.9) | 1.4 (1.7) | 121.2 (26.7) |
| 7 dpi | 6/12 | 25.4 (7.5) | 2.1 (2.7) | 27.5 (10.2) |
| 14 dpi | 6/12 | 17.5 (5.5) | 0.8 (1.0) | 18.3 (6.6) |
| 21 dpi | 6/13 | 5.25 (2.1) | 0.0 (0.0) | 5.25 (2.1) |
TUNEL-positive cells counts were taken from two sections per dorsal retina from six retinas per time point. The dorsal retina is defined as the area 100 μm from the CMZ to 100 μm from the optic nerve head on sections including or adjacent to the optic nerve. Numbers in parentheses represent SD from the mean. The control represents retinas that were intravitreally injected with 0.65% saline and harvested immediately. Avg., Average; IRLs, inner retinal layers; no., number.
Immunohistochemistry and cellular quantification.
Immunohistochemistry was performed on retinal sections that were isolated at 1, 3, 4, 5, 7, 14, 21, and 60 d post-ouabain injection (dpi). Eyes were fixed in either 9:1 ethanolic formaldehyde [95% ethanol:37% formaldehyde (Vihtelic and Hyde, 2000)] or 4% paraformaldehyde overnight at 4°C. The fixed tissues were rehydrated through an ethanol series, cryoprotected in 30% sucrose/PBS, pH 7.4, transferred to a 30% sucrose solution containing a 1:1 mixture of PBS (pH 7.4):TFM (Triangle Biomedical Sciences, Durham, NC) overnight at 4°C, and frozen embedded in 100% TFM. Cryosections (14 μm) were cut along the dorsal–ventral plane and mounted onto Superfrost/Plus glass slides (Fisher Scientific, Pittsburgh, PA), air dried for 2 h at room temperature, and stored at −80°C.
Stored sections were rehydrated in PBS, pH 7.4, outlined with a Pap Pen (Ted Pella, Redding, CA), and blocked with PBS/2% normal goat serum for 60 min at room temperature. The sections were incubated with either a 1:1000 dilution of anti-proliferating cell nuclear antigen (PCNA) monoclonal antibody (clone PC10; Sigma, St. Louis, MO), a 1:500 dilution of rabbit anti-PCNA polyclonal antiserum (Abcam, Cambridge, MA), a 1:1500 dilution of rabbit anti-GFP polyclonal antiserum (Abcam), or a 1:50 dilution of mouse anti-zn5 monoclonal antibody (Zebrafish International Resource Center, Eugene, OR) in PBS/2% normal goat serum/0.2% Triton X-100/1% DMSO. Secondary antibodies included either Alexa Fluor 488 or Alexa Fluor 594 (Invitrogen) diluted 1:500 in PBS/2% normal goat serum/0.2% Triton X-100.
Double-label experiments were performed using anti-PCNA and other selected antibodies. Rod photoreceptors were detected using affinity-purified rabbit polyclonal antiserum to zebrafish rhodopsin [1:5000 dilution (Vihtelic et al., 1999)], Müller glia were detected using mouse monoclonal anti-glutamine synthetase (1:500 dilution; Millipore, Billerica, MA), amacrine and ganglion cells were detected using an anti-HuC/D monoclonal antibody (1:30 dilution; Invitrogen), and cone cells were detected using rabbit anti-green cone opsin polyclonal antiserum [1:500 dilution (Vihtelic et al., 1999)].
From each eye examined, all quantifications were performed on at least two sections from the dorsal retina that included or were adjacent to the optic nerve. All HuC/D-positive or PCNA-positive cells across the entire dorsal retina were counted to determine the average number of labeled nuclei per dorsal retina (Tables 4, 5, respectively). To assess Müller cell survival during the ouabain-damage time course, the number of EGFP-positive cells per dorsal retina and the percentage of those cells coexpressing PCNA were quantified using the Tg(gfap:EGFP)nt zebrafish line (see Fig. 7G,H). Representative images for all samples were collected and analyzed using a Leica TCS SP5 Broadband Confocal System (Leica Microsystems, Wetzlar, Germany).
Table 4.
HuC/D cell quantification
| Treatment duration (dpi) | No. of retinas/no. of measurements | Avg. no. HuC/D-positive cells per dorsal retina |
|---|---|---|
| Control | 4/8 | 475.0 (32.5) |
| 1 | 4/8 | 148.1 (17.5) |
| 3 | 4/8 | 123.0 (9.4) |
| 5 | 4/8 | 76.0 (13.5) |
| 7 | 4/8 | 73.4 (13.5) |
| 14 | 4/8 | 233.8 (26.3) |
| 21 | 4/8 | 297.5 (29.8) |
| 60 | 4/8 | 356.4 (29.6) |
HuC/D-positive cell counts were taken from two sections per dorsal retina from four retinas per time point. The dorsal retina is defined as the area 100 μm from the CMZ to 100 μm from the optic nerve head on retinal sections including or adjacent to the optic nerve. Numbers in parentheses represent SD from the mean. The control represents retinas that were intravitreally injected with 0.65% saline and harvested immediately. Avg., Average; no., number.
Table 5.
PCNA cell quantification
| Treatment duration (dpi) | No. of retinas/no. of measurements | Avg. no. of PCNA-positive cells per dorsal retina |
|---|---|---|
| Control | 4/8 | 0.3 (0.5) |
| 1 | 4/8 | 78.6 (21.7) |
| 3 | 4/8 | 130.3 (23.9) |
| 4 | 4/8 | 372.8 (35.6) |
| 5 | 4/8 | 507.6 (47.3) |
| 7 | 4/8 | 463.1 (18.5) |
| 14 | 4/8 | 206.6 (16.1) |
| 21 | 4/8 | 131.6 (12.1) |
| 60 | 4/8 | 57.8 (17.7) |
PCNA-positive cell counts were taken from two sections per dorsal retina from four retinas per time point. The dorsal retina is defined as the area 100 μm from the CMZ to 100 μm from the optic nerve head on sections including or adjacent to the optic nerve. Numbers in parentheses represent SD from the mean. The control represents retinas that were intravitreally injected with 0.65% saline and harvested immediately. Avg., Average; no., number.
Figure 7.
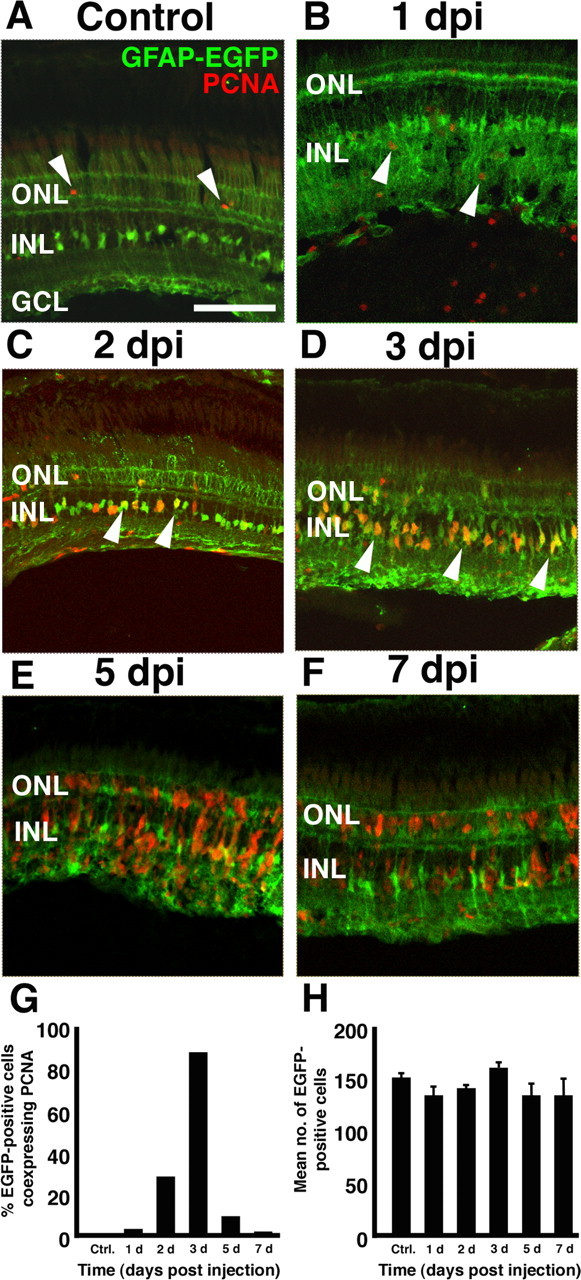
The Müller glial cells proliferate early in the regeneration response. Frozen retinal sections of Tg(gfap:EGFP)nt transgenic zebrafish were used to easily identify the Müller glia in the ouabain-damaged retina. A, Control section from a retina injected with 0.65% saline possessed very few PCNA-labeled cells (red; arrowheads). These PCNA-labeled cells in the ONL likely correspond to the rod precursor cells that are a part of the normal persistent neurogenesis. B, At 1 dpi, PCNA-labeled cells were detected throughout the retina, and nearly all cells examined did not colocalize with EGFP (arrowheads). C, At 2 dpi, several EGFP-positive INL cells with distinct Müller cell morphology coexpressed PCNA (arrowheads). D, At 3 dpi, the majority (89%) of the PCNA-labeled cells colabeled with the Müller glial cells (arrowheads). E, F, As cell proliferation continues, PCNA-labeled cells were found in clusters surrounding the Müller glia but in most cases did not colabel with the EGFP-positive Müller glia. These elongated PCNA-labeled (EGFP-negative) cells appeared to migrate between the retinal layers and were found in all nuclear layers of the regenerating retina. G, Graph of the percentage of EGFP-positive cells coexpressing PCNA in the dorsal retina (y-axis) versus the days after ouabain injection. H, Graph of the mean number of EGFP-positive cells in the dorsal retina (y-axis) versus the days after ouabain injection. Ctrl., Control; no., number. Error bars represent SEM (n = minimum of 2 retinas per time point). Scale bar, 75 μm.
Immunoblot analysis.
Total retinal protein for immunoblot analysis was harvested from control and ouabain-treated fish by homogenizing eight retinas from each time point in extraction buffer [PBS (pH 7.4)/1% Triton X-100] and incubating on ice for 1 h. The total protein equivalent of 0.2 retinas for each time point was combined with 4× sample loading buffer and 10× reducing buffer (Invitrogen). The samples were incubated at 70°C for 10 min, electrophoresed through a 4–12% SDS-PAGE (Invitrogen) in an X-Cell Blot II module (Invitrogen), and transferred to polyvinylidene difluoride (PVDF). The membranes were blocked in PBS/5% nonfat dry milk/0.1% Tween 20 and incubated for 1 h at 4°C with a mouse anti-glutamine synthetase monoclonal antibody (1:1000; Millipore), rabbit anti-GFAP polyclonal antiserum (1:5000; DakoCytomation, Glostrup, Denmark), or a mouse anti-actin monoclonal antibody (1:10,000; Calbiochem, San Diego, CA). After primary antibody incubation, the membranes were washed three times in PBS/0.1% Tween 20 for 20 min and incubated for 1 h at room temperature with the appropriate HRP-conjugated secondary antibody. The ECL-Plus detection system (GE Healthcare, Piscataway, NJ) was used to visualize primary antibody binding by exposing the PVDF membranes to x-ray film. Densitometry analysis was performed on the x-ray films using the Kodak (New Haven, CT) Image Station 2000r and the Kodak 1D 3.6 software package. For each blot (glutamine synthetase, n = 4; GFAP, n = 5), each time point was normalized against the corresponding β-actin control, and the densitometry relative to the uninjected control was calculated and plotted. All statistical analyses were performed using SPSS 11.0. All datasets were analyzed with a one-way ANOVA (significance level, p ≤ 0.05) and post hoc multiple comparisons using Tukey's test.
Results
Ouabain exhibits a concentration-dependent effect on photoreceptor cell loss
Previous work suggested that ONL cell death is required to initiate a regeneration response in the teleost retina (Raymond et al., 1988; Hitchcock et al., 1992). To examine this requirement, we injected ouabain into the vitreal space of wild-type AB-strain zebrafish at final concentrations ranging from 1.0 to 10 μm. Histological analysis revealed that ouabain treatment resulted in a rapid progression of inner retinal cell damage at all concentrations >2.0 μm (Fig. 1). The 10 μm ouabain treatment resulted in widespread loss of nuclei in the GCL, INL, and ONL by 4 dpi (Fig. 1B). The rod outer segments (ROS) were severely disrupted, which was consistent with the nuclear loss in the ONL. By 60 dpi, the retina had regained all three nuclear layers, and the ROS were present (Fig. 1C). At the other extreme of tested ouabain concentrations, 1.0 μm failed to generate any significant, reproducible retinal damage (data not shown).
Figure 1.

Histology of ouabain-induced retinal degeneration and regeneration. A–F, Plastic sections (3 μm) from a wild-type control retina injected with 0.65% saline (A, D) and ouabain-injected retinas (B, C, E, F) were stained with methylene blue/azure II. Injection of ouabain at 10 μm (B, C) and 2 μm (E, F) produced maximum damage at 4 and 3 dpi (B, E), respectively. Although 10 μm ouabain resulted in destruction of all of the retinal layers, including the photoreceptors (B), 2 μm ouabain failed to cause any significant loss of photoreceptor nuclei in the ONL. Although visibly thinner than the controls, both 10 and 2 μm ouabain-treated retinas have reestablished all three nuclear layers at 60 dpi relative to 4 and 3 dpi (C, F, respectively). Scale bar, 25 μm.
We determined that a final intravitreal concentration of 2.0 μm was the lowest concentration that yielded a reproducible retinal damage response. By 3 dpi, 2.0 μm ouabain resulted in massive nuclear loss and disorganization in both the INL and GCL (Fig. 1E). The ONL and ROS, in contrast, appeared relatively undamaged at this time. By 60 dpi (Fig. 1F), the INL and GCL had regained nuclei, and the three distinct nuclear layers had reformed. This suggested that the inner retinal layers had regenerated with only very minimal damage to the photoreceptors.
Ouabain induces loss and disorganization of inner retinal neurons with minimal damage to photoreceptors
Light microscopy revealed several dramatic changes in the retina during the first 7 d after the 2.0 μm ouabain injection. At 1 dpi, the inner plexiform layer (IPL) was severely swollen, and pyknotic nuclei were observed in both the INL and GCL (Fig. 2B, arrows). By 3 dpi, the total number of inner retinal nuclei was reduced ∼76% relative to the control retina (Table 2). This cell loss corresponded to a collapse of the inner retinal layers, with the retinal thickness decreasing ∼31% relative to the control retina (Fig. 2C, Table 2). As lamination was lost in the inner retina, vacuoles and gaps in the histological architecture appeared (Fig. 2C, arrowheads), suggesting that the structural integrity of the inner retina was altered. In contrast to this extensive inner retinal cell loss, there was only an 8% decrease in the number of ONL nuclei at 3 dpi (Table 2), which was not statistically significant based on one-way ANOVA analysis (p = 0.958; data not shown).
Figure 2.
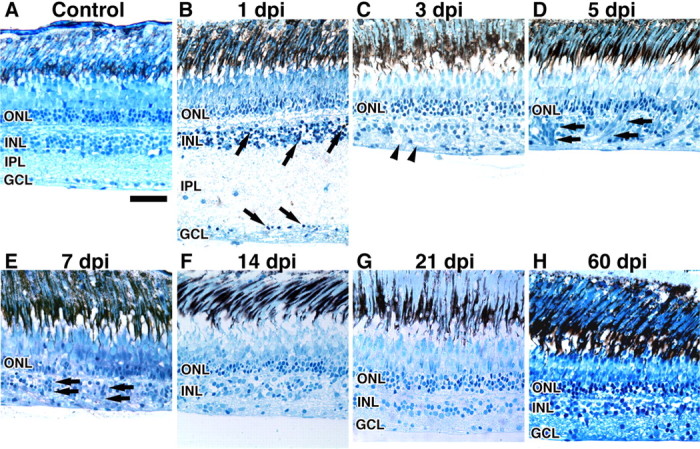
Histological time course of degeneration and regeneration in the ouabain-treated retina. A–H, Wild-type control retina (A) and retinas injected with 2 μm ouabain (B–H) were sectioned and stained with methylene blue/azure II. The wild-type retina possesses all three nuclear layers. B, At 1 dpi, the IPL is severely swollen, and darkly stained pyknotic nuclei are present in the INL and GCL (arrows). C, At 3 dpi, the retina has undergone maximum degeneration and possesses many vacuoles within the retinal tissue (arrowheads); however, the ONL remained intact. D, E, Between 5 and 7 dpi, clusters of fusiform-shaped cells are identified within the damaged retinal tissue (arrows). F–H, Between 14 and 60 dpi, retinal lamination is restored. H, The ouabain-treated retina reestablished all three nuclear layers by 60 dpi. Scale bar, 25 μm.
To further characterize the significant reduction of inner retinal neurons and the apparent preservation of photoreceptor cells in the ouabain-treated zebrafish retina, we examined the extent of apoptotic cell death using TUNEL. TUNEL-positive nuclei were found in the GCL at 3 h post-ouabain injection (hpi) (Fig. 3A,G) and within the INL at 8 hpi (Fig. 3B). By 1 dpi, the number of TUNEL-positive nuclei had increased further (Fig. 3G), and the IPL swelling was again apparent with an increased distance between the INL and GCL TUNEL-positive nuclei (Fig. 3C). This large number of TUNEL-positive nuclei was consistent with the histological appearance of pyknotic nuclei in the INL and GCL at 1 dpi (Fig. 2B). At 3 and 5 dpi, the loss of inner retinal lamination made it difficult to further distinguish whether the TUNEL-positive nuclei corresponded to the INL or GCL cells (Fig. 3D,E). Although the number of TUNEL-positive nuclei in the retina remained significantly above control levels until 14 dpi (Fig. 3G) (p ≤ 0.05), the majority of the cell death (93%) occurred during the first 5 d after ouabain treatment (Table 3).
Figure 3.
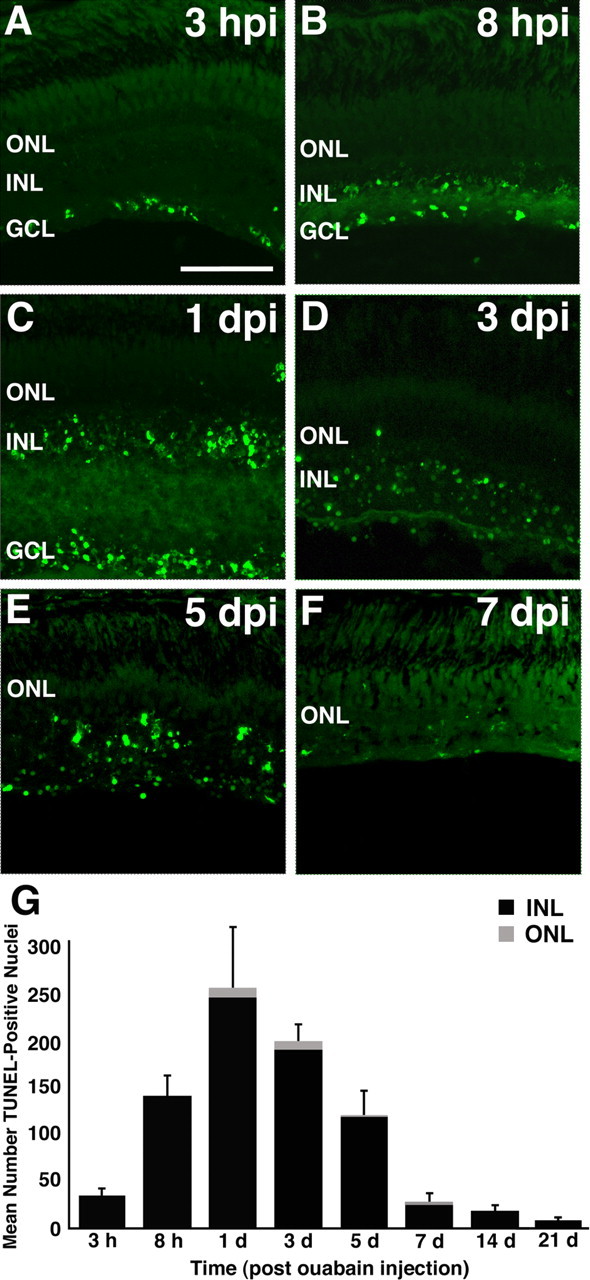
Progression of retinal cell death in the ouabain-damaged retina. A, Within 3 h of injecting a final concentration of 2 μm ouabain intravitreally, TUNEL-positive nuclei were detected exclusively in the GCL. B, C, At 8 and 24 hpi, a large number of TUNEL-positive nuclei were present in both the INL and the GCL, whereas very few labeled cells were detected in the ONL. D, E, As the inner retinal architecture was destroyed, large numbers of TUNEL-labeled cells were randomly distributed within the remainder of the inner retinal layers and only sparsely in the ONL. F, At 7 dpi, the number of TUNEL-positive cells had returned to the control levels. G, A graph of the number of TUNEL-positive cells (y-axis) in the dorsal retina plotted against the time after ouabain injection (x-axis). The number of TUNEL-positive nuclei in the ONL is represented as the lightly shaded bar, and the number of TUNEL-positive nuclei in the inner retina is represented as the black bar. Error bars represent SD (n = 6 retinas per time point). Scale bar, 75 μm.
In contrast to the substantial inner retinal cell death, the ONL exhibited very few TUNEL-positive nuclei and none until 1 dpi (Fig. 3C,D). The TUNEL-positive nuclei in the ONL represented <3.0% of the total TUNEL-positive cells in the retina (Fig. 3G, Table 3), with the majority of TUNEL-positive ONL nuclei present at 1 and 3 dpi (Table 3). This suggests that photoreceptor cell death remained at very low levels after the ouabain treatment.
As an alternative method to assess the extent of retinal damage after ouabain injection, we immunolabeled frozen retinal sections with an anti-HuC/D monoclonal antibody that labels terminally differentiated ganglion and amacrine cells (Marusich et al., 1994). At 1 dpi, the numbers of HuC/D-labeled cells in both the INL and GCL were significantly reduced relative to the control retina (Fig. 4B,I) (p ≤ 0.001). By 5 dpi, the remaining HuC/D-labeled amacrine and ganglion cells that had not died were mostly confined to a single retinal layer (Fig. 4D). Quantification revealed that 69% of the HuC/D-labeled cells were lost by 1 dpi and 84% by 5 dpi (Table 4).
Figure 4.
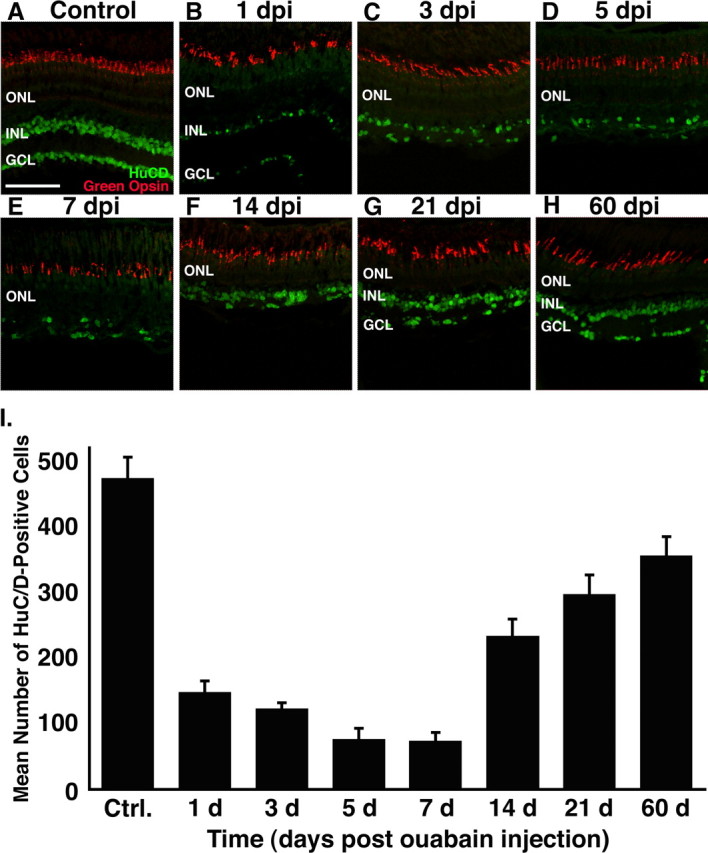
Immunohistochemical analysis of HuC/D and green opsin expression in the ouabain-treated retina. Frozen retinal sections were double immunolabeled with anti-HuC/D monoclonal antibody (green), to detect differentiated amacrine and ganglion cells, and rabbit anti-green opsin polyclonal antiserum (red), a marker for one member of the double cone cell pair. A, Control section from a wild-type retina injected with 0.65% saline possessing HuC/D-positive cells in the GCL and the distal portion of INL and well defined green cone cell outer segments. B–E, During the first 7 dpi, the number of HuC/D-positive cells decreases significantly, and the distinction between the INL and GCL is lost. Green cone cells, however, maintain morphological integrity and relatively normal levels of green cone opsin. F–H, After 7 dpi, there is a significant increase in the number of HuC/D-positive cells and reestablishment of retinal lamination. I, Graph of the number of HuC/D-positive cells in the dorsal retina (y-axis) versus the days after ouabain injection (x-axis). Ctrl., Control. Error bars represent SD (n = 4 retinas per time point). Scale bar, 75 μm.
This loss of ganglion cells can also be quantified by the decrease in the diameter of the optic nerve as it exits the retina (optic nerve head). Before ouabain injection, the average diameter of the optic nerve head is 209.1 ± 15.9 μm (Fig. 5A,F). By 3 dpi, the diameter of the optic nerve head had decreased to 148.9 ± 36.3 μm (Fig. 5B,F). At 7 and 14 dpi, the diameter of the optic nerve head remained fairly constant relative to the 3 dpi measurement and was significantly narrower than the control (Fig. 5C,D,F) (p ≤ 0.001). Thus, the decreased number of ganglion cells resulted in a slight, but statistically significant, reduction in the diameter of the optic nerve head.
Figure 5.
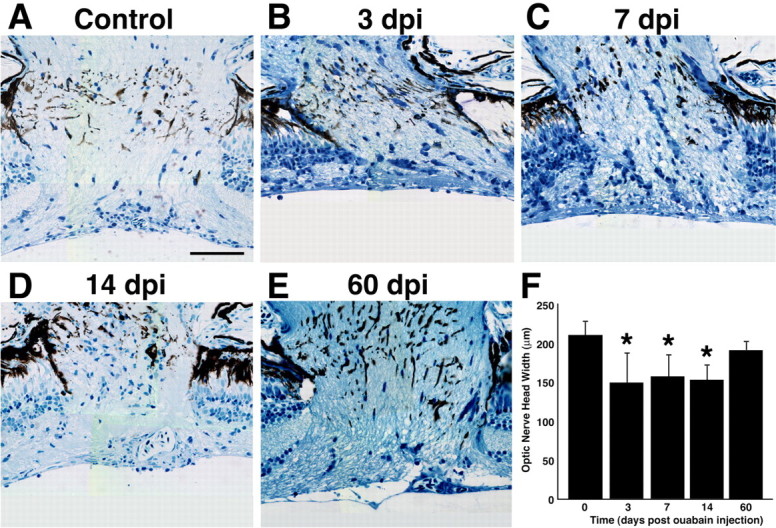
Histological time course of the diameter of the optic nerve head in ouabain-treated eyes. A–E, Images were collected from central optic nerve sections from a wild-type uninjected control retina (A) or retinas injected with 2 μm ouabain (B–E). B, At 3 dpi, the extensively damaged retina (Fig. 2C) retains axonal fibers in the optic nerve head. B–D, Although the optic nerve head was significantly reduced in diameter from 3 to 14 dpi relative to the control, axonal fibers can be clearly identified in all histological sections. E, At 60 dpi, the ouabain-damaged retina possesses an optic nerve head diameter that is statistically similar to the uninjected control retina. F, Graph of the optic nerve head width (y-axis) versus the days after ouabain injection (x-axis). Three measurements were made across the width of the optic nerve head in each section, with two sections analyzed for each eye. Error bars represent SD (n = 6 retinas per time point). Asterisks denote values that are statistically different from the control (p ≤ 0.05). Scale bar, 50 μm.
To examine the integrity of the cone and rod photoreceptors, we coimmunolabeled retinal sections with either anti-HuC/D and anti-green opsin antiserum or anti-PCNA with anti-rhodopsin antiserum (Figs. 4, 6, respectively). There did not appear to be an appreciable loss in the number of green cone photoreceptors after ouabain injection (Fig. 4, compare A, D). However, the green opsin-containing members of the double cones were disorganized and possessed shortened outer segments relative to the control retina (Fig. 4A,B,E). Similarly, there was an apparent reduction in the rod outer segment length at 3 dpi and some rhodopsin mislocalization to the cell bodies at 5 dpi (Fig. 6C,D, respectively). However, there was no obvious loss of rod outer segments, which was consistent with the histology showing an absence of significant ONL loss. Together, 2.0 μm ouabain resulted in massive cell loss and disorganization of the inner retinal layers within 7 d of injection, without significant loss of either the rod or cone photoreceptors.
Figure 6.

PCNA immunolabeling during the ouabain-induced retinal regeneration response. Frozen retinal sections were double immunolabeled with an anti-PCNA monoclonal antibody (green), a marker of proliferating cells, and rabbit anti-rod opsin polyclonal antisera (red), which marks the ROS. A, Control section possessing very few PCNA-labeled cells and an intact ROS. B, At 1 dpi, the retinal section possessed an increased number of round, punctate PCNA-positive nuclei randomly distributed in the inner retinal cell layers. C, Large numbers of PCNA-labeled cells were localized to the INL at 3 dpi. Many of these nuclei had a morphology that is consistent with Müller glia (arrowheads). D, E, Between 5 and 7 dpi, a large proliferative response spanning the entire retina is characterized by columnar clusters of PCNA-labeled cells, with fusiform morphology (arrows). F, G, At 14 through 21 dpi, the PCNA-labeled cells extend into the ONL. H, A few PCNA-positive cells are identified in the ONL at 60 dpi. The ROS remains intact throughout the time course. I, Graph of the number of PCNA-labeled cells in the dorsal retina (y-axis) versus the days after ouabain injection (x-axis). Ctrl., Control. Error bars represent SD (n = 4 retinas per time point). Scale bar, 75 μm.
We also used the behavioral escape response to examine the extent of retinal damage (Li and Dowling, 1997), which failed to reveal any significant differences between the ouabain-treated fish and the uninjected fish (data not shown; p ≥ 0.05). This was not a fault of the test, because treating zebrafish with 10 μm ouabain significantly decreased their behavioral response (data not shown). Thus, the normal escape response of the zebrafish treated with 2 μm ouabain was likely mediated through the large number of undamaged photoreceptors and the remaining inner retinal neurons and optic nerve.
Ouabain-damaged retinas regenerate inner retinal neurons
In the teleost retina, neuronal stem cells can be induced to regenerate retinal neurons that are lost as a result of surgical excision (Raymond et al., 1988; Hitchcock et al., 1992), light-induced degeneration (Vihtelic and Hyde, 2000), laser ablation (Braisted et al., 1994), toxin injection (Maier and Wolburg, 1979; Raymond et al., 1988; Braisted and Raymond, 1992), or retinal puncture (Fausett and Goldman, 2006). Our initial analysis suggested that the INL cells regenerated even with minimal photoreceptor cell death (Fig. 1D–F). Therefore, we assessed inner retinal cell regeneration in the ouabain-treated retina using histology and immunohistochemistry.
After the widespread inner retinal cell apoptosis, there was a gradual increase in the number of inner retinal nuclei between 5 and 60 dpi (Fig. 2D–H, Table 2). By 60 dpi, the number of inner retinal nuclei had returned to ∼70% of the control (Table 2), with nearly an equal percentage of INL and GCL nuclei regenerating (Table 2). There was a similar but delayed increase in retinal thickness that began at 14 dpi and reached 84% of the control retinal thickness by 60 dpi (Fig. 2, Table 2). This increased thickness resulted from both an increased number of INL and GCL nuclei and a reestablishment of the IPL (Fig. 2H, Table 2).
To further assess the regeneration of the inner retinal layers, we labeled retinal sections with the HuC/D antibody to detect amacrine and ganglion cells (Fig. 4). At 7 dpi, the number of HuC/D-labeled cells had reached a minimum of 15% of the control level (Table 4), and we were unable to distinguish between the two neuronal classes because of the fusion of the INL and GCL (Fig. 4E). By 21 dpi, a visible distinction reappeared between the INL and GCL (Fig. 4G), and the number of HuC/D-labeled cells had returned to 63% of the control level (Table 4). At 60 dpi, the number of HuC/D-positive cells was 75% of the control (Table 4). Histology and immunohistochemistry failed to detect any significant differences at later time points up to 120 dpi in either the cell number or retinal thickness relative to 60 dpi (p ≤ 0.05; data not shown). This suggests that essentially all cellular regeneration was complete by 60 dpi.
This regeneration of the ganglion cells preceded the restoration of the optic nerve head, which gave us a direct method of analyzing axonal outgrowth during regeneration. At 21 dpi, the diameter of the optic nerve head was not statistically different from the diameter at 14 dpi (data not shown; p = 1.0). However, by 60 dpi, the diameter of the optic nerve head had increased to 190.4 ± 9.1 μm (Fig. 5E), which was not statistically different from the control (Fig. 5F) (p = 0.135). Thus, regeneration of the ganglion cells resulted in a restoration of the optic nerve head diameter
Regeneration of inner retinal neurons in the ouabain-damaged zebrafish retina is associated with Müller glia proliferation
The regenerated neurons in the ouabain-damaged retina could have been derived from three potential sources: the INL stem cells, the CMZ stem cells, and the Müller glial cells (Fischer and Reh, 2001; Otteson et al., 2001; Wu et al., 2001; Hitchcock et al., 2004; Yurco and Cameron, 2005; Fausett and Goldman, 2006; Kassen et al., 2007). To differentiate between these three sources, we immunolocalized PCNA expression after the ouabain-induced damage (Fig. 6).
In saline-injected control retinas, a small number of PCNA-labeled cells were identified in the CMZ (data not shown) and in the ONL (Fig. 6A). The observed low level of ONL proliferation likely represents dividing rod precursor cells that were part of the normal persistent neurogenesis (Raymond et al., 1988; Vihtelic and Hyde, 2000). At 1 dpi, PCNA-labeled cells with a distinct, round morphology were randomly distributed throughout all three retinal layers in numbers significantly (p ≤ 0.001) above control levels (Fig. 6B, Table 5). By 3 dpi, the majority of the PCNA-labeled cells were distributed throughout the INL, and most appeared to possess the morphology of Müller glial nuclei (Fig. 6C, arrowheads). The numbers of PCNA-labeled cells continued increasing and reached a maximum at 5 dpi (Fig. 6D, Table 5). At 5 and 7 dpi, the PCNA-labeled cells were arranged in columns (Fig. 6D,E, respectively), which was analogous to the migration pattern of proliferating cells along the Müller glial cell processes during regeneration of rods and cones in the light-damaged zebrafish retina (Vihtelic and Hyde, 2000; Vihtelic et al., 2006; Kassen et al., 2007). Because we did not observe a significantly increased number of PCNA-labeled cells in either the ONL or CMZ (data not shown), it is unlikely that these retinal regions played a major role in regenerating the ouabain-damaged inner retinal neurons.
To examine the relationship between the PCNA-labeled cells and the Müller glia, we used the Tg(gfap:EGFP)nt transgenic zebrafish line that expresses EGFP in the Müller glial cells from a gfap promoter (Kassen et al., 2007), and we used colocalized PCNA and EGFP expression when this transgenic line was ouabain damaged. In the control retina, a few PCNA-positive rod precursor cells were present in only the ONL (Fig. 7A, arrowheads). At 1 dpi, the increased number of PCNA-labeled cells were scattered throughout the retina (Fig. 7B, arrowheads); however, <3% of the EGFP-expressing Müller glia coexpressed PCNA at this time (Fig. 7G). Most of these PCNA-positive, EGFP-negative cells colabeled with microglial cell markers (data not shown), which suggested that these proliferating cells represented the initial immune response to the massive damage in the inner retinal layers.
At 2 dpi, 31% of the EGFP-expressing Müller glial cells coexpressed PCNA (Fig. 7C,G). By 3 dpi, 89.8% of the EGFP-expressing Müller glial cells coexpressed PCNA (Fig. 7D,G). As the percentage of Müller glia that coexpressed PCNA increased, the number of EGFP-expressing Müller glial cells remained relatively constant (Fig. 7H). This represented a true increase in the percentage of Müller glia that were PCNA positive. Furthermore, this revealed that the Müller glial cells were relatively resistant to cell death during this time when a large number of cells across the retina were dying (Tables 2, 3, respectively).
By 5 dpi, only 9.8% of the EGFP-expressing Müller glia coexpressed PCNA (Fig. 7E,G). This continued to drop to <1% (0.7%) by 7 dpi (Fig. 7F,G). These PCNA-labeled cells at 5 and 7 dpi were organized into tight clusters of fusiform-shaped cells that resembled the columnar PCNA-labeled cells described previously (Fig. 6D,E, respectively). Because the number of EGFP-expressing Müller glia continued to remain relatively constant through this time (Fig. 7H), two conclusions were clear. First, the vast majority of the Müller glia discontinued proliferating by 5 dpi, which suggested that the majority of the Müller glial cells only went through one or two rounds of cell division during this early regeneration response. Second, the progeny of these early Müller glial cell divisions were likely the neuronal progenitor cells, which continued to proliferate to produce the cells that will ultimately differentiate into the regenerated retinal neurons. This suggests that the Müller glial cells are the initial source of INL cell proliferation in the ouabain-damaged zebrafish retina.
Ouabain damage fails to cause the Müller glia to exhibit reactive gliosis
In nearly all situations that either damage or stress the vertebrate retina, the Müller glia undergo reactive gliosis that is characterized by both nonspecific and specific responses (Bringmann et al., 2006). A sensitive, nonspecific response to a wide variety of retinal insults is an increase in the expression of intermediate filament protein GFAP (Sarthy and Fu, 1989; Iandiev et al., 2006; Raymond et al., 2006; Xue et al., 2006). In contrast, a change in glutamine synthetase expression appears to depend on the type of retinal damage that is sustained (Bringmann et al., 2006), with glutamine synthetase levels decreasing in response to photoreceptor cell damage and increasing under conditions of hepatic retinopathy. In the case of either diabetic retinopathy or optic nerve crush, there is no significant change in the levels of glutamine synthetase (Mizutani et al., 1998; Chen and Weber, 2002).
While confirming the GFAP protein expression levels in the gfap:EGFP transgenic line, we discovered that GFAP levels were unusually low in the ouabain-damaged retina. Therefore, we quantified GFAP and glutamine synthetase expression by immunoblots at various times after ouabain injection. Surprisingly, the relative GFAP levels were significantly reduced (based on the one-way ANOVA and post hoc multiple comparisons using Tukey's test; p ≤ 0.05) at 1, 3, 5, 14, and 21 dpi relative to the control retina (Fig. 8). At 7 dpi, the GFAP expression was 68 ± 17% of the control level (p = 0.067). Throughout the time course, the relative glutamine synthetase levels varied from 81% (at 3 and 5 dpi) to 95% (14 dpi) of the control level (Fig. 8). However, none of these differences was statistically significant (p > 0.05) relative to the control value. Thus, the ouabain-damaged retina failed to exhibit the nonspecific increase in GFAP expression that is observed in other retinal damage models. This suggests that the increased GFAP expression that is observed in the Müller glia before their proliferation in other zebrafish retinal damage models is not essential for the Müller glia to reenter the cell cycle.
Figure 8.
Immunoblot analysis of glutamine synthetase and GFAP expression in the ouabain-treated retina. Top, To assess whether the Müller glia in the ouabain-damaged retina were undergoing reactive gliosis, we determined the relative amount of GFAP and glutamine synthetase protein expression by immunoblots using retinal protein preparations at 0, 1, 3, 5, 7, 14, and 21 dpi. The immunoblots were incubated with one of three different primary antisera: anti-glutamine synthetase monoclonal antibody, anti-GFAP rabbit polyclonal antiserum, and an anti-β-actin polyclonal antiserum, followed by an HRP-conjugated secondary antibody. The secondary antibody was detected on the PVDF membranes by incubation with the ECL-Plus detection system and exposure to x-ray film. Actin expression was used to standardize equivalent amounts of total protein loaded in each lane. Bottom, After β-actin normalization, densitometry analysis was performed on the x-ray films. For each blot (glutamine synthetase, n = 4; GFAP, n = 5), each time point was normalized against the β-actin control, and the normalized band intensity relative to the control value for glutamine synthetase and GFAP was plotted. After ouabain treatment, glutamine synthetase levels did not significantly change throughout the time course (black bars). However, GFAP levels were significantly reduced relative to the control (gray bars). All datasets were analyzed with a one-way ANOVA (significance level, p ≤ 0.05) and post hoc multiple comparisons using Tukey's test. Statistically significant differences (p ≤ 0.05) are marked with an asterisk. Error bars represent SD.
Increased expression of EGFP in the Tg(olig2:egfp)vu12 transgenic line identifies neuronal progenitor cells
We demonstrated that the proliferation response begins with the Müller glia reentering the cell cycle between 2 and 3 dpi (Fig. 7). By 5 dpi, when the number of PCNA-positive cells had reached a maximum (Table 5), most of the Müller glial cells were no longer expressing PCNA. This strongly suggested that these large numbers of persistent PCNA-expressing cells were neuronal progenitors derived from Müller glial cell division. To confirm the identity of these neuronal progenitors, we used the Tg(olig2:egfp)vu12 transgenic line (Shin et al., 2003). When this transgenic line was treated with constant bright light, EGFP expression initiated in a population of PCNA-expressing cells that were tightly associated with the Müller glia and began shortly after the Müller glia stopped expressing PCNA (Kassen et al., 2007).
In the uninjected Tg(olig2:egfp)vu12 retina, EGFP expression is present in the nerve fiber of the GCL, and a low number of PCNA-expressing cells are detected in the ONL (Fig. 9A). At 3 dpi, large numbers of PCNA-positive cells are detected in the Tg(olig2:egfp)vu12 retina, whereas EGFP expression remained restricted to the GCL nerve fiber layer (Fig. 9B). This corresponded to the time when ∼90% of the Müller glia were coexpressing PCNA (Fig. 7D). By 5 dpi, there was an increased number of PCNA-expressing cells (Table 5), and <10% of the Müller glia were PCNA positive (Fig. 7E). At this same time point, the ouabain-damaged Tg(olig2:egfp)vu12 retina expressed EGFP in both the nerve fiber and the tight clusters of PCNA-expressing cells (Fig. 9C). By 7 dpi, the numbers of EGFP-expressing cells were decreasing, and PCNA-positive cells that did not coexpress EGFP reappeared (Fig. 9D). By 14 dpi, the cells coexpressing EGFP and PCNA were greatly reduced and only found in rare clusters across the retina (Fig. 9E). Thus, expression of EGFP in the ouabain-damaged Tg(olig2:egfp)vu12 retina corresponded to PCNA-expressing cells after the Müller glia discontinued EGFP expression, which likely corresponded to the neuronal progenitor cells.
Figure 9.

Identification of the neuronal progenitors in the Tg(olig2:egfp)vu12 transgenic line. Retinal sections from the Tg(olig2:egfp)vu12 transgenic line were labeled with an anti-EGFP (green) and anti-PCNA (red) antibodies. A, Control section from a retina injected with 0.65% saline possessed very few PCNA-labeled cells (red; arrowheads), and EGFP expression was only detected in the GCL nerve fiber (green). B, At 3 dpi, the majority of the PCNA-labeled cells were located in the INL, and EGFP expression was limited to the interface of the degenerated retina and the vitreous. C, At 5 dpi, the number of PCNA-labeled cells increased, and they were present in distinct clusters that coexpressed EGFP. D, At 7 dpi, PCNA-labeled cells were present throughout the inner retina. However, the majority of the PCNA-labeled cells did not colabel with EGFP. E, At 14 dpi, PCNA expression persisted, although at a reduced level relative to 7 dpi. Furthermore, EGFP expression was dramatically reduced, with very little coexpression with the PCNA. Although some EGFP-positive, PCNA-negative cells exist (arrowhead), they are in the minority compared with the random clusters of EGFP-positive, PCNA-positive cells (arrows) and the even greater number of PCNA-positive, EGFP-negative cells. This suggests that olig2–EGFP expression is limited to a distinct phase of proliferating neuronal progenitor cells during retinal regeneration, which occurs immediately or shortly after the Müller glia terminate PCNA expression. Scale bar, 75 μm.
Temporal commitment of neuronal progenitors to become ganglion cells
There are a variety of different methods that can be used to examine regeneration of ganglion cells in the ouabain-damaged retina. We have already demonstrated that the number of HuC/D-expressing ganglion and amacrine cells began to increase by 14 dpi (Table 4), that a distinct GCL was also apparent by 14 dpi (Table 2), and that the optic nerve head began increasing in diameter between 14 and 60 dpi (Fig. 5). However, the expression of HuC/D and the increased diameter of the optic nerve head correspond to relatively late events in the differentiation of ganglion cells, likely much later than when the neuronal progenitor is committed to becoming a ganglion cell. To determine how early in the regeneration response ganglion cell commitment occurred, we used two different ganglion cell markers, the atoh7 gene and the zn5 antigen. The atoh7 gene, which corresponds to the lakritz mutation (Neuhauss et al., 1999), is required for the differentiation of ganglion cells. The anti-zn5 monoclonal antibody detects the zebrafish DM-GRASP protein, which is transiently expressed in differentiating ganglion cells and their axons only during axonal outgrowth (Trevarrow et al., 1990; Laessing et al., 1994; Fashena and Westerfield, 1999).
The uninjected control retina exhibited no detectable EGFP expression in the Tg(atoh7:EGFP)nt transgenic retina (Fig. 10A). Similarly, there was an absence of EGFP expression through 5 dpi (data not shown). We first detected EGFP expression at 7 dpi in several cells and processes that were scattered in the inner retinal region and the presumptive developing retinal ganglion cell nerve fiber (Fig. 10C, arrowheads). This EGFP expression persisted through 14 dpi (Fig. 10E).
Figure 10.
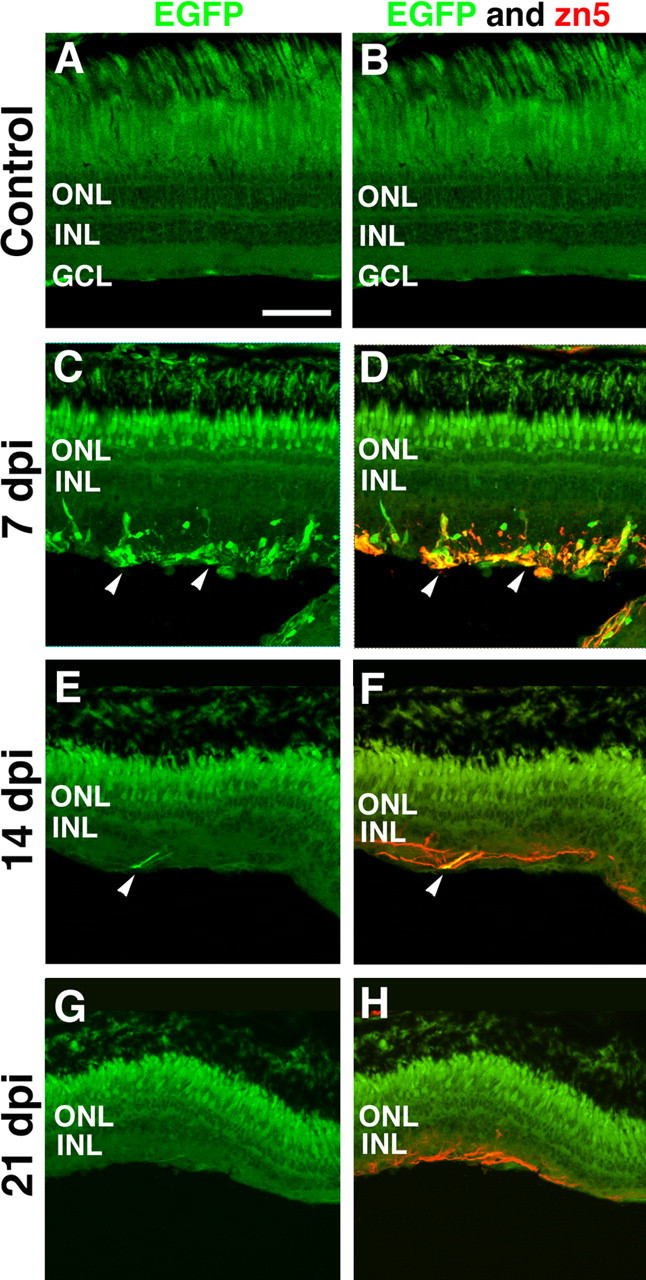
Frozen retinal sections of the Tg(atoh7:EGFP)nt transgenic zebrafish were used to assess the temporal expression of atonal homolog 7 and zn5 during regeneration of the ouabain-damaged retina. The left column shows EGFP immunolocalization in the Tg(atoh7:EGFP)nt transgenic retina, and the right column shows coimmunolocalization of EGFP and zn5 (in red). A, B, Uninjected control retinal sections did not reveal either EGFP (green) or zn5 expression (red). C, D, At 7 dpi, EGFP expression was localized to several scattered cells in the regenerating inner retina, and several of these cells colocalized with zn5 immunoreactivity (arrowheads). E, F, At 14 dpi, EGFP and zn5 coexpression was restricted to a limited number of ganglion cell axons found in the inner retina (arrowheads). G, H, At 21 dpi, all of the retinas examined lacked EGFP expression. However, zn5 immunoreactivity persisted on axonal projections in the regenerating inner retina. Scale bar, 75 μm.
Similarly, there was no detectable expression of zn5 immunoreactivity in either the uninjected Tg(atoh7:EGFP)nt control retina (Fig. 10B; merged with the EGFP expression) or the 5 dpi retina (data not shown). The zn5 immunoreactivity was first detected at 7 dpi, and it colocalized with the EGFP expression in the ouabain-damaged Tg(atoh7:EGFP)nt transgenic retina (Fig. 10D, arrowheads). Although the zn5 immunoreactivity was rapidly lost from the ganglion cell body, it was retained on the axons through 21 dpi (Fig. 10F,H). Thus, a subpopulation of the neuronal progenitor cells was committed to regenerate the ganglion cells at ∼7 dpi based on the expression of EGFP and zn5 in the Tg(atoh7:EGFP)nt transgenic line. The expression of zn5, which is expressed on outgrowing ganglion cell axons, demonstrates that the ganglion cells started to regenerate by 7 dpi, although the HuC/D protein was not expressed in the ganglion cells until ∼14 dpi.
Expression of the Na+-K+-ATPase is upregulated in goldfish retinal ganglion cell axons after optic nerve transection (Liu et al., 2002). Addition of low concentrations of ouabain (50–100 nm) acted to inhibit the ganglion cell axonal outgrowth (Liu et al., 2002). Because we observed the persistent expression of zn5 on the regenerating retinal ganglion cell axons, either the ouabain concentration in the eye has dropped below the inhibitory concentration, or ganglion axon outgrowth is not inhibited by ouabain in the zebrafish retina.
Discussion
We describe a zebrafish model that complements our light-damage model (Vihtelic and Hyde, 2000; Vihtelic et al., 2006) by destroying inner retinal neurons without significantly affecting the photoreceptors. A 2 μm final intraocular concentration of ouabain resulted in uniform and widespread cell death within the INL and GCL by 1 dpi, with minimal damage to the photoreceptors. By 2 dpi, the Müller glia began expressing PCNA, without exhibiting the expected reactive gliosis response to the damage, and produced neuronal progenitor cells that continued to proliferate. Neuronal progenitors committed to regenerate ganglion cells by 7 dpi, based on the expression of the atoh7:egfp transgene and the zn5 protein. By 14 dpi, differentiated ganglion cells were being produced based on the increasing number of HuC/D-positive cells. By 60 dpi, 75% of the amacrine and ganglion cells that were destroyed by the ouabain injection had regenerated. Thus, selective damage to the inner retina can induce Müller glial cell proliferation and regeneration of amacrine and ganglion cells and provides another model to study the signals that induce Müller glia proliferation and retinal regeneration.
TUNEL-positive cells were first identified in the GCL within 3 h of ouabain injection and dramatically increased in numbers in both the INL and GCL by 24 hpi. As the inner retina sustained severe levels of cell death, the ONL remained intact and displayed very few TUNEL-positive cells throughout the time course. Although the Na+-K+-ATPase is found throughout the retina (Stirling and Lee, 1980; Stahl and Baskin, 1984; McGrail and Sweadner, 1986; Raymond et al., 1988), preferential destruction of the inner retinal layers is consistent with previous reports of graded ouabain damage in the teleost retina (Maier and Wolburg, 1979; Raymond et al., 1988). This may be attributed to ouabain possessing selective access to inner retinal Na+-K+-ATPase binding sites (Raymond et al., 1988). Alternatively, biological clearance of the toxin by surviving Müller glia, inner retinal neurons, or infiltrating microglial cells may prevent photoreceptor damage.
Most retinal injuries increase GFAP expression (Sarthy and Fu, 1989; Iandiev et al., 2006; Raymond et al., 2006; Xue et al., 2006), yet, surprisingly, ouabain damage decreased GFAP expression between 1 and 21 dpi (Fig. 8). This decreased GFAP expression was not a result of Müller glial cell death, because the number of Müller glial cells in the Tg(gfap:EGFP)nt transgenic line remained relatively unchanged throughout the first 7 dpi compared with the uninjected control (Fig. 7H). Previous studies also described the preservation of Müller glia, even under conditions that resulted in significant cell death in all of the retinal layers (Maier and Wolburg, 1979; Raymond et al., 1988). Because the light-damaged zebrafish retina exhibits increased GFAP expression (Vihtelic et al., 2006), the decrease we observed must be related to either the ouabain or the extent of damage in the inner retina.
Our conditions produced inner retinal regeneration with only minimal photoreceptor damage. However, other studies reported that photoreceptor damage was required to elicit the regeneration response in the adult teleost retina (Raymond et al., 1988; Negishi et al., 1991b; Braisted and Raymond, 1992; Braisted et al., 1994; Hitchcock et al., 2004). Our histology revealed only an 8% reduction (581 down from 629) (Table 2) in the number of ONL nuclei at 3 dpi, which was not statistically different from the control retina. Alternatively, only 3% (19 of 634) (Table 3) of the total TUNEL-positive cells resided within the ONL at 3 dpi. Together, initiation of INL cell proliferation may require either damage of only 3–8% of the photoreceptors, which produces a signal that could be amplified by mitogenic or other stimuli from inner retinal cellular debris (Raymond et al., 1988), or specific signals from the dying inner retinal neurons. Additionally, localized signals originating from site-specific activation of the immune response, such as microglial cells, during early degeneration may also significantly affect the cellular response to retinal injury (Mertsch et al., 2001; Chen et al., 2002; Zeng et al., 2005; Zhang et al., 2005).
Similar to other zebrafish damage models (Yurco and Cameron, 2005; Fausett and Goldman, 2006; Vihtelic et al., 2006), we believe that the observed Müller glial cell proliferation is the source of the regenerated neurons. In contrast, Raymond et al. (1988) described ONL rod precursors as the source of the regenerated inner retinal neurons, although Müller glia were proliferating. This conclusion was based on the following: (1) ONL proliferation only occurred with photoreceptor damage, which is a prerequisite for inner retinal regeneration, and (2) Müller glia were mitotically active even in the absence of photoreceptor damage. The ONL rod precursor proliferation likely results from photoreceptor damage, because ONL proliferation was also observed shortly after starting a constant-light treatment (Vihtelic et al., 2006; Kassen et al., 2007). Additionally, significant ONL rod precursor proliferation was not detected in the absence of photoreceptor damage using 2 μm ouabain. It remains possible, however, that some mechanistic differences exist between zebrafish retinal regeneration and goldfish.
During the initial proliferation response, there were not significantly increased numbers of PCNA-labeled cells in the ONL, retinal pigment epithelium, or the circumferential marginal zone (data not shown). Therefore, the regeneration response did not originate from any of these three sources. At 1 dpi, several small, round PCNA-labeled cells were randomly distributed throughout the inner retina (Fig. 7B). These cells are not Müller glia, because they did not coexpress EGFP in the Tg(gfap:EGFP)nt transgenic line. They likely represent proliferating phagocytic microglial cells that were described in other regenerating retinas (Negishi and Shinagawa, 1993; Braisted et al., 1994; Vihtelic and Hyde, 2000; Yurco and Cameron, 2005) and immunolocalized with microglial cell-specific markers (data not shown). At 2 dpi, we observed the first uniform population of PCNA-labeled cells, which corresponded to the Müller glia (Fig. 7C). By 3 dpi, 89% of the Müller glia were PCNA positive, but the majority discontinued their PCNA expression by 5 dpi. Thus, the Müller glia were mitotically active for a narrow window of time (2–5 dpi). Raymond et al. (1988) similarly suggested that mitotically active Müller glia likely divided only a limited number of times in the ouabain-damaged retina. The proliferating Müller glia produced PCNA-expressing fusiform-shaped neuronal progenitors, which continued to proliferate and migrate to different retinal layers, which was consistent with previously described damage models (Negishi and Shinagawa, 1993; Julian et al., 1998; Vihtelic and Hyde, 2000; Otteson et al., 2001). Expression of EGFP in the Tg(olig2:egfp)vu12 transgenic line identified these neuronal progenitors, similar to the light-damaged retina (Kassen et al., 2007). A low level of cell proliferation persisted in all of the retinal layers at 60 dpi, which suggests that there may be continuous remodeling of the retina and a prolonged accumulation of additional retinal neurons.
Fausett and Goldman (2006) similarly demonstrated that proliferating Müller glia were the source of the regenerated neurons in a retinal puncture model in zebrafish. They showed that the Tg(1016α1T:GFP) transgenic line specifically started expressing GFP in Müller glial cells after either an optic nerve crush or a retinal puncture. They demonstrated in the punctured retina that bromodeoxyuridine (BrdU) incorporation reached a maximum at 4 dpi, similar to our maximum PCNA expression at 5 dpi (Fig. 6I). Furthermore, nearly all of the BrdU-labeled cells in the punctured retina between 2 and 5 dpi coexpressed GFP, suggesting that the majority of the cell proliferation involved the Müller glia. However, they could not calculate the number of Müller glia that possessed the ability to participate in the regeneration response, because the retinal puncture model did not exhibit uniform damage across the entire retina (Yurco and Cameron, 2005). In contrast, we determined that 90% of the Müller glia expressed PCNA at 3 dpi in the ouabain-damaged retina (Fig. 7D). Using the 1016α1T:GFP transgene to identify Müller glial cells that participate in the regeneration response and the olig2:egfp transgene to identify neuronal progenitor cells will be valuable tools to further dissect the regeneration response in a variety of retinal-damage zebrafish models.
The ouabain-damaged retina provides another model to examine the signals that are required for retinal regeneration. The signals that initiate the regeneration response result from either a very low level of photoreceptor damage or the damaged inner retinal neurons. Although different neuronal classes must be regenerated in the ouabain-damaged retina relative to the light-damaged retina, a similar mechanism of initiating Müller glial cell proliferation to produce neuronal progenitors is required. It is then quite likely that different signals are used to communicate to the neuronal progenitor cells the neuronal classes that must be regenerated. Elucidating these signals and the molecular mechanisms will be of great interest. Although it appears that some molecular events are shared between retinal development and regeneration, such as Atoh7 and zn5 in this study and Pax6, Notch, Delta, Rx1, Vsx2, NeuroD, and Crx (Fausett and Goldman, 2006; Raymond et al., 2006), it remains unclear whether regeneration recapitulates retinal development. It will be exciting to determine whether the regenerating retina reuses the same molecular mechanisms or adopts new mechanisms to guide regeneration in the damaged retinal environment.
Footnotes
This work was supported by the Center for Zebrafish Research at the University of Notre Dame. We thank the Freimann Life Science Center staff for the excellent care and maintenance of the zebrafish. We thank Koichi Kawakami (National Institute of Genetics, Mishima, Shizuoka, Japan) for generously providing the Tol2 (pT2KXIG) and Tol2 transposase cDNA (pCSTZ2.8) plasmids and Bruce Appel (Vanderbilt University, Nashville, TN) for sharing the Tg(olig2:egfp)vu12 transgenic line. We thank Dr. Thomas Vihtelic for comments on this manuscript, members of the Hyde laboratory for discussions during this work, and Suzyanne Guzicki for excellent technical assistance in generating the Tg(atoh7:EGFP)nt transgenic line.
References
- Bilotta J, Saszik S. The zebrafish as a model visual system. Int J Dev Neurosci. 2001;19:621–629. doi: 10.1016/s0736-5748(01)00050-8. [DOI] [PubMed] [Google Scholar]
- Braisted JE, Raymond PA. Regeneration of dopaminergic neurons in goldfish retina. Development. 1992;114:913–919. doi: 10.1242/dev.114.4.913. [DOI] [PubMed] [Google Scholar]
- Braisted JE, Essman TF, Raymond PA. Selective regeneration of photoreceptors in goldfish retina. Development. 1994;120:2409–2419. doi: 10.1242/dev.120.9.2409. [DOI] [PubMed] [Google Scholar]
- Bringmann A, Pannicke T, Grosche J, Francke M, Wiedemann P, Skatchkov SN, Osborne NN, Reichenbach A. Müller cells in healthy and diseased retina. Prog Retin Eye Res. 2006;25:397–424. doi: 10.1016/j.preteyeres.2006.05.003. [DOI] [PubMed] [Google Scholar]
- Cameron DA, Carney LH. Cell mosaic patterns in the native and regenerated inner retina of zebrafish: implications for retinal assembly. J Comp Neurol. 2000;416:356–367. [PubMed] [Google Scholar]
- Cameron DA, Easter SS., Jr Cone photoreceptor regeneration in adult fish retina: phenotypic determination and mosaic pattern formation. J Neurosci. 1995;15:2255–2271. doi: 10.1523/JNEUROSCI.15-03-02255.1995. [DOI] [PMC free article] [PubMed] [Google Scholar]
- Chen H, Weber AJ. Expression of glial fibrillary acidic protein and glutamine synthetase by Müller cells after optic nerve damage and intravitreal application of brain-derived neurotrophic factor. Glia. 2002;38:115–125. doi: 10.1002/glia.10061. [DOI] [PubMed] [Google Scholar]
- Chen L, Yang P, Kijlstra A. Distribution, markers, and functions of retinal microglia. Ocul Immunol Inflamm. 2002;10:27–39. doi: 10.1076/ocii.10.1.27.10328. [DOI] [PubMed] [Google Scholar]
- Fashena D, Westerfield M. Secondary motoneuron axons localize DM-GRASP on their fasciculated segments. J Comp Neurol. 1999;406:415–424. doi: 10.1002/(sici)1096-9861(19990412)406:3<415::aid-cne9>3.0.co;2-2. [DOI] [PubMed] [Google Scholar]
- Fausett BV, Goldman D. A role for α1 tubulin-expressing Müller glia in regeneration of the injured zebrafish retina. J Neurosci. 2006;26:6303–6313. doi: 10.1523/JNEUROSCI.0332-06.2006. [DOI] [PMC free article] [PubMed] [Google Scholar]
- Fischer AJ, Reh TA. Müller glia are a potential source of neural regeneration in the postnatal chicken retina. Nat Neurosci. 2001;4:247–252. doi: 10.1038/85090. [DOI] [PubMed] [Google Scholar]
- Fischer AJ, Seltner RL, Poon J, Stell WK. Immunocytochemical characterization of quisqualic acid- and N-methyl-d-aspartate-induced excitotoxicity in the retina of chicks. J Comp Neurol. 1998;393:1–15. [PubMed] [Google Scholar]
- Hitchcock P, Ochocinska M, Sieh A, Otteson D. Persistent and injury-induced neurogenesis in the vertebrate retina. Prog Retin Eye Res. 2004;23:183–194. doi: 10.1016/j.preteyeres.2004.01.001. [DOI] [PubMed] [Google Scholar]
- Hitchcock PF, Lindsey Myhr KJ, Easter SS, Jr, Mangione-Smith R, Jones DD. Local regeneration in the retina of the goldfish. J Neurobiol. 1992;23:187–203. doi: 10.1002/neu.480230209. [DOI] [PubMed] [Google Scholar]
- Iandiev I, Uckermann O, Pannicke T, Wurm A, Tenckhoff S, Pietsch UC, Reichenbach A, Wiedemann P, Bringmann A, Uhlmann S. Glial cell reactivity in a porcine model of retinal detachment. Invest Ophthalmol Vis Sci. 2006;47:2161–2171. doi: 10.1167/iovs.05-0595. [DOI] [PubMed] [Google Scholar]
- Johns PR. Growth of the adult goldfish eye. III. Source of the new retinal cells. J Comp Neurol. 1977;176:343–357. doi: 10.1002/cne.901760304. [DOI] [PubMed] [Google Scholar]
- Johns PR. Formation of photoreceptors in larval and adult goldfish. J Neurosci. 1982;2:178–198. doi: 10.1523/JNEUROSCI.02-02-00178.1982. [DOI] [PMC free article] [PubMed] [Google Scholar]
- Johns PR, Easter SS., Jr Growth of the adult goldfish eye. II. Increase in retinal cell number. J Comp Neurol. 1977;176:331–341. doi: 10.1002/cne.901760303. [DOI] [PubMed] [Google Scholar]
- Julian D, Ennis K, Korenbrot JI. Birth and fate of proliferative cells in the inner nuclear layer of the mature fish retina. J Comp Neurol. 1998;394:271–282. [PubMed] [Google Scholar]
- Kassen SC, Ramanan V, Montgomery J, Burket CT, Liu CG, Vihtelic TS, Hyde DR. Time course analysis of gene expression during light-induced photoreceptor death and regeneration in albino zebrafish. J Neurobiol. 2007 doi: 10.1002/dneu.20362. in press. [DOI] [PubMed] [Google Scholar]
- Kawakami K, Koga A, Hori H, Shima A. Excision of the tol2 transposable element of the medaka fish, Oryzias latipes, in zebrafish, Danio rerio. Gene. 1998;225:17–22. doi: 10.1016/s0378-1119(98)00537-x. [DOI] [PubMed] [Google Scholar]
- Laessing U, Giordano S, Stecher B, Lottspeich F, Sturmer CA. Molecular characterization of fish neurolin: a growth-associated cell surface protein and member of the immunoglobulin superfamily in the fish retinotectal system with similarities to chick protein. Differentiation. 1994;56:21–29. doi: 10.1046/j.1432-0436.1994.56120021.x. [DOI] [PubMed] [Google Scholar]
- Li L, Dowling JE. A dominant form of inherited retinal degeneration caused by a non-photoreceptor cell-specific mutation. Proc Natl Acad Sci USA. 1997;94:11645–11650. doi: 10.1073/pnas.94.21.11645. [DOI] [PMC free article] [PubMed] [Google Scholar]
- Liu ZW, Matsukawa T, Arai K, Devedas M, Nakashima H, Tanaka M, Mawatari K, Kato S. Na,K-ATPase α3 subunit in the goldfish retina during optic nerve regeneration. J Neurochem. 2002;80:763–770. doi: 10.1046/j.0022-3042.2002.00771.x. [DOI] [PubMed] [Google Scholar]
- Maier W, Wolburg H. Regeneration of the goldfish retina after exposure to different doses of ouabain. Cell Tissue Res. 1979;202:99–118. doi: 10.1007/BF00239223. [DOI] [PubMed] [Google Scholar]
- Marusich MF, Furneaux HM, Henion PD, Weston JA. Hu neuronal proteins are expressed in proliferating neurogenic cells. J Neurobiol. 1994;25:143–155. doi: 10.1002/neu.480250206. [DOI] [PubMed] [Google Scholar]
- McGrail KM, Sweadner KJ. Immunofluorescent localization of two different Na,K-ATPases in the rat retina and in identified dissociated retinal cells. J Neurosci. 1986;6:1272–1283. doi: 10.1523/JNEUROSCI.06-05-01272.1986. [DOI] [PMC free article] [PubMed] [Google Scholar]
- Mertsch K, Hanisch UK, Kettenmann H, Schnitzer J. Characterization of microglial cells and their response to stimulation in an organotypic retinal culture system. J Comp Neurol. 2001;431:217–227. [PubMed] [Google Scholar]
- Mizutani M, Gerhardinger C, Lorenzi M. Müller cell changes in human diabetic retinopathy. Diabetes. 1998;47:445–449. doi: 10.2337/diabetes.47.3.445. [DOI] [PubMed] [Google Scholar]
- Negishi K, Shinagawa S. Fibroblast growth factor induces proliferating cell nuclear antigen-immunoreactive cells in goldfish retina. Neurosci Res. 1993;18:143–156. doi: 10.1016/0168-0102(93)90017-k. [DOI] [PubMed] [Google Scholar]
- Negishi K, Teranishi T, Kato S, Nakamura Y. Paradoxical induction of dopaminergic cells following intravitreal injection of high doses of 6-hydroxydopamine in juvenile carp retina. Brain Res. 1987;430:67–79. doi: 10.1016/0165-3806(87)90177-5. [DOI] [PubMed] [Google Scholar]
- Negishi K, Sugawara K, Shinagawa S, Teranishi T, Kuo CH, Takasaki Y. Induction of immunoreactive proliferating cell nuclear antigen (PCNA) in goldfish retina following intravitreal injection with tunicamycin. Brain Res Dev Brain Res. 1991a;63:71–83. doi: 10.1016/0165-3806(91)90068-t. [DOI] [PubMed] [Google Scholar]
- Negishi K, Stell WK, Teranishi T, Karkhanis A, Owusu-Yaw V, Takasaki Y. Induction of proliferating cell nuclear antigen (PCNA)-immunoreactive cells in goldfish retina following intravitreal injection with 6-hydroxydopamine. Cell Mol Neurobiol. 1991b;11:639–659. doi: 10.1007/BF00741451. [DOI] [PMC free article] [PubMed] [Google Scholar]
- Neuhauss SCF, Biehlmaier O, Seeliger MW, Das T, Kohler K, Harris WA, Baier H. Genetic disorders of vision revealed by a behavioral screen of 400 essential loci in zebrafish. J Neurosci. 1999;19:8603–8615. doi: 10.1523/JNEUROSCI.19-19-08603.1999. [DOI] [PMC free article] [PubMed] [Google Scholar]
- Otteson DC, Hitchcock PF. Stem cells in the teleost retina: persistent neurogenesis and injury-induced regeneration. Vision Res. 2003;43:927–936. doi: 10.1016/s0042-6989(02)00400-5. [DOI] [PubMed] [Google Scholar]
- Otteson DC, D'Costa AR, Hitchcock PF. Putative stem cells and the lineage of rod photoreceptors in the mature retina of the goldfish. Dev Biol. 2001;232:62–76. doi: 10.1006/dbio.2001.0163. [DOI] [PubMed] [Google Scholar]
- Raymond PA, Reifler MJ, Rivlin PK. Regeneration of goldfish retina: rod precursors are a likely source of regenerated cells. J Neurobiol. 1988;19:431–463. doi: 10.1002/neu.480190504. [DOI] [PubMed] [Google Scholar]
- Raymond PA, Barthel LK, Bernardos RL, Perkowski JJ. Molecular characterization of retinal stem cells and their niches in adult zebrafish. BMC Dev Biol. 2006;6:36. doi: 10.1186/1471-213X-6-36. [DOI] [PMC free article] [PubMed] [Google Scholar]
- Sarthy PV, Fu M. Transcriptional activation of an intermediate filament protein gene in mice with retinal dystrophy. DNA. 1989;8:437–446. doi: 10.1089/dna.1.1989.8.437. [DOI] [PubMed] [Google Scholar]
- Shin J, Park HC, Topczewska JM, Mawdsley DJ, Appel B. Neural cell fate analysis in zebrafish using olig2 BAC transgenics. Methods Cell Sci. 2003;25:7–14. doi: 10.1023/B:MICS.0000006847.09037.3a. [DOI] [PubMed] [Google Scholar]
- Stahl WL, Baskin DG. Immunocytochemical localization of Na+,K+ adenosine triphosphatase in the rat retina. J Histochem Cytochem. 1984;32:248–250. doi: 10.1177/32.2.6319483. [DOI] [PubMed] [Google Scholar]
- Stirling CE, Lee A. [3H]ouabain autoradiography of frog retina. J Cell Biol. 1980;85:313–324. doi: 10.1083/jcb.85.2.313. [DOI] [PMC free article] [PubMed] [Google Scholar]
- Thummel R, Burket CT, Brewer JL, Sarras MP, Jr, Li L, Perry M, McDermott JP, Sauer B, Hyde DR, Godwin AR. Cre-mediated site-specific recombination in zebrafish embryos. Dev Dyn. 2005;233:1366–1377. doi: 10.1002/dvdy.20475. [DOI] [PubMed] [Google Scholar]
- Trevarrow B, Marks DL, Kimmel CB. Organization of hindbrain segments in the zebrafish embryo. Neuron. 1990;4:669–679. doi: 10.1016/0896-6273(90)90194-k. [DOI] [PubMed] [Google Scholar]
- Vihtelic TS, Hyde DR. Light-induced rod and cone cell death and regeneration in the adult albino zebrafish (Danio rerio) retina. J Neurobiol. 2000;44:289–307. doi: 10.1002/1097-4695(20000905)44:3<289::aid-neu1>3.0.co;2-h. [DOI] [PubMed] [Google Scholar]
- Vihtelic TS, Doro CJ, Hyde DR. Cloning and characterization of six zebrafish photoreceptor opsin cDNAs and immunolocalization of their corresponding proteins. Vis Neurosci. 1999;16:571–585. doi: 10.1017/s0952523899163168. [DOI] [PubMed] [Google Scholar]
- Vihtelic TS, Soverly JE, Kassen SC, Hyde DR. Retinal regional differences in photoreceptor cell death and regeneration in light-lesioned albino zebrafish. Exp Eye Res. 2006;82:558–575. doi: 10.1016/j.exer.2005.08.015. [DOI] [PubMed] [Google Scholar]
- Westerfield M. Eugene, OR: University of Oregon; 1993. The zebrafish book. [Google Scholar]
- Wu DM, Schneiderman T, Burgett J, Gokhale P, Barthel L, Raymond PA. Cones regenerate from retinal stem cells sequestered in the inner nuclear layer of adult goldfish retina. Invest Ophthalmol Vis Sci. 2001;42:2115–2124. [PubMed] [Google Scholar]
- Xue LP, Lu J, Cao Q, Hu S, Ding P, Ling EA. Müller glial cells express nestin coupled with glial fibrillary acidic protein in experimentally induced glaucoma in the rat retina. Neuroscience. 2006;139:723–732. doi: 10.1016/j.neuroscience.2005.12.032. [DOI] [PubMed] [Google Scholar]
- Yurco P, Cameron DA. Responses of Müller glia to retinal injury in adult zebrafish. Vision Res. 2005;45:991–1002. doi: 10.1016/j.visres.2004.10.022. [DOI] [PubMed] [Google Scholar]
- Zeng HY, Zhu XA, Zhang C, Yang LP, Wu LM, Tso MO. Identification of sequential events and factors associated with microglial activation, migration, and cytotoxicity in retinal degeneration in rd mice. Invest Ophthalmol Vis Sci. 2005;46:2992–2999. doi: 10.1167/iovs.05-0118. [DOI] [PubMed] [Google Scholar]
- Zhang C, Shen JK, Lam TT, Zeng HY, Chiang SK, Yang F, Tso MO. Activation of microglia and chemokines in light-induced retinal degeneration. Mol Vis. 2005;11:887–895. [PubMed] [Google Scholar]