

Abstract
Prefrontal cortex (PFC) functions, such as working memory, attention selection, and memory retrieval, depend critically on dopamine and NMDA receptor activation by way of an inverted-U-shaped pharmacological profile. Although single neuron responses in the PFC have shown some aspects of this profile, a network dynamic that follows the dopamine–NMDA dependence has not been identified.
We studied neuronal network activity in acute medial PFC slices of adult rats by recording local field potentials (LFPs) with microelectrode arrays. Bath application of dopamine or the dopamine D1 agonist SKF38393 [(+/−)-1-phenyl-2,3,4,5-tetrahydro-(1H)-3-benzazepine-7,8-diol hydrochloride] in combination with NMDA induced spontaneous LFPs predominantly in superficial cortex layers. The LFPs at single electrodes were characterized by sharp negative peaks that were clustered in time across electrodes revealing diverse spatiotemporal patterns on the array. The pattern formation required fast GABAergic transmission, coactivation of the dopamine D1 and NMDA receptor, and depended in an inverted-U profile on dopamine. At moderate concentrations of dopamine or the dopamine D1 agonist, the pattern size distribution formed a power law with exponent α = −1.5, indicating that patterns are organized in the form of neuronal avalanches, thereby maximizing spatial correlations in the network. At lower or higher concentrations, α was more negative than −1.5, indicating reduced spatial correlations. Likewise, at moderate dopamine concentrations, the avalanche rate and recurrence of specific avalanches was maximal with recurrence frequencies after a “power law”-like heavy-tail distribution with a slope of −2.4.
We suggest that the dopamine–NMDA-dependent spontaneous recurrence of specific avalanches in superficial cortical layers might facilitate integrative and associative aspects of PFC functions.
Keywords: prefrontal cortex, spontaneous activity, dopamine, NMDA, spatiotemporal activity patterns, microelectrode array, acute slice, local field potential
Introduction
Prefrontal cortex (PFC) functions, such as working memory, attention selection, and memory retrieval, require coactivation of the glutamate NMDA and dopamine D1 receptor (Sawaguchi and Goldman-Rakic, 1991; Mele et al., 1996; Verma and Moghaddam, 1996; Seamans et al., 1998; Granon et al., 2000; Barros et al., 2001; Stefani et al., 2003). The control by dopamine, in addition, has been found to follow an inverted-U-shaped profile, with too little or too much dopamine or dopamine D1 receptor activation being detrimental for working memory (Arnsten et al., 1994; Murphy et al., 1996; Verma and Moghaddam, 1996; Zahrt et al., 1997; Goldman-Rakic et al., 2000; Floresco and Phillips, 2001; Mattay et al., 2003). These findings suggest that moderate concentrations of dopamine optimize PFC functions in the presence of glutamatergic transmission.
Exactly what aspects of the PFC network are regulated by dopamine and glutamate has been a long-standing discussion. Studies at the single-cell level imply that the NMDA–dopamine interaction increases neuronal excitability in the PFC. For example, in the medial PFC (mPFC) of the rat, moderate activation of the dopamine D1 receptor facilitates postsynaptic NMDA currents (Zheng et al., 1999; Chen et al., 2004) and in the presence of NMDA increases evoked action potential firing and spontaneous up-state generation in layer V pyramidal neurons (Tseng and O’Donnell, 2004, 2005). Conversely, high concentrations of dopamine or dopamine D1 agonists reduce NMDA-evoked currents and postsynaptic potentials in pyramidal neurons (Castro et al., 1999; Zheng et al., 1999; Seamans and Yang, 2004). However, these findings at the cellular level are difficult to relate to PFC functions, which require a precise understanding of the interaction between large groups of neurons (Vaadia et al., 1995; Miller and Cohen, 2001).
Identifying network-level phenomena that are regulated by glutamate and dopamine could provide an important step toward linking molecular and cellular physiology with normal functioning of the PFC and related pathophysiologies (Weinberger et al., 2001; Lewis and Levitt, 2002; Krystal et al., 2003). Ideally, such network activities should demonstrate a similar, if not identical, pharmacological profile for NMDA–dopamine interactions as observed for PFC functions. Recently, we found in acute somatosensory cortex slices that bath application of NMDA and a dopamine D1 agonist induces diverse spatiotemporal activity patterns in the form of neuronal avalanches (Beggs and Plenz, 2003). The synchronized activity within a neuronal avalanche is characterized by rapidly propagating sharp, negative local field potentials (nLFP) that form diverse spatiotemporal patterns and recur over time (Beggs and Plenz, 2004). The dynamic is quantified by its avalanche size distribution, which has been shown to form a power law with an exponent of −1.5 at which avalanches establish selective correlations within the network at all spatial scales (Beggs and Plenz, 2003).
In the current study, we demonstrate that the NMDA–dopamine interaction regulates the spontaneous induction and precise recurrence of neuronal avalanches in superficial layers of the mPFC. Avalanche occurrence follows an inverted-U-shaped profile, in which moderate dopamine D1 receptor stimulation maximizes spatial correlations and the recurrence of specific avalanches.
Materials and Methods
Acute slice preparation and signal processing
Brain slices from rats (8–10 weeks old) that included the mPFC were cut at a thickness of 400 μm in chilled artificial CSF (ACSF) containing 124 mm NaCl, 0.3 mm NaH2PO4, 3.5 mm KCl, 1.2 mm CaCl2, 1 mm MgSO4, 26.2 mm NaHCO3, 10 mm d-glucose, and 50 μm d,l-2-amino-5-phosphonovalerate (AP-5; Sigma, St. Louis, MO) saturated with 95% O2 and 5% CO2 (310 ± 5 mOsm). The slices were coronally in successive order and stored submerged for 1–2 h at room temperature in ACSF without AP-5. For recording, slices were transferred onto planar microelectrode arrays (Multichannel Systems, Reutlingen, Germany) and allowed to attach to the array in a mixture of 25 μl of chicken plasma and bovine thrombin (1000 NIH units/0.75 ml; Sigma) under high-carbogen conditions (95% O2 and 5% CO2) for ∼8 min, after which they were submerged in ACSF at 32.5 ± 0.5°C saturated with carbogen at a flow rate of 3–4 ml/min. For pharmacological experiments, the glutamate receptor agonist NMDA, the dopamine D1 receptor agonist (+/−)-1-phenyl-2,3,4,5-tetrahydro-(1H)-3-benzazepine-7,8-diol hydrochloride (SKF38393), the D1 receptor antagonist R(+)-7-chloro-8-hydroxy-3-methyl-1-phenyl-2,3,4,5-tetrahydro-1H-3-benzazepine hydrochloride (SCH23390), and picrotoxin (all from Sigma) were freshly dissolved in ACSF and bath applied. Dopamine was applied, in combination with ascorbic acid (0.01%), to slow drug oxidation during the experiment.
Detection of LFP activity, activity profiles, and correlation functions
Spontaneous neuronal activity was studied with planar microelectrode arrays (Multichannel Systems) that contained 60 electrodes arranged on an 8 × 8 matrix at an interelectrode distance of 200 μm (30 μm electrode diameter; corner electrodes missing) and oriented such that cortical layers were in parallel with electrode rows.
Continuous extracellular signals (v)t were recorded between 0.1 and 3000 Hz, low-pass filtered at 50 Hz (Butterfly filter; Multichannel Systems), digitized at a rate of 1 kHz (Δt = 1 ms), and stored on hard disk. All subsequent data processing was performed off-line. For each electrode, k(k = [1,nelec],nelec = 60), the electrode noise of v(t) was estimated by calculating the mean and SD of v(t) from the total duration of the recording, Ttot, which ranged between 40 and 60 min for most experiments. nLFPs at electrode k were detected by negative threshold crossing at −3 SD of electrode noise and were characterized by the time and absolute amplitude of the nLFP peak, Ak(ti), before v(t) returned to threshold (Beggs and Plenz, 2003). More precisely, at a given temporal resolution Δt, nLFPs at electrode k were represented by a vector of length nmax, where nmax is an integer value for which Ttot =nmax. This vector contained zeros, except for positions ti =i × Δt, iϵ[1,…, nmax] with values Ak(ti) in microvolts. The time course of activity A(ti) was obtained by summing nLFP amplitudes on the array at time ti for k = [1,nelec] at Δt = 1 ms, as follows:
 |
and was displayed as integrated activity in steps of T = 1 min. Likewise, total activity Atot for each experiment was calculated by summing all A(ti), i = [1,nmax]:
 |
To study whether extracellular activity was oscillatory, autocorrelation functions for nLFPs at single electrodes [Racfk(τ)] were calculated at a temporal resolution of Δt = 2 ms for up to τ = 0.2 s according to the following:
 |
where m is an integer value up to mmax × Δt + τ < Ttot and A′k(ti) =Ak(ti) − E(Ak), where E(.) is the expected value for Ak(ti) and σ2(.) is the variance. For Racfk(τ) at a lower temporal resolution and up to τ = 10 s, we integrated Ak(ti) over successive periods of Δt = 0.1 s. The Racfk(τ) from single electrodes were averaged over all electrodes to obtain the population autocorrelation function Racf(τ):
 |
Definition of neuronal avalanches
A neuronal avalanche is technically defined as a sequence of consecutive time bins of width Δt with at least one nLFP, which is preceded and terminated by at least one time bin with no activity (see Fig. 3C). The absence of activity for a period of Δt thus indicates the end of an avalanche. If the decision of whether an avalanche has ended is made too early (Δt too short), avalanches will be terminated prematurely; however, if the Δt chosen is too long, avalanches will be falsely concatenated. If avalanches did simply propagate like a wave, an approximation for Δt (Δtavg) could be obtained by averaging the time between one nLFP at one electrode and the next nLFP at neighboring electrodes only. Because nLFPs in avalanches occur in irregular patterns across electrodes on the array, we used a pairwise approximation to assess the average time that is required for nLFPs to propagate between electrodes.
Figure 3.
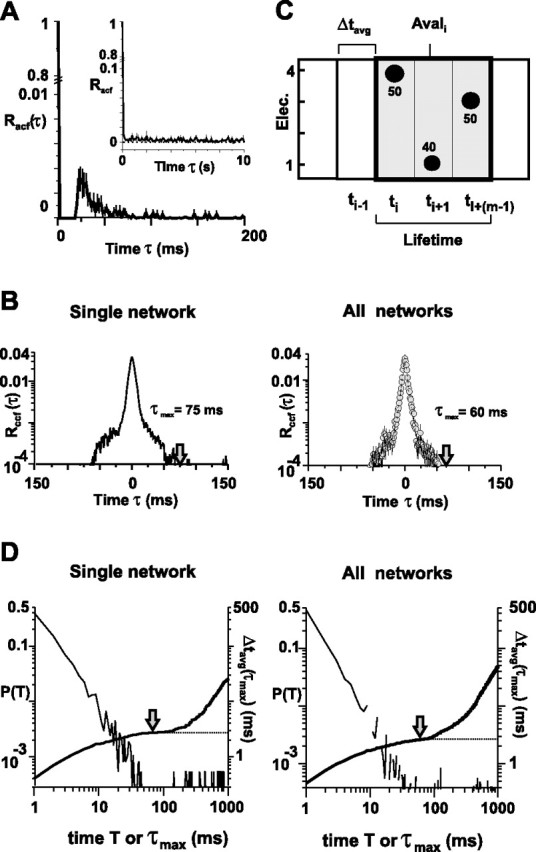
The spatiotemporal organization of nLFPs induced by coapplication of dopamine and NMDA. A, nLFPs at single electrodes are slightly oscillatory with a cycle time of ∼20–25 ms indicated by the early peak in the autocorrelation (Racf; bin width, 1 ms). Note the axis break and differences in y-scale. Oscillations at low frequencies are absent, as demonstrated by the flat population autocorrelation at low temporal resolution (inset: 1 s bin width; mean ± SEM; 30 μm dopamine and 3 μm NMDA; n = 6 experiments). B, nLFPs at different electrodes are strongly clustered in time as demonstrated by the average cross-correlation function Rccf. Left, Single slice (average from 595 pairwise cross-correlations). Right, Average from all n = 6 slices encompassing 6824 correlation functions (30 μm dopamine and 3 μm NMDA). Note that Rccf decays to negligible levels within ±100 ms. τmax is indicated by arrows for which Rccf dropped below 10−4. C, Neuronal avalanches are defined on a sequence of consecutively active time bins of width Δtavg, bracketed by at least one time bin with no activity. A sketch of an avalanche of size sele = 3 electrodes (Elec.), size sLFP = 140 μV, and lifetime m = 3 × Δtavg on a 2 × 2 electrode array [absolute nLFP amplitude Ak(ti) is indicated by dot diameter, and numbers are in microvolts] is shown. D, Derivation of average bin width Δtavg for neuronal avalanche analysis. Corresponding change in an average inter-nLFP interval (thick line; right axis) from all electrode pairs (i.e., Δtavg as a function of upper cutoff for integration time τmax) is shown. The inter-nLFP interval distribution is plotted on the left axis (thin line). For the single slice (left), Rccf (τmax) < 10−4 for τmax = 75 ms and Δtavg(τmax) = 2.7 ms. For all slices (right), Rccf (τmax) < 10−4 for τmax = 60 ms and Δtavg(τmax) = 2.7 ms (mean ± SEM). Note the plateau reached for Δtavg at τmax (arrows). The dotted line indicates read-out of Δtavg.
To calculate Δtavg, we first obtained the distribution of time intervals T for successive nLFPs on the array. Starting with the first nLFP [e.g., Ak(ti) on electrode k at timeti], we searched for the next occurrence of an nLFP on the array [e.g., Ak(tj) on electrode l at time tj] and calculated the time interval TmΔtk,l(τ), where A = (tj − ti)/Δt. This process was repeated for all occurrences of nLFPs on electrode k and for all electrodes. The resulting values were combined into one density distribution, P(TmΔt), which captures how often successive nLFPs occurred with a particular delay, m × Δt, on the array regardless of their spatial location. Consequently, the average value of T provides an approximation for Δtavg, the average time to wait before making a decision whether an nLFP propagated on the array. However, this interval distribution is highly skewed, particularly when one compares the last nLFP with the first nLFP in successive avalanches that are separated by long times. To exclude time intervals from successive nLFPs that are barely correlated, a cutoff time, τmax, was calculated for which the average cross-correlation function (ccf) for pairwise electrode comparisons, Rccf(τ), had decayed to negligible values. In analogy to Equations 3 and 4, the ccf between electrodes k and l [Rccfk,l(τ)] and the population ccf [Rccf(τ)] were calculated as follows:
 |
at Δt = 1 ms for τϵ[−100,100] and
 |
For the acute slices, we found Rccf(τ) < 10−4 for τmax <100 ms (see Fig. 3B). The estimate of the average time between successive, correlated nLFPs on the array (i.e., Δt′avg) was obtained by integrating the density distribution of intervals for each network up to τmax:
 |
In general, Δt′avg varied very little for τmax between 50 and 100 ms for single networks as well as for the population of networks (see Fig. 3C). Because the maximal sampling rate of our recording was 1 kHz, the actual Δtavg to calculate avalanches was taken as the nearest multiple of Δt = 1 ms. In short, after Δtavg was calculated for a particular network and experimental condition, the extracellular signals v(t) were resampled off-line at the new temporal resolution of Δtavg. The time and amplitude of nLFP peaks were extracted as Ak(ti), where ti = i × Δtavg, iϵ[1,n′max] and Ttot = n′max × Δtavg. Avalanches were determined on the downsampled data set at bin width Δtavg.
Avalanche size and lifetime distributions
Avalanche sizes were calculated in two different ways (see also Fig. 3C). By taking into account nLFP peak amplitudes Aik, the avalanche size sLFPAvalj was calculated by summing up Aik on active electrodes for the lifetime TAvalj = m × Δtavg of Avalj, defined as the number of bins m of width Δtavg that were occupied by avalanche Avalj that started at time t and stopped at time ti + (m − 1) × Δtavg, as follows:
 |
For the density distribution of sLFP, the range in sizes sLFP was covered by 100 bins that increased logarithmically from 3 to 300 μV, which resulted in equidistant sampling of the data in logarithmic coordinates. Avalanche sizes were also calculated as the number of active electrodes within an avalanche, sele, using Equation 8, but setting all nonzero Aik values to 1. For the density distribution of sele, linear binning from 1 to 100 was used. The exponent α of the power law was estimated by the slope on log–log-transformed distributions using linear regression analysis. Because no significant differences were found between estimates of α based on sLFP(αLFP) or sele (αele) (see also Beggs and Plenz, 2003), slope values were given as αLFP throughout the rest of the results unless a particular emphasis was placed on the area an avalanche covers on the array. Average avalanche size and lifetime distributions were plotted as mean ± SEM.
Cluster analysis of avalanche activity
Similarity measure for avalanches with different durations.
The diverse avalanches were grouped into families with similar spatiotemporal patterns as described previously (Beggs and Plenz, 2004). In short, a framei was defined as the 8 × 8 matrix of Ak(ti) at time ti at temporal resolution Δtavg. Because corner electrodes on the electrode array were absent, a frame constituted a single pattern in a 60-dimensional space. An avalanche Avalj of lifetime TAvailj = m × Δt consisted of m frames and represented a vector in an m × 60-dimensional space. The similarity, Sim, between two avalanches, Avali and Avalj, in this space was calculated using a correlation measure, which takes into account nLFP times as well as nLFP amplitudes. More precisely:
 |
where E(.) is the expected value, σ(.) is the SD for individual vector values, respectively, and Avali × Avalj is the vector dot product (Beggs and Plenz, 2004). The similarity can range from −1 (perfectly anti-similar) to +1 (identical). In the present study, the similarity measure was expanded to measure similarities between avalanches with different lifetimes, TAvaili = mi > TAvailj = mj. In the latter case, the avalanche Avalj with shorter lifetime was shifted by up to mi − mj steps. For each shift, the similarity was calculated from the intersection of frames between the two avalanches, and the final similarity was assigned from the shift resulting in the highest similarity value. When combined into a similarity matrix, the diagonal of this matrix indicates self-similarity, which has the maximal value of 1.
Surrogate data sets using “pairwise” shuffling.
Surrogate data sets with identical avalanche size and lifetime distributions were obtained with “paired-shuffling.” This shuffling method switches electrode assignments between randomly selected pairs of nLFPs recorded throughout the experiment on the array (see Fig. 5D). It maintains the average rate of nLFPs at each electrode, the exact lifetime distribution, as well as the event size distribution and reduces type II errors (identifying similar avalanches when they could have occurred by chance). It is similar to our previously introduced “matched-shuffling” method (Beggs and Plenz, 2004), but easier (i.e., faster to implement). Each experimental data set was compared against 100 surrogate data sets.
Figure 5.
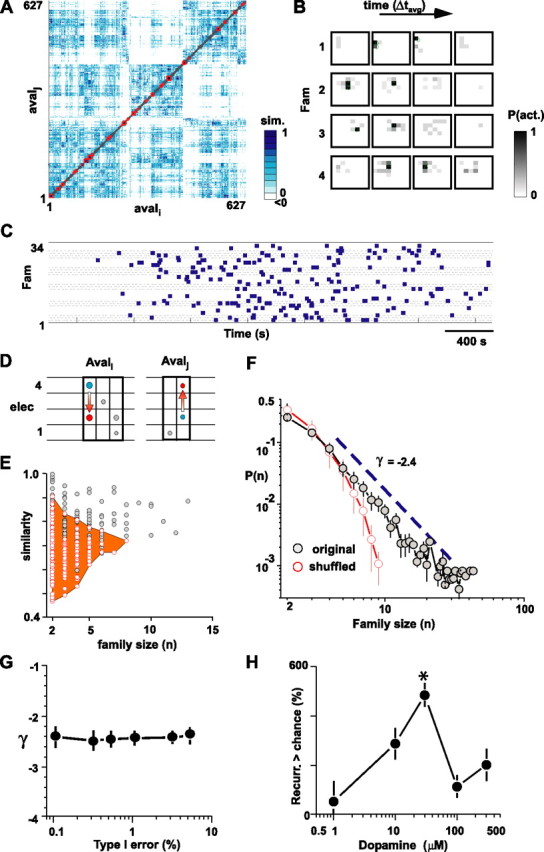
Spontaneous retrieval of avalanches peaks at moderate dopamine receptor stimulation and is organized according to a power law with a slope of −2.4 ± 0.1. A, Sorted similarity matrix for 627 neuronal avalanches with lifetimes ranging from 2× to 9× Δtavg. Pairs of avalanches with high similarity are indicated by dark blue. The open red squares along the matrix diagonal indicate significant families with similar neuronal avalanche members (type I, 5%; single experiment from Figure 1A). B, Average spatiotemporal activation pattern for four significant families with at least eight members from A. For each family, the average probability for an electrode on the 8 × 8 array to be active at time t (grayscale) is plotted for a period of 4× Δtavg around the main time of activity. C, Spontaneous recurrence of families (squares) is irregular and intermingled with other families (type I, 5%; 34 families with lifetime ≥2× Δtavg and >2 members shown; data are from A). D, Surrogate data were constructed by pairwise shuffling of two electrodes (elec) in different bins. This maintains the lifetime as well as area distribution of avalanches but destroys the spatiotemporal organization of activity within an avalanche. E, Scatter plot of family size n and average similarity within a family for original (gray) and shuffled (red) data. Significant families lie outside the boundary of the area covered by families from a shuffled data-sets algorithm. F, Family sizes n > 3 are distributed according to a power law, P(n) ∝ nγ, γ = −2.4 (dashed line). The average family size distribution (n = 6), averaged over six different type I errors (gray circles; mean ± SEM; type I error is 0.1, 0.3, 0.5, 1, 3, and 5%; 30 μm dopamine and 3 μm NMDA; n = 6 experiments). Families occur significantly more often than expected by chance as demonstrated by the expected family size distribution from 100 shuffled data sets per experiment for all type I errors (red line; mean ± SEM). G, The slope γ is independent of the type I error. Corresponding slope analysis from F for different type I errors is shown. H, Recurrence of avalanche families follows an inverted-U-shaped profile reaching ∼500% higher levels than expected by chance (average for family sizes >6 from all networks for each concentration of dopamine combined with 3 μm NMDA; same experiments as in Fig. 4).
Type I error calculation to determine significance thresholds.
Significance of similarities between avalanches was determined using surrogate data. In short, a similarity distribution was constructed from pairwise similarities between avalanches from 100 surrogate data sets. A type I error of x% was represented by finding the similarity threshold for which x% of similarities from the surrogate data sets were above this threshold.
Significance of avalanche families.
In our previous work (Beggs and Plenz, 2004), significant avalanche families were identified by comparing the summed similarity among members within a family to that of surrogate data. However, this procedure might miss families with few members (i.e., small family size n, the members of which have high similarity, or large families with members of relatively low similarity). Therefore, in the current study, the average similarity among avalanches in a family (SimavgFam) was compared with that from surrogate data. First, the expected distribution of family size n and corresponding SimavgFam was obtained from 100 surrogate data sets. As can be seen in Figure 5E, the incidence of small families with high SimavgFam and large families with relatively low SimavgFam is indeed much lower in the surrogate data sets compared with the original data set. Families that occupied the parameter space outside of the area taken up by 100 surrogate data sets were considered significant. Thus, a significant family of size n in the original data set had either a higher SimavgFam than all surrogate families of size n, or alternatively, all surrogate families had smaller sizes.
The recurrence of family sizes >10 beyond chance was calculated and plotted as a function of dopamine concentration. First, for a given type I error and dopamine concentration, family size distributions were calculated from the original data and corresponding 100 shuffled data sets. Then, the accumulated probability for family sizes >10 was calculated from each distribution. The ratio of these probabilities provided an estimate of the encounter of a family size >10 beyond chance in the original data. The procedure was repeated for different type I errors 0.1, 0.5, 1, 3, and 5%. Values for different type I errors were averaged and expressed in percentages. This was done for each experimental realization and different dopamine concentrations.
Anatomical reconstruction of electrode positions
For identifying electrode locations on the array with respect to cortical layers, comparative photographs of Nissl-stained sections were matched with light-microscopic pictures from the acute slice recordings after correction of shrinkage from fixation. Density plots of nLFP activity were obtained by summing nLFPs on each electrode for the duration of the recording, normalized by the most active electrode. For density distributions across cortical layers, nLFP amplitudes were summed for each electrode and normalized to maximal activity per electrode on the array. Summing up row activity resulted in a density function across cortical layers, which could range from 0 (no activity at any corresponding row electrode) to 8 (each electrode in one row with maximal activity of 100%). Each density function was expressed in absolute coordinates for cortical depth with the position of the array taken into account. Population density distributions were obtained by spatially resampling data from different experiments at 200 μm. Borders for cortical layers were obtained separately for each mPFC slice and averaged.
Statistical analysis
All data are presented as mean ± SEM, if not stated otherwise. The nonparametric Kruskal–Wallis H test was used to test for significant differences in mean values at n > 2 drug concentrations with the nonparametric Mann–Whitney U test as a post hoc test, if not stated otherwise. Differences between two slope values were tested by using two-tailed Student’s t statistic, whereas multiple comparisons between more than two slope values were analyzed with an analysis of covariance, followed by a post hoc Tukey test (for details, see Zar, 1999). Differences in nLFP activity between layers were analyzed using ANOVA.
Results
Coapplication of dopamine and NMDA induces spontaneous LFP activity in superficial layers of mPFC
Acute coronal slices of the mPFC were taken from adult rats (bregma, 4.2–3.1) and placed on planar microelectrode arrays. Extracellular neuronal activity was recorded simultaneously from superficial and deep layers of the mPFC and up to 1.8 mm along layers (Figs. 1, 2). Although slices were not spontaneously active in normal ACSF, bath application of dopamine in combination with 3 μm NMDA induced spontaneous extracellular activity that increased over the course of ∼30 min, after which the activity slowly tapered off (Fig. 1A–C). The activity at single electrodes was composed of individual LFP events characterized by a sharp (10–50 ms) negative peak, followed by a brief positive deflection. These nLFPs revealed an inverted-U dependence on the dopamine concentration; the mean nLFP peak, the rate of nLFPs per electrode, as well as the total activity, Atot (i.e., sum of nLFP peak amplitudes), were maximal at moderate concentration of dopamine (30 μm) and were significantly reduced at dopamine concentrations higher or lower than 30 μm (Fig. 1B–F) (peak: df(4,21) = 14.7, p = 0.005; rate: df(4,21) = 9.7, p = 0.046; Atot: df(4,21) = 15.0, p = 0.005). In contrast, the number of active electrodes (33 ± 4 electrodes) and the duration of spontaneous activity (43 ± 3 min) were similar for each condition (n = 26 slices; p > 0.05).
Figure 1.
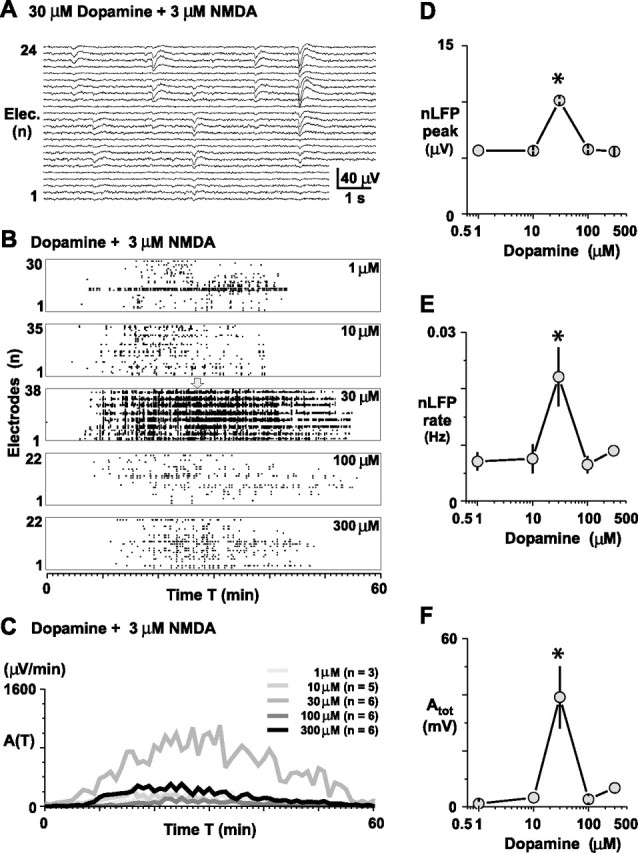
Inverted-U profile for the induction of spontaneous LFP activity by dopamine in acute slices of rat mPFC in the presence of NMDA. A, Bath application of 30 μm dopamine and 3 μm NMDA gives rise to spontaneous nLFPs characterized by sharp negative peaks, followed by a transient depolarization [acute rat mPFC slice, 24 most active electrodes (Elec.) shown]. B, Representative raster displays of nLFP activity on the microelectrode array for five different concentrations of dopamine when combined with 3 μm NMDA. Dots represent the times of negative nLFP peaks. Drugs were applied at t = 0 and were present throughout the experiment. The arrow indicates the time period shown in A. C, Corresponding average time course of spontaneous nLFP activity as a function of the dopamine concentration when coapplied with 3 μm NMDA (the number of experiments is given in parentheses). The highest activity levels were obtained with 30 μm dopamine. D–F, Corresponding dose–response relationship for the average negative nLFP peak, the nLFP rate at single electrodes, and the total activity Atot on the array. Asterisks indicate significant difference from all other groups.
Figure 2.
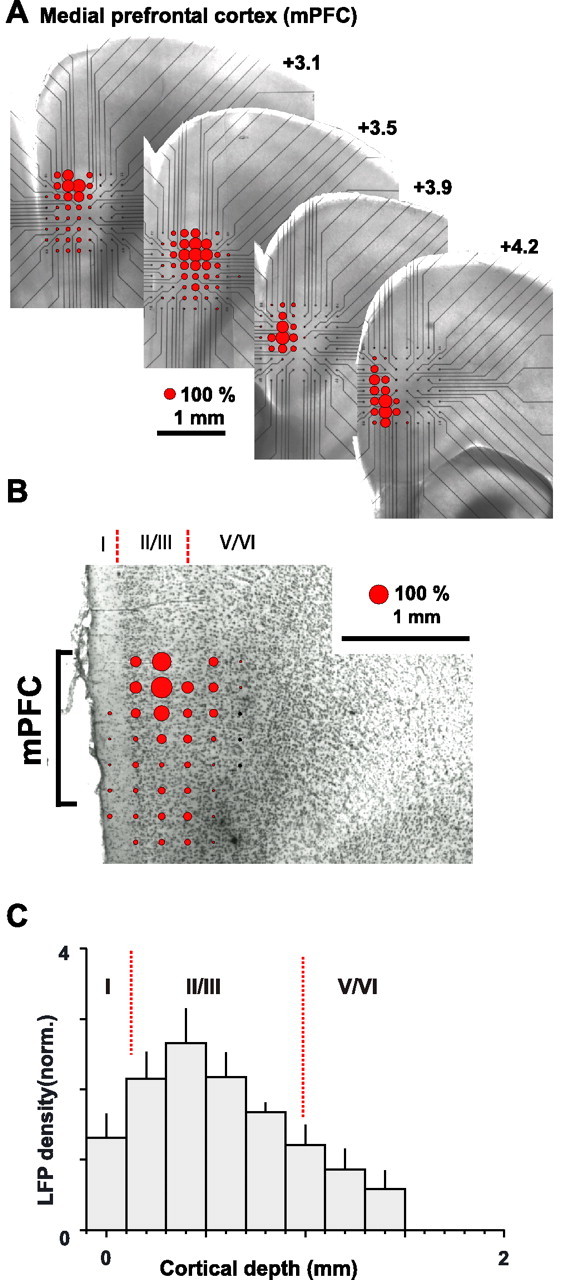
Coapplication of dopamine and NMDA induces spontaneous LFPs predominantly in superficial layers of mPFC. A, Stacked montage of nLFP density at corresponding recording locations (bregma coordinates, +4.2 to +3.1; light-microscopic picture of the acute slice and microelectrode array position during recordings). Lines indicate electrode contacts. B, Overplot of a Nissl-stained mPFC slice and nLFP density on the microelectrode array. C, Average nLFP density as a function of cortical depth (n = 6 experiments; 30 μm dopamine and 3 μm NMDA). Layers are shown in roman numerals. Dotted lines are the average depths of layer borders. norm, Normalized.
Although the array covered the entire cortical depth of the mPFC, the occurrence of nLFPs was restricted to a smaller region on the array. When comparing light-microscopic images of slices taken during recording with subsequent anatomical reconstruction of cortical layers based on Nissl stains (Fig. 2A,B), it became clear that activity was strongest in superficial layers II/III, located at a cortical depth ranging from 200 to 900 μm (Fig. 2C). In contrast, activity was significantly less in deep layers V/VI (p < 0.05, ANOVA; 30 μm dopamine and 3 μm NMDA). Although there was also some variation in nLFP activity along superficial layers, these variations were relatively small compared with differences encountered between superficial and deep layers.
An inverted-U profile characterizes avalanche induction by dopamine in superficial layers of the mPFC
The previous results demonstrated that activity at single sites in superficial layers was dependent on the dopamine concentration. We then asked whether a similar relationship governed the spatiotemporal organization of nLFPs on the array. When first studying the temporal organization only, we found that the occurrence of nLFPs at single electrodes was not oscillatory and only revealed a weak tendency to be grouped at 20–25 ms intervals as demonstrated by a corresponding small positive deflection in the average autocorrelations Racf (Fig. 3A). Similarly, low-frequency oscillations that are typical in disinhibited cortex preparations (O’Donovan, 1999; Staley et al., 2001) were absent (Fig. 3A, inset). On the other hand, as was evident from visual inspection of the spontaneous activity on the array, nLFPs were highly clustered across electrodes. This was quantified using cross-correlation analysis for pairs of electrodes. The average cross-correlation Rccf peaked significantly and decayed to negligible values within ∼100 ms, again without indication of strong oscillatory activity (Fig. 3B). Thus, spontaneous activity in superficial layers was composed of irregularly occurring spatiotemporal nLFP clusters.
These clusters suggested that the spontaneous activity might be composed of neuronal avalanches as described previously in organotypic cultures and acute slices from the somatosensory cortex (Beggs and Plenz, 2003). When analyzing the activity for neuronal avalanche organization, the first step is to identify potentially propagated events (i.e., successive nLFPs). This is done by extracting sequences of concatenated time bins Δt, in which each bin contains at least one nLFP (Fig. 3C). Second, the size s of these sequences has to obey a power law, P(s) ∝ sα, where P(s) is the probability of s, and α is the exponent of the power law, or the slope when P(s) is plotted in double logarithmic coordinates. Third and finally, α will be close to −1.5, if sequences are constructed at Δtavg (i.e., the average time interval for activity to propagate between electrodes on the array; see Materials and Methods) (Beggs and Plenz, 2003).
When the clustered nLFPs were analyzed for neuronal avalanches, we found only at 30 μm dopamine, at which nLFP occurrence was highest, that the distribution of concatenated nLFPs revealed a power law in cluster sizes with a slope of α = −1.5 (Fig. 4). This finding held true whether α was calculated by summing nLFP amplitudes within an avalanche (αLFP = −1.50 ± 0.03; sLFP = 6–300 μV; r = −0.99), or when counting the number of active electrodes in an avalanche (αele = −1.47 ± 0.03; sele = 1–18 electrodes; r = −0.996). At this concentration, the optimal bin width Δtavg was 2.7 ± 0.2 ms, which translated into a propagation velocity of ∼74 mm/s for nLFPs on the array at an inter-electrode distance of 200 μm.
Figure 4.
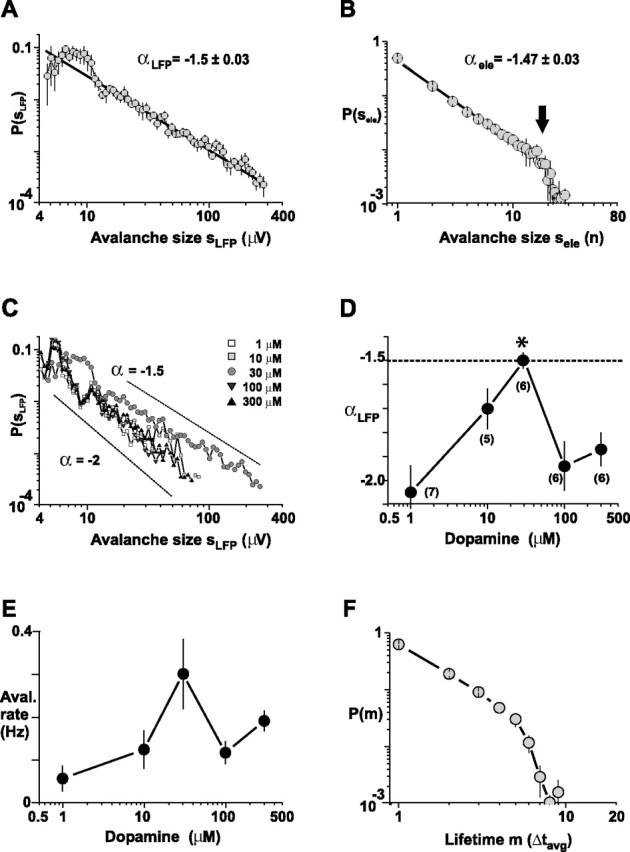
Inverted-U pharmacological profile for avalanche induction by dopamine. A, B, A power law with slope α approximately −1.5 (solid lines are linear regressions) characterizes avalanche sizes sLFP and sele at 30 μm dopamine and 3 μm NMDA (n = 6 experiments; mean ± SEM). The largest avalanches within the power law regimen cover an area of ∼18 electrodes (arrow). C, D, An inverted-U-shaped pharmacological profile for the slope α characterizes neuronal avalanche induction by dopamine in the presence of NMDA. The maximal slope of α is reached at a concentration of 30 μm dopamine (mean r = −0.92; regression taken from size = 4–200 μm; *p < 0.0005). The slope α is significantly more negative at lower and higher concentrations of dopamine (mean ± SEM). The number of experiments for each condition is given in parentheses. E, Corresponding dose–response relationship for avalanche rate. F, Lifetime distribution of neuronal avalanches for α = −1.5. Most avalanches are shorter than Δtavg = 27 ms.
On the other hand, at dopamine concentrations lower or higher than 30 μm, the distribution of concatenated nLFPs revealed a cluster size distribution with a steeper slope α close to −2 that was significantly different from −1.5 (Fig. 4C,D) (df(5,215) = 156.8; p < 0.0005). These differences could not have resulted from differences in Δtavg, which was similar for all dopamine concentrations tested (df(4,21) = 0.98; p = 0.44; 2.7 ± 0.1 ms average for all n = 26 experiments). Similarly, the distributions of cluster sizes obtained for different dopamine concentrations did not change much in shape, as indicated by the high-regression coefficient R for all conditions (r = 0.96–0.99). Finally, in accordance with our finding on nLFP rate for single electrodes, the avalanche rate was also maximal at moderate dopamine concentrations, although not statistically significant (Fig. 4E) (df(4,21) = 7.0; p = 0.13).
These findings demonstrate that a slope of α = −1.5 is the maximal slope attainable within the wide range of dopamine concentrations tested. This inverted-U profile for α has important implications for the formation of spatiotemporal patterns in superficial cortex layers. Because αLFP and αele quantify the occurrence of large avalanches relative to smaller avalanches, α provides a direct measure of the number and the extent of spatial correlations formed within the network. More specifically, at 30 μm dopamine, the maximal area sele within the power law regimen was ∼18 electrodes (Fig. 3B), which is equivalent to a spatial extent of ∼850 × 850 μm2. Accordingly, a slope smaller than −1.5 indicates a relative reduction in large nLFP clusters (i.e., long-range correlations that link distant sites in the network).
Finally, we previously demonstrated in slice cultures and somatosensory cortex slices that the lifetime of avalanches (i.e., the number of bins occupied by an avalanche times Δtavg) (Fig. 3C) is relatively short and on the order of milliseconds. Similarly for the acute mPFC slice, avalanches at moderate dopamine concentration were mostly shorter than ∼10 × Δtavg = 27 ms, as revealed by the avalanche lifetime distribution (Fig. 4F).
A power law governs the spontaneous recurrence of avalanche families in the PFC
In somatosensory cortex cultures (Beggs and Plenz, 2004), some avalanche patterns recur over the course of several hours; however, neither the organization of spontaneous retrieval of similar patterns nor its pharmacological dependence are known.
Using an improved cluster algorithm (see Materials and Methods), we grouped neuronal avalanches into families based on their similarities (Fig. 5, same data set as in Figs. 1–4). Figure 5A shows how the spatiotemporal patterns of avalanches, when compared with each other, give rise to a sorted similarity matrix. In this matrix, avalanches with high similarities were grouped into families located along the matrix diagonal. When averaging avalanche patterns from individual families, different average spatiotemporal activity patterns were obtained that indicated the likelihood of a particular electrode being active when a family was activated (Fig. 5B).
The temporal organization of family recurrence was complex; the recurrence of a family was irregular and spread out in time intermingled with recurrences from other families (Fig. 5C). To better understand the organization of avalanche recurrences (i.e., family sizes n), family size distributions were plotted in double logarithmic coordinates (30 μm dopamine and 3 μm NMDA; n = 6 slices). This revealed a power-law-like distribution P(n) ∝ nγ for significant families (size, n > 2) with slope γ = −2.44 ± 0.01 (Fig. 5F) (Rorg = −0.964 ± 0.01; n = 6 slices). The slope γ, measured for all significant families, was robust for a wide range of different type I errors (Fig. 5G) (0.1% < type I < 10%). This relationship allows for a straightforward estimate of family recurrences within superficial layers of the mPFC. For example, if 100 families repeat 5 times each during a particular time period, then during the same period the network will also produce 340 families that repeat ∼3 times and 20 families that repeat ∼10 times each.
The statistical significance of a family recurrence was based on 100 surrogate data sets obtained with pairwise shuffling (Fig. 5D–F). The analysis for the corresponding surrogate data sets demonstrated the absence of large families as seen in the original data. Instead, the family size distribution for surrogate data decayed exponentially according to P(n) = 0.21 × e−0.34n (r = −0.998), resulting in a downward pointing curve when plotted in double logarithmic coordinates (Fig. 5F).
When comparing different concentrations of dopamine, an inverted-U-shaped profile characterized the likelihood that a family recurred beyond chance (Fig. 5H). In the presence of 3 μm NMDA, an optimal concentration of 30 μm dopamine increased the likelihood of family recurrence by ∼500% beyond chance level (df(4,21) = 15.1; p = 0.0017).
Supralinear dopamine D1 and NMDA receptor interaction mediates the inverted-U profile of avalanche induction
PFC functions (e.g., working memory) have been shown to depend on the partial dopamine D1 receptor agonist SKF38393 in an inverted-U profile (Arnsten et al., 1994). Similar to the dependence found for dopamine, SKF38393 induced neuronal avalanches by means of an inverted-U profile in the mPFC slices. Avalanches were robustly induced by bath application of 3 μm NMDA and 3 μm SKF38393 (Fig. 6A) (n = 11), which is in line with our findings for acute slices from the somatosensory cortex (Beggs and Plenz, 2003). At 3 μm of the agonist, the Δtavg as well as the slope α was not significantly different from avalanche induction using 30 μm dopamine (Fig. 6B,C) (Δtavg = 3.3 ± 0.2; αLFP = −1.52 ± 0.06; p > 0.05). Importantly, the slope of α of approximately −1.5 was achieved at a significantly reduced level of total activity compared with dopamine (p = 0.007). This difference did not result from differences in avalanche rate (p = 0.42), but rather from the reduced average nLFP peak amplitude in the presence of the agonist (6.62 ± 0.01 mV; p = 0.001). For concentrations of SKF38393 higher or lower than 3 μm, the slope α changed to steeper values than −1.5 (Fig. 6C) (df(3,206) = 39.1; p = 0.0005), and the avalanche rate and nLFP activity decreased (Fig. 6D,E) (rate: df(3,31) = 11.09, p = 0.012; Atot: df(3,31) = 10.1, p = 0.018).
Figure 6.

Dopamine D1 receptor stimulation induces neuronal avalanches via an inverted-U-shaped pharmacological profile. A, Average time course of spontaneous nLFP activity for four concentrations of the dopamine D1 receptor agonist SKF38393 (SKF) ranging from 0.3 to 300 μm bath applied in combination with 3 μm NMDA (the number of experiments is in parentheses). Bottom, Raster plot of nLFPs for a single representative network at 3 μm of the agonist. B, Corresponding distribution in avalanche sizes sLFP (mean ± SEM). C, The D1 agonist SKF38393, when coapplied with 3 μm NMDA, mimics the inverted-U-shaped pharmacological profile for the slope α obtained with dopamine. The slope is maximal at 3 μm SKF38393 (∗) and decreases at lower and higher concentrations (mean r = −0.92; size, 4–200 μV; ∗p < 0.0005). The number of experiments for each condition is shown in parentheses. D, E, Corresponding dose–response relationship for avalanche rate (D) and total activity (E). Asterisks in D and E indicate significant difference from highest and lowest SKF38393 concentration, respectively.
In accordance with the codependence of PFC functions on NMDA and dopamine D1 receptor stimulation (Verma and Moghaddam, 1996), costimulation of the dopamine D1 and NMDA receptor was required for avalanche induction. Bath application of 3 μm SKF38393 alone did not induce nLFPs or avalanches; however, avalanches were rescued when 3 μm NMDA was added (αLFP = −1.55 ± 0.07; r = −0.95) (Fig. 7A,B). At a concentration of 10 μm, the dopamine D1 receptor antagonist SCH23390 blocks numerous dopamine- and D1-mediated effects in the PFC at the single neuron level in vitro (Gonzalez-Islas and Hablitz, 2001; Seamans et al., 2001b; Gorelova et al., 2002; Gao et al., 2003; Chen et al., 2004; Tseng and O’Donnell, 2004). Accordingly, bath application of 3 μm NMDA alone induced negligible nLFP and avalanche activity in the presence of SCH23390 (10 μm; n = 7) (Fig. 7C). Finally, avalanche induction was completely blocked by 10 μm SCH23390 in the presence of 30 μm dopamine and NMDA, suggesting that it is indeed the dopamine D1 receptor, which is crucial for avalanche induction (Fig. 7D,E) (n = 8; αLFP = −1.55 ± 0.06 for washout; r = −0.98).
Figure 7.

Avalanche induction requires coactivation of the NMDA and dopamine D1 receptor. A, Dopamine D1 receptor stimulation with SKF38393 (3 μm) alone does not induce avalanches, but avalanche activity is rescued by additional application of 3 μm NMDA. Bottom, Raster plot of nLFPs for a single representative network. B, Corresponding avalanche size distribution for experiments shown in C (solid line, linear regression). C, Bath application of 3 μm NMDA does not induce neuronal avalanches when the dopamine D1 receptor is blocked. D, The dopamine D1 receptor antagonist SCH23390 (10 μm) prevents induction of neuronal avalanches by 30 μm dopamine and 3 μm NMDA. Avalanche activity is rescued after washout of SCH23390. Bottom, Raster plot of nLFPs for a single representative network. E, Corresponding avalanche size distribution for recovery (solid line, linear regression).
Spontaneous recurrence of neuronal avalanches requires intact fast GABAergic synaptic transmission
The formation of sharp negative nLFP peaks and the fast propagation of activity, as identified in an avalanche, at first seem at odds with the slow action of dopamine and long-lasting NMDA currents. We therefore hypothesized that although dopamine and NMDA receptor stimulation are necessary for avalanches to emerge, fast synaptic inhibition might also be required to support the formation of synchronized activity, as has been proposed from modeling studies (Lytton and Sejnowski, 1990; Van Vreeswijk et al., 1994).
Indeed, when fast synaptic GABAergic transmission was reduced in the mPFC slice by adding 10 μm picrotoxin, nLFP and avalanche activity ceased (Fig. 8A). Furthermore, picrotoxin prevented spontaneous avalanche induction altogether when coapplied with 3 μm NMDA and 3 μm SKF38393 (n = 6) (Fig. 8B), further demonstrating that spontaneous recurrence of neuronal avalanches required fast synaptic inhibition. Finally, spontaneous activity induced by bath application of picrotoxin alone (10 μm) was significantly less compared with that achieved by 30 μm dopamine and 3 μm NMDA (Fig. 8C) (Atot, 5033 ± 719 μV; nLFP rate, 0.01 ± 0.001 Hz; avalanche rate, 0.18 ± 0.02 Hz; duration, 28 ± 2 min; all p < 0.05; n = 6). Importantly, the initial slope α of the disinhibited activity was smaller than −1.5 (αele = −1.97 ± 0.02; sele = 1 − 5; αLFP = −1.9 ± 0.08; sLFP = 15 − 85; p = 0.001) (Fig. 8D). Similarly, the maximal time difference between correlated electrodes on the array dropped significantly to τmax = 30.5 ± 7.2 (p = 0.012), with a corresponding slight reduction in the Δtavg to 2.3 ± 0.2 (p = 0.07) (Fig. 8C, inset).
Figure 8.
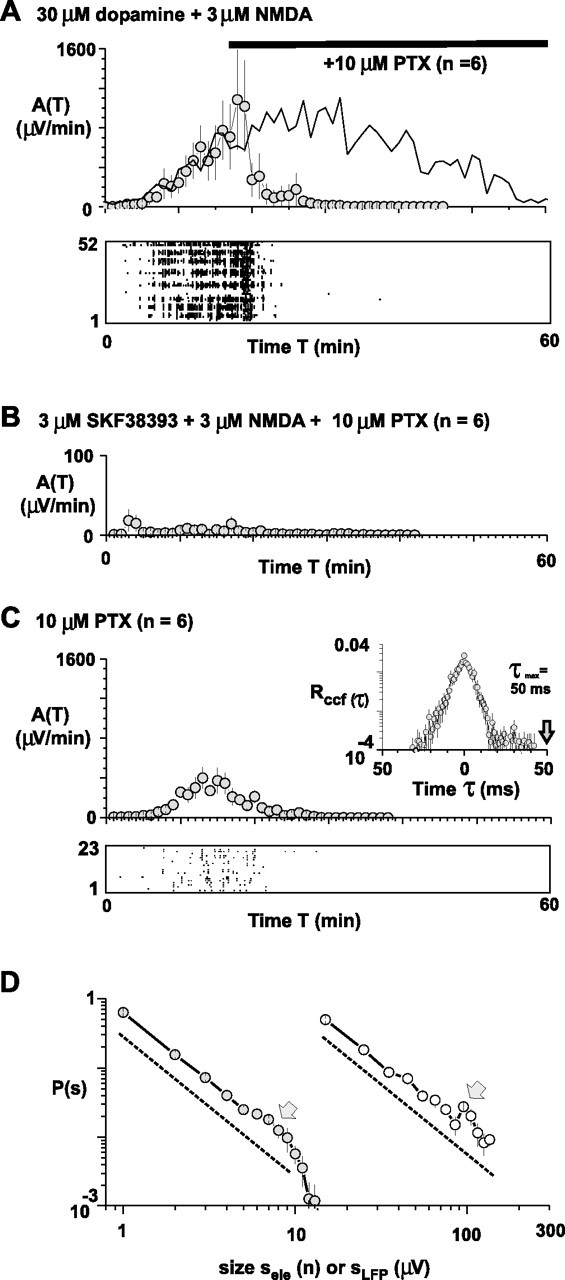
Neuronal avalanche recurrence depends on intact fast synaptic inhibition and differs from disinhibited spontaneous activity. A, Neuronal avalanche activity sustained by 30 μm dopamine and 3 μm NMDA ceases when the GABAA antagonist picrotoxin (10 μm) is added. Solid line, Time course of activity in the absence of the antagonist taken from Figure 1C for comparison. Bottom, Raster plot of nLFPs for a single representative network. B, Picrotoxin coapplied with 3 μm SKF38393 and 3 μm NMDA prevents induction of neuronal avalanches. The numbers of experiments is shown in parentheses. Note the difference in the y-scale compared with A. C, Spontaneous disinhibited activity induced by bath application of picrotoxin alone (n = 6 slices) consists of relatively few nLFPs that are correlated for ∼50 ms on the array (inset, population ccf from n = 6 experiments). D, Corresponding avalanche size distribution for disinhibited activity. The distributions based on sele (filled circles) or sLFP (open circles) have an initial slope α close to −2 and reveal a slight increase (arrows) in the probability for large avalanches (dotted lines have slope of α = −2). PTX, Picrotoxin.
Discussion
We demonstrated that dopamine and NMDA regulate the spontaneous recurrence of spatiotemporal activity patterns in the form of neuronal avalanches in superficial PFC layers via an inverted-U pharmacological profile. Avalanche induction required the coactivation of the dopamine D1 and NMDA receptor and was blocked when fast synaptic inhibition was reduced.
This control of neuronal avalanche formation provides a coherent network level representation for many robust actions of dopamine and NMDA at the single-cell level in the PFC. First, D1 receptor stimulation, through upregulation of NMDA responses (Cepeda and Levine, 1998; Seamans and Yang, 2004), increases the overall excitability of the cortical network (Bandyopadhyay et al., 2005), which is in line with the increase in spontaneous avalanches observed in the present study when 3 μm NMDA was coapplied with a dopamine D1 receptor agonist, but not otherwise. Second, D1 receptor stimulation, by reducing intrinsic potassium currents (Surmeier and Kitai, 1993; Dong and White, 2003; Dong et al., 2004; Tseng and O’Donnell, 2004), allows neurons to respond faster to synaptic inputs, which is in accordance with the fast propagation of neuronal activity that constitutes an avalanche. Third, dopamine D1 receptor stimulation does not inhibit (Tseng and O’Donnell, 2004), but instead facilitates, fast glutamatergic transmission in cortical pyramidal neurons (Seamans et al., 2001a; Wang and O’Donnell, 2001; Gonzalez-Islas and Hablitz, 2003), which should support the fast successive activation of neurons that underlies avalanche formation. Finally, dopamine D1 receptor stimulation depolarizes cortical interneurons and strengthens synaptic coupling between pyramidal neuron input and interneuron spiking (Zhou and Hablitz, 1999; Seamans et al., 2001b; Gorelova et al., 2002; Gao and Goldman-Rakic, 2003; Gao et al., 2003). This effect of dopamine should increase the amplitude and temporal precision of inhibition in the cortex in support of the formation of synchronized activity in the network (Hasenstaub et al., 2005). This interpretation is in line with our finding that dopamine and NMDA induced sharp negative nLFPs indicative of synchronized activity (Plenz and Aertsen, 1993; Bove et al., 1996), which were blocked when fast synaptic inhibition was reduced. How precisely fast inhibition contributes to avalanche formation will require the identification of the cell types and intracellular activity with respect to nLFP generation.
The concentration dependence of avalanche formation also agrees well with the effects reported for dopamine and NMDA at the single-cell level. We found optimal avalanche induction and pattern retrieval at 30 μm dopamine, a concentration at which dopamine robustly depolarizes PFC fast-spiking interneurons (Zhou and Hablitz, 1999; Gorelova et al., 2002) and modulates GABAergic and glutamatergic inputs to PFC pyramidal neurons (Gonzalez-Islas and Hablitz, 2001, 2003; Seamans et al., 2001b; Gao and Goldman-Rakic, 2003; Gao et al., 2003) in addition to affecting other single neuron properties (for review, see Seamans and Yang, 2004). The reduction in avalanches at higher concentrations of dopamine and SKF38393 is consistent with the reduction in NMDA-evoked currents and postsynaptic potentials in pyramidal neurons at high concentrations of dopamine and a dopamine D1 agonist (Castro et al., 1999; Zheng et al., 1999; Seamans and Yang, 2004). It is also in line with the finding that local pressure ejection of dopamine (100 μm to 10 mm) or SKF38393 (100 μm) decreases the reliability and amplitudes of excitatory transmission in prefrontal circuits (Gao et al., 2001), which should reduce the formation and size of avalanches. Similarly, the induction of avalanches at low concentrations of NMDA and dopamine D1 receptor stimulation supports the reported facilitation of NMDA currents at low concentrations of dopamine and SKF38393 (<10 μm) (Zheng et al., 1999) and the supralinear increase in PFC neuron excitability at these concentrations (Tseng and O’Donnell, 2004). Finally, avalanches were only induced in slices from adult rats, suggesting a profound developmental component in avalanche induction similar to the D1–NMDA-mediated induction of spontaneous up-states in layer V neurons of the PFC (Tseng and O’Donnell, 2005).
Optimal receptor stimulation maximizes recurrence and distance of spatial correlations of neuronal avalanches
Our results provide a precise and quantitative description of an inverted-U-shaped pharmacological profile for NMDA–dopamine interaction at the network level: moderate NMDA and dopamine D1 receptor stimulation induces avalanches with a maximal slope of −1.5 in avalanche size distribution and maximizes the spontaneous formation and retrieval of avalanches. Previously, in organotypic cortex cultures, which are spontaneously active, we found that a slope of −1.5 is obtained during development without external pharmacological manipulation (Beggs and Plenz, 2003). Although our previous work suggested theoretically that −1.5 might be the maximal slope for cortical networks, the present study demonstrates experimentally that this is indeed the case for the NMDA–dopamine interaction. Furthermore, the mature acute slices could have revealed a power law slope of −1.5 at any rate of nLFP or avalanche induction. Our results, however, show that the neuromodulator dopamine moves the network into the optimal state in line with an increase in overall activity. Several aspects of the recurrence rate inside and outside the optimal state as measured in the present study deserve particular attention. First, only the largest nLFPs will be recorded with planar microelectrodes from the bottom surface of the slice. Although this does not affect much the estimate of the power law slope, it grossly underestimates the absolute rate of avalanches. For comparison, neuronal avalanche sizes range from 4 to 4000 μV in the organotypic cortex slice culture (Beggs and Plenz, 2003), where electrodes are directly adjacent to active neuronal tissue. By measuring only the range of the largest avalanches (e.g., from 400 to 4000 μV), which comprises ∼6% of all avalanches, one would underestimate avalanche rate by ∼94%. Second, the inverted-U profile leads to a relatively sharp drop in large avalanches. For example, at a slope value of −2 outside the optimal state, the recurrence of avalanches that are 100 times larger for any given avalanche size has dropped by a factor of 10 compared with a slope of −1.5, which is in addition to a strong reduction in spontaneous avalanche recurrence. In conclusion, suboptimal dopamine–NMDA interaction results in a drastic decrease in avalanche recurrence as well as a decrease in spatial correlation when avalanches recur.
Neuronal avalanches differ from other types of spontaneous cortical activity
The spontaneous avalanches described in the present study differ profoundly from other types of spontaneous activity reported in acutely isolated cortex preparations. The localization of avalanches to mainly superficial layers, their fast propagation velocity, and non-oscillatory temporal organization all differ from the slow oscillation in ferret cortex slices that is induced through a rise in extracellular potassium concentration (Sanchez-Vives and McCormick, 2000). The diverse range of spatiotemporal patterns also separates neuronal avalanches from the spiral wave-like activity found in the disinhibited cortex slice (Huang et al., 2004). In contrast to spontaneous activity patterns reported in young mouse cortex slices, which include infragranular layers and are suppressed by low concentrations of dopamine or the D1 receptor agonist SKF38393 (Ikegaya et al., 2004), neuronal avalanches are induced by dopamine D1 receptor stimulation. Finally, the neuronal avalanches induced by optimal dopamine–NMDA interaction are different from epileptic activity. Spontaneous activity in disinhibited neuronal network preparations are characterized by slow oscillations <0.5 Hz (Staley et al., 1998; Tabak et al., 2001), which were absent in the activity induced by dopamine and NMDA. We also demonstrated previously that spontaneous activity in disinhibited cortex slices cultures is characterized by a bimodal avalanche size distribution with an initial slope α less than −1.5 (Beggs and Plenz, 2003; Plenz, 2005). Similarly, in the acute slice, picrotoxin alone induced nLFPs at lower frequency, with a reduced overall duration, with a slightly higher propagation speed as indicated by the reduction in Δtavg, and, importantly, with a power law slope α that is smaller than −1.5 when compared with optimal NMDA–dopamine-mediated stimulation. In conclusion, although our average propagation velocity of ∼70 mm/s approaches the propagation speed for evoked and spontaneous activity in the disinhibited cortex slice (70–90 mm/s) (Wadman and Gutnick, 1993; Sanchez-Vives and McCormick, 2000; Pinto et al., 2005), neuronal avalanches might represent a condition of fast propagation of activity in the presence of intact inhibition.
Neuronal avalanches in superficial cortex layers
The present study demonstrates that neuronal avalanches are localized to superficial cortex layers. Although these layers have a reduced density of dopamine D1 or D2 receptors (Al Tikriti et al., 1992; Vincent et al., 1995) and higher intracortical connectivity (Thomson et al., 2002) compared with deep layers, it is presently not known how these layer differences affect avalanche formation.
We also derived a quantitative and robust relationship for the highly diverse, yet stably recurring avalanche families in superficial layers, which extends findings on the existence of repeated spatiotemporal neuronal activity patterns in cortical tissue (Cossart et al., 2003; Beggs and Plenz, 2004; Ikegaya et al., 2004; Segev et al., 2004). The recurrence of spontaneous spatiotemporal patterns is thought to reflect the organization of the underlying neuronal network (Amit et al., 1994; Shu et al., 2003) and, in the presence of dopamine, might regulate network connectivity (Eytan et al., 2004). We suggest that avalanche recurrence in superficial layers represent preferred synaptic pathways that have been formed in the PFC network, thereby contributing to integrative and associative aspects of PFC functions.
Footnotes
This work was supported by the Intramural Research Program of the National Institutes of Health–National Institute of Mental Health. We express our gratitude to Dr. Sinisa Pajevic for the improvement of the cluster algorithm and Drs. Tara Thiagarajan and Avrama Blackwell for discussions and critical reading of a previous version of this manuscript.
References
- Al Tikriti MS, Roth RH, Kessler RM, Innis RB (1992). Autoradiographic localization of dopamine D1 and D2 receptors in rat cerebral cortex following unilateral neurotoxic lesions. Brain Res 575:39–46. [DOI] [PubMed] [Google Scholar]
- Amit DJ, Brunel N, Tsodyks MV (1994). Correlations of cortical Hebbian reverberations: theory versus experiment. J Neurosci 14:6435–6445. [DOI] [PMC free article] [PubMed] [Google Scholar]
- Arnsten AF, Cai JX, Murphy BL, Goldman-Rakic PS (1994). Dopamine D1 receptor mechanisms in the cognitive performance of young adult and aged monkeys. Psychopharmacology (Berl) 116:143–151. [DOI] [PubMed] [Google Scholar]
- Bandyopadhyay S, Gonzalez-Islas C, Hablitz JJ (2005). Dopamine enhances spatiotemporal spread of activity in rat prefrontal cortex. J Neurophysiol 93:864–872. [DOI] [PubMed] [Google Scholar]
- Barros DM, Mello e Souza T, De David T, Choi H, Aguzzoli A, Madche C, Ardenghi P, Medina JH, Izquierdo I (2001). Simultaneous modulation of retrieval by dopaminergic D(1), beta-noradrenergic, serotonergic-1A and cholinergic muscarinic receptors in cortical structures of the rat. Behav Brain Res 124:1–7. [DOI] [PubMed] [Google Scholar]
- Beggs JM, Plenz D (2003). Neuronal avalanches in neocortical circuits. J Neurosci 23:11167–11177. [DOI] [PMC free article] [PubMed] [Google Scholar]
- Beggs JM, Plenz D (2004). Neuronal avalanches are diverse and precise activity patterns that are stable for many hours in cortical slice cultures. J Neurosci 24:5216–5229. [DOI] [PMC free article] [PubMed] [Google Scholar]
- Bove M, Genta G, Verreschi G, Grattarola M (1996). Characterization and interpretation of electrical signals from random networks of cultured neurons. Technol Health Care 4:77–86. [PubMed] [Google Scholar]
- Castro NG, de Mello MC, de Mello FG, Aracava Y (1999). Direct inhibition of the N-methyl-D-aspartate receptor channel by dopamine and (+)-SKF38393. Br J Pharmacol 126:1847–1855. [DOI] [PMC free article] [PubMed] [Google Scholar]
- Cepeda C, Levine MS (1998). Dopamine and N-methyl-D-aspartate receptor interactions in the neostriatum. Dev Neurosci 20:1–18. [DOI] [PubMed] [Google Scholar]
- Chen G, Greengard P, Yan Z (2004). Potentiation of NMDA receptor currents by dopamine D1 receptors in prefrontal cortex. Proc Natl Acad Sci USA 101:2596–2600. [DOI] [PMC free article] [PubMed] [Google Scholar]
- Cossart R, Aronov D, Yuste R (2003). Attractor dynamics of network UP states in the neocortex. Nature 423:283–288. [DOI] [PubMed] [Google Scholar]
- Dong Y, White FJ (2003). Dopamine D1-class receptors selectively modulate a slowly inactivating potassium current in rat medial prefrontal cortex pyramidal neurons. J Neurosci 23:2686–2695. [DOI] [PMC free article] [PubMed] [Google Scholar]
- Dong Y, Cooper D, Nasif F, Hu XT, White FJ (2004). Dopamine modulates inwardly rectifying potassium currents in medial prefrontal cortex pyramidal neurons. J Neurosci 24:3077–3085. [DOI] [PMC free article] [PubMed] [Google Scholar]
- Eytan D, Minerbi A, Ziv N, Marom S (2004). Dopamine-induced dispersion of correlations between action potentials in networks of cortical neurons. J Neurophysiol 92:1817–1824. [DOI] [PubMed] [Google Scholar]
- Floresco SB, Phillips AG (2001). Delay-dependent modulation of memory retrieval by infusion of a dopamine D1 agonist into the rat medial prefrontal cortex. Behav Neurosci 115:934–939. [PubMed] [Google Scholar]
- Gao WJ, Goldman-Rakic PS (2003). Selective modulation of excitatory and inhibitory microcircuits by dopamine. Proc Natl Acad Sci USA 100:2836–2841. [DOI] [PMC free article] [PubMed] [Google Scholar]
- Gao WJ, Krimer LS, Goldman-Rakic PS (2001). Presynaptic regulation of recurrent excitation by D1 receptors in prefrontal circuits. Proc Natl Acad Sci USA 98:295–300. [DOI] [PMC free article] [PubMed] [Google Scholar]
- Gao WJ, Wang Y, Goldman-Rakic PS (2003). Dopamine modulation of perisomatic and peridendritic inhibition in prefrontal cortex. J Neurosci 23:1622–1630. [DOI] [PMC free article] [PubMed] [Google Scholar]
- Goldman-Rakic PS, Muly EC III, Williams GV (2000). D(1) receptors in prefrontal cells and circuits. Brain Res Brain Res Rev 31:295–301. [DOI] [PubMed] [Google Scholar]
- Gonzalez-Islas C, Hablitz JJ (2001). Dopamine inhibition of evoked IPSCs in rat prefrontal cortex. J Neurophysiol 86:2911–2918. [DOI] [PubMed] [Google Scholar]
- Gonzalez-Islas C, Hablitz JJ (2003). Dopamine enhances EPSCs in layer II–III pyramidal neurons in rat prefrontal cortex. J Neurosci 23:867–875. [DOI] [PMC free article] [PubMed] [Google Scholar]
- Gorelova N, Seamans JK, Yang CR (2002). Mechanisms of dopamine activation of fast-spiking interneurons that exert inhibition in rat prefrontal cortex. J Neurophysiol 88:3150–3166. [DOI] [PubMed] [Google Scholar]
- Granon S, Passetti F, Thomas KL, Dalley JW, Everitt BJ, Robbins TW (2000). Enhanced and impaired attentional performance after infusion of D1 dopaminergic receptor agents into rat prefrontal cortex. J Neurosci 20:1208–1215. [DOI] [PMC free article] [PubMed] [Google Scholar]
- Hasenstaub A, Shu Y, Haider B, Kraushaar U, Duque A, McCormick DA (2005). Inhibitory postsynaptic potentials carry synchronized frequency information in active cortical networks. Neuron 47:423–435. [DOI] [PubMed] [Google Scholar]
- Huang X, Troy WC, Yang Q, Ma H, Laing CR, Schiff SJ, Wu JY (2004). Spiral waves in disinhibited mammalian neocortex. J Neurosci 24:9897–9902. [DOI] [PMC free article] [PubMed] [Google Scholar]
- Ikegaya Y, Aaron G, Cossart R, Aronov D, Lampl I, Ferster D, Yuste R (2004). Synfire chains and cortical songs: temporal modules of cortical activity. Science 304:559–564. [DOI] [PubMed] [Google Scholar]
- Krystal JH, D’Souza DC, Mathalon D, Perry E, Belger A, Hoffman R (2003). NMDA receptor antagonist effects, cortical glutamatergic function, and schizophrenia: toward a paradigm shift in medication development. Psychopharmacology (Berl) 169:215–233. [DOI] [PubMed] [Google Scholar]
- Lewis DA, Levitt P (2002). Schizophrenia as a disorder of neurodevelopment. Annu Rev Neurosci 25:409–432. [DOI] [PubMed] [Google Scholar]
- Lytton WW, Sejnowski TJ (1990). Simulations of cortical pyramidal neurons synchronized by inhibitory interneurons. J Neurophysiol 66:1059–1079. [DOI] [PubMed] [Google Scholar]
- Mattay VS, Goldberg TE, Fera F, Hariri AR, Tessitore A, Egan MF, Kolachana B, Callicott JH, Weinberger DR (2003). Catechol O-methyltransferase val158-met genotype and individual variation in the brain response to amphetamine. Proc Natl Acad Sci USA 100:6186–6191. [DOI] [PMC free article] [PubMed] [Google Scholar]
- Mele A, Castellano C, Felici A, Cabib S, Caccia S, Oliverio A (1996). Dopamine-N-methyl-D-aspartate interactions in the modulation of locomotor activity and memory consolidation in mice. Eur J Pharmacol 308:1–12. [DOI] [PubMed] [Google Scholar]
- Miller EK, Cohen JD (2001). An integrative theory of prefrontal cortex function. Annu Rev Neurosci 24:167–202. [DOI] [PubMed] [Google Scholar]
- Murphy BL, Arnsten AF, Goldman-Rakic PS, Roth RH (1996). Increased dopamine turnover in the prefrontal cortex impairs spatial working memory performance in rats and monkeys. Proc Natl Acad Sci USA 93:1325–1329. [DOI] [PMC free article] [PubMed] [Google Scholar]
- O’Donovan MJ (1999). The origin of spontaneous activity in developing networks of the vertebrate nervous system. Curr Opin Neurobiol 9:94–104. [DOI] [PubMed] [Google Scholar]
- Pinto DJ, Patrick SL, Huang WC, Connors BW (2005). Initiation, propagation, and termination of epileptiform activity in rodent neocortex in vitro involve distinct mechanisms. J Neurosci 25:8131–8140. [DOI] [PMC free article] [PubMed] [Google Scholar]
- Plenz D (2005). Comment on “Critical branching captures activity in living neural networks and maximizes the number of metastable states.”. http://lanl.arxiv.org/abs/q-bio.NC/0504024. [DOI] [PubMed]
- Plenz D, Aertsen A (1993). Current source density profiles of optical recording maps: a new approach to the analysis of spatio-temporal neural activity patterns. Eur J Neurosci 5:437–448. [DOI] [PubMed] [Google Scholar]
- Sanchez-Vives MV, McCormick DA (2000). Cellular and network mechanisms of rhythmic recurrent activity in neocortex. Nat Neurosci 3:1027–1034. [DOI] [PubMed] [Google Scholar]
- Sawaguchi T, Goldman-Rakic PS (1991). D1 dopamine receptors in prefrontal cortex: involvement in working memory. Science 251:947–950. [DOI] [PubMed] [Google Scholar]
- Seamans JK, Yang CR (2004). The principal features and mechanisms of dopamine modulation in the prefrontal cortex. Prog Neurobiol 74:1–58. [DOI] [PubMed] [Google Scholar]
- Seamans JK, Floresco SB, Phillips AG (1998). D1 receptor modulation of hippocampal-prefrontal cortical circuits integrating spatial memory with executive functions in the rat. J Neurosci 18:1613–1621. [DOI] [PMC free article] [PubMed] [Google Scholar]
- Seamans JK, Durstewitz D, Christie BR, Stevens CF, Sejnowski TJ (2001a). Dopamine D1/D5 receptor modulation of excitatory synaptic inputs to layer V prefrontal cortex neurons. Proc Natl Acad Sci USA 98:301–306. [DOI] [PMC free article] [PubMed] [Google Scholar]
- Seamans JK, Gorelova N, Durstewitz D, Yang CR (2001b). Bidirectional dopamine modulation of GABAergic inhibition in prefrontal cortical pyramidal neurons. J Neurosci 21:3628–3638. [DOI] [PMC free article] [PubMed] [Google Scholar]
- Segev R, Baruchi I, Hulata E, Ben Jacob E (2004). Hidden neuronal correlations in cultured networks. Phys Rev Lett 92:118102. [DOI] [PubMed] [Google Scholar]
- Shu Y, Hasenstaub A, McCormick DA (2003). Turning on and off recurrent balanced cortical activity. Nature 423:288–293. [DOI] [PubMed] [Google Scholar]
- Staley KJ, Longacher M, Bains JS, Yee A (1998). Presynaptic modulation of CA3 network activity. Nat Neurosci 1:201–209. [DOI] [PubMed] [Google Scholar]
- Staley KJ, Bains JS, Yee A, Hellier J, Longacher JM (2001). Statistical model relating CA3 burst probability to recovery from burst-induced depression at recurrent collateral synapses. J Neurophysiol 86:2736–2747. [DOI] [PubMed] [Google Scholar]
- Stefani MR, Groth K, Moghaddam B (2003). Glutamate receptors in the rat medial prefrontal cortex regulate set-shifting ability. Behav Neurosci 117:728–737. [DOI] [PubMed] [Google Scholar]
- Surmeier DJ, Kitai ST (1993). D1 and D2 dopamine receptor modulation of sodium and potassium currents in rat neostriatal neurons. In: Chemical signalling in the basal ganglia (Arbuthnott GW, Emson PC, eds) pp. 309–324. Amsterdam; New York: Elsevier Science Publishers. [DOI] [PubMed]
- Tabak J, Rinzel J, O’Donovan MJ (2001). The role of activity-dependent network depression in the expression and self-regulation of spontaneous activity in the developing spinal cord. J Neurosci 21:8966–8978. [DOI] [PMC free article] [PubMed] [Google Scholar]
- Thomson AM, West DC, Wang Y, Bannister AP (2002). Synaptic connections and small circuits involving excitatory and inhibitory neurons in layers 2–5 of adult rat and cat neocortex: triple intracellular recordings and biocytin labelling in vitro. Cereb Cortex 12:936–953. [DOI] [PubMed] [Google Scholar]
- Tseng KY, O’Donnell P (2004). Dopamine-glutamate interactions controlling prefrontal cortical pyramidal cell excitability involve multiple signaling mechanisms. J Neurosci 24:5131–5139. [DOI] [PMC free article] [PubMed] [Google Scholar]
- Tseng KY, O’Donnell P (2005). Post-pubertal emergence of prefrontal cortical up states induced by D1-NMDA co-activation. Cereb Cortex 15:49–57. [DOI] [PubMed] [Google Scholar]
- Vaadia E, Haalman I, Abeles M, Bergman H, Prut Y, Slovin H, Aertsen A (1995). Dynamics of neuronal interactions in monkey cortex in relation to behavioural events. Nature 373:515–518. [DOI] [PubMed] [Google Scholar]
- Van Vreeswijk C, Abbott LF, Ermentrout GB (1994). When inhibition not excitation synchronizes neural firing. J Comput Neurosci 1:313–321. [DOI] [PubMed] [Google Scholar]
- Verma A, Moghaddam B (1996). NMDA receptor antagonists impair prefrontal cortex function as assessed via spatial delayed alternation performance in rats: modulation by dopamine. J Neurosci 16:373–379. [DOI] [PMC free article] [PubMed] [Google Scholar]
- Vincent SL, Khan Y, Benes FM (1995). Cellular colocalization of dopamine D1 and D2 receptors in rat medial prefrontal cortex. Synapse 19:112–120. [DOI] [PubMed] [Google Scholar]
- Wadman WJ, Gutnick MJ (1993). Non-uniform propagation of epileptiform discharge in brain slices of rat neocortex. Neuroscience 52:255–262. [DOI] [PubMed] [Google Scholar]
- Wang J, O’Donnell P (2001). D(1) dopamine receptors potentiate NMDA-mediated excitability increase in layer V prefrontal cortical pyramidal neurons. Cereb Cortex 11:452–462. [DOI] [PubMed] [Google Scholar]
- Weinberger DR, Egan MF, Bertolino A, Callicott JH, Mattay VS, Lipska BK, Berman KF, Goldberg TE (2001). Prefrontal neurons and the genetics of schizophrenia. Biol Psychiatry 50:825–844. [DOI] [PubMed] [Google Scholar]
- Zahrt J, Taylor JR, Mathew RG, Arnsten AF (1997). Supranormal stimulation of D1 dopamine receptors in the rodent prefrontal cortex impairs spatial working memory performance. J Neurosci 17:8528–8535. [DOI] [PMC free article] [PubMed] [Google Scholar]
- Zar JH (1999). Biostatistical analysis. Upper Saddle River, NJ: Prentice-Hall.
- Zheng P, Zhang XX, Bunney BS, Shi WX (1999). Opposite modulation of cortical N-methyl-D-aspartate receptor-mediated responses by low and high concentrations of dopamine. Neuroscience 91:527–535. [DOI] [PubMed] [Google Scholar]
- Zhou FM, Hablitz JJ (1999). Dopamine modulation of membrane and synaptic properties of interneurons in rat cerebral cortex. J Neurophysiol 81:967–976. [DOI] [PubMed] [Google Scholar]