

Abstract
Autophagy is a highly regulated cellular mechanism for the bulk degradation of cytoplasmic contents. It has been implicated in a variety of physiological and pathological conditions relevant to neurological diseases. However, the regulation of autophagy in neurons and its role in neuronal and axonal pathology are not yet understood. Using transgenic mice producing green fluorescent protein-tagged autophagic marker microtubule-associated protein light chain 3 (GFP–LC3), we provide molecular evidence for the induction of autophagy in axonal dystrophy and degeneration in Purkinje cells of the Lurcher mice, a model for excitotoxic neurodegeneration. We show that the excitotoxic insult of Lurcher mutation triggers an early response of Purkinje cells involving accumulation of GFP–LC3-labeled autophagosomes in axonal dystrophic swellings (a hallmark of CNS axonopathy). In brain, LC3 interacts with high affinity with the microtubule-associated protein 1B (MAP1B). We show that MAP1B binds to LC3 of both cytosolic form (LC3I) and lipidated form (LC3II). Moreover, in cell culture, overexpression of MAP1B results in reduced LC3II levels and number of GFP–LC3-labeled autophagosomes; phosphorylated MAP1B is associated with GFP–LC3-labeled autophagosomes. Furthermore, in brain, phosphorylated MAP1B accumulates in axonal dystrophic swellings of degenerating Purkinje cells and binds to LC3 at increased level. Therefore, the MAP1B–LC3 interaction may participate in regulation of LC3-associated autophagosomes in neurons, in particular at axons, under normal and pathogenic conditions. We propose that induction of autophagy serves as an early stress response in axonal dystrophy and may participate in the remodeling of axon structures.
Keywords: autophagy, neurodegeneration, MAP1B, LC3, axonal dystrophic swellings, Lurcher
Introduction
A hallmark of CNS axonopathy is axonal dystrophy, characterized by either focal dilations (swellings, varicosities) that interrupt the continuity of axons or terminal end bulbs (retraction or degeneration balls) in dysfunctional or degenerating neurons. Ramon y Cajal (1928) documented an early observation of such axonal dystrophy from axotomized Purkinje cell axons. For almost a century, these abnormal axonal morphologies have been found in a variety of CNS neurological diseases, including major human neurodegenerative disorders such as Alzheimer's disease, Parkinson's disease, multiple sclerosis, and amyotrophic lateral sclerosis (Tu et al., 1996; Trapp et al., 1998; Galvin et al., 2001; Brendza et al., 2003). These axonal dystrophic swellings are compartmentalized segments of axons that are usually filled with disorganized neurofilaments, microtubules, organelles, and multi-lamellar vesicles, some of which have been described as autophagosomes (Lin et al., 2003; Ohara et al., 2004). Despite extensive morphological observations of these aberrant axonal structures, the molecular mechanisms involved in axonal dystrophy remain unclear.
Autophagy is a lysosome-dependent degradation pathway regulated by extracellular nutrients or trophic factors. In mammals, autophagy plays a critical role in survival during nutrient starvation, growth factor withdrawal, and microbial invasion (Levine and Klionsky, 2004). The most prominent type of autophagy is macroautophagy (herein referred to as autophagy), by which long-lived proteins and organelles are sequestered to autophagosomes and subsequently delivered to lysosomes for degradation. The best characterized autophagic marker LC3 is the mammalian ortholog of yeast Atg8, which was originally identified as the light chain 3 of microtubule-associated proteins (MAPs). Bona fide autophagosomes can be distinguished from other types of vesicles by detection of the presence of LC3 on the vesicles (Kabeya et al., 2000). Transgenic mice producing green fluorescent protein-tagged LC3 (GFP–LC3) were used previously to analyze autophagy in vivo (Mizushima et al., 2004). Increased autophagic activity is reflected by the enhanced conversion of LC3I (cytosolic) to LC3II (lipidated), concomitant with the recruitment of GFP–LC3 to autophagosomes indicated by the increased number of GFP–LC3 puncta. Although this response has been observed in many mouse tissues during nutrient starvation, the CNS is an exception: GFP–LC3-labeled autophagosomes are rarely detected either without or with nutrient starvation. This observation suggests a different type of regulation of autophagy in the CNS (Mizushima et al., 2004).
We have shown ultrastructurally the accumulation of autophagosome-like vacuoles in degenerating Purkinje cell soma and dendrites of Lurcher mice, in which a mutant glutamate receptor δ2 (GluRδ2Lc) is constitutively activated and causes Purkinje cell degeneration (Yue et al., 2002). Here, using GFP–LC3 transgenic mice, we show that Lurcher induces an autophagic response of Purkinje cells involving the accumulation of autophagosomes in dystrophic axons before neurodegeneration. We also provide evidence that MAP1B regulates LC3-associated autophagosomes and that phosphorylated MAP1B (MAP1B-P) is associated with LC3-labeled autophagosomes and appears to interact with LC3 at an enhanced level in Lurcher Purkinje cells. These results suggest a distinctive regulation of autophagy in axon terminals under physiological and pathological conditions. They further implicate the specific role of autophagy in axonal degeneration, possibly by dynamic restructuring of axon terminals.
Materials and Methods
Chemicals and antibodies.
M-270 Epoxy Dynabeads, DMEM, fetal bovine serum, PBS, HBSS, trypsin–EDTA solution, penicillin–streptomycin solution, 200 mm l-glutamine solution, sodium bicarbonate solution, Leibovitz's L-15 medium, NuPAGE Bis-Tris gels, Western blot transfer buffer, MES SDS running buffer, and antioxidant were purchased from Invitrogen (Carlsbad, CA). Modified trypsin, EDTA-free protease inhibitor cocktail tablets, alkaline phosphatase, and Fugene 6 transfection reagent were purchased from Roche Diagnostics (Indianapolis, IN). Immobilon-P polyvinylidene difluoride (PVDF) membrane was purchased from Millipore (Billerica, MA). GelCode Blue Stain reagent, trifluoroacetic acid (TFA), Tris(2-carboxyethyl)-phosphine hydrochloride, and the Micro BCA Protein Assay Reagent kit were purchased from Pierce (Rockford, IL). LysoTracker Red DND-99 and ProLong Gold antifade reagent were purchased from Invitrogen. Nembutal was purchased from Abbott Laboratories (Abbott Park, IL). Rapamycin was purchased from Calbiochem (San Diego, CA). Other chemicals were purchased from Sigma (St. Louis, MO) or Fischer (Hampton, NH).
Antibodies used in this study include mouse monoclonal calbindin D-28K antibody (1:1000; Swant, Bellinzona, Switzerland), mouse monoclonal neuronal-specific nuclear protein (NeuN) antibody (1:200; Chemicon, Temecula, CA), mouse monoclonal phospho-Tau antibody AT-8 (1:250; Innogenetics, Gent, Belgium), mouse monoclonal phosphorylated MAP1B antibody SMI-31 (1:5000; Sternberger Monoclonals, Lutherville, MD), rabbit polyclonal phosphorylated MAP1B antibody PP172 (Good et al., 2004), guinea pig polyclonal p62/SQSTM1 antibody (1:1000; American Research Products, Belmont, MA), mouse monoclonal c-myc antibody (1:1000; Santa Cruz Biotechnology, Santa Cruz, CA), cyanine 3 (Cy3)-conjugated anti-mouse/rabbit IgG (1:500; Upstate, Charlottesville, VA), rabbit IgG (1:6000; Amersham Biosciences, Pittsburgh, PA), mouse IgG (1:10,000; Pierce). Rabbit monoclonal phospho-S6 ribosomal protein (Ser235/236) antibody (clone 91B2) and mouse monoclonal S6 ribosomal protein antibody were purchased from Cell Signaling Technology (Danvers, MA) (1:200). Rabbit polyclonal LC3 antibody (1:4000) was a gift from Dr. Yoshimori (National Institute for Basic Biology, Okazaki, Japan) (Kabeya et al., 2000). Rabbit polyclonal anti-beclin 1 antibody was purchased from Santa Cruz Biotechnology (1:600). Polyclonal GFP antibody was raised against glutathione S-transferase-tagged GFP and affinity purified (Cristea et al., 2005). Rabbit polyclonal MAP1B antibody NR (1:1000) were gifts from Dr. Fischer (Medical College of Pennsylvania Hahnemann University, Philadelphia, PA) (Fischer and Romano-Clarke, 1990; Ma et al., 1999). Anti-c-myc agarose affinity gel was purchased from Sigma.
Mouse strains, cell cultures, and transfections.
GFP–LC3 transgenic mice (C57BL/6J) was generated as described previously (Mizushima et al., 2004). Lurcher mice (B6CBA/A-Grid2Lc) were purchased from The Jackson Laboratory (Bar Harbor, ME). Lurcher mice producing GFP–LC3 (GFP–LC3/Lurcher) were obtained from a genetic cross between Lurcher and GFP–LC3 transgenic mice. The Lurcher genotype was identified based on phenotype of ataxia for mice at the age of postnatal day 10 (P10) and older. GFP–LC3/Lurcher mice younger than P10 (older than P6) were identified by the appearance of the GFP–LC3-labeled axonal dystrophic swellings in the deep cerebellar nuclei (DCN) area under fluorescence microscope. GFP–LC3 transgenic mice were identified by detecting green epifluorescence of freshly cut tail (Olympus CK40; Olympus Optical, Tokyo, Japan) and confirmed by PCR as described previously (Mizushima et al., 2004).
Human embryonic kidney 293T (HEK 293T), wild-type, Atg5−/−, and Atg7−/− mouse embryonic fibroblast (MEF) cells were maintained in DMEM containing 10% fetal bovine serum. HEK 293T cells were transfected by standard calcium phosphate precipitation procedure. Plasmids used for expression of MAP1B, including PUHD15 and MAP1B–myc (1:6 ratio used for transfection), were kindly provided by Dr. Propst (University of Vienna, Vienna, Austria) (Togel et al., 1998). Control plasmids were PUHD15 and FLAG–GluRδ2 (used at the ratio of 1:6 for transfection). MEF cells were transfected with GFP–LC3 plasmid or a combination of expressing plasmids GFP–LC3 and LacZ–myc (1:6) or GFP–LC3, PUHD15, and MAP1B–myc (1:1:6) using Fugene 6 reagent following the protocol of the manufacturer. Bafilomycin A1 and rapamycin when used were added at 200–300 nm final concentration for 18–24 h.
Tissue and cell preparations for fluorescence microscopy.
Mice were housed in specific pathogen-free facilities in both institutes (Rockefeller University and Mt. Sinai School of Medicine) and cared following National Institutes of Health guidelines. All experimental protocols were approved by the intramural Institutional Animal Care and Use Committee. Animals were anesthetized with 50 mg/ml Nembutal, 0.05 and 0.1 cc for P7 and adult, respectively. The perfusion was performed with 4% paraformaldehyde in PBS, pH 7.4, using a peristaltic pump (Rainin Instruments, Woburn, MA). The perfused brain tissues were postfixed again in 4% paraformaldehyde for 24 h at 4°C and embedded in 5% low-melting agarose gel. Sagittal brain slices at 60 μm were prepared using Tissue Sectioning and Bath Refrigeration Systems (Vibratome, St. Louis, MO) and kept in PBS at 4°C. Brain slices were blocked with PBS containing 0.05% Triton X-100 and 10% goat serum and incubated with primary antibody at 4°C overnight. The slices were washed and incubated with Cy3-conjugated anti-rabbit or anti-mouse IgG for 45 min at room temperature, washed extensively, mounted with ProLong Gold antifade reagent, and examined using a Zeiss (Göttingen, Germany) confocal microscope.
For live imaging of GFP–LC3 and LysoTracker, sagittal cerebellar slices (250 μm) of P12–P14 GFP–LC3/Lurcher mice were prepared using a tissue chopper (Mickle Laboratory Engineering, Gomhall, UK) and incubated in Leibovitz's L-15 medium with 50 nm LysoTracker in the incubation chamber (37°C and 5% CO2) for 10 min before collecting images.
For imaging protein localization in MEF cells, the cultured cells were grown on poly-d-lysine-coated culture slides (BD Biosciences, San Jose, CA). Thirty-six to 48 h after transfection, cells were fixed with 4% paraformaldehyde for 15 min and treated with 0.1% Triton X-100 in PBS containing 5% goat serum for 30 min. Cells were incubated in primary antibodies at 4°C overnight, followed by secondary antibodies accordingly.
Fluorescence microscopy and data analysis.
All images of the brain tissue slices were acquired on an inverted Zeiss LSM 510 Meta system, with an argon laser providing the 488 nm excitation and a helium–neon laser providing the 543 nm excitation. For statistical analysis of the axonal dystrophic swellings in the DCN area, confocal images were acquired with a 60× water objective lens. The numbers of axonal dystrophic swellings were counted for every view field. The numbers of images used for quantification at P7, P10, P14, P18, and P28 mice were 13, 14, 16, 7, and 5, respectively.
All images of the cell culture were acquired on an upright Zeiss LSM 510 system with an argon–krypton laser providing both the 488 and 568 nm excitation lines. The images were collected using a 40× water objective lens (other parameters: 1024 × 1024 pixels, 3.2 μs pixel dwell time, 12 bit data depth, average of two scans, zoom of 1.2). The red channel settings were kept the same for all images so that the red channel signal intensities could be used to compare the expression levels of MAP1B–myc and LacZ–myc in MEF cells. The images were processed in MetaMorph software (Universal Imaging Corporation, Buckinghamshire, UK), and the average red channel signal intensity of the cytosolic region of each cell was measured. A total of 83, 73, 183, and 218 cells were used for cells transfected with GFP–LC3 and LacZ–myc without and with rapamycin treatment and for cells transfected with GFP–LC3 and MAP1B–myc without and with rapamycin treatment, respectively. The number of GFP–LC3-labeled puncta was counted for each cell. Cells were divided into two groups for statistical analysis: (1) red channel intensity below 200 and (2) red channel intensity between 200 and 2000. The cutoff of 200 was chosen based on preliminary analysis to be optimal. Images of cells with the red channel intensity above 2000 were discarded because of a potential artifact resulting from overexpression of LacZ–myc or MAP1B–myc. Statistical analysis was performed using the normal distribution, Student's t test, or F test, when appropriate.
Electron microscopy.
GFP–LC3/Lurcher mice (P10) were transcardially perfused with 4% paraformaldehyde. Cerebellar slices prepared by vibratome section were stored in PBS overnight. For morphology, slices were further fixed with 2.5% glutaraldehyde in 0.1 m cacodylate buffer, pH 7.4, and postfixed with 1% osmium tetroxide in the same buffer. After treatment with 0.5% aqueous uranyl acetate, the specimens were dehydrated with graded alcohol, treated with propylene oxide, and embedded in Durcupan (Fluka, Buchs, Switzerland). Resin was polymerized in a 60°C oven for 2–3 d. Silver sections were cut with a DuPont (Billerica, MA) diamond knife on a Reichert-Jung Ultra Cut E ultramicrotome. The sections were collected on 200 mesh copper grid, stained with both uranyl acetate and lead citrate. For immuno-EM, cerebellar slices were fixed in 0.1% glutaraldehyde in 0.1 m cacodylate buffer, pH 7.4, for 30 min on ice. The slices were quenched with 0.05 m ammonium chloride in the same buffer. Then, they were dehydrated in graded alcohol, embedded in LR White (hard grade) resin (Electron Microscopy Sciences, Fort Washington, PA), and polymerized in a 50°C oven overnight. Pale gold ultrathin sections were collected on 200 mesh, Formvar–carbon-coated nickel grids. The grids with sections were blocked with 1% BSA–PBS, incubated with rabbit anti-GFP (1:1000), and probed with 10 nm gold colloid conjugated with goat anti-rabbit IgG. The sections were contrasted lightly with uranyl acetate. In both experiments, the grids were examined with a Jeol (Peabody, MA) 100CX electron microscope operated at 80 kV. Negative films were developed and scanned. The images were processed in Adobe Photoshop (Adobe Systems, San Jose, CA). For quantification of immuno-EM results, the numbers of gold particles associated with autophagosomes and in the rest of the cytosol were summed from 18 images. Areas of autophagosomes and the rest of the cytosol were also summed from the same images.
Cell and tissue extract preparation and Western blot.
All of the manipulations described below were done at 4°C. At 48 h after transfection, cells were washed with PBS and harvested in PBS. Cells were briefly spun down on a desktop centrifuge at 3000 rpm for 5 min and lysed in 200 μl of extraction buffer (20 mm HEPES, pH 7.4, 1 mm MgCl2, 0.25 mm CaCl2, 0.1% Triton X-100, 120 mm NaCl, 200 μg/ml PMSF, 4 μg/ml pepstatin, EDTA-free protease inhibitor cocktail, and DNase I) using an 18G1 needle 15 times and a 27G needle 60 times. The insoluble fractions were excluded by centrifugation at 3000 rpm for 5 min. The volumes of the supernatants were brought to 350 μl with the extraction buffer.
Mouse brain extract was obtained by homogenizing with a motor-driven homogenizer at speed 2.5 for 12 strokes in a buffer containing 0.32 m sucrose, 1 mm NaHCO3, 20 mm HEPES, pH 7.4, 1 mm MgCl2, 0.25 mm CaCl2, EDTA-free protease inhibitor cocktail, 200 μg/ml PMSF, 4 μg/ml pepstatin, and DNase I. For each gram of wet weight of tissue, 4 ml of homogenization buffer was used. The tissue extracts were centrifuged at 1400 × g for 10 min, and the pellets were homogenized again for six strokes and centrifuged. The two supernatants were pooled and centrifuged at 710 × g for 10 min, and the resulting supernatant was retained. In some cases, additional fractionation was performed at 13,200 × g for 20 min. The protein concentrations of the samples were measured using a Micro BCA Protein Assay Reagent kit following the protocol of the manufacturer. Equal amounts of proteins were loaded to each gel lane. Proteins on the gels were transferred to PVDF membranes using a Mini Trans-Blot Electrophoretic Transfer Cell (Bio-Rad, Hercules, CA) with the modified transfer buffer containing 1× transfer buffer, 1:1000 (v/v) antioxidant, 20% MeOH, and 0.025% SDS, running at 30 V overnight. The blots were blocked with 5% fat-free dry milk in TBST (TBS with Tween 20) for 1 h and incubated in corresponding primary antibody for 1 h and HRP conjugated secondary antibody for 40 min. The proteins were detected using a Chemiluminescence Reagent Plus kit (PerkinElmer, Boston, MA).
Affinity purification.
M-270 Epoxy Dyanbeads were conjugated with affinity-purified polyclonal anti-GFP antibody using an optimized version of the protocol by the manufacturer as described previously (Cristea et al., 2005). Cell or tissue extracts were diluted with equal volumes of 2× pullout buffer and incubated with the antibody-coated Dynabeads for 2.5 h at 4°C (∼0.4 mg of anti-GFP conjugated Dynabeads per 1 mg of brain proteins). The 1× pullout buffer contained 20 mm HEPES, pH 7.4, 0.5 mm MgCl2, 0.5 mm CaCl2, protease inhibitor cocktail, 100 μg/ml PMSF, 2 μg/ml pepstatin, 0.1% Triton X-100, and 120 mm NaCl. Dynabeads were washed five times with 1× pullout buffer and eluted with 350 μl of elution buffer containing 0.5 mm EDTA and 0.5 m NH3·H2O by putting the tubes on a rotating wheel for 20 min at room temperature. The eluents were frozen in liquid nitrogen and dried in a Speedvac (Thermo Electron Corporation, Waltham, MA). The samples were dissolved in gel loading buffer and heated at 65°C for 10 min before running on SDS-PAGE. The gels were stained by colloidal Coomassie blue (Pierce).
Mass spectrometric analysis.
The entire gel lane was sliced into ∼30 2-mm-wide slices. Each gel piece was destained by a mixture of 50 mm ammonium bicarbonate and acetonitrile at 1:1 ratio at 4°C for 4 h with a buffer change at 2 h. The gel pieces were dehydrated with acetonitrile, reduced with 10 mm Tris(2-carboxyethyl)-phosphine hydrochloride in 100 mm ammonium bicarbonate for 30 min at 37°C, and the cysteine residues were alkylated with 50 mm iodoacetamide in 100 mm ammonium bicarbonate at room temperature in the dark for 1 h. The proteins in each gel piece were then subjected to trypsin digestion (50–100 ng) at 37°C for at least 3 h. The reactions were stopped by 7% formic acid and 0.1% TFA. The resulting peptides were extracted at 4°C overnight using Poros 50 reversed-phase beads (Applied Biosystems, Foster City, CA) packed on gel loading tips, washed with 0.1% TFA, and eluted with half-saturated 2,5-dihydroxybenzoic acid in H2O/MeOH/acetic acid (35:60:5 v/v/v) directly onto a compact disc matrix-assisted laser desorption/ionization (MALDI) sample probe (Krutchinsky et al., 2000). The tryptic mass spectra of the proteins from each gel piece were obtained using an in-house-constructed MALDI quadrupole–quadrupole time-of-flight mass spectrometer (Centaur prototype; Sciex, Concord, Ontario, Canada) (Krutchinsky et al., 2000). The same MALDI sample probe was then loaded into an in-house-constructed MALDI-ion trap mass spectrometer (LCQ DECA XP; Thermo Electron Corporation) (Krutchinsky et al., 2001) to collect tandem mass spectrometry (MS/MS) spectra. Both MS and MS/MS spectra were calibrated using standard peptides. Accurate masses of the tryptic peptides and the masses of their product ions were used to identify proteins in each gel piece using the computer search engine Xproteo (http://www.xproteo.com) to search the most up-to-date National Center for Biotechnology Information nonredundant protein database. Hypothesis-driven mass spectrometric approach (Kalkum et al., 2003) was used in some of the analysis.
Results
Accumulation of GFP–LC3 in axonal dystrophic swellings in Purkinje cells of Lurcher mice expressing GFP–LC3
Transgene GFP–LC3 under the control of constitutive CAG promoter produced nearly equivalent amounts of GFP–LC3 protein as the endogenous LC3 in the transgenic mouse brain (Mizushima et al., 2004). The direct fluorescence of GFP–LC3 was detected in CNS neurons of many brain regions, including cerebellar Purkinje cells (Fig. 1A) (supplemental Fig. 1A, available at www.jneurosci.org as supplemental material). To monitor autophagic activity under neurodegenerative conditions, we generated Lurcher mice producing GFP–LC3 by a genetic cross between the Lurcher and GFP–LC3 transgenic strains (termed GFP–LC3/Lurcher hereafter). At P10, a striking enhancement of overall green fluorescence, characterized by the presence of a large number of green “foci,” was observed in the area of DCN and Purkinje cell axon tracts of GFP–LC3/Lurcher mice compared with GFP–LC3 transgenic mice (Fig. 1A1,A2). When examined at a high magnification, these green fluorescent foci appear to be in the shape of “bulbs” or “torpedoes” either directly attached to or in close proximity to the somata of the deep cerebellum nuclei (Fig. 1A3,A4). Immunostaining using anti-calbindin antibody revealed that these foci are primarily calbindin positive, demonstrating that they are Purkinje cell axons (Fig. 1B). These swollen Purkinje cell axons were also labeled by an antibody raised against phosphorylated Tau (AT8) (Fig. 1C), indicating that they were indeed dystrophic and in the process of degeneration. Our results demonstrated that the Lurcher mutation triggered the accumulation of the autophagic marker GFP–LC3 in the axonal dystrophic swellings of degenerating Purkinje cells, features that were possibly associated with altered autophagic activity.
Figure 1.
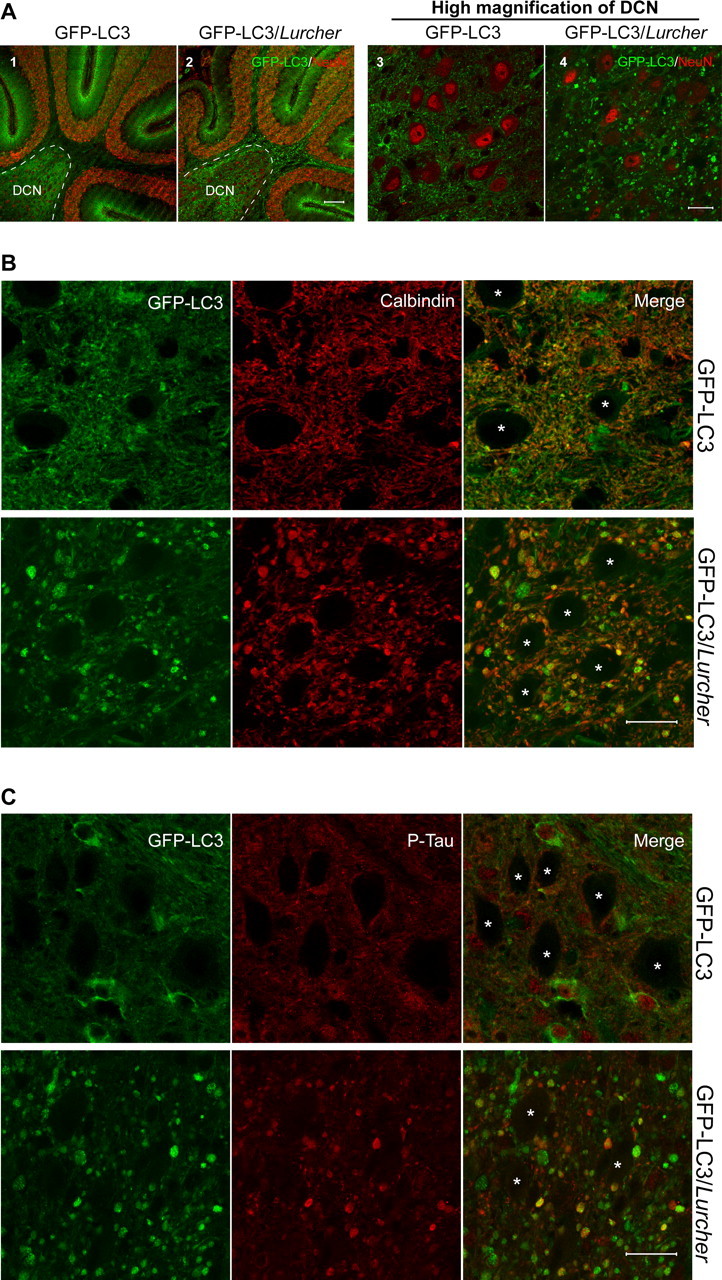
Accumulation of GFP–LC3 in the swollen axons of Purkinje cells in the DCN of GFP–LC3/Lurcher mice. A, Representative confocal images show the redistribution of GFP–LC3 to green foci in the DCN (enclosed area) of GFP–LC3/Lurcher mice (A2, A4). GFP–LC3 transgenic mice were used as control (A1, A3). Immunostaining with monoclonal anti-NeuN antibody (1:200) is shown in red. Scale bars: A1, A2, 100 μm; A3, A4, 20 μm. B, Overlapping of GFP–LC3 green fluorescence with red immunofluorescent staining of monoclonal anti-calbindin antibody (1:1000) in the DCN of GFP–LC3/Lurcher mice. Scale bar, 20 μm. C, Colocalization of GFP–LC3 (green) and phospho-Tau (red; stained with monoclonal anti-phospho-Tau antibody AT-8, 1:250) in the swollen Purkinje cell axons in the DCN of GFP–LC3/Lurcher mice. Scale bar, 20 μm. In both B and C, asterisks represent cerebellar nuclei.
Induced accumulation of autophagosomes in axonal dystrophic swellings of Lurcher Purkinje cells is associated with induction of autophagy
We performed several experiments to determine whether the accumulation of GFP–LC3 in the axonal dystrophic swellings of the degenerating Purkinje cells is linked to autophagy induction. First, high-magnification confocal images revealed numerous GFP–LC3 puncta within the axonal dystrophic swellings of GFP–LC3/Lurcher Purkinje cells (Fig. 2A). These GFP–LC3 puncta were 0.2–0.6 μm in diameter, within the range of typical autophagosomes (Mizushima et al., 2002). Next, by ultrastructural analysis using electron microscopy, we identified double-membrane structures characteristic of autophagosomes in the axonal dystrophic swellings (Fig. 2B, arrows). Many vacuoles display high electron density, representing the late degradative form or “autolysosome” (Fig. 2B, arrowheads). Clustered mitochondria (some of them are atrophic) (Fig. 2B, triangles) were found in close vicinity to these autophagosomes. In contrast, no axonal dystrophic swelling was observed in the control mice (Fig. 2B, inset). Third, to assay for the localization of GFP–LC3 at autophagosomes in the swollen axons, we performed immunoelectron microscopy experiments using anti-GFP antibody. The antibody-coated gold particles were found to preferentially label autophagosomes (Fig. 2C1 and enlarged images in C2–C5). Distribution of the gold particles in the axonal dystrophic swellings was quantified from 18 immuno-EM images. The density of gold particles associated with autophagosomes (total number, 309) was 2.8-fold of that in the remaining cytosol (total number, 163). These results demonstrated that GFP–LC3 was preferentially recruited to autophagosomes in the axonal dystrophic swellings. Fourth, to assay for autophagic degradation, we performed live imaging of the autophagosomes in the dystrophic axons using cerebellar slice culture in the presence of LysoTracker for labeling lysosomes or acidic vesicles. After a short incubation with LysoTracker, we observed red fluorescent “dots” in many of the axonal swellings containing the GFP–LC3 puncta. Moreover, colocalization of LysoTracker and GFP–LC3 in the same vacuole was observed (Fig. 2D, bottom). These data suggest that, in axonal dystrophic swellings of Lurcher Purkinje cells, some GFP–LC3-decorated autophagosomes had already taken up LysoTracker, further confirming the degradative nature of these autophagosomes. As a control, the normal axon terminals of wild-type Purkinje cells contain low levels of GFP–LC3 and are poorly labeled by LysoTracker. In addition, no GFP–LC3 puncta was observed (Fig 2D, top). To test whether known signaling events for autophagy induction are involved, we also examined the mammalian target of rapamycin (mTor) kinase activity (Ravikumar et al., 2004; Tanida et al., 2005) in Lurcher cerebellum. The result indicates that Lurcher caused a partial inactivation of the mTor kinase pathway, as shown by reduced phosphorylation of substrate S6 kinase and subsequently S6 ribosomal protein (supplemental Fig. 2, available at www.jneurosci.org as supplemental material), consistent with autophagy induction. Together, these results suggest the induction of autophagy in the Lurcher Purkinje cells, which involves the accumulation of autophagosomes in axonal dystrophic swellings.
Figure 2.

Induction of autophagy in the axonal dystrophic swellings of degenerating Purkinje cells in GFP–LC3/Lurcher mice. A, Representative confocal image shows GFP–LC3 puncta within the axonal dystrophic swellings of degenerating Purkinje cells (P12). Scale bar, 5 μm. B, Representative electron microscopic image shows an axonal dystrophic swelling of a degenerating Purkinje cell (P10). A number of autophagosomes (arrows), autolysosomes (arrowheads), and atrophic mitochondria (triangles) accumulated in this axonal dystrophic swelling. In addition, two synapses located on the axonal dystrophic swellings are labeled by red asterisks. Scale bar, 1 μm. The inset shows a representative image of wild-type mouse DCN. Two axons are labeled: 1, myelinated; 2, an axon terminal with two synapses (red asterisks). Scale bar, 0.15 μm. Notice that the size of the control axons is significantly smaller than that of the axonal dystrophic swellings. C, Representative immuno-EM image of an axonal dystrophic swelling (C1) of degenerating Purkinje cells (P10) and enlarged images of four autophagosomes/autolysosomes (C2–C5) selected from 18 immuno-EM images show that the gold particles coated with polyclonal anti-GFP antibody (1:5000) are primarily associated with autophagosomes. Scale bars: C1, 1 μm; C2–C5, 0.2 μm. D, Live imaging of GFP–LC3 fluorescence (green) and LysoTracker staining (red) of axonal dystrophic swellings of degenerating Purkinje cells in cultured cerebellar slice revealed partial colocalization of GFP–LC3 and LysoTracker (bottom row). Wild-type control (top row) shows low GFP–LC3 level and no labeling of LysoTracker. No GFP–LC3 puncta are observed. Scale bar, 5 μm.
Development of GFP–LC3-accumulated axonal dystrophic swellings is an early response of Purkinje cells to Lurcher-induced neurodegeneration
To understand the role of GFP–LC3-associated axonal dystrophy and autophagy in axonal or neuronal degeneration, we investigated the temporal relationship between the development of GFP–LC3-labeled axonal dystrophic swellings and Purkinje cell loss. As monitored by GFP fluorescence, the earliest detectable abnormality associated with Lurcher mutation was the Purkinje cell axonal dystrophic swellings labeled by GFP–LC3 in the DCN (distal to the Purkinje cell body) (Fig. 3A, bottom) and later along the axon tract in the white matter of the cerebellum (proximal to the Purkinje cell body) (Fig. 3A, top). These GFP-labeled axonal dystrophic swellings were detected as early as P7 in GFP–LC3/Lurcher cerebellum in the absence of detectable Purkinje cell death. The density of GFP–LC3-labeled axonal dystrophic swellings in DCN rapidly increased in the following 3 d and reached and remained maximal between P10 and P14 (Fig. 3A,B). Then it decreased markedly after P14 and was reduced to 20% of peak density by the fourth week in the DCN (Fig. 3B). However, the majority of Purkinje cells were still alive in Lurcher mice between P10 and P14 as determined by GFP fluorescence or anti-calbindin immunostaining (data not shown). These observations are consistent with a previous study of the pathology of Lurcher cerebellum, which revealed axonal swellings as an early sign of degenerating Purkinje cells (Dumesnil-Bousez and Sotelo, 1992). In addition, GFP–LC3 puncta were also observed in soma and dendrites of Lurcher Purkinje cells (supplemental Fig. 1B, available at www.jneurosci.org as supplemental material) but with much lower frequency than in axonal dystrophic swellings, suggesting that axon terminals are highly accessible to the autophagic response during Purkinje cell degeneration. Our studies suggest that development of the axonal dystrophic swellings accompanied with altered autophagic activity is an early stress response during neurodegeneration.
Figure 3.

Formation of GFP–LC3-labeled axonal dystrophic swellings as an early response in the degenerating Purkinje cells of Lurcher mice. A, Representative confocal images show the development of GFP–LC3-labeled axonal dystrophic swellings in axon tracts of cerebellar white matter (top row) and in the DCN (bottom row) of degenerating Purkinje cells of GFP–LC3/Lurcher mice at different postnatal days. Scale bar, 20 μm. B, Quantification of the images in A shows that the density of axonal dystrophic swellings in the DCN of the degenerating Purkinje cells of GFP–LC3/Lurcher mice (normalized to P14) was at peak level between P10 and P14. The numbers of images used for quantification at the ages of P7, P10, P14, P18, and P28 were 13, 14, 16, 7, and 5, respectively. Error bars indicate SEs.
GFP–LC3 binds to microtubule-associated protein MAP1B with high affinity in brain
To gain insight into autophagy regulation in the brain, in particular the regulation of LC3-associated autophagosomes, we identified and characterized LC3-binding proteins in GFP–LC3 transgenic mouse brain. Immunoaffinity purification with anti-GFP antibody yielded a strong Coomassie blue-stained band, which was identified by mass spectrometric analysis as MAP1B (Fig. 4A). This MAP1B protein band persisted with increasing wash stringency, whereas the other bands diminished (Fig. 4A, lanes 1–6). This result implicates MAP1B as the primary high-affinity interacting protein of LC3. We were also able to identify the E2-like protein Atg3 at both ∼35 kDa and ∼75 kDa (the latter likely a conjugated form of GFP–LC3 and Atg3) on SDS-PAGE (Fig. 4A, lane 7) (supplemental Fig. 3B, available at www.jneurosci.org as supplemental material) but only under very mild conditions and with relatively large amounts of brain extract. This binding of GFP–LC3 to Atg3 is consistent with conserved LC3 function as the yeast Atg8 homolog in the autophagic process (Ichimura et al., 2000). Other LC3 interacting proteins identified in brain included MAP1A and tubulins (Fig. 4A).
Figure 4.
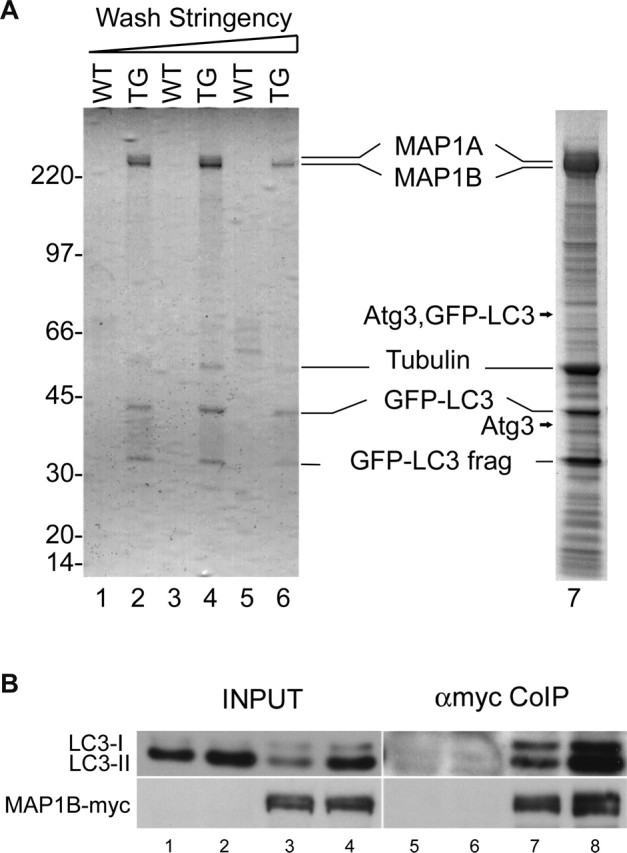
Identification of MAP1B as a primary LC3-binding protein in the transgenic mouse brains expressing GFP–LC3. A, Coomassie blue-stained SDS-PAGE shows proteins isolated from wild-type (WT) or GFP–LC3 transgenic (TG) mouse brain extracts (P30) by immunoaffinity purification and identified by mass spectrometric analysis. MAP1B is present in the isolates even under very stringent washing conditions. From lanes 1 to 6, the wash stringency was increased as follows: lanes 1 and 2, 200 mm NaCl and 0.15% Tween 20; lanes 3 and 4, 200 mm NaCl and 0.15% Triton X-100; lanes 5 and 6, 400 mm NaCl and 0.3% Triton X-100. Lane 7, A large-scale purification performed using GFP–LC3 transgenic mouse (P10) whole brain at low wash stringency (120 mm NaCl and 0.1% Triton X-100). For details of the immunoaffinity purification and mass spectrometry analysis, see Methods and Materials and supplemental Figure 3 (available at www.jneurosci.org as supplemental material). B, Coimmunoprecipitation (CoIP) experiment using HEK 293T cells transfected with MAP1B–myc (lanes 3, 4) or control FLAG–GluRδ2 (lanes 1, 2) plasmids shows specific interactions of MAP1B–myc with both LC3I and LC3II. In addition, MAP1B overexpression reduces the LC3II level. Transfected cells were either starved (lanes 2, 4) or cultured under normal medium condition (lanes 1, 3). Immunoprecipitation was performed using anti-myc antibody. Endogenous LC3I and LC3II were detected by Western blot using anti-LC3 antibody before (INPUT, lanes 1–4) and after coimmunoprecipitation (αmyc Co-IP, lanes 5–8). Control plasmid is shown in lanes 1, 2, 5, and 6; MAP1B–myc plasmid is shown in lanes 3, 4, 7 and 8.
MAP1B binds to both LC3I and LC3II
MAP1B is highly abundant in brain compared with other tissues (Gonzalez-Billault et al., 2004). Thus, its interaction with LC3 suggests brain-specific regulation of autophagy by MAP1B. To further test the interaction of MAP1B and LC3, we overexpressed MAP1B by transfecting HEK 293T cells with a plasmid expressing C-terminal myc-tagged full-length MAP1B (MAP1B–myc). Compared with HEK 293T cells either without transfection (data not shown) or transfected with control plasmids (Fig. 4B, lane 1), cells overexpressing MAP1B–myc appear to produce less LC3II and more LC3I (Fig. 4B, lane 3). The reduced LC3II level was validated in an assay showing the reduced number of LC3-associated autophagosomes (Fig. 5). Furthermore, nutrient starvation enhanced the level of LC3II in cells transfected with either MAP1B–myc (Fig. 4B, lane 4) or control plasmid (Fig. 4B, lane 2). The binding of endogenous LC3 to the exogenous MAP1B–myc was examined by immunoprecipitation using anti-myc antibody-conjugated Sepharose beads, followed by detection of LC3 using anti-LC3 antibody. Both LC3I and LC3II were immunoprecipitated by anti-myc antibody, indicating that MAP1B–myc was bound to both cytosolic LC3I and lipidated LC3II (Fig. 4B, lanes 7, 8). Similar experiments using MEF cells also showed binding of both LC3I and LC3II to MAP1B (data not shown).
Figure 5.
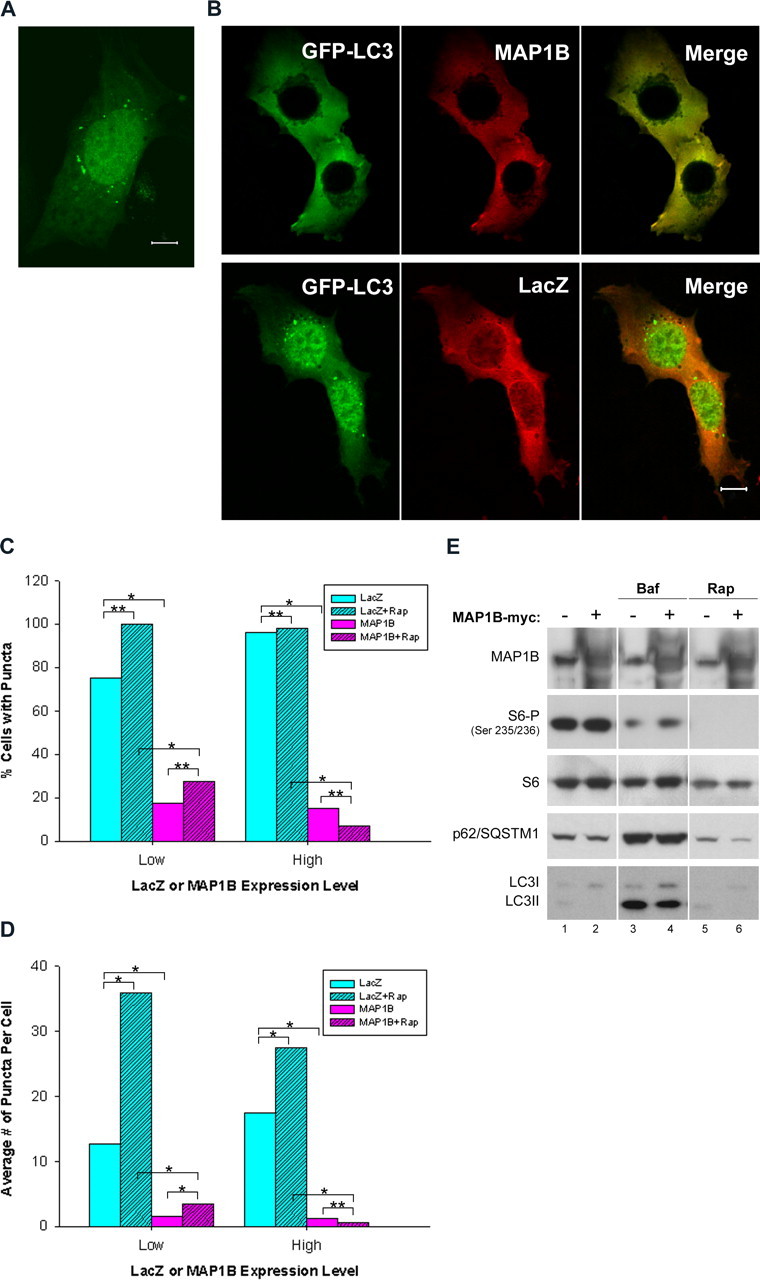
Overexpression of MAP1B–myc reduces the number of GFP–LC3 puncta but exerts little effect on overall autophagic activity. A, Representative confocal image of MEF cells transfected with GFP–LC3 only shows diffuse cytosolic and nuclear GFP–LC3 localizations as well as cytosolic GFP–LC3 puncta. Scale bar, 10 μm. B, Representative confocal images of MEF cells cotransfected with GFP–LC3 and MAP1B–myc show diffuse cytosolic colocalization of GFP–LC3 (green) and MAP1B-myc (red) (top row). Control cells cotransfected with GFP–LC3 and LacZ–myc show extensive nuclear GFP–LC3 localization and cytosolic GFP–LC3 puncta (bottom row). Cells were fixed and stained with anti-myc antibody (mouse, 1:1000). Scale bar, 10 μm. C, Quantification of fraction of MEF cells with GFP–LC3 puncta shows greatly reduced number of cells (∼20%) with GFP–LC3 puncta in the presence of MAP1B–myc compared with cells transfected with LacZ–myc. D, Quantification of the average number of GFP–LC3 puncta per cell in MEF cells shows greatly reduced average number of GFP–LC3 puncta per cell in the presence of MAP1B–myc (<5) compared with cells transfected with LacZ–myc (>10). For both C and D, transfected MEF cells were treated with rapamycin (Rap) at 200 nm for 18 h in some cases as indicated. A total of 83, 73, 183, and 218 cells were used for cells transfected with GFP–LC3 and LacZ–myc without and with rapamycin treatment and for cells transfected with GFP–LC3 and MAP1B–myc without and with rapamycin treatment, respectively. Cells with either low or high LacZ–myc or MAP1B–myc expression level were quantified separately as detailed in Materials and Methods. Only at low MAP1B–myc expression levels did rapamycin significantly increase the average number of GFP–LC3 puncta per cell, whereas the autophagy activation by rapamycin was not affected by LacZ–myc expression level. Comparisons with statistical significance (p < 0.05) are labeled by *, and insignificant comparisons (p ≥ 0.05) are labeled by **. E, Overexpression of MAP1B did not result in the abolishment of S6 ribosomal protein phosphorylation (assay for autophagy induction) or accumulation of p62/SQSTM1 (assay for inhibition of autophagic degradation). HEK 293T cells were transfected with MAP1B–myc (lanes 2, 4, 6) or control plasmid FLAG–GluRδ2 (lanes 1, 3, 5) for 48 h. Cells were cultured under normal condition (lanes 1, 2) or treated with bafilomycin A1 (200 nm; Baf, lanes 3, 4) or rapamycin (300 nm; Rap, lanes 5, 6) for 24 h. Cell lysates were prepared for immunoblot analysis using antibody against MAP1B, phospho-S6, total S6, p62/SQSTM1, or LC3. Each lane was loaded with 40 μg of proteins.
Overexpression of MAP1B reduces the number of GFP–LC3-labeled autophagosomes
We showed above that the presence of large amounts of MAP1B reduced the level of LC3II in transfected cells. To examine whether reduced LC3II attributable to overexpression of MAP1B is correlated with a change in localization of LC3, we cotransfected MEF cells with the expression plasmids for both MAP1B–myc and GFP–LC3. In control experiments, GFP–LC3 was found in both the nucleus and cytosol of MEF cells transfected with GFP–LC3 alone; some of these cells exhibited cytosolic fluorescent puncta of GFP–LC3, indicating autophagosome formation (Fig. 5A). A similar GFP–LC3 distribution was observed in MEF cells cotransfected with GFP–LC3 plasmid and the control plasmid LacZ–myc (Fig. 5B, bottom). However, in MEF cells cotransfected with MAP1B–myc and GFP–LC3, GFP–LC3 was excluded from the nucleus and MAP1B–myc colocalized with GFP–LC3 in the cytosol, mostly in a diffuse manner (Fig. 5B, top). These results confirm the MAP1B–LC3 interaction shown by the immunoaffinity purification experiments (Fig. 4). In a small number of cotransfected MEF cells, we observed GFP–LC3 puncta free of MAP1B–myc (data not shown). In addition, the primarily diffuse distribution of GFP–LC3 was observed even in the presence of rapamycin, a potent inducer of autophagy (data not shown). We quantified the effect of MAP1B–myc on GFP–LC3-labeled autophagosome formation in MEF cells. At all expression levels, MAP1B–myc, but not LacZ–myc, reduced both the fraction of the MEF cells containing GFP–LC3 puncta (Fig. 5C) and the average number of puncta per cell (Fig. 5D). Rapamycin significantly increased the average number of GFP–LC3 puncta per cell only when MAP1B–myc was expressed at low levels (Fig. 5D). Together, these results indicate that specific binding of overexpressed MAP1B to GFP–LC3 reduced the number of GFP–LC3-labeled autophagosomes.
Overexpression of MAP1B has little effect on autophagic activity as assayed by S6 phosphorylation and the level of p62/SQSTM1
The inhibitory role of MAP1B in GFP–LC3-associated autophagosomes raises the possibility that MAP1B affects the overall autophagic activity. We thus assayed for induction of autophagy as well as the efficiency of autophagic degradation in HEK 293T cells overexpressing MAP1B–myc. To examine autophagy induction, we monitored the level of phosphorylation of the S6 ribosomal protein (Ravikumar et al., 2004; Tanida et al., 2005). As expected, the autophagy inducer rapamycin abolished the S6 phosphorylation without changing the total level of S6 (Fig. 5E, lanes 1, 5). In contrast, cells transfected with MAP1B produced similar amounts of phosphorylated S6 and total S6 compared with cells transfected with control plasmids (Fig 5E, lanes 1, 2), demonstrating that overexpression of MAP1B exerts little effect on the inactivation of the mTor kinase pathway involved in autophagy induction.
A recent study showed that the LC3-binding protein p62/SQSTM1 and its associated cellular structures are degraded by autophagy. Inhibition of autophagy with bafilomycin A1 (autophagy inhibitor) results in accumulation of p62/SQSTM1 in HeLa cells (Bjorkoy et al., 2005). Our own studies revealed that the protein level of p62/SQSTM1 was markedly increased during impairment of autophagy, as shown in bafilomycin A1-treated HEK 293T cells (Fig. 5E, lanes 3, 4) and MEF cells (Fig. 6A), MEF cells with targeted deletion of Atg7 (Atg7−/−) (Komatsu et al., 2005) (Fig. 6B), MEFs cells with targeted deletion of Atg5 (Atg5−/−) (data not shown), and mouse brain deficient in autophagy (data not shown). These results suggest a general correlation between autophagy inhibition and increased levels of p62/SQSTM1, allowing us to use this protein to assay for autophagy deficiency. Cells transfected with MAP1B (Fig. 5E, lane 2) did not produce increased levels of p62/SQSTM1 over cells without overexpression of MAP1B (Fig. 5E, lane 1). In contrast, bafilomycin A1 treatment increased the levels of p62/SQSTM1 (Fig. 5E, lanes 3) and rapamycin decreased the levels of p62/SQSTM1 (Fig. 5E, lane 5). LC3II also accumulated during bafilomycin A1 treatment in transfected cells (Fig. 5E, lanes 3). Thus, as assayed by p62/SQSTM1, overexpression of MAP1B appears to exert little effect on the inhibition of autophagic activity.
Figure 6.

Endogenous phosphorylated MAP1B colocalizes with GFP–LC3-labeled autophagosomes in wild-type MEF cells and does not accumulate when autophagy is impaired. A, Endogenous levels of MAP1B(-P) are not significantly altered, in contrast to p62/SQSTM1 and LC3II, during treatments with bafilomycin A1 (100 nm; Baf, lane 2) or rapamycin (200 nm; Rap, lane 3) for 18 h in wild-type MEF cells, compared with untreated cells (Ctl, lane 1). Cell extract with ∼40 μg of proteins was loaded on each lane for immunoblot analysis with MAP1B, MAP1B-P, p62/SQSTM1, and LC3. B, Endogenous levels of MAP1B(-P) produced in Atg7+/− (lane 1) and Atg7−/− (lane 2) MEF cells are similar, in contrast to p62/SQSTM1 and LC3II, as assayed by immunoblot analysis. Actin was used as loading control. C, Western blot analysis of endogenous MAP1B or MAP1B-P in MEF cells either untransfected (lanes 1, 3) or transfected with GFP–LC3 plasmid (lanes 2, 4). The immunoblot reveals the low but detectable level of endogenous MAP1B or MAP1B-P in wild-type MEF cells (lane 1). MAP1B-P binds to GFP–LC3 as shown by immunoprecipitation using anti-GFP antibody, followed by detection of MAP1B-P (lane 4). CoIP, Coimmunoprecipitation. D, Representative confocal images of wild-type MEF cells transfected with GFP–LC3 and immunostained with anti-MAP1B antibody PP172 show colocalization of GFP–LC3 and endogenous MAP1B-P. Scale bar, 20 μm.
These results suggest that overexpression of MAP1B has little effect on autophagic activity as assessed by its effects on S6 phosphorylation during autophagy induction as well as autophagic degradation of p62/SQSTM1.
Endogenous phosphorylated MAP1B colocalizes with GFP–LC3-labeled autophagosomes in wild-type MEF cells and does not accumulate when autophagy is impaired
Recent studies suggest that MAP1B plays an important role in axonal growth and degeneration/regeneration through regulating microtubule dynamics during neural development and under pathological conditions (Gordon-Weeks and Fischer, 2000; Gonzalez-Billault et al., 2004). Phosphorylation of MAP1B was shown to be critical in the regulation of such functions. To investigate the possible relationship between MAP1B-P and LC3, we first tested whether LC3 interacted with MAP1B-P. We noticed that wild-type MEF cells expressed moderate levels of endogenous MAP1B as shown by immunoblot using anti-MAP1B antibody (Fig. 6C, lane 1). A low but detectable level of MAP1B-P was present as examined by anti-MAP1B-P antibodies SMI-31 (Gordon-Weeks and Fischer, 2000) and PP172 (Good et al., 2004) (Fig. 6C, lane 1). We then transfected wild-type MEF cells with GFP–LC3 plasmid and coimmunoprecipitated MAP1B using anti-GFP antibody. We showed that MAP1B-P, as detected by anti-MAP1B-P antibody (PP172), was pulled down together with GFP–LC3 protein (Fig. 6C, lane 4), indicating that LC3 bound to MAP1B-P. Furthermore, in wild-type MEF cells transfected with GFP–LC3 plasmid, we found that GFP–LC3 puncta partially colocalized with endogenous MAP1B-P as shown by immunofluorescent staining using either antibody PP172 (Fig. 6D) or SMI-31 (data not shown). This result suggested that MAP1B-P is associated with autophagosomes through its interaction with LC3.
Because autophagosomes are destined for lysosomal degradation, one possible consequence of a protein residing on autophagosomes is to be degraded through autophagy as shown previously for p62/SQSTM1 degradation (Bjorkoy et al., 2005). To test whether the MAP1B and/or MAP1B-P [MAP1B(-P)] levels increase when autophagy is impaired, we treated wild-type MEF cells with bafilomycin A1, an inhibitor of autophagy, and assayed for endogenous levels of MAP1B and MAP1B-P by immunoblot analysis. Consistent with inhibition of autophagy, bafilomycin A1 treatment of wild-type MEF cells markedly increased p62/SQSTM1 and LC3II levels, whereas endogenous MAP1B(-P) did not accumulate compared with the untreated cells (Fig. 6A, lanes 1, 2). Moreover, rapamycin treatment caused reduction in the p62/SQSTM1 level by autophagy induction (Fig. 6A, lanes 1, 3). In contrast, MAP1B(-P) levels did not significantly alter with rapamycin treatment (Fig. 6A, lanes 1, 3). Similar results were obtained for HEK 293T cells (data not shown). We also showed that Atg7−/− MEF cells, in which the essential autophagy gene Atg7 was deleted (Komatsu et al., 2005), did not change the level of MAP1B or MAP1B-P compared with Atg7+/− control, as indicated by immunoblot analysis using anti-MAP1B antibody and anti-MAP1B-P antibody (SMI-31) (Fig. 6B). As expected, Atg7−/− MEF cells expressed only LC3I and had markedly enhanced level of p62/SQSTM1 as a result of autophagy deficiency. Similarly, MAP1B(-P) proteins are produced at equal amounts in the brains of neonatal Atg5−/− mice and their littermates Atg5+/+ (supplemental Fig. 4, available at www.jneurosci.org as supplemental material). The results demonstrate that, unlike p62/SQSTM1, MAP1B(-P) are not accumulated during autophagy impairment, suggesting that MAP1B(-P) are not primarily degraded through autophagy.
Phosphorylated MAP1B accumulates in axonal dystrophic swellings, and the amount of MAP1B-P bound to LC3 increases in GFP–LC3/Lurcher cerebellum
The association of MAP1B-P and LC3 on autophagosomes as shown in the previous experiment prompted us to investigate the expression of MAP1B-P in axonal dystrophic swellings of Lurcher Purkinje cells. Immunofluorescent staining of cerebellar slices from GFP–LC3/Lurcher mice using anti-MAP1B-P antibody (PP172) showed that MAP1B-P accumulated and coexisted with GFP–LC3 in the axonal dystrophic swelling of degenerating Purkinje cells (Fig. 7A, bottom). In contrast, GFP–LC3 transgenic mouse cerebellar slices showed no definitive staining of MAP1B-P above background (Fig. 7A, top). We also examined the p62/SQSTM1 expression in axonal swellings of Lurcher Purkinje cells by immunostaining using anti-p62/SQSTM1 antibody. The result showed distinguished staining in soma of cerebellar nuclei but no detectable staining of p62/SQSTM1 in axonal swelling of Purkinje cells (supplemental Fig. 5, available at www.jneurosci.org as supplemental material). In contrast, p62/SQSTM1 was accumulated in axon terminals of Purkinje cells deficient in autophagy (data not shown). Considering the link between p62/SQSTM1 accumulation and autophagy deficiency, these results suggest that autophagy is not defective in Lurcher Purkinje cells and further imply that the accumulated MAP1B-P in axonal dystrophic swelling in Lurcher Purkinje cells is not attributable to a general failure of autophagy.
Figure 7.
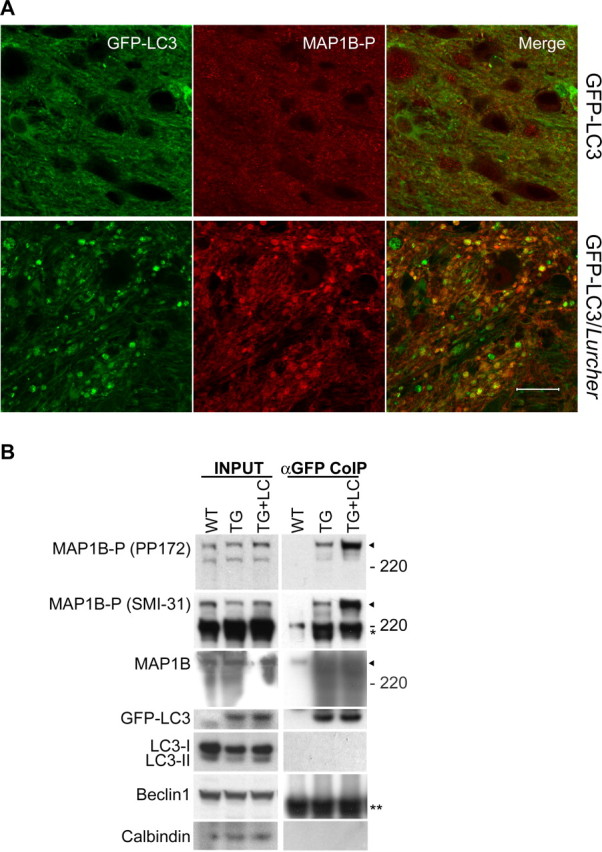
Increased amount of MAP1B-P bound to GFP–LC3 in axonal dystrophic swellings of GFP–LC3/Lurcher Purkinje cells. A, Representative confocal images of a cerebellar slice of GFP–LC3/Lurcher mouse (P10) immunostained with anti-MAP1B-P antibody (PP172) show partial colocalization of GFP–LC3 (in green) and MAP1B-P (in red) in the axonal dystrophic swellings of degenerating Purkinje cells. Scale bar, 20 μm. B, Western blot analysis of cerebellar tissue extracts (INPUT) from wild-type (WT), GFP–LC3 transgenic (TG), and GFP–LC3/Lurcher mice (TG+LC) and their anti-GFP immunoprecipitations (αGFP CoIP) shows increased binding of MAP1B-P, but not MAP1B, to GFP–LC3 in GFP–LC3/Lurcher cerebellum compared with GFP–LC3 transgenic cerebellum. Negative controls show the lack of endogenous LC3, beclin 1, or calbindin in the anti-GFP immunoprecipitations.
To investigate the effect of Lurcher mutation on the binding of GFP–LC3 to MAP1B-P in vivo, we used anti-GFP antibody to coimmunoprecipitate MAP1B-P from cerebellar homogenates of either GFP–LC3 transgenic or GFP–LC3/Lurcher mice. The total amount of MAP1B(-P) in the inputs used for coimmunoprecipitation was similar (Fig. 7B, INPUT), whereas more MAP1B-P was bound to GFP–LC3 in GFP–LC3/Lurcher mice than in GFP–LC3 transgenic mice (Fig. 7B, αGFP CoIP). The GFP–LC3–MAP1B-P binding appeared to be specific because calbindin, endogenous LC3, and another autophagy protein, beclin 1, were not associated with GFP–LC3 by the same immunopurification procedure. The absence of endogenous LC3 in the immunopurified samples also suggested that GFP–LC3 did not form hetero-oligomers with endogenous LC3. These results suggest that the excitotoxic insult elicited by Lurcher mutation promotes local accumulation of MAP1B-P and increased level of MAP1B-P bound to LC3 in the axonal dystrophic swellings of Lurcher Purkinje cells. Coincident with this, recent evidence shows that MAP1B-P is normally found accumulated at the distal ends of growing axons and the lesion sites of injured axons (Gordon-Weeks and Fischer, 2000; Gonzalez-Billault et al., 2004); we therefore speculate that the LC3–MAP1B-P interaction may provide a mechanism for targeting autophagosomes to axon terminals in response to degeneration signals.
Discussion
A common feature of axonal dystrophy across different CNS diseases is the accumulation of disorganized cellular organelles, including the formation of a large number of vacuoles of unknown origin (Yagishita, 1978). However, the mechanism underlying the aberrant structures in local axonal swellings is unclear. Here we use a transgenic mouse line producing GFP–LC3 to show, at a molecular level, that autophagy is induced in the dystrophic axons of Lurcher Purkinje cells (genetic model for excitotoxicity). The induction of autophagy involves the accumulation of autophagosomes in axonal dystrophic swellings of Lurcher Purkinje cells. We further show that accumulated autophagosomes, as monitored by GFP–LC3 puncta, is initially detected extensively in the dystrophic axons and later found with less frequency in Lurcher Purkinje cell soma and atrophic dendrites. We demonstrate that the onset of axonal dystrophic swellings, within which autophagosomes accumulate, is a Lurcher-induced early response before Purkinje cell degeneration. The early onset of dystrophic axons/neurites containing accumulated autophagosome-like structures has also been observed in human brains exhibiting neurological diseases (Sikorska et al., 2004; Nixon et al., 2005) and in animal models of human neurological diseases (Jeffrey et al., 1992; Li et al., 2001; Lin et al., 2003). Based on our present studies together with these previous observations, we suggest that, downstream of specific disease mechanisms, particularly in axons, there exists a common pathway that induces autophagy before neuronal death.
Although activated autophagy is usually associated with the increased number of autophagosomes, recent evidence has indicated other possibilities that may lead to the accumulation of autophagosomes in cells. For example, impaired maturation of autophagosomes involving fusion of autophagosomes with lysosomes or inhibition of lysosomal degradation could result in an increase in autophagosome number (Yamamoto et al., 1998; Ravikumar et al., 2005; Tanida et al., 2005). In Lurcher cerebellum, we observe reduced phosphorylation in the mTor kinase pathway, consistent with autophagy induction (Levine and Klionsky, 2004; Ravikumar et al., 2004). In addition, we show that some GFP–LC3 puncta colocalize with LysoTracker-labeled vesicles, suggesting that fusion of autophagosomes with lysosomes is at least not completely blocked in axonal swellings. Recently, p62/SQSTM1, which binds both ubiquitin and LC3, was shown to be selectively recruited to autophagosomes and degraded by autophagy (Bjorkoy et al., 2005). We show that pharmacological or genetic inhibition of autophagy causes a marked increase in p62/SQSTM1 levels in cell culture (Figs. 5E, 6A,B), as well as in Purkinje cell axons deficient in autophagy (data not shown), whereas there is no detectable p62/SQSTM1 immunostaining in Lurcher Purkinje cell axon terminals (supplemental Fig. 5, available at www.jneurosci.org as supplemental material). It is noteworthy that impaired axon transport is implicated in failed clearance of Huntingtin aggregates by autophagy in mouse CNS. However, direct evidence linking accumulation of autophagosomes to defective axon transport has not been demonstrated in vivo (Ravikumar et al., 2005). By staining Lurcher cerebellum with amyloid precursor protein (APP), which is usually accumulated in neurites attributable to impaired axon transport (Hirokawa and Takemura, 2005), we found no significant change in APP levels in Purkinje cell axons (data not shown). Together, the above evidence suggests that induction, rather than a complete block of some later stage of autophagy, in part accounts for the accumulation of autophagosomes in the dystrophic axonal swellings of Lurcher Purkinje cells. However, our results cannot completely exclude the possibility that other factors could contribute to the accumulation of autophagosomes in the observed dystrophic axonal swellings.
The regulation of autophagy in mammalian CNS has been a longstanding mystery. Although accumulation of autophagosomes has been observed in primary neuronal cultures (Xue et al., 1999), organotypic brain slice cultures (Borsello et al., 2003), and mammalian CNS under disease conditions (Jeffrey et al., 1992; Li et al., 2001; Yue et al., 2002), morphologic evidence for the presence of autophagosomes in mammalian CNS has yet to be shown under physiological conditions (at least with sizes comparable with those found in axonal swellings in Lurcher Purkinje cells). Coincidently, we did not detect GFP–LC3 puncta in CNS neurons from GFP–LC3 transgenic mice at the postnatal stage, although GFP–LC3 puncta were frequently found in neuronal cultures derived from this transgenic brain (data not shown) and in many other tissues such as liver and muscles (Mizushima et al., 2004), suggesting a specific regulation of autophagosomes in CNS. The observation provides additional evidence for upregulated autophagy in CNS neurons involving de novo synthesis and increase in size of autophagosomes under stresses such as degeneration signals.
To gain insight into the mechanism of the specific regulation of autophagy in CNS, we identified MAP1B as the primary high-affinity binding partner to LC3 from brain extracts and characterized their functional relationship in vivo and in vitro. In MEF cells, which constitutively produce very low amounts of MAP1B compared with neuronal cells, we observed GFP–LC3 localization at autophagosomes (as indicated by GFP–LC3 puncta); however, overexpression of MAP1B in these cells significantly reduced the number of GFP–LC3 puncta. This inhibition was MAP1B dosage dependent. Consistent with these observations, we found that overexpression of MAP1B also resulted in a reduction in the level of the autophagosome marker LC3II. However, overexpression of MAP1B did not cause detectable changes in the levels of phosphorylated S6 and p62/SQSTM1. Thus, despite the inhibitory role of MAP1B on LC3-associated autophagosomes, MAP1B overexpression seemingly paradoxically exerts little effect on these measures of autophagic activity. These results suggest that the existence of LC3-associated autophagosomes, under certain condition (likely at the basal level), can be dissociated from overall autophagic activity. For example, the absence of detectable GFP–LC3 puncta in CNS neurons does not directly correlate with the lack of autophagic activity under normal condition: autophagy is apparently required for normal brain function because autophagy deficiency results in degeneration of Purkinje cells (M. Komatsu, Q. J. Wang, G. R. Holstein, J. Iwata, E. Kominami, B. T. Chait, K. Tanaka, and Z. Yue, unpublished observation), although GFP–LC3 puncta are not observed. Alternatively, inhibition of LC3-associated autophagosomes may trigger compensatory pathways for lysosomal degradation. Nonetheless, because MAP1B (and MAP1A in adult) is highly abundant in brain compared with other tissues, the observed inhibitory role of MAP1B on LC3-associated autophagosomes may explain the relatively low endogenous level of LC3II and the virtual absence of GFP–LC3 puncta in CNS of GFP–LC3 transgenic mice under physiological conditions.
Extensive evidence has shown that MAP1B phosphorylation is a developmentally regulated and phosphorylated MAP1B is produced at high levels in differentiating neurons as well as in areas of the adult CNS exhibiting neuronal plasticity or regeneration after injury (Gordon-Weeks and Fischer, 2000; Gonzalez-Billault et al., 2004). MAP1B-P was also shown to be spatially restricted to growing axons or the distal ends of growth cones (Trivedi et al., 2005). Recent studies also indicate that MAP1B-P exerts a major influence on microtubule stability by maintaining microtubules in a dynamic state (Trivedi et al., 2005). We show that MAP1B-P is accumulated in axonal dystrophic swellings of Lurcher Purkinje cells in DCN, a spatiotemporal coincidence with the existence of large number of autophagosomes. Moreover, the amount of MAP1B-P bound to LC3 is significantly enhanced in Lurcher cerebellum compared with wild type. These results directly link increased level of MAP1B-P to accumulation of autophagosomes in axonal dystrophic swellings. In addition, our results suggest that impaired autophagy does not cause accumulation of MAP1B or MAP1B-P. Thus, based on the evidence that autophagy function is dependent on microtubules (Kovacs et al., 1982; Aplin et al., 1992; Kochl et al., 2006) and that as microtubule-associated protein MAP1B-P normally localizes at distal ends of axon terminals (Trivedi et al., 2005), we hypothesize that the increased amount of MAP1B-P interacting with LC3 may reflect an active role of MAP1B-P in recruiting and targeting LC3-assoicated autophagosomes to axon terminals rather than a being consequence of impaired autophagosome-lysosome fusion and lysosomal degradation.
Finally, our studies indicate a different behavior of MAP1B-P from MAP1B in that MAP1B-P is associated with autophagosomes, likely through binding to LC3. Although one can imagine that phosphorylation of MAP1B causes modification of MAP1B structure favoring association with LC3 autophagosomes, the biochemical basis for this structural modification, as well as the signal that induces the formation of autophagosomes in axonal dystrophy and degeneration, remain to be determined.
In summary, our results present molecular evidence of induction of autophagy (which involves the accumulation of autophagosomes in axon terminals) during excitotoxic neurodegeneration. The early accumulation of autophagosomes observed in Lurcher Purkinje cells axon terminals suggests that axon terminals are highly accessible for autophagic response to various stress or degeneration signals. This notion was supported by our recent study showing the selective vulnerability of axon terminals to abrogation of autophagy in Purkinje cells (Komatsu, Wang, Holstein, Iwata, Kominami, Chait, Tonaka, and Yue, unpublished observation). However, several important questions are yet to be answered. For example, it is still unclear where the autophagosomes accumulated in dystrophic axons are originated. The autophagosomes can be either locally generated in axons or produced in cell bodies and transported to axon terminals. What is the biological significance of the accumulation of autophagosomes in degenerating axon terminals? A hypothesis consistent with the conserved autophagy function is that induction of autophagy involving accumulation of autophagosomes serves as an adaptive response to remodel the local axon structures for regeneration (Matthews and Raisman, 1972).
Footnotes
This work was supported by National Institutes of Health Grants RNS055683A (Z.Y.), RR00862 (B.T.C.), CA89810 and RR022220 (B.T.C., M.P.R.), and GM062427 (M.P.R.) and by the Howard Hughes Medical Institute (N.H.). We thank X. Li, W. Lee, and K. Yao for help with cell culture, R. Williams for help with making GFP antibody, and A. North, H. Shio, and D. Elreda in the Bio-Imaging Resource Center for help with microscopy. We thank Drs. K. Tanaka and M. Komatsu for the Atg7−/− MEF cells.
References
- Aplin A, Jasionowski T, Tuttle DL, Lenk SE, Dunn WA Jr (1992). Cytoskeletal elements are required for the formation and maturation of autophagic vacuoles. J Cell Physiol 152:458–466. [DOI] [PubMed] [Google Scholar]
- Bjorkoy G, Lamark T, Brech A, Outzen H, Perander M, Overvatn A, Stenmark H, Johansen T (2005). p62/SQSTM1 forms protein aggregates degraded by autophagy and has a protective effect on huntingtin-induced cell death. J Cell Biol 171:603–614. [DOI] [PMC free article] [PubMed] [Google Scholar]
- Borsello T, Croquelois K, Hornung JP, Clarke PG (2003). N-methyl-d-aspartate-triggered neuronal death in organotypic hippocampal cultures is endocytic, autophagic and mediated by the c-Jun N-terminal kinase pathway. Eur J Neurosci 18:473–485. [DOI] [PubMed] [Google Scholar]
- Brendza RP, O'Brien C, Simmons K, McKeel DW, Bales KR, Paul SM, Olney JW, Sanes JR, Holtzman DM (2003). PDAPP; YFP double transgenic mice: a tool to study amyloid-beta associated changes in axonal, dendritic, and synaptic structures. J Comp Neurol 456:375–383. [DOI] [PubMed] [Google Scholar]
- Cristea IM, Williams R, Chait BT, Rout MP (2005). Fluorescent proteins as proteomic probes. Mol Cell Proteomics 4:1933–1941. [DOI] [PubMed] [Google Scholar]
- Dumesnil-Bousez N, Sotelo C (1992). Early development of the Lurcher cerebellum: Purkinje cell alterations and impairment of synaptogenesis. J Neurocytol 21:506–529. [DOI] [PubMed] [Google Scholar]
- Fischer I, Romano-Clarke G (1990). Changes in microtubule-associated protein MAP1B phosphorylation during rat brain development. J Neurochem 55:328–333. [DOI] [PubMed] [Google Scholar]
- Galvin JE, Lee VM, Trojanowski JQ (2001). Synucleinopathies: clinical and pathological implications. Arch Neurol 58:186–190. [DOI] [PubMed] [Google Scholar]
- Gonzalez-Billault C, Jimenez-Mateos EM, Caceres A, Diaz-Nido J, Wandosell F, Avila J (2004). Microtubule-associated protein 1B function during normal development, regeneration, and pathological conditions in the nervous system. J Neurobiol 58:48–59. [DOI] [PubMed] [Google Scholar]
- Good PF, Alapat D, Hsu A, Chu C, Perl D, Wen X, Burstein DE, Kohtz DS (2004). A role for semaphorin 3A signaling in the degeneration of hippocampal neurons during Alzheimer's disease. J Neurochem 91:716–736. [DOI] [PubMed] [Google Scholar]
- Gordon-Weeks PR, Fischer I (2000). MAP1B expression and microtubule stability in growing and regenerating axons. Microsc Res Tech 48:63–74. [DOI] [PubMed] [Google Scholar]
- Hirokawa N, Takemura R (2005). Molecular motors and mechanisms of directional transport in neurons. Nat Rev Neurosci 6:201–214. [DOI] [PubMed] [Google Scholar]
- Ichimura Y, Kirisako T, Takao T, Satomi Y, Shimonishi Y, Ishihara N, Mizushima N, Tanida I, Kominami E, Ohsumi M, Noda T, Ohsumi Y (2000). A ubiquitin-like system mediates protein lipidation. Nature 408:488–492. [DOI] [PubMed] [Google Scholar]
- Jeffrey M, Scott JR, Williams A, Fraser H (1992). Ultrastructural features of spongiform encephalopathy transmitted to mice from three species of bovidae. Acta Neuropathol (Berl) 84:559–569. [DOI] [PubMed] [Google Scholar]
- Kabeya Y, Mizushima N, Ueno T, Yamamoto A, Kirisako T, Noda T, Kominami E, Ohsumi Y, Yoshimori T (2000). LC3, a mammalian homologue of yeast Apg8p, is localized in autophagosome membranes after processing. EMBO J 19:5720–5728. [DOI] [PMC free article] [PubMed] [Google Scholar]
- Kalkum M, Lyon GJ, Chait BT (2003). Detection of secreted peptides by using hypothesis-driven multistage mass spectrometry. Proc Natl Acad Sci USA 100:2795–2800. [DOI] [PMC free article] [PubMed] [Google Scholar]
- Kochl R, Hu XW, Chan EY, Tooze SA (2006). Microtubules facilitate autophagosome formation and fusion of autophagosomes with endosomes. Traffic 7:129–145. [DOI] [PubMed] [Google Scholar]
- Komatsu M, Waguri S, Ueno T, Iwata J, Murata S, Tanida I, Ezaki J, Mizushima N, Ohsumi Y, Uchiyama Y, Kominami E, Tanaka K, Chiba T (2005). Impairment of starvation-induced and constitutive autophagy in Atg7-deficient mice. J Cell Biol 169:425–434. [DOI] [PMC free article] [PubMed] [Google Scholar]
- Kovacs AL, Reith A, Seglen PO (1982). Accumulation of autophagosomes after inhibition of hepatocytic protein degradation by vinblastine, leupeptin or a lysosomotropic amine. Exp Cell Res 137:191–201. [DOI] [PubMed] [Google Scholar]
- Krutchinsky AN, Zhang W, Chait BT (2000). Rapidly switchable matrix-assisted laser desorption/ionization and electrospray quadrupole-time-of-flight mass spectrometry for protein identification. J Am Soc Mass Spectrom 11:493–504. [DOI] [PubMed] [Google Scholar]
- Krutchinsky AN, Kalkum M, Chait BT (2001). Automatic identification of proteins with a MALDI-quadrupole ion trap mass spectrometer. Anal Chem 73:5066–5077. [DOI] [PubMed] [Google Scholar]
- Levine B, Klionsky DJ (2004). Development by self-digestion: molecular mechanisms and biological functions of autophagy. Dev Cell 6:463–477. [DOI] [PubMed] [Google Scholar]
- Li H, Li SH, Yu ZX, Shelbourne P, Li XJ (2001). Huntingtin aggregate-associated axonal degeneration is an early pathological event in Huntington's disease mice. J Neurosci 21:8473–8481. [DOI] [PMC free article] [PubMed] [Google Scholar]
- Lin WL, Lewis J, Yen SH, Hutton M, Dickson DW (2003). Ultrastructural neuronal pathology in transgenic mice expressing mutant (P301L) human tau. J Neurocytol 32:1091–1105. [DOI] [PubMed] [Google Scholar]
- Ma D, Chow S, Obrocka M, Connors T, Fischer I (1999). Induction of microtubule-associated protein 1B expression in Schwann cells during nerve regeneration. Brain Res 823:141–153. [DOI] [PubMed] [Google Scholar]
- Matthews MR, Raisman G (1972). A light and electron microscopic study of the cellular response Purkinje cell to axonal injury in the superior cervical ganglion of the rat. Proc R Soc Lond B Biol Sci 181: pp. 43–79. [DOI] [PubMed] [Google Scholar]
- Mizushima N, Ohsumi Y, Yoshimori T (2002). Autophagosome formation in mammalian cells. Cell Struct Funct 27:421–429. [DOI] [PubMed] [Google Scholar]
- Mizushima N, Yamamoto A, Matsui M, Yoshimori T, Ohsumi Y (2004). In vivo analysis of autophagy in response to nutrient starvation using transgenic mice expressing a fluorescent autophagosome marker. Mol Biol Cell 15:1101–1111. [DOI] [PMC free article] [PubMed] [Google Scholar]
- Nixon RA, Wegiel J, Kumar A, Yu WH, Peterhoff C, Cataldo A, Cuervo AM (2005). Extensive involvement of autophagy in Alzheimer disease: an immuno-electron microscopy study. J Neuropathol Exp Neurol 64:113–122. [DOI] [PubMed] [Google Scholar]
- Ohara S, Ukita Y, Ninomiya H, Ohno K (2004). Axonal dystrophy of dorsal root ganglion sensory neurons in a mouse model of Niemann-Pick disease type C. Exp Neurol 187:289–298. [DOI] [PubMed] [Google Scholar]
- Ramon y Cajal S (1928). May RM, trans. Degeneration and regeneration of the nervous system. In: Facsimile New York: Hafner.
- Ravikumar B, Vacher C, Berger Z, Davies JE, Luo S, Oroz LG, Scaravilli F, Easton DF, Duden R, O'Kane CJ, Rubinsztein DC (2004). Inhibition of mTOR induces autophagy and reduces toxicity of polyglutamine expansions in fly and mouse models of Huntington disease. Nat Genet 36:585–595. [DOI] [PubMed] [Google Scholar]
- Ravikumar B, Acevedo-Arozena A, Imarisio S, Berger Z, Vacher C, O'Kane CJ, Brown SD, Rubinsztein DC (2005). Dynein mutations impair autophagic clearance of aggregate-prone proteins. Nat Genet 37:771–776. [DOI] [PubMed] [Google Scholar]
- Sikorska B, Liberski PP, Giraud P, Kopp N, Brown P (2004). Autophagy is a part of ultrastructural synaptic pathology in Creutzfeldt-Jakob disease: a brain biopsy study. Int J Biochem Cell Biol 36:2563–2573. [DOI] [PubMed] [Google Scholar]
- Tanida I, Minematsu N, Ueno T, Kominami E (2005). Lysosomal turn over, but not a cellular level, of endogenous LC3 is a marker for autophagy. Autophagy 1:84–91. [DOI] [PubMed] [Google Scholar]
- Togel M, Wiche G, Propst F (1998). Evidence against structural and functional identity of microtubule-associated protein 1B and proteoglycan claustrin. FEBS Lett 423:254–258. [DOI] [PubMed] [Google Scholar]
- Trapp BD, Peterson J, Ransohoff RM, Rudick R, Mork S, Bo L (1998). Axonal transection in the lesions of multiple sclerosis. N Engl J Med 338:278–285. [DOI] [PubMed] [Google Scholar]
- Trivedi N, Marsh P, Goold RG, Wood-Kaczmar A, Gordon-Weeks PR (2005). Glycogen synthase kinase-3beta phosphorylation of MAP1B at Ser1260 and Thr1265 is spatially restricted to growing axons. J Cell Sci 118:993–1005. [DOI] [PubMed] [Google Scholar]
- Tu PH, Raju P, Robinson KA, Gurney ME, Trojanowski JQ, Lee VM (1996). Transgenic mice carrying a human mutant superoxide dismutase transgene develop neuronal cytoskeletal pathology resembling human amyotrophic lateral sclerosis lesions. Proc Natl Acad Sci USA 93:3155–3160. [DOI] [PMC free article] [PubMed] [Google Scholar]
- Xue L, Fletcher GC, Tolkovsky AM (1999). Autophagy is activated by apoptotic signalling in sympathetic neurons: an alternative mechanism of death execution. Mol Cell Neurosci 14:180–198. [DOI] [PubMed] [Google Scholar]
- Yagishita S (1978). Morphological investigations on axonal swellings and spheroids in various human diseases. Virchows Arch A Pathol Anat Histol 378:181–197. [DOI] [PubMed] [Google Scholar]
- Yamamoto A, Tagawa Y, Yoshimori T, Moriyama Y, Masaki R, Tashiro Y (1998). Bafilomycin A1 prevents maturation of autophagic vacuoles by inhibiting fusion between autophagosomes and lysosomes in rat hepatoma cell line, H-4-II-E cells. Cell Struct Funct 23:33–42. [DOI] [PubMed] [Google Scholar]
- Yue Z, Horton A, Bravin M, DeJager PL, Selimi F, Heintz N (2002). A novel protein complex linking the delta 2 glutamate receptor and autophagy: implications for neurodegeneration in lurcher mice. Neuron 35:921–933. [DOI] [PubMed] [Google Scholar]