Abstract
Molecular layer inhibitory interneurons generate on-beam and off-beam inhibition in the cerebellar cortex that is hypothesized to control the timing and/or spatial patterning of Purkinje cell discharge. On- and off-beam inhibition has been assumed to be spatially uniform and continuous within a folium. Using flavoprotein autofluorescence optical imaging in the mouse cerebellar cortex in vivo, this study demonstrates that the inhibition evoked by parallel fiber and peripheral stimulation results in parasagittal bands of decreases in fluorescence that correspond to zebrin II-positive bands. The parasagittal bands of decreased fluorescence are abolished by GABAA antagonists and reflect the activity of molecular layer interneurons on their targets. The same banding pattern was observed using Ca2+ imaging. The bands produce spatially specific decreases in the responses to peripheral input. Therefore, molecular layer inhibition is compartmentalized into zebrin II parasagittal domains that differentially modulate the spatial pattern of cerebellar cortical activity.
Keywords: cerebellum, autofluorescence, Ca2+ imaging, interneurons, inhibition, flavoprotein
Introduction
The extent and complexity of molecular layer interneurons (MLIs) within the cerebellar cortex suggest that these neurons play an important role in cerebellar information processing. The MLIs include basket and stellate cells (Eccles et al., 1967), receiving parallel fiber (PF) input and exerting GABAergic inhibition on Purkinje cells (PCs) (Andersen et al., 1964; Eccles et al., 1966a,b; Hausser and Clark, 1997). Based on the length of their axonal projections, the MLIs are generally grouped into two categories: (1) neurons, including superficial stellate cells, with short axons branching near the cell body that generate on-beam inhibition, and (2) neurons, including basket cells and deeper stellate cells, with long axons extending perpendicularly to the PFs that generate off-beam inhibition (Scheibel and Scheibel, 1954; Mugnaini, 1972).
The cerebellum has been argued to be a “neuronal machine” with stereotypical neuronal elements and circuitry that processes afferent input similarly throughout the structure and provides for a common computational algorithm (Eccles et al., 1967; Braitenberg, 2002). With the exception of the flocculus and select cell types such as the unipolar brush cells (Mugnaini et al., 1997), the neuronal distribution in the cerebellar cortex is relatively uniform (Braitenberg, 2002). Accordingly, the on- and off-beam inhibition generated by stellate and basket cells along a beam of PFs has also been assumed to be uniform and continuous (Eccles et al., 1967; Palay and Chan-Palay, 1974).
Although the distribution of cell types and the cortical circuitry are stereotypical, the cerebellum is highly compartmentalized in both its connections and molecular distributions. The climbing fiber projection to PCs from the inferior olive and the PC projection to the cerebellar nuclei are organized in parasagittal zones (Brodal and Kawamura, 1980; Voogd and Bigare, 1980). Mossy fiber projections into the granular layer also terminate in parasagittal aggregations (Yaginuma and Matsushita, 1989; Ji and Hawkes, 1994). At the molecular level, a parasagittal zonation is evident in the distributions of various markers, including zebrin II (Hawkes et al., 1992; Herrup and Kuemerle, 1997). Glutamic acid decarboxylase (GAD), the rate limiting enzyme in the synthesis of GABA, exhibits a parasagittal zonation in PCs (Chan-Palay et al., 1981). However, the distribution of GAD in MLIs was not described. Whereas molecular layer GABAB receptors exhibit some compartmentalization in the posterior vermis of the rat (Turgeon and Albin, 1993), GABAA receptors on PCs and MLIs appear to be distributed uniformly (Edgar and Schwartz, 1990; Laurie et al., 1992), and there is no physiological evidence that molecular layer inhibition is nonuniform.
Using flavoprotein autofluorescence and Ca2+ imaging in vivo (Reinert et al., 2004; Sullivan et al., 2005), the present study shows that PF stimulation not only results in on-beam increases in fluorescence but also off-beam decreases in fluorescence organized into parasagittal bands in register with zebrin II-positive zones. Peripheral stimulation also evokes bands of decreased fluorescence in register with the bands evoked by surface stimulation. The parasagittal compartmentalization of molecular layer inhibitory activity extends its role from controlling timing to controlling the spatial flow of information.
Materials and Methods
Animal preparation.
All animal experimentation was approved by and conducted in conformity with the Institutional Animal Care and Use Committee of the University of Minnesota. Experimental details on the animal preparation and optical imaging techniques are only briefly described because these have been provided in previous publications (Reinert et al., 2004). Adult male FVB mice (Charles River Laboratories, Wilmington, MA) ages 3–10 months were anesthetized by either intraperitoneal injection of 2 mg/g urethane or induction with intramuscular acepromazine (2 mg/g), followed by 1.5 mg/g urethane. Animals were mechanically ventilated and paralyzed with gallamine triethiodide (0.05 ml, 20 mg/ml, i.m.) and placed in a stereotaxic frame, and body temperature was feedback regulated. The electrocardiogram was monitored to assess the depth of anesthesia. After exposing Crus I and II, a watertight chamber of acrylic was built up around the exposed folia and filled with Ringer’s solution gassed with 95% O2 and 5% CO2.
Drug administration.
All drugs were purchased from Sigma (St. Louis, MO), including glutamate (l-glutamic acid), muscimol (5-aminomethyl-3-hydroxyisoxazole), bicuculline [1(s), 9(R)-(−)-bicuculline methochloride], and diphenyleneiodonium chloride (DPI). Both bicuculline and DPI in normal Ringer’s solution were applied to the cerebellar surface by replacing the solution in the chamber. Microinjection of 0.1 μl of muscimol, glutamate, Ca2+ dye, or normal Ringer’s solution over 2.5 s into the upper molecular layer was performed with a glass electrode using a pico-injection system (PLI-100; Medical Systems, Greenville, NY).
Surface and peripheral stimulation and electrophysiological monitoring techniques.
A paralyene-coated tungsten microelectrode (2–5 MΩ) placed just below the cerebellar surface was used to activate PFs. Typical parameters for surface stimulation were a train of 50–200 μA, 100 μs pulses at 10 Hz for 10 s. A range of surface stimulation parameters were also tested. To evoke peripheral responses, bipolar stimulation of the ipsilateral 3C vibrissal pad was performed with two electrodes placed ∼1 mm apart and stimulated using 20 V, 300 μs pulses at 10 Hz for 10 s (Hanson et al., 2000). The stimulation strength was adjusted to just evoke a small twitch.
Extracellular field potentials or single-neuron firing was recorded with glass microelectrodes (2 m NaCl, 2–10 MΩ) using conventional electrophysiological techniques. Single-unit recordings were restricted to the molecular and PC layers. The recording electrode was introduced caudally and followed the orientation of the parasagittal bands to ensure that the position of the recording electrode remained on-band or off-band. The presence of spontaneous complex spikes and simple spikes was used to identify PCs. All other cells were classified as unidentified cerebellar neurons. The field potentials and single-unit recording data were digitized (25 kHz) on-line and stored for additional off-line analysis, including discrimination and construction of peristimulus histograms of the spike discharge in 1 ms bins (Spike 2; Cambridge Electronics Design, Cambridge, UK). The duration and amplitude of the decreases in the firing discharge were obtained from the histograms. To determine the onset and end of the change in firing to surface stimulation, the mean and SD of the 20 ms baseline firing was first computed. The onset of a decrease in firing was defined as the first bin in which the firing was less than the mean minus 2 SDs, and the end was defined when the firing exceeded this level. The average decrease during that period was defined as the reduction in firing. Both the location of the recordings and the amplitude of the responses (increases and decreases to surface stimulation) were compared with the optical signals.
Optical imaging.
The animal in the stereotaxic frame was placed on an x–y stage mounted on a modified Nikon (Tokyo, Japan) epifluorescence microscope fitted with a 4× objective. Images of Crus II were acquired with a Quantix cooled charge coupled device camera with 12 bit digitization (Roper Scientific, Tucson, AZ). A 100 W mercury–xenon lamp (Hamamatsu Photonics, Shizouka, Japan) with a direct current (DC)-controlled power supply (Opti Quip, Highland Mills, NY) was used as the light source. Images were binned 2 × 2 to yield images of 256 × 256 pixels with a resolution of ∼10 × 10 μm per pixel. Imaging flavoprotein autofluorescence used a bandpass excitation filter (455 ± 35 nm), an extended reflectance dichroic mirror (500 nm), and a >515 nm long-pass emission filter (Reinert et al., 2004).
To test whether the response pattern evoked by surface stimulation was coupled directly to neuronal activity, Ca2+ imaging was undertaken after autofluorescence imaging for a group of animals. This required removal of the surface electrode and making multiple microinjections of a Ca2+ dye indicator to stain Crus II. The solution consisted of 10 mm Oregon Green 488 BAPTA-1/AM (Invitrogen, Carlsbad, CA) dissolved in DMSO plus 20% Pluronic F-127 solution (Invitrogen) and diluted 20 times in normal Ringer’s solution (Stosiek et al., 2003; Sullivan et al., 2005). A glass micropipette with resistance of 1–5 MΩ was filled with the dye and inserted into the cerebellar cortex to a depth of ∼300–400 μm. The dye was injected over 2 s with 100 kPa. The pipette was then moved to another location on the folium, and the dye solution was injected. This was repeated at a density of ∼0.05 mm2/injection until the exposed portion of Crus II was stained (∼30 microinjections). After 30 min, the stimulation electrode was reinstalled and the response to surface stimulation was imaged using a custom Ca2+ filter set with excitation at 490–510 nm, a long-pass dichroic mirror of 515 nm, and emission at 520–530 nm. This filter set excluded almost the entire autofluorescence signal.
Each trial consisted of a series of 10 control frames followed by a series of 100 experimental frames, with an exposure time of 200 ms for each frame. Surface stimulation was initiated at the onset of the experimental frames. A typical surface stimulation acquisition protocol included four consecutive trials obtained at 1 min intervals. The responses to peripheral stimulation, especially the bands of decreased fluorescence, were smaller than those evoked by surface stimulation and required additional averaging to detect (10–15 trials).
Immunohistochemistry.
A series of animals were used to determine the relationship between the bands of decreased fluorescence and the parasagittal zonation revealed by anti-zebrin II immunostaining. As outlined above, optical imaging in Crus II was used to determine the on- and off-beam responses to PF stimulation. Next, lesions were generated in the molecular layer to serve as fiducial markers by passing a DC (250 μA for 1 s) using a stimulating electrode. The lesions were placed either between bands or on the bands. After transcardiac perfusion and coronal sectioning (40 μm), immunostaining of zebrin II was performed (Eisenman and Hawkes, 1993). Cerebellar sections were incubated overnight with anti-zebrin II (1:200) and then with peroxidase-conjugated rabbit/anti-mouse IgG at room temperature for 1 h (DakoCytomation, Glostrup, Denmark). Immunoactivity was revealed by using DAB as the peroxidase substrate. The sections with the lesions were recovered, and the zebrin II staining was compared with the banding pattern evoked by surface stimulation.
Data analysis.
The first step in the analyses of the optical signals was to generate a series of difference images by subtracting the average of nine control frames, referred to as the control average, from each control and experimental frame. These difference images were then divided by the control average, resulting in images in which the intensity value of each pixel reflects the ΔF/F change in fluorescence intensity relative to the average of the control frames. To quantify the amplitude and time course of the on-beam response, a region of interest (ROI) was defined that covered the beam (typically 5–10 pixels wide and extending much of the length of the folium). The average ΔF/F in the on-beam ROI was determined. To quantify the off-beam responses, separate ROIs were defined corresponding to the bands of decreased fluorescence on each side of the beam excluding the most medial bands in which the stimulating electrode directly activated the local PCs, inhibitory interneurons, and climbing fibers and caused a fluorescence increase that obscured the weak negative change. Because the three more lateral bands were separated by the beam, a total of six ROIs were defined (one for each patch of decreased fluorescence). The ΔF/F from the six ROIs was averaged together for each frame to yield a time course of the off-beam response (see Fig. 1F). We also measured the intensity profiles along the long axis of the folium for both the off-beam response (i.e., the parasagittal band and intervening regions) and the on-beam response using 5-pixel-wide ROIs that followed the curvature of the beam (see Fig. 1D). Intensity profiles perpendicular to the beam were also determined (see Fig. 1E).
Figure 1.
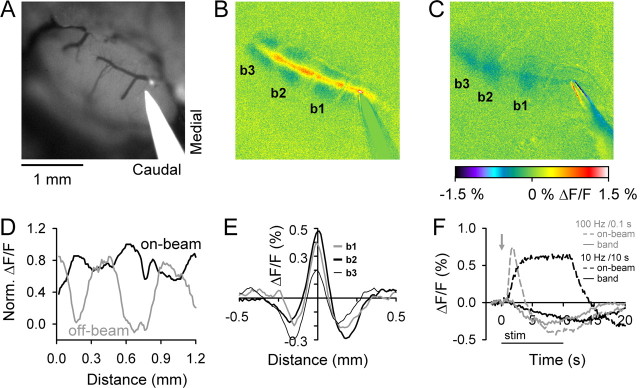
Surface stimulation in Crus II evokes on-beam increases and off-beam decreases in fluorescence. A, B, Background fluorescence image of Crus II and pseudocolored image of the response to surface stimulation show the on-beam increases in fluorescence and off-beam parasagittal bands of decreased fluorescence. The three more lateral bands are labeled as b1–b3 in the pseudocolored image in B. Surface stimulation parameters were 200 μA, 100 μs pulses at 10 Hz for 10 s (100 pulses total). C, Response to surface stimulation in another animal using 100 μA, 100 μs pulses at 100 Hz for 0.1 s (10 pulses total). The images in B and C are taken from the time period in which the off-beam response is close to maximal (see F). D, Normalized intensity profiles measured along the long axis of the folium of on-beam (black) and off-beam (gray) regions show the alternating pattern of relative increase and decrease for the image in B. The off-beam response was converted to positive values, and both profiles were normalized with the maximum of each set to 1. E, Intensity profiles of the fluorescence changes perpendicular to the beam and aligned with the three parasagittal bands. F, Time courses of the on-beam (dashed lines) and off-beam (solid lines) responses obtained using the two sets of stimulation parameters in B (black traces) and C (gray traces). The horizontal bar below x-axis denotes the 10 s surface stimulation period and the gray arrow the time of the 0.1 s stimulation. The scale bar is 1 mm in this and all subsequent figures.
Quantification of the optical responses for the various ROIs was based on the average ΔF/F in a 3.8 s period (8–11.8 s after stimulation onset) from four consecutive stimulation trials. This period included the time at which the on-beam response reached its maximum increase in fluorescence and when the off-beam decrease in fluorescence had nearly reached its maximum. Using this measure of responses, the effects of the various drugs and different stimulation amplitudes within an experiment were statistically evaluated using a paired Student’s t test or ANOVA, followed by Duncan’s post hoc test.
To display the images, 20 frames during the same period when the responses of interest were maximal were averaged pixel by pixel, and 4–15 trials were averaged. The resultant image was scaled to ±1.0 or 1.5% ΔF/F for either the grayscale or pseudocolor display using MetaMorph (Molecular Devices, Downingtown, PA). To generate an image of the significant responses, first the image was low-pass filtered (3 × 3), and then the mean and SD of a control region (usually a corner of the image) were determined. The pixels above or below this mean ± 2 SD were pseudocolored and superimposed on an image of the folia using a program written in Matlab (MathWorks, Natick, MA). Superimposed images in Figure 3 were selected based on similar topography and electrode placement and were then rotated and translated to be aligned with the folia. These thresholded segments were then combined to produce a subtractive overlay, with black representing overlap of significant pixels from at least three of the thresholded segments.
Figure 3.
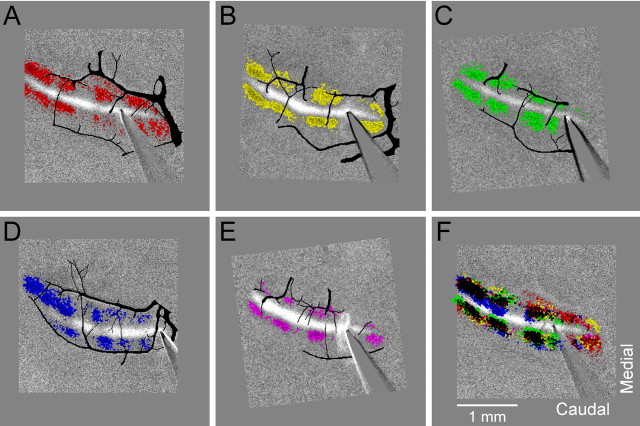
Positions of the parasagittal bands in Crus II are similar across mice. A–E, Optical responses from five mice in which the on-beam increase in fluorescence is shown in grayscale. The off-beam decreases in fluorescence were thresholded, and, for each animal, the regions exceeding the threshold were pseudocolored using a different color. Each image was translated and rotated to achieve approximate alignment of the responses. The surface vessels were traced from the raw fluorescence images of the folia and overlaid in black on the grayscale images. F, Responses from A–E were superimposed to compare the positions of the off-beam parasagittal bands.
To quantify the fluorescence changes evoked by injection of muscimol or glutamate, an ROI was defined for the optical response evoked around the glass microelectrode and the average ΔF/F was determined. An ROI of similar size was defined around the tip of the electrode for control injections of normal Ringer’s solution in the same folium. The average ΔF/F for the control injections was used to normalize the responses evoked by muscimol or glutamate.
Results
PF stimulation evokes off-beam bands of decreased fluorescence aligned with the zebrin II parasagittal zonation
Surface stimulation of the unstained cerebellar cortex evokes a narrow, transverse beam consisting of a large-amplitude increase in fluorescence, followed by a longer-duration decrease (Fig. 1A–C,F). Our initial study focused on the on-beam increase in fluorescence and established that the signal is primarily attributable to PF excitation of its postsynaptic targets and originates from changes in the oxidation state of mitochondrial flavoproteins (Reinert et al., 2004). The present study focuses on the off-beam response to PF stimulation. The off-beam response consists of smaller-amplitude decreases in fluorescence (Fig. 1B,C).
The off-beam decreases in fluorescence are in parasagittally elongated patches (referred to as bands) extending ∼300–400 μm in the transverse plane and 500–700 μm in the parasagittal plane (Fig. 1B,C,E). For the two examples shown, surface stimulation evokes three parasagittal bands (labeled b1–b3). There is also a suggestion of a fourth, more medial band near the site of stimulation (see Fig. 3). The duration or the number of pulses in the stimulus train is not a critical factor in evoking the off-beam decrease in fluorescence. The off-beam bands can be evoked by a wide range of surface stimulation frequencies and durations ranging from 10 Hz for 10 s to 100 Hz for 0.1 s (Fig. 1B,C). However, as discussed below (see Fig. 7), the amplitudes of the on- and off-beam responses are dependent on stimulation amplitude. The off-beam bands are opposed by troughs (relative decreases in fluorescence) within the on-beam response (Fig. 1B,D). The net effect is a highly nonuniform on-beam response. Therefore, the decreases in fluorescence extend through as well as on both sides of the beam.
Figure 7.
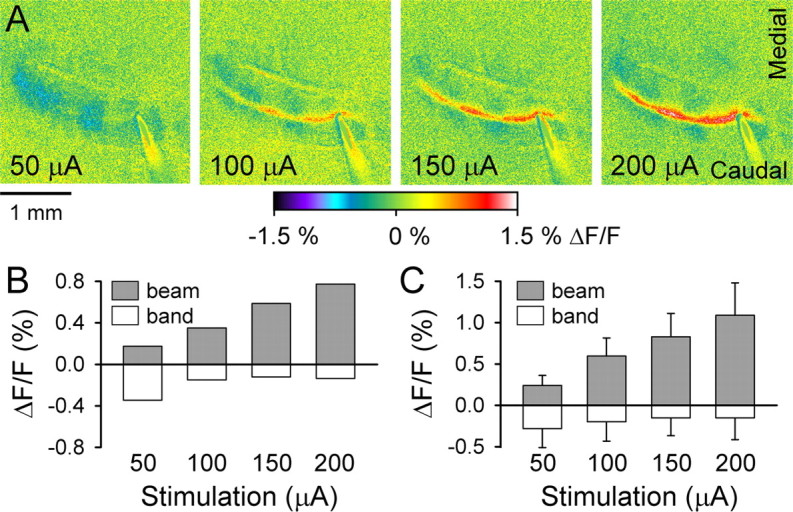
Parasagittal bands are evoked at low surface stimulation amplitudes. A, Optical responses to surface stimulation at amplitudes indicated. Other stimulation parameters were maintained constant (100 μs pulses at 10 Hz for 10 s). B, Average ΔF/F for the on-beam (gray) increases in fluorescence and off-beam bands (white) of decreased fluorescence for the example in A. C, Mean ± SD ΔF/F for the beam and band regions from three mice.
The on-beam increase in fluorescence rises rapidly to reach a plateau within 1–2 s of stimulus onset, remains elevated for the duration of stimulation, and then reverses to a decrease in fluorescence (Fig. 1F). The rise time is faster for the high-frequency than the lower-frequency stimulation as reported previously (Reinert et al., 2004). For the off-beam bands, the decrease in fluorescence begins at the same time but increases gradually and can persist beyond the stimulation duration. The time of onset for the off-beam bands is similar for different stimulation frequencies and durations (Fig. 1F) and was always detected within the first 200 ms image after stimulation onset. However, the 10 s duration stimulation generates an off-beam decrease in fluorescence that persists beyond the stimulation period (25.2 ± 1.4 s). At these stimulation parameters, the decrease in fluorescence is smaller in amplitude (peak of approximately −0.2–0.3% ΔF/F) than the on-beam increase (peak of ∼0.6–0.7% ΔF/F).
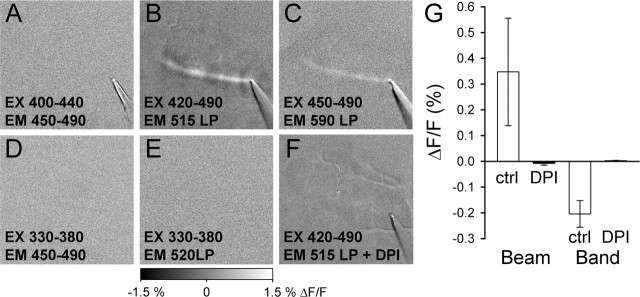
Two experiments assessed whether the off-beam fluorescence decrease was attributable to the reduction of the mitochondrial flavoproteins. In the first, the wavelength sensitivity of the off-beam response was found to have the same excitation and emission properties as the on-beam increase in fluorescence (Huang et al., 2002; Reinert et al., 2004), with peak excitation at ∼450 ± 40 nm and peak emission at 530 ± 30 nm (Fig. 2A–E). In the second, surface application of diphenyleneiodonium chloride (50 μm), a specific and irreversible blocker of flavoproteins (Majander et al., 1994), eliminates the off-beam response (Fig. 2B,F,G). The wavelength dependence and pharmacological blocker results confirm that the off-beam decreases in fluorescence originate from mitochondrial flavoproteins, as shown for the on-beam response (Reinert et al., 2004).
Figure 2.
Both the excitation–emission properties of the bands of decreased fluorescence and pharmacological evidence confirm the flavoprotein origin of this signal. A–E, Various combinations of excitation and emission filters demonstrate that peak excitation for the decrease in fluorescence is ∼450 ± 40 nm and peak emission at 530 ± 30 nm. F, DPI (50 μm) completely blocks the responses to surface stimulation shown in B. G, The results of three experiments in which DPI abolishes both the increases (beam) and decreases (band) in fluorescence. ctrl, Control; EM, emission; EX, excitation; LP, long pass.
The positions of the off-beam decreases in fluorescence are relatively constant across animals. Figure 3A–E shows the responses to surface stimulation in Crus II from five different animals in which the decreases in fluorescence were thresholded and pseudocolored. Because the surface topography and folia orientation varies across animals, these animals were selected based on the similarity of the surface structure in Crus II. In each mouse, surface stimulation evokes three parasagittal bands lateral to the site of surface stimulation and a fourth region located more medially on the folium. In some experiments, the most medial band is more difficult to discern because it is obscured by the stimulating electrode. The composite image in which the thresholded responses were superimposed show that the regions of decreased fluorescence are similar in location and spacing across animals (Fig. 3F).
One concern is whether the off-beam decreases are related to the vasculature on the folia. Visible vessels were traced and drawn on the thresholded optical maps as shown for the five animals in Figures 3A–E. The parasagittally oriented vessels course between and through the bands of decreased fluorescence across animals and even within a single folium. Similarly, the transversely oriented vessels that border the folia course through both the bands and nonband regions. Thus, the location of the bands is independent of the surface vasculature.
The consistency of the positions of the bands suggests that they are structural. This hypothesis was confirmed by stimulation of the PFs at two locations on the surface (Fig. 4A). Stimulation with each electrode separately evokes off-beam bands of decreased fluorescence aligned with decreases in the on-beam response (Fig. 4B,C). Simultaneous stimulation with two electrodes evokes bands of decreased fluorescence that extend across the entire folium (Fig. 4D). The alignment of the bands and regions between the bands is also evident in the relative decreases and increases in the on-beam response. Similar results were observed in four animals. Therefore, the parasagittal bands of decreased activity evoked by PF stimulation are not dependent on site of stimulation. These results provide additional evidence that the regions of decreased fluorescence are organized into bands and not simply patches.
Figure 4.
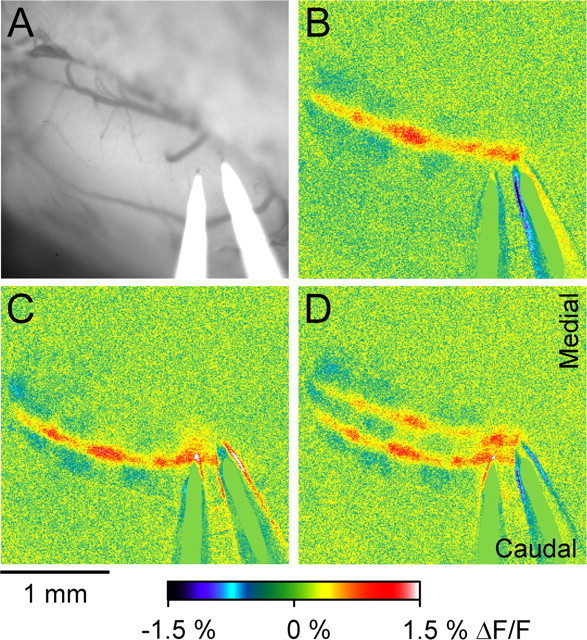
Location of the parasagittal bands does not depend on the site of surface stimulation. A, Background fluorescence image showing the location of two electrodes used for surface stimulation. B, C, Responses evoked by surface stimulation for each electrode separately (200 μA, 100 μs pulses at 10 Hz for 10 s). D, Stimulation of both electrodes simultaneously with the same parameters.
Because the bands extend across the folium, this raises the question of whether the bands reflect the known parasagittal compartmentalization of the cerebellar cortex (Brodal and Kawamura, 1980; Voogd and Bigare, 1980; Hawkes et al., 1992). To address this question, the positions of the bands of decreased fluorescence evoked by surface stimulation were compared with the banding pattern obtained with anti-zebrin II immunostaining in Crus II. To accomplish this, the steps included the following: (1) determining the position of the off-beam bands; (2) marking the positions between the bands (Fig. 5A,B) or on the bands (Fig. 5D,E); and (3) staining with anti-zebrin II antibodies after sectioning (Fig. 5C,F). The positions of the off-beam bands obtained with optical imaging and the anti-zebrin II staining pattern are the same. The three more lateral bands in Crus II (Fig. 1, b1–b3) correspond to P5b+, P6+, and P7+, respectively (Eisenman and Hawkes, 1993; Sillitoe and Hawkes, 2002). This finding was replicated in six animals. Therefore, the parasagittal bands of decreased fluorescence are structural and in register with the zebrin II compartments.
Figure 5.
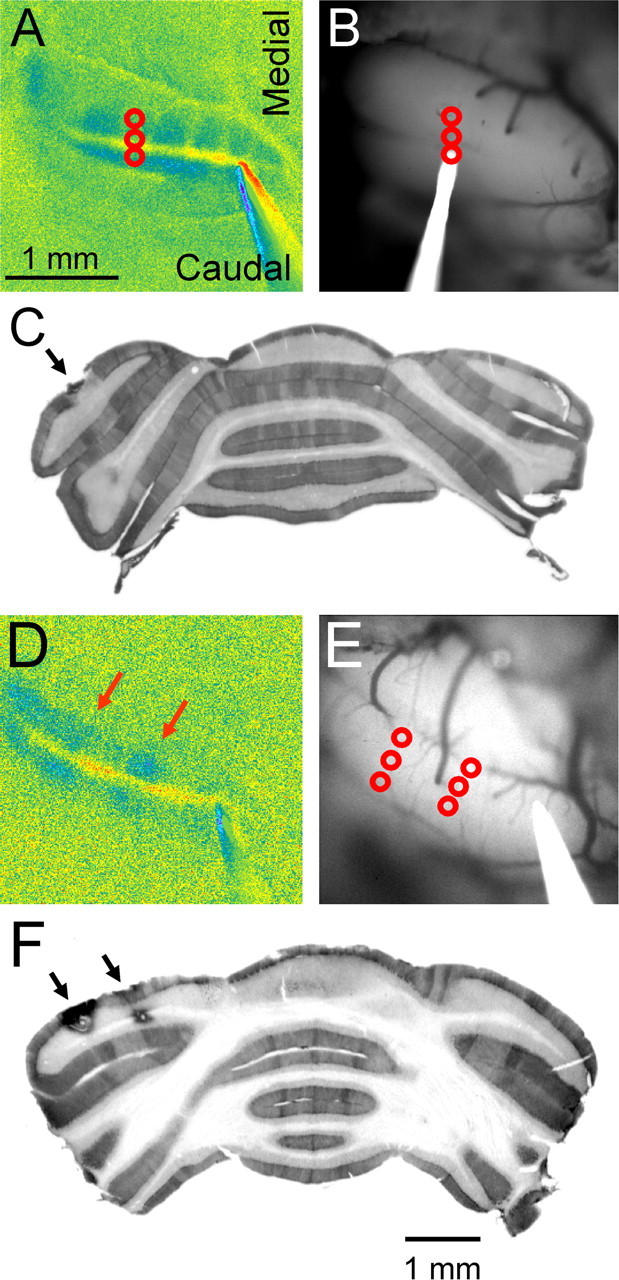
Bands of decreased fluorescence are in register with the zebrin II-positive band. A, Response to surface stimulation and the site of three electrolytic lesions (red circles) placed between two inhibitory bands in the center of the folium. B, Background image of the folium showing the lesion sites and the lesion electrode in place. C, Anti-zebrin II immunostaining of a section through the folium shows the location of the lesions between two zebrin II bands that correspond to P5b+ and P6+ (Eisenman and Hawkes, 1993; Sillitoe and Hawkes, 2002). D–F, Similar series of images in which two sets of lesions were placed within the two inhibitory bands (D). The recovered lesions are located on the P5b+ and P6+ zebrin II bands (F).
Parasagittal bands of decreased fluorescence are the result of GABAergic inhibition generated by molecular interneurons
We hypothesized that the off-beam decreases in fluorescence and the aligned on-beam troughs reflect off-beam and on-beam inhibition, respectively, generated by the molecular inhibitory interneurons. Several additional experiments were performed to test this hypothesis. The first was designed to test whether a decrease in flavoprotein autofluorescence is produced by pharmacologically induced neuronal inhibition. Microinjection of the GABAA agonist muscimol evokes a localized, circular-shaped, significant decrease in fluorescence (−0.36 ± 0.07% ΔF/F) at the injection site, and microinjection of glutamate evokes a significant increase in fluorescence (1.6 ± 0.13% ΔF/F) relative to control injections (n = 4 mice; p < 0.05, paired Student’s t test). Therefore, GABAergic inhibition results in the predicted decrease in flavoprotein autofluorescence.
The second test of our hypothesis blocked GABAA receptors, which mediate a large fraction of molecular layer inhibition (Hausser and Clark, 1997; Mittmann et al., 2005). Surface application of the GABAA antagonist bicuculline (100 μm) blocks the off-beam decrease in fluorescence and enhances the on-beam increase in fluorescence (Fig. 6). The loss of the off-beam inhibitory responses leads to increased excitation and transforms the off-beam decrease in fluorescence (−0.19 ± 0.16% ΔF/F) to an increase (0.21 ± 0.12% ΔF/F) (n = 4 mice; p < 0.05, paired Student’s t test). Bicuculline also increases the on-beam response by 47.3 ± 27.5% (n = 4 mice; p < 0.05, paired Student’s t test). Note that the on-beam response does not become uniform with the application of the bicuculline, suggesting that the parasagittal variations along the beam are not solely attributable to GABAA-mediated on-beam inhibition. The effects on- and off-beam show that blocking GABAergic molecular layer inhibition acts both on and off the beam of activated PCs.
Figure 6.
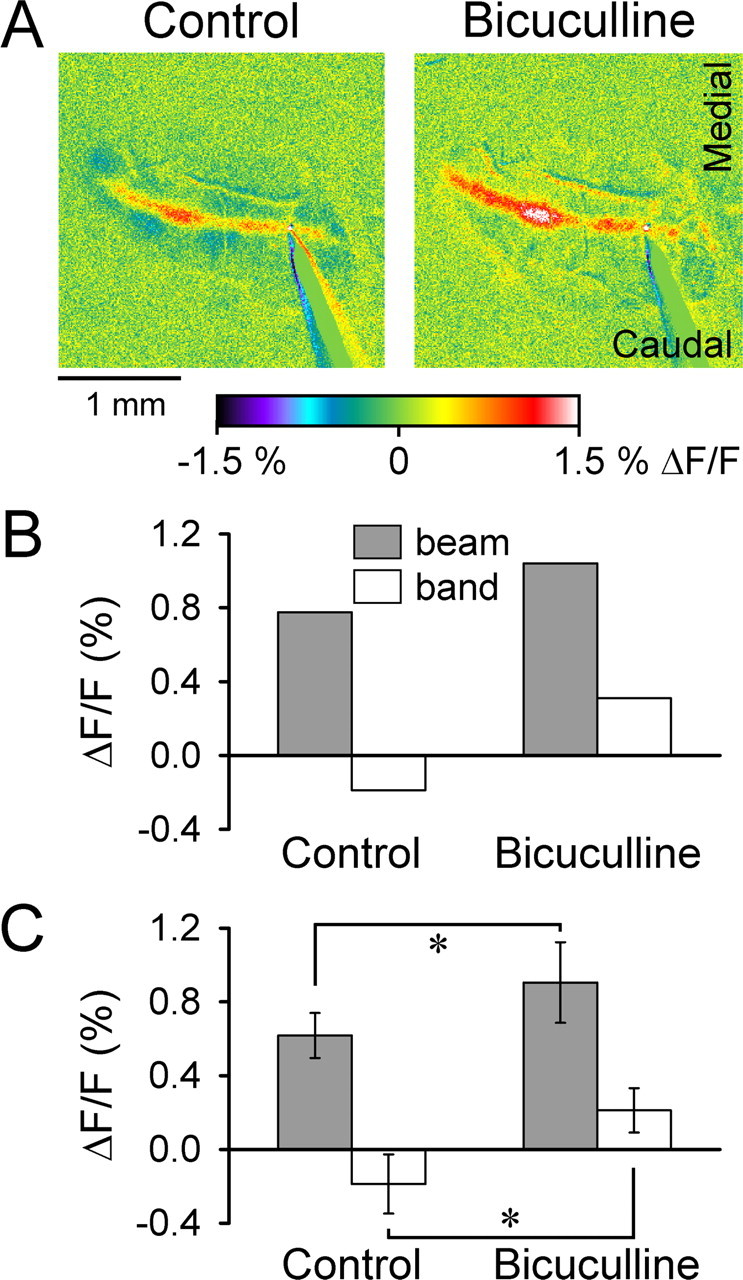
Off-beam response is blocked by bicuculline. A, Bicuculline (100 μm) abolishes the off-beam bands and increases the on-beam response evoked by surface stimulation (200 μA, 100 μs pulses at 10 Hz for 10 s). B, Mean ΔF/F for the beam and off-beam band for the example in A. C, Mean ± SD ΔF/F for the on-beam and off-beam band regions before and after bicuculline from four mice. *p < 0.05 denotes a significant change (paired Student’s t test).
The third test of the inhibitory hypothesis used low-amplitude stimulation to preferentially activate stellate cells (Barbour, 1993; Carter and Regehr, 2002). At the lowest stimulation amplitude (50 μA), the off-beam bands are prominent, whereas the on-beam response is barely detectable (Fig. 7A). The parasagittal zones of decreased fluorescence extend through the on-beam response, reflecting the activation of both on-beam and off-beam inhibition. As the stimulation strength increases, the on-beam response increases and the off-beam response decreases (Fig. 7B,C). The average amplitude of the off-beam response was a function of stimulation amplitude (p < 0.05, ANOVA). Post hoc analysis shows that the off-beam responses evoked by the three lower stimulation strengths (50, 100, and 150 μA) did not differ. However, a significant difference was detected between the smallest and the highest stimulation strengths (−0.16 ± 0.03% at 50 μA vs −0.05 ± 0.13% at 200 μA; p < 0.05, Duncan’s post hoc test). The explanation for this reduction at the highest stimulation amplitudes is not known, but one contributing factor may be increased light scattering because of the much greater on-beam response. Overall, these observations are consistent with stellate cells being activated at low levels of PF input (Barbour, 1993; Carter and Regehr, 2002) and lateral inhibition having a low threshold and saturating at low stimulus intensity (Cohen and Yarom, 2000).
Although coupled to neuronal activity, the flavoprotein signal is mitochondrial in origin and is a measure of oxidative metabolism (Reinert et al., 2004). Therefore, to confirm the autofluorescence findings with another imaging technique that more directly reflects neuronal activity, Ca2+ and flavoprotein imaging were undertaken in the same animals. As detailed in Materials and Methods, this required making multiple microinjections of the calcium indicator, Oregon Green 488, to stain a folium as uniformly as possible. The on- and off-beam responses to surface stimulation are similar whether monitoring changes in Ca2+ (Fig. 8C) or oxidative metabolism with flavoprotein autofluorescence (Fig. 8B). For both imaging methodologies, surface stimulation evokes an increase in fluorescence on-beam and smaller-amplitude decreases in fluorescence off-beam. The decreases are in parasagittal bands. For the Ca2+ imaging, the time courses show tight coupling to the duration of the stimulation (Fig. 8D), with the on-beam increase and the off-beam decrease beginning at stimulation onset. However, as observed with flavoprotein imaging (Fig. 1F), the off-beam band response develops more slowly than the on-beam response. The on-beam response is not uniform; instead, it exhibits relative decreases in amplitude at the intersections of the parasagittal bands. Similar on- and off-response patterns were observed in five animals in which the two imaging techniques were combined. Bicuculline had similar effects on the responses observed with Ca2+ imaging, augmenting the on-beam and blocking the off-beam responses (data not shown).
Figure 8.
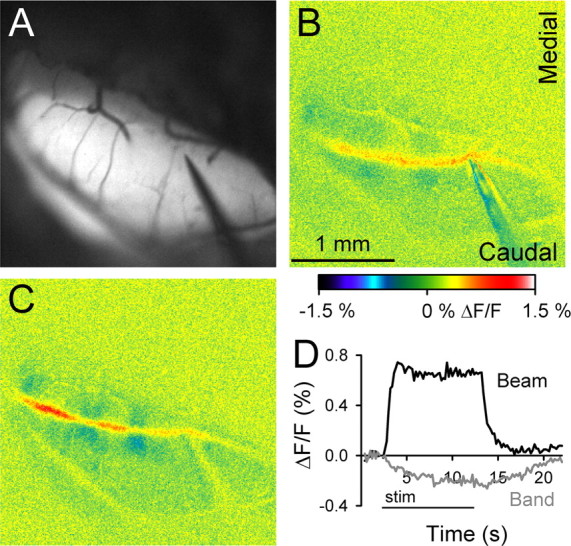
Ca2+ imaging reveals the same banding pattern as autofluorescence imaging. A, B, Background autofluorescence image of Crus II and pseudocolored response to surface stimulation (50 μA, 100 μs pulses at 10 Hz for 10 s). C, Response to surface stimulation (40 μA, 100 μs pulses at 10 Hz for 10 s) after staining the folium with Oregon Green 488. D, Time course of the on- and off-beam responses using Ca2+ imaging.
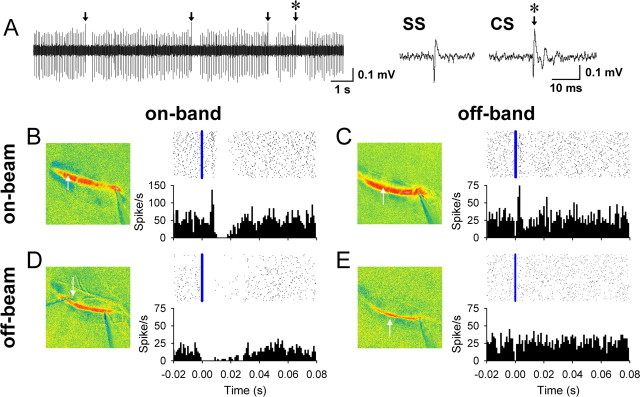
Finally, electrophysiological recordings support the hypothesis that the on- and off-beam decreases in fluorescence reflect inhibition. The responses of single neurons recorded in the molecular and PC layers to surface stimulation were compared with the autofluorescence responses (Fig. 9). An effort was made to record cells in four locations: (1) off-beam and off-band, (2) off-beam and on-band, (3) on-beam and off-band, and (4) on-beam and on-band (Fig. 9B–E). The optical responses were used to guide placement of the electrode. A short-latency increase in firing to surface stimulation was used to confirm that a cell was on-beam, i.e., excited by the activated PFs (on-beam) (Fig. 9B,C). A total of 35 neurons were studied, including 15 PCs and 20 unidentified cells. For the 21 cells recorded within a band (on-band) (Fig. 9B,D), surface stimulation evoked a long-duration decrease in simple spike firing in five of the nine PCs and eight of the 12 unidentified cells whether the neuron was on-beam or off-beam. The decrease in simple spike discharge follows a brief increase in firing for the two PCs recorded on-beam and on-band. For the PCs and unidentified neurons recorded on-band that responded to surface stimulation, the average duration was 20.4 ± 24.8 ms, and the average decrease in activity during this period was 89 ± 4%. In contrast, for the six PCs recorded between bands (off-band) (Fig. 9C,E), the simple spike discharge exhibited little if any decrease whether the cell was on-beam (n = 2) or off-beam (n = 4). The same lack of inhibition to surface stimulation was observed for the eight unidentified cells recorded off-band. Only one cell recorded between bands had a significant decrease in firing, with a very short duration of 3 ms. Single-unit recordings confirm that the firing of both PCs and unidentified cells within a band is inhibited by PF stimulation, whereas cells recorded in off-band regions show little evidence of inhibition.
Figure 9.
Purkinje cell firing patterns in relation to beam and bands. A, Spontaneous simple spike (SS) and complex spike firing (CS, arrows) of a PC. The complex spike indicated by an asterisk is shown at a higher temporal resolution on the right. B–E, Raster plots and histograms of the simple spike firing of PCs located at four locations: on-beam and on-band (B), on-beam and off-band (C), off-beam and on-band (D), and off-beam and off-band (E). Histograms are constructed from four trials of surface stimulation at 200 μA, 100 μs at 10 Hz for 10 s.
Parasagittal inhibitory bands are evoked by peripheral stimulation and inhibitory bands shape the spatial pattern resulting from peripheral input
The experiments described above used surface stimulation to evoke the off-beam inhibitory response. Because it has been challenged whether beams of PFs are activated under physiological conditions (Bower and Woolston, 1983; Cohen and Yarom, 1998; Jaeger, 2003), we tested whether the parasagittally organized pattern of inhibition evoked by PF stimulation can result from more physiological inputs. Stimulation of the ipsilateral 3C vibrissal pad usually evokes responses in Crus II consisting of one or more discrete patches of increased fluorescence. For the example shown, vibrissal pad stimulation evokes two patches of increased fluorescence (Fig. 10B,C, p1, p2). The more centrally located response, p1, is more prominent (amplitude and area) and was detected in most animals (13 of 15). The more lateral (p2) response patch is of smaller amplitude and was detected in a smaller number of animals (6 of 15). Vibrissal pad stimulation also evokes bands of decreased fluorescence that delineate the areas of increased fluorescence. This includes two bands of decreased fluorescence (Fig. 10B,C) in the same position as the two more lateral inhibitory bands (b2 and b3) evoked with surface stimulation (Fig. 10A,C). The amplitude of the decrease in fluorescence in the bands attributable to peripheral stimulation was small and required additional averaging of stimulation trials to detect. The small response amplitude accounts for both the need for additional averaging and that the bands were observed in only one-third of the experiments using peripheral stimulation (5 of 15). The time course of the increase in fluorescence in the patches and the decreases in fluorescence in the bands (Fig. 10D) is similar to that observed for surface stimulation (Fig. 1F). Therefore, the same bands activated by surface stimulation can be activated by peripheral inputs.
Figure 10.
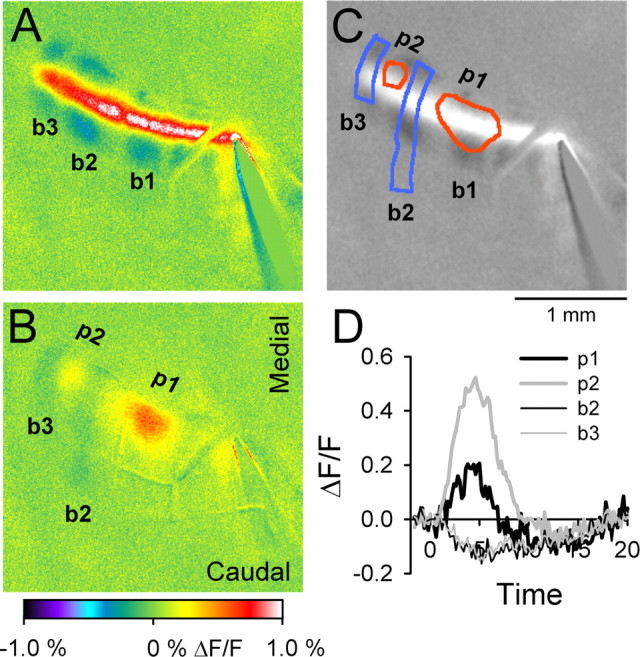
Peripheral stimulation evokes patches of increased fluorescence and parasagittal bands of decreased fluorescence. A, Surface stimulation evokes an on-beam response and three off-beam bands (b1–b3). B, Ipsilateral vibrissal pad stimulation evokes two patches (p1, p2) of increased fluorescence and two parasagittal bands (b2, b3) of decreased fluorescence. C, The contours of the peripheral responses in B (patches in red and bands in blue) were superimposed on a grayscale image of the response to surface stimulation in A. The bands evoked by peripheral stimulation overlap the bands generated by surface stimulation. D, Time courses of the increases in fluorescence (thick lines) from p1 and p2 and the decreases in fluorescence (thin lines) from b2 and b3 of B.
The final experiment examined whether the parasagittally organized inhibition evoked by surface stimulation altered the cerebellar cortical responses to peripheral inputs. In these experiments, surface stimulation at low amplitudes was used to evoke the inhibitory bands (Fig. 11B) while limiting the on-beam response to minimize interference with the responses generated by peripheral stimulation (Fig. 11A). In the example shown, stimulation of the vibrissal pad evokes p1, a patch of increased fluorescence in the middle of Crus II and near its anterior border (Fig. 11), which overlaps with one of the medial inhibitory bands (Fig. 11C). Conjunctive stimulation of the surface and vibrissa results in a large decrease in the peripheral response in the region that overlaps the medial inhibitory band (Fig. 11C,D). The average decrease in the peripheral response in the overlapping region was 81 ± 39% (p < 0.05, paired Student’s t test; n = 4 animals) (Fig. 11E). In contrast, the region of the peripheral response not overlapping the parasagittal band was not significantly affected, with an average decrease of 14 ± 38% (p > 0.05, paired Student’s t test). Therefore, the inhibitory bands generate a highly spatially specific decrease in the responses to peripheral stimulation, confirming that the molecular layer inhibition is not uniform but compartmentalized in parasagittal bands.
Figure 11.
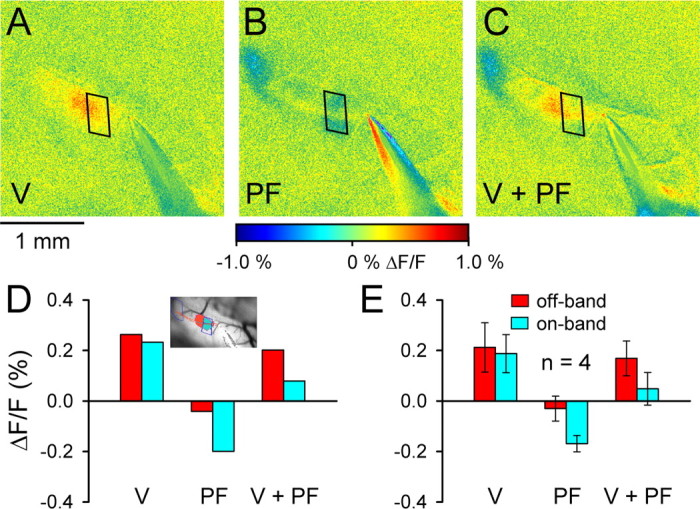
Parasagittal bands evoked by PF stimulation reduce and shape the response evoked by peripheral stimulation. A, Patch of increased fluorescence evoked by stimulation of the ipsilateral vibrissa (V). B, Parasagittal bands evoked by low-amplitude PF stimulation (50 μA, 100 μs pulses at 10 Hz for 10 s). C, Responses to combined stimulation of the PFs and vibrissa (V + PF). The trapezoids in A–C show the region of one of the PF-evoked parasagittal bands in B overlapping the patch evoked by vibrissa stimulation in A. D, ΔF/F for the regions of interest shown in the inset for the vibrissa, PF, and combined stimulation in A–C. The ROI in red in the inset is the region activated by vibrissa stimulation that did not overlap with the inhibitory band resulting from PF stimulation. The ROI in blue is the region activated by vibrissa stimulation that overlapped the inhibitory region activated by PF stimulation. E, Mean ± SD ΔF/F for similar ROIs and stimulation conditions for four animals. Color coding of the ROIs is the same as in D.
Discussion
The first major finding of this study is that molecular layer inhibition evoked by PF stimulation is not spatially uniform but organized in parasagittal bands that span the folium. Several results demonstrate that the compartmentalized off-beam fluorescence decrease is attributable to postsynaptic inhibition generated by MLIs. Postsynaptic molecular layer inhibition is primarily mediated by GABAA receptors located on PC somas and dendrites, as well as on stellate and basket cell dendrites (Edgar and Schwartz, 1990; Laurie et al., 1992; Hausser and Clark, 1997). Here we show that the off-beam bands are completely blocked by the GABAA antagonist bicuculline. Muscimol, a potent GABAA agonist that suppresses the firing of PCs and interneurons (Caesar et al., 2003), produces a decrease in fluorescence. Furthermore, a similar banding pattern was obtained with Ca2+ imaging, and most of the Ca2+ signal off-beam is likely to arise from the postsynaptic targets of the MLIs (Eilers et al., 1995; Wang et al., 2000; Sullivan et al., 2005). Therefore, the decreases in autofluorescence result from GABAA receptor-dependent postsynaptic activity, supporting the concept that the inhibition is generated by MLIs.
The electrophysiological findings confirm that molecular layer inhibition evoked by PF stimulation is compartmentalized into the same parasagittal zones as the fluorescence changes. The discharges of PCs and unidentified neurons located in the bands of decreased fluorescence, either on- or off-beam, are inhibited by PF stimulation. Cells recorded between the bands show little inhibition of their spontaneous firing. The correlation between the decreases in fluorescence and neuronal inhibition also demonstrates that this signal does not simply reflect a parasagittally distributed aspect of oxidative metabolism, such as cytochrome oxidase (Leclerc et al., 1990). The Ca2+ imaging findings provide additional evidence that the decrease in fluorescence is attributable to a reduction in neuronal activity that leads to a decrease in oxidative metabolism, consistent with the observation that molecular layer inhibition reduces Ca2+ transients in PCs (Callaway et al., 1995).
The inhibition is the result of both basket and stellate cells (Mugnaini, 1972). The off-beam bands extend ∼250–350 μm from the activated PFs, consistent with the axonal projection length of the molecular layer inhibitory neurons in rats (Palay and Chan-Palay, 1974). The stellate cells are implicated because the off-beam bands are activated at lower stimulation strengths than on-beam excitation, consistent with the observation that stellate cell spiking is strongly influenced by individual quanta released from PFs (Barbour, 1993; Carter and Regehr, 2002). Because epifluorescence imaging was used, the decreases in flavoprotein autofluorescence or Ca2+ fluorescence originate from inhibition generated primarily in the upper molecular layer with possibly some contributions from the deeper PC proximal dendrites. Basket cells may contribute because these neurons also have ascending axons that project to targets in the superficial molecular layer as well as on the more proximal dendrites and somas of PCs (Chan-Palay and Palay, 1972; Mugnaini, 1972). PF stimulation-evoked Golgi cell inhibition on granule cells also contributes to the on-beam inhibition (Cohen and Yarom, 2000), but the deep location of granule cells makes it unlikely that we monitored this inhibition. Also, the inhibition attributable to PC axon recurrent collaterals is unlikely to contribute because the axons in the supraganglionic plexus extend along the same axis as the PFs and those in the infraganglionic plexus project to different folia (Eager, 1965). Therefore, the bands are most likely attributable to activation of stellate and basket cells that in turn generate inhibition of their targets in the molecular layer.
The correspondence between the inhibitory bands and the anti-zebrin II staining is one of the first demonstrations that the parasagittal zones are coupled to an alteration in the basic physiological properties of the cerebellar cortical circuitry. Specifically, zebrin II-positive parasagittal bands respond differentially to PF activation, exhibiting greater molecular layer inhibition. However, the cellular basis of the inhibitory bands is not known. It is generally accepted that the interneurons and their synaptic connections are uniformly distributed and that the distribution of GABAA receptors is uniform. One possibility is the synaptic strength between PFs and MLIs varies in parasagittal zones. Although we are unaware of any published evidence for this concept, it is interesting that the on-beam response does not become uniform with application of bicuculline (Fig. 6). Conversely, the correspondence between the inhibitory and zebrin II bands points to the PCs. A large number of molecules of PCs have the same or a complimentary parasagittal banding pattern as zebrin II (Hawkes et al., 1992; Herrup and Kuemerle, 1997), some related to second-messenger systems and synaptic transmission. For example, phospholipase Cβ3 is a key component in the transduction of metabotropic glutamate receptor activation and is implicated in long-term depression (Sarna et al., 2006). Neuronal calcium sensor-1 is a calcium binding protein that buffers intracellular Ca2+ and may regulate Ca2+ influx (Jinno et al., 2003). The excitatory amino acid transporter 4 is implicated in the resistance of zebrin II-positive PCs to ischemic death (Dehnes et al., 1998; Welsh et al., 2002). Compartmentalization of these or other molecules could alter how PCs respond to inhibitory inputs from MLIs.
Another major finding is that flavoprotein autofluorescence imaging can be used to monitor inhibition as well as excitation. The implication is that molecular layer inhibition results in a net reduction in oxidative metabolism. Energy usage in the brain and how it relates to excitatory and inhibitory activity is fundamental to understanding brain metabolism and functional imaging (Mathiesen et al., 2000; Attwell and Laughlin, 2001; Attwell and Iadecola, 2002; Lauritzen and Gold, 2003). Both excitatory and inhibitory synapses involve similar processes and require energy expenditure (Ackermann et al., 1984; Nudo and Masterton, 1986) and cannot account for the decrease in autofluorescence. In contrast, the reduction in the firing of Purkinje cells and unidentified neurons within the bands will decrease metabolic energy consumption and may contribute to the decrease in autofluorescence. However, it is unlikely that the decrease in the autofluorescence signal arises from the decrease in Purkinje cell spiking, given the depth of the Purkinje cell soma and axons and the limited backpropagation of action potentials in these neurons (Stuart and Hausser, 1994; Vetter et al., 2001).
The Ca2+ imaging results suggest another and possibly more important mechanism for the reduction in the autofluorescence signal. Neuronal depolarization leads to an increase in intracellular Ca2+ in PCs and MLIs (Eilers et al., 1995; Wang et al., 2000; Sullivan et al., 2005), and this increase is taken up by the mitochondria (Budd and Nicholls, 1996). Intracellular Ca2+ is a powerful activator of mitochondrial metabolism, leading to oxidation of flavoproteins and other mitochondrial components (Chance, 1965, 1972; Nicholls and Ferguson, 2002). It is reasonable to assume that a decrease in calcium influx by interneuron inhibition (Callaway et al., 1995) would lead to a decreased metabolic response and, thus, a reduced flavoprotein signal and a decrease in fluorescence. This mechanism would also explain the long time course of the decreased fluorescence in the off-beam bands, which is considerably longer that the reduction in neuronal spiking. A recent in vivo study showed that brief stimulation of PFs evokes Ca2+ changes in cerebellar neurons that last several seconds (Sullivan et al., 2005). Therefore, long-lasting reduction in intracellular Ca2+ in PC dendrites and/or MLIs would reduce the flavoprotein signal.
The inhibitory bands can be evoked by peripheral stimulation. Furthermore, the parasagittal bands shape the spatial nature of the responses to peripheral input. This suggests that the inhibitory bands contribute to the spatial pattern of PCs activated by mossy fiber inputs. Not only does this further the argument that the off-beam bands are inhibitory but also provides evidence that molecular layer inhibition spatially controls the responses to afferent inputs (Cohen and Yarom, 2000). We propose two functional implications. First, the inhibitory bands may contribute to the patchy mosaic somatotopy described for the responses of PCs to peripheral inputs (Bower and Woolston, 1983). Therefore, the spatial distribution of PC activity is not defined solely by the pattern of granule cells activated but is also determined by the inhibitory interneurons (Cohen and Yarom, 2000). Second, the inhibitory bands may help explain why evidence for PCs being activated along beams has been difficult to obtain (Bower and Woolston, 1983; Cohen and Yarom, 1998). The inhibitory bands, both on and off the beam, would serve to disrupt any beam-like activation of PCs, as suggested previously (Mittmann et al., 2005). The finding that molecular layer inhibition is organized in parasagittal bands provides new functional insights into the compartmentalization of the cerebellar cortex.
Footnotes
This work was supported in part by National Institutes of Health Grant R01-NS048944. We thank Lijuan Zhuo for animal preparation, Michael McPhee for graphics, and Kris Bettin for preparation of this manuscript. The anti-zebrin II antibody was kindly provided by Dr. Richard Hawkes, University of Calgary (Calgary, Alberta, Canada).
References
- Ackermann RF, Finch DM, Babb TL, Engel J Jr (1984). Increased glucose metabolism during long-duration recurrent inhibition of hippocampal pyramidal cells. J Neurosci 4:251–264. [DOI] [PMC free article] [PubMed] [Google Scholar]
- Andersen P, Eccles JC, Voorhoeve PE (1964). Postsynaptic inhibition of cerebellar Purkinje cells. J Neurophysiol 27:1138–1153. [DOI] [PubMed] [Google Scholar]
- Attwell D, Iadecola C (2002). The neural basis of functional brain imaging signals. Trends Neurosci 25:621–625. [DOI] [PubMed] [Google Scholar]
- Attwell D, Laughlin SB (2001). An energy budget for signaling in the grey matter of the brain. J Cereb Blood Flow Metab 21:1133–1145. [DOI] [PubMed] [Google Scholar]
- Barbour B (1993). Synaptic currents evoked in Purkinje cells by stimulating individual granule cells. Neuron 11:759–769. [DOI] [PubMed] [Google Scholar]
- Bower JM, Woolston DC (1983). Congruence of spatial organization of tactile projections to granule cell and Purkinje cell layers of cerebellar hemispheres of the albino rat: vertical organization of cerebellar cortex. J Neurophysiol 49:745–766. [DOI] [PubMed] [Google Scholar]
- Braitenberg V (2002). In defense of the cerebellum. Ann NY Acad Sci 978:175–183. [DOI] [PubMed] [Google Scholar]
- Brodal A, Kawamura K (1980). Olivocerebellar projection: a review. Adv Anat Embryol Cell Biol 64:1–140. [PubMed] [Google Scholar]
- Budd SL, Nicholls DG (1996). A reevaluation of the role of mitochondria in neuronal Ca2+ homeostasis. J Neurochem 66:403–411. [DOI] [PubMed] [Google Scholar]
- Caesar K, Thomsen K, Lauritzen M (2003). Dissociation of spikes, synaptic activity, and activity-dependent increments in rat cerebellar blood flow by tonic synaptic inhibition. Proc Natl Acad Sci USA 100:16000–16005. [DOI] [PMC free article] [PubMed] [Google Scholar]
- Callaway JC, Lasser-Ross N, Ross WN (1995). IPSPs strongly inhibit climbing fiber-activated [Ca2+] increases in the dendrites of cerebellar Purkinje neurons. J Neurosci 15:2777–2787. [DOI] [PMC free article] [PubMed] [Google Scholar]
- Carter AG, Regehr WG (2002). Quantal events shape cerebellar interneuron firing. Nat Neurosci 5:1309–1318. [DOI] [PubMed] [Google Scholar]
- Chan-Palay V, Palay SL (1972). The stellate cells of the rat’s cerebellar cortex. Z Anat Entwicklungsgesch 136:224–248. [DOI] [PubMed] [Google Scholar]
- Chan-Palay V, Nilaver G, Palay SL, Beinfeld MC, Zimmerman EA, Wu JY, O’Donohue TL (1981). Chemical heterogeneity in cerebellar Purkinje cells: existence and coexistence of glutamic acid decarboxylase-like and motilin-like immunoreactivities. Proc Natl Acad Sci USA 78:7787–7791. [DOI] [PMC free article] [PubMed] [Google Scholar]
- Chance B (1965). The energy-linked reaction of calcium with mitochondria. J Biol Chem 240:2729–2748. [PubMed] [Google Scholar]
- Chance B (1972). The kinetics of flavoprotein and pyridine nucleotide oxidation in cardiac mitochondria in the presence of calcium. FEBS Lett 26:315–319. [DOI] [PubMed] [Google Scholar]
- Cohen D, Yarom Y (1998). Patches of synchronized activity in the cerebellar cortex evoked by mossy-fiber stimulation: questioning the role of parallel fibers. Proc Natl Acad Sci USA 95:15032–15036. [DOI] [PMC free article] [PubMed] [Google Scholar]
- Cohen D, Yarom Y (2000). Cerebellar on-beam and lateral inhibition: two functionally distinct circuits. J Neurophysiol 83:1932–1940. [DOI] [PubMed] [Google Scholar]
- Dehnes Y, Chaudhry FA, Ullensvang K, Lehre KP, Storm-Mathisen J, Danbolt NC (1998). The glutamate transporter EAAT4 in rat cerebellar Purkinje cells: a glutamate-gated chloride channel concentrated near the synapse in parts of the dendritic membrane facing astroglia. J Neurosci 18:3606–3619. [DOI] [PMC free article] [PubMed] [Google Scholar]
- Eager RP (1965). The mode of termination and temporal course of degeneration of cortical association pathways in the cerebellum of the cat. J Comp Neurol 124:243–257. [DOI] [PubMed] [Google Scholar]
- Eccles JC, Llinas R, Sasaki K (1966a). Parallel fibre stimulation and the responses induced thereby in the Purkinje cells of the cerebellum. Exp Brain Res 1:17–39. [DOI] [PubMed] [Google Scholar]
- Eccles JC, Sasaki K, Strata P (1966b). The profiles of physiological events produced by a parallel fibre volley in the cerebellar cortex. Exp Brain Res 2:18–34. [DOI] [PubMed] [Google Scholar]
- Eccles JC, Ito M, Szentagothai J (1967). In: The cerebellum as a neuronal machine Berlin: Springer.
- Edgar PP, Schwartz RD (1990). Localization and characterization of 35S-t-butylbicyclophosphorothionate binding in rat brain: an autoradiographic study. J Neurosci 10:603–612. [DOI] [PMC free article] [PubMed] [Google Scholar]
- Eilers J, Augustine GJ, Konnerth A (1995). Subthreshold synaptic Ca2+ signalling in fine dendrites and spines of cerebellar Purkinje neurons. Nature 373:155–158. [DOI] [PubMed] [Google Scholar]
- Eisenman LM, Hawkes R (1993). Antigenic compartmentation in the mouse cerebellar cortex: zebrin and HNK-1 reveal a complex, overlapping molecular topography. J Comp Neurol 335:586–605. [DOI] [PubMed] [Google Scholar]
- Hanson CL, Chen G, Ebner TJ (2000). Role of climbing fibers in determining the spatial patterns of activation in the cerebellar cortex to peripheral stimulation: an optical imaging study. Neuroscience 96:317–331. [DOI] [PubMed] [Google Scholar]
- Hausser M, Clark BA (1997). Tonic synaptic inhibition modulates neuronal output pattern and spatiotemporal synaptic integration. Neuron 19:665–678. [DOI] [PubMed] [Google Scholar]
- Hawkes R, Brochu G, Dore L, Graval C, Leclerc N (1992). Zebrins: molecular markers of compartmentation in the cerebellum. In: The cerebellum revisited (Llinas R, Sotelo C, eds) pp. 22–55. New York: Springer.
- Herrup K, Kuemerle B (1997). The compartmentalization of the cerebellum. Annu Rev Neurosci 20:61–90. [DOI] [PubMed] [Google Scholar]
- Huang S, Heikal AA, Webb WW (2002). Two-photon fluorescence spectroscopy and microscopy of NAD(P)H and flavoprotein. Biophys J 82:2811–2825. [DOI] [PMC free article] [PubMed] [Google Scholar]
- Jaeger D (2003). No parallel fiber volleys in the cerebellar cortex: evidence from cross-correlation analysis between Purkinje cells in a computer model and in recordings from anesthetized rats. J Comput Neurosci 14:311–327. [DOI] [PubMed] [Google Scholar]
- Ji Z, Hawkes R (1994). Topography of Purkinje cell compartments and mossy fiber terminal fields in lobules II and III of the rat cerebellar cortex: spinocerebellar and cuneocerebellar projections. Neuroscience 61:935–954. [DOI] [PubMed] [Google Scholar]
- Jinno S, Jeromin A, Roder J, Kosaka T (2003). Compartmentation of the mouse cerebellar cortex by neuronal calcium sensor-1. J Comp Neurol 458:412–424. [DOI] [PubMed] [Google Scholar]
- Laurie DJ, Seeburg PH, Wisden W (1992). The distribution of 13 GABAA receptor subunit mRNAs in the rat brain. II. Olfactory bulb and cerebellum. J Neurosci 12:1063–1076. [DOI] [PMC free article] [PubMed] [Google Scholar]
- Lauritzen M, Gold L (2003). Brain function and neurophysiological correlates of signals used in functional neuroimaging. J Neurosci 23:3972–3980. [DOI] [PMC free article] [PubMed] [Google Scholar]
- Leclerc N, Dore L, Parent A, Hawkes R (1990). The compartmentalization of the monkey and rat cerebellar cortex: zebrin I and cytochrome oxidase. Brain Res 506:70–78. [DOI] [PubMed] [Google Scholar]
- Majander A, Finel M, Wikstrom M (1994). Diphenyleneiodonium inhibits reduction of iron-sulfur clusters in the mitochondrial NADH-ubiquinone oxidoreductase (complex I). J Biol Chem 269:21037–21042. [PubMed] [Google Scholar]
- Mathiesen C, Caesar K, Lauritzen M (2000). Temporal coupling between neuronal activity and blood flow in rat cerebellar cortex as indicated by field potential analysis. J Physiol (Lond) 523:235–246. [DOI] [PMC free article] [PubMed] [Google Scholar]
- Mittmann W, Koch U, Hausser M (2005). Feed-forward inhibition shapes the spike output of cerebellar Purkinje cells. J Physiol (Lond) 563:369–378. [DOI] [PMC free article] [PubMed] [Google Scholar]
- Mugnaini ELarsell O (1972). The histology and cytology of the cerebellar cortex. In: The comparative anatomy and histology of the cerebellum: the human cerebellum, cerebellar connections and cerebellar cortex pp. 201–265. Minneapolis: University of Minnesota.
- Mugnaini E, Dino MR, Jaarsma D (1997). The unipolar brush cells of the mammalian cerebellum and cochlear nucleus: cytology and microcircuitry. Prog Brain Res 114:131–150. [DOI] [PubMed] [Google Scholar]
- Nicholls DG, Ferguson DJ (2002). In: Bioenergetics 3 London: Academic.
- Nudo RJ, Masterton RB (1986). Stimulation-induced [14C]2-deoxyglucose labeling of synaptic activity in the central auditory system. J Comp Neurol 245:553–565. [DOI] [PubMed] [Google Scholar]
- Palay SL, Chan-Palay V (1974). In: Cerebellar cortex: cytology and organization New York: Springer.
- Reinert KC, Dunbar RL, Gao W, Chen G, Ebner TJ (2004). Flavoprotein autofluorescence imaging of neuronal activation in the cerebellar cortex in vivo. J Neurophysiol 92:199–211. [DOI] [PubMed] [Google Scholar]
- Sarna JR, Marzban H, Watanabe M, Hawkes R (2006). Complementary stripes of phospholipase Cbeta3 and Cbeta4 expression by Purkinje cell subsets in the mouse cerebellum. J Comp Neurol 496:303–313. [DOI] [PubMed] [Google Scholar]
- Scheibel ME, Scheibel AB (1954). Observations on the intracortical relations of the climbing fibers of the cerebellum; a Golgi study. J Comp Neurol 101:733–763. [DOI] [PubMed] [Google Scholar]
- Sillitoe RV, Hawkes R (2002). Whole-mount immunohistochemistry: a high-throughput screen for patterning defects in the mouse cerebellum. J Histochem Cytochem 50:235–244. [DOI] [PubMed] [Google Scholar]
- Stosiek C, Garaschuk O, Holthoff K, Konnerth A (2003). In vivo two-photon calcium imaging of neuronal networks. Proc Natl Acad Sci USA 100:7319–7324. [DOI] [PMC free article] [PubMed] [Google Scholar]
- Stuart G, Hausser M (1994). Initiation and spread of sodium action potentials in cerebellar Purkinje cells. Neuron 13:703–712. [DOI] [PubMed] [Google Scholar]
- Sullivan MR, Nimmerjahn A, Sarkisov DV, Helmchen F, Wang SS (2005). In vivo calcium imaging of circuit activity in cerebellar cortex. J Neurophysiol 94:1636–1644. [DOI] [PubMed] [Google Scholar]
- Turgeon SM, Albin RL (1993). Pharmacology, distribution, cellular localization, and development of GABAB binding in rodent cerebellum. Neuroscience 55:311–323. [DOI] [PubMed] [Google Scholar]
- Vetter P, Roth A, Hausser M (2001). Propagation of action potentials in dendrites depends on dendritic morphology. J Neurophysiol 85:926–937. [DOI] [PubMed] [Google Scholar]
- Voogd J, Bigare F (1980). Topographical distribution of olivary and corticonuclear fibers in the cerebellum. A review. In: The inferior olivary nucleus (Courville J, deMontigny C, Lamarre Y, eds) pp. 207–234. New York: Raven.
- Wang SS, Denk W, Hausser M (2000). Coincidence detection in single dendritic spines mediated by calcium release. Nat Neurosci 3:1266–1273. [DOI] [PubMed] [Google Scholar]
- Welsh JP, Yuen G, Placantonakis DG, Vu TQ, Haiss F, O’Hearn E, Molliver ME, Aicher SA (2002). Why do Purkinje cells die so easily after global brain ischemia? Aldolase C, EAAT4, and the cerebellar contribution to posthypoxic myoclonus. Adv Neurol 89:331–359. [PubMed] [Google Scholar]
- Yaginuma H, Matsushita M (1989). Spinocerebellar projections from the upper lumbar segments in the cat, as studied by anterograde transport of wheat germ agglutinin-horseradish peroxidase. J Comp Neurol 281:298–319. [DOI] [PubMed] [Google Scholar]


