Abstract
The peripheral taste system likely maintains a specific relationship between ganglion cells that signal a particular taste quality and taste bud cells responsive to that quality. We have explored a measure of the receptoneural relationship in the mouse. By injecting single fungiform taste buds with lipophilic retrograde neuroanatomical markers, the number of labeled geniculate ganglion cells innervating single buds on the tongue were identified. We found that three to five ganglion cells innervate a single bud. Injecting neighboring buds with different color markers showed that the buds are primarily innervated by separate populations of geniculate cells (i.e., multiply labeled ganglion cells are rare). In other words, each taste bud is innervated by a population of neurons that only connects with that bud. Palate bud injections revealed a similar, relatively exclusive receptoneural relationship. Injecting buds in different regions of the tongue did not reveal a topographic representation of buds in the geniculate ganglion, despite a stereotyped patterned arrangement of fungiform buds as rows and columns on the tongue. However, ganglion cells innervating the tongue and palate were differentially concentrated in lateral and rostral regions of the ganglion, respectively. The principal finding that small groups of ganglion cells send sensory fibers that converge selectively on a single bud is a new-found measure of specific matching between the two principal cellular elements of the mouse peripheral taste system. Repetition of the experiments in the hamster showed a more divergent innervation of buds in this species. The results indicate that whatever taste quality is signaled by a murine geniculate ganglion neuron, that signal reflects the activity of cells in a single taste bud.
Keywords: taste bud, geniculate, ganglion, innervation, mouse, gustatory
Introduction
The peripheral taste system likely maintains a specific relationship between taste bud cells selectively responsive to one taste quality and the ganglion cells signaling that particular quality. This explains the response specificity of some individual taste nerve fibers (Boudreau et al., 1971; Frank, 1973; Pfaffman et al., 1979; Frank et al., 1988; Sollars and Hill, 2005), particularly because sweet, amino acid, and bitter receptors are expressed in distinct populations of taste cells (Chandrashekar et al., 2000; Nelson et al., 2001, 2002). Although anatomical evidence for such an exclusive relationship is lacking at the level of single receptor and ganglion cells, the relationship between single buds and their innervating ganglion cells is tractable neuroanatomically. We explored this receptoneural relationship in the fungiform and palatal taste bud system of the mouse.
Fungiform and palatal taste buds are innervated by the geniculate ganglion cells of the facial nerve. The structural basis for taste quality coding may involve a topographic representation of taste qualities in the geniculate ganglion or the brain. In other senses, a map of the peripheral receptor sheet is represented centrally in an orderly anatomical manner; the peripheral map sometimes exhibits a patterned array of receptors (Tilney et al., 1992). However, in olfaction, the peripheral receptors are represented centrally, not on the basis of topography, but by the spatial convergence of synapses of neurons expressing specific receptors onto central neurons (Mombaerts et al., 1996; Gao et al., 2000; Vosshall et al., 2000). In taste, attempts to identify a spatial representation of taste receptors or taste qualities have revealed only an indistinct functional topography in the brain (Hamilton and Norgren, 1984; McPheeters et al., 1990). Nevertheless, taste ganglion cells must distribute peripheral fibers to particular receptor cell types and disseminate impulses centrally in a structurally organized manner. Previous studies of the peripheral fiber distribution have characterized receptive fields of geniculate ganglion cells or stained fibers in the tongue (Miller, 1971, 1974; Whitehead et al., 1999). These studies of how ganglion cells innervate taste buds have some limitations because of the techniques used; none has analyzed the mouse.
We used iontophoretic injection of retrograde neuroanatomical markers into single taste papillae to label the geniculate ganglion cells innervating the buds (Krimm and Hill, 1998). Our technique used three different color fluorescent lipophilic dyes injected into neighboring buds to identify the number, location, and innervation specificity of ganglion cells innervating single taste buds. Topography and degree of branching among buds of ganglion cells were investigated through injection strategies targeting different regions of the anterior tongue. Organized patterns are a feature of diverse epithelial appendages, such as teeth, feathers, and hair (Chuong et al., 2000). In the mouse tongue, the fungiform papillae are arranged in a specific patterned array of columns and rows (Jung et al., 1999, 2004). Whether this receptor pattern relates to a corresponding pattern of ganglionic neurons was evaluated. Finally, injecting anterior tongue and palatal buds assessed the topography of geniculate neurons for their two major receptor fields.
Materials and Methods
Animals.
One hundred C57BL/6 mice and five Golden Syrian hamsters 6–16 weeks of age were used. All laboratory procedures were approved by the University of California at San Diego Laboratory Animal Care and Use Committee and followed the National Institutes of Health Guide for the Care and Use of Laboratory Animals.
Dye preparation.
Lipophilic dyes [Fast DiI (D-3899; absorption, 568 nm; emission, 564 nm), Fast DiO (D-3898; absorption, 488 nm; emission, 499 nm), Fast DiD (D-7757; absorption, 647 nm; emission, 663 nm) (Invitrogen, Eugene, OR)] were dissolved at a concentration of 3–5 mg/ml in a 1:1 solution of DMSO and ethanol. Five to 10 μl of the dye solution were loaded into glass capillaries (25 μm tip diameter) and secured on a micromanipulator (Fine Science Tools, San Francisco, CA). DiI readily went into solution, whereas DiO and DiD solutions were sonicated, allowed to sit overnight, and centrifuged before the experiment. Because of the poor solubility of DiD and DiO and their low compatibility with each other as well as with DiI, care was taken that dye mixtures were thoroughly mixed and spun down immediately before injections.
Papillae numbering and iontophoresis.
Animals were anesthetized with a 40 mg/kg intraperitoneal injection of pentobarbital, after calming with Isoflo (Abbott Laboratories, Chicago, IL) vapors. The dorsal half of the tongue was gently pulled out of the mouth and immobilized by pressing its ventral surface against the sticky surface of a double-sided tape attached to a tongue platform. Fungiform and palate papillae were visualized with the aid of 0.5% methylene blue solution (Fisher Scientific, Houston, TX). Using a surgical microscope (Zeiss, Oberkochen, Germany) and micromanipulator, the taste papilla was selected and firmly capped with a glass pipette (150 μm thick) before iontophoretic injection. For the palatal bud injections, the animal was placed in the supine position and both the jaws and the cheeks were stretched apart using nontraumatic hooks. The taste pores were visualized with the aid of 0.5% methylene blue solution. The dye-filled capillary was lowered over the pore and pressed snugly to cover and seal the bud surface. Care was taken not to spill the dye on the adjacent taste buds. A cyclic current of 4 μA with 5 s on–off pulses (square anodal pulses) were passed for 4–6 min (BAB-500 iontophoresis pump; Kation Scientific, Minneapolis, MN). The negative terminal of the current source was attached to the external ear (pinna) of the animal. Similarly, depending on the nature of the experiment, additional papillae were selected and injected with the same or different dyes. In some animals, injections were made into multiple papillae along rows and columns.
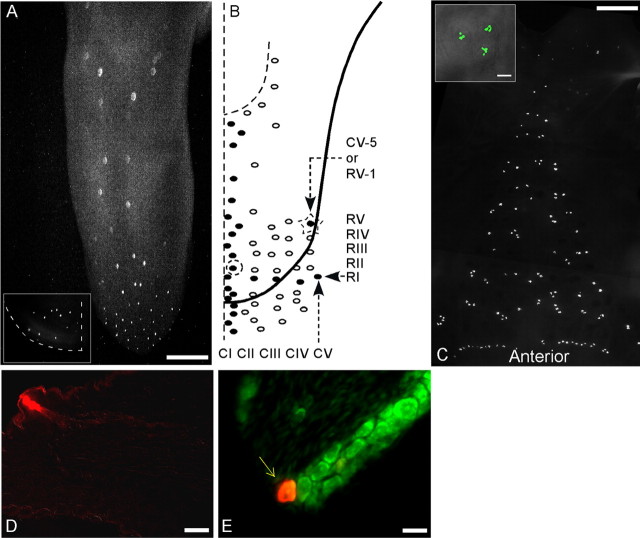
On the tongue, a row of papillae was defined as a set of papillae arranged in a line perpendicular to the midline. Multiple rows can be recognized along the entire length of the tongue. The number of papillae in each row varies from one to six. Five rows at the anterior tongue (namely RI, RII, RIII, RIV, and RV) are usually complete (each consists of at least five papillae) and distinct (see Fig. 1). The three rows RIII, RIV, and RV are well exposed and can easily be accessed for microinjections. Other rows are often incomplete, convoluted, misaligned, and/or confusing and thus were disregarded in the present study. A few rows are also present on the ventral surface of the tongue. Taste papillae within rows were numbered one to six, starting from the periphery and ending at the midline. Likewise, a column of papillae was defined to be the set of papillae on a line running parallel to the midline of the tongue. The column closest to the midline was named CI (C for column and roman numeral one), and CV (column 5) is the farthest column from the midline (see Fig. 1). At the anterior tip of the tongue, all columns turn downward and backward ventrally. Numbering of column papillae started with the anterior-most bud (last bud on the ventral surface) and ended with the papilla at the lower margin of the intermolar eminence. For example, bud CI-10 (column 1, bud 10) is the 10th bud of the column nearest to the midline starting from the first bud on the ventral surface of the tongue (see Fig. 1). Rows RI–RV correspond to five buds of column 5 (CV). RV-1 is the first papilla of row 5 that is coincident with the last papilla of column CV-5. Rows RIII, RIV, and RV were the most accessible rows for injections.
Figure 1.
Fungiform taste papillae in mice are arranged in anteroposteriorly running columns that allow for identification of specific papillae across animals. A, Columns of taste buds are clearly evident in fluorescence microscopic imaging of a transgenic mouse expressing GFP in receptor cells that also express gustducin. One-half of the ventral surface of the anterior tongue is shown in the inset. B, Right, Columns are numbered from CI to CV from the midline toward the periphery. Papillae in each column were assigned an identity, counting from anterior to posterior [e.g., CV-5 (bud marked by a star) is the fifth bud of column 5 that is also the first bud of the row 5]. Also shown is bud CI-9 (circled). There are only five complete rows on the dorsum of the tongue, RI–RV (see Materials and Methods), numbered anteriorposteriorly. Buds within each row are numbered from the periphery toward the midline. This drawing is a representation of a representative tongue as observed under the microscope; it is also used as a template for drawings in all of the subsequent figures. Buds depicted outside the boundary of the drawing represent the ventral buds. C, Buds on the palate seen as expressing GFP are scattered but usually appear in clumps of two, three, or four. The clumps occur in small groups within circular patches with a lighter density than surrounding palatal epithelium (inset). In the Geschmacksstreifen (at bottom), buds are closely spaced in an even row. Anterior is at the bottom of the figure. D, A fungiform bud injected with DiI exhibits the fluorescent marker in the bud. The marker labels a taste bud and is confined to a single fungiform papilla. E, Twenty-micrometer-thick section of a geniculate ganglion shows the localization of DiI (iontophoresed via the taste bud) inside one taste neuron (arrow). All neurons were labeled by green-fluorescent Nissl stain (green neuronal marker). Scale bars: A, C, 1 mm; D, inset in C, 100 μm; E, 20 μm.
Tissue histology and microscopy.
After a postinjection survival time of 48 h, the animals were anesthetized and perfused with 4% paraformaldehyde in normal saline. Tongues and ganglia were removed and left in 4% paraformaldehyde for 2 h, which was then followed by PBS or 30% sucrose (for tissue that was sectioned) infiltration overnight. Whole ganglia and 20-μm-thick sections of the tongues were examined under a confocal fluorescent microscope (MRC1024; BioRad Microscience, Cambridge, MA) with the confocal scan head on a Nikon (Melville, NY) E800 upright microscope. Ganglia were mounted such that their ventral surfaces lay flat on the surface of the slide. The dorsoventral thickness of the ganglion was divided into 45–50 optical sections (along the z-axis). Each confocal section was scanned three times, and the averages of these scans were collected along the entire thickness of the ganglion. Likewise, the same ganglion was imaged for other dyes by using the corresponding laser settings (without disturbing the ganglion or the scan parameters). Finally, a transmission (bright-field) image was also collected. Optical images thus obtained were exported into Adobe Photoshop CS2 software (version 9.0; Adobe Systems Incorporated, San Jose, CA) for detailed analysis (see below). A few labeled ganglia were embedded, sectioned at 12 μm, and stained with the Nissl green (Invitrogen), a neuronal cell marker, to confirm the identities of the dye-filled cells. All labeled cells were found to be neurons, not glia (see Fig. 1E).
Image analysis.
All 50 confocal images (corresponding to each dye) were superimposed and flattened (along one axis) into one final image. This merged image was pseudo colored and overlapped (merged transparent) with other color images (corresponding to two other dyes) using Adobe Photoshop (Adobe Systems Incorporated). Cells were colored red, blue, and green as a result of labeling with DiI, DiD, and DiO, respectively. Likewise, confocal optical series of images were also analyzed along the x- and y-axes. Colocalization of dyes in a single neuron was affirmed by studying the merged images at all three dimensions (see Fig. 6B).
Figure 6.
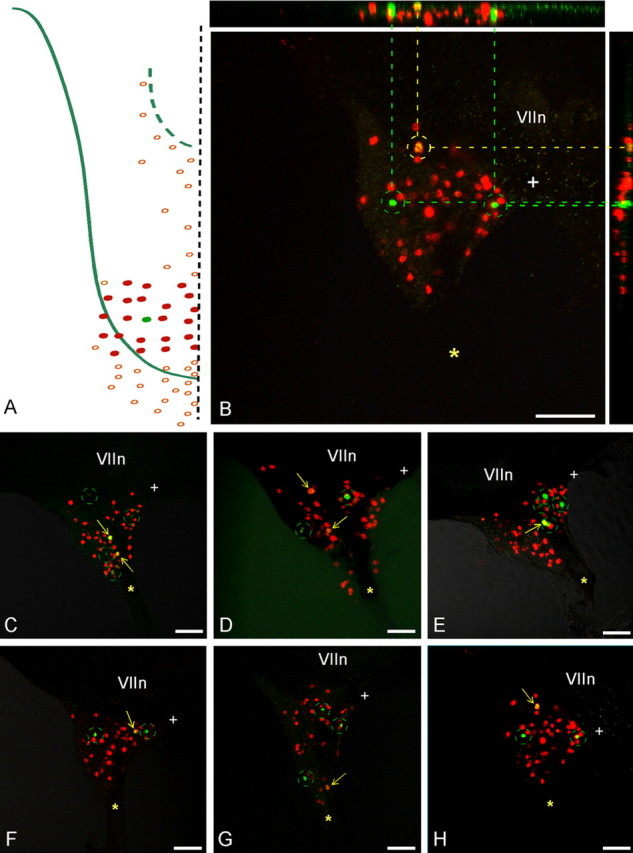
Injections of many papillae to test for peripheral fiber collaterals of geniculate ganglion reaching more than one bud. A, A single bud (RIII-3) was injected with DiO, and 20–22 buds immediately surrounding (two concentric rings) were injected with DiI. B, The merged image shows two cells labeled with DiO only (green circles), many cells labeled with DiI (red), and a single cell double labeled (yellow circle). The side panels show the confocal z-axis series merged along the y-axis (horizontal) and x-axis (vertical) [i.e., the ganglion viewed from the side in two cardinal axes, establishing that the one double-labeled cell (linked by yellow dashed lines) is not a misinterpretation of two overlapping cells bearing the different markers at different z planes]. C–H, Six additional cases, each with a central papilla injected with DiD and the surrounding 20–22 papillae injected with DiI. In every case, there are a few cells labeled with DiD alone (green circles), a vast majority of cells labeled with DiI alone (red cells), and a single cell (rarely two cells) double labeled with both markers (arrows). Scale bars, 100 μm. The asterisk marks the GSP nerve, whereas the + symbol marks the central (toward brain) corner of the ganglia. VIIn marks the VII cranial nerve.
Papillae counts.
Mouse tongues, previously fixed with 4% paraformaldehyde, were dissected and stained with 0.5% methylene blue to enhance the visual contrast between the taste papillae and the surrounding filiform papillae. The stained tongue was then studied under the surgical microscope. Maps of the distribution of taste papillae were drawn. The upper margin of the side of the intermolar eminence was chosen to be the starting point, whereas the extreme tip of the tongue was the end point. Papillae on the underside of the tip were mapped separately by flipping the tongue upside down. Because a few taste papillae on the dorsal surface and most on the ventral surface of the tip lack their typical morphology, they were difficult to visualize and count. Therefore, tongues from transgenic mice expressing green fluorescent protein (Gγ13 GFP) were used for taste bud counts. In these animals, Gγ13 promoter was used to drive GFP in taste receptor cells present in most taste buds. This allowed buds to be readily identified. These counts were used to ascertain the reliability of bud numbers and patterns seen in wild-type animals. GFP-expressing papillae were counted using a fluorescence dissection microscope. The same tongues were later stained with 0.5% methylene blue and recounted. The results were consistent with counts of GFP-fluorescent buds. Similarly, buds on the surface of the soft palate and inside the nasoincisor duct of GγGFP animals were counted and mapped. Palate counts do not include buds on the epiglottis.
Geniculate neuron (innervating the anterior tongue) counts.
To count taste-specific neurons in the geniculate ganglion innervating the entire anterior tongue unilaterally, the chorda tympani nerve was exposed in the middle ear by removing the tympanic membrane in anesthetized animals. The nerve was cut, and the central stump was painted with the mixture of three dyes (DiI, DiD, and DiO). After a 48 h survival time, ganglia were removed and imaged under the confocal microscope. Labeled cells, corresponding to each dye, were counted from digitally magnified images.
Ganglion mapping.
Outer margins of the triangular ganglion (merged along the z-axis) were traced, and the midpoints (x, y, and z) (see Fig. 10C) were connected to each other. The internal triangle thus formed was termed “I” (or internal) triangle. The triangle toward the greater superficial petrosal (GSP) corner was termed “G,” the triangle toward the peripheral corner was termed “P,” and the triangle toward the central corner was termed “C” (toward the brain). Labeled cells in each triangle were mapped and counted separately for each color.
Figure 10.
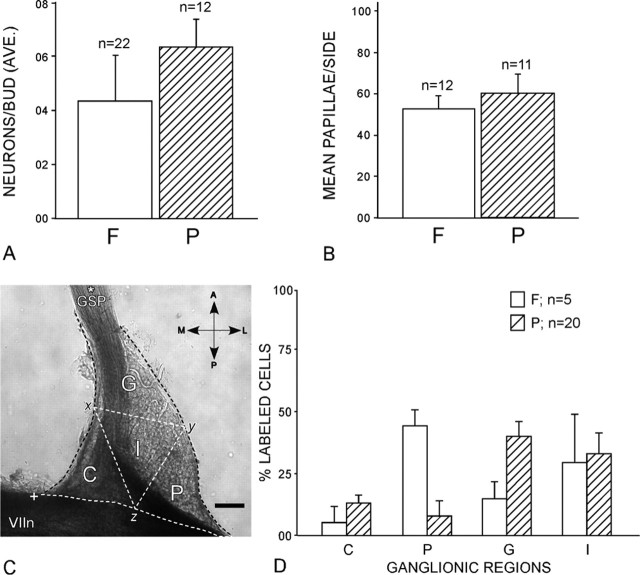
A, The average (AVE.) number of geniculate ganglion cells innervating single buds in the palate (P) is similar to the number innervating fungiform buds (F). B, The numbers of taste buds per side in the fungiform lingual field (F) and in the palate (P) are equivalent. C, Regions of the ganglion in which labeled neurons were counted after fungiform or palatal bud injections (results in D). Each ganglion was mapped by dividing it into quadrants as follows: C, central region (i.e., toward the brain); G, GSP region (at its origin); P, peripheral region (the lateral ganglion); I, internal region. The locations are as follows: A, anterior; L, lateral; P, posterior; M, medial. The triangular quadrants were defined by lines connecting the midpoint of the central surface of the ganglion (x) with the midpoint of the lateral surface (y) and the midpoint of the surface adjacent to the facial nerve (z). Scale bar, 100 μm. D, Topographic differences are for the peripheral region (P), where fungiform-innervating neurons were more prevalent than palate-innervating neurons, and the GSP region (G), where palatal neurons predominated. The asterisk marks the GSP nerve, whereas the + symbol marks the central (toward brain) corner of the ganglia. VIIn marks the facial nerve. Error bars represent SDs.
Results
Single taste bud injections
Fungiform papillae bearing taste buds are arranged in linear arrays on the mouse tongue (Jung et al., 1999, 2004). Extending anteriorly from the intermolar eminence, a series of five parallel columns of buds can be easily recognized on each side of the tongue (Fig. 1A,B). The anterior-most buds of these columns wrap around the tip of the tongue onto its ventral surface for a short distance. Perpendicular to the columns, the buds are arranged in loosely aligned rows. Counting from the periphery toward the midline, and from the tongue tip posteriorly, identified buds for injection (see Materials and Methods). Identified buds, sometimes the same bud in different animals, were targeted for iontophoretic injections of fluorescent tracers in the present series of experiments. Injection parameters were standardized to achieve optimum labeling of the bud without any spillage into the neighboring buds. Tongue histology confirmed that injections were confined to the taste bud (Fig. 1D).
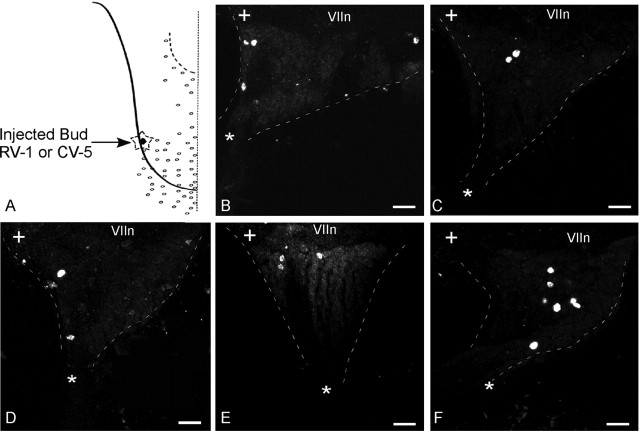
Injecting lateral bud CV-5, a readily accessible and consistently identifiable bud, with the retrograde tracer DiI resulted in retrograde labeling of a small number (two to eight) of geniculate ganglion cells. These cells were randomly scattered in the ganglion. Injecting the same bud in five different animals revealed no consistent ganglionic location of the few labeled cells (Fig. 2). After a single bud injection, the average number of labeled cells per geniculate ganglion was four (SD, 1.85; n = 22).
Figure 2.
Injecting the same taste bud in five different animals labels a small group of scattered cells in the geniculate ganglion (dashed outline). A, The injection site for each animal was CV-5 (star in A). B–F, Labeled cells in the geniculate ganglion numbered 2–7 by animal; there was no consistent location of the cells across animals, notwithstanding the same injected bud. The asterisk marks the GSP nerve, whereas the + symbol marks the central (toward brain) corner of the ganglia. VIIn marks the facial nerve. Scale bars, 50 μm.
Multiple taste bud injections
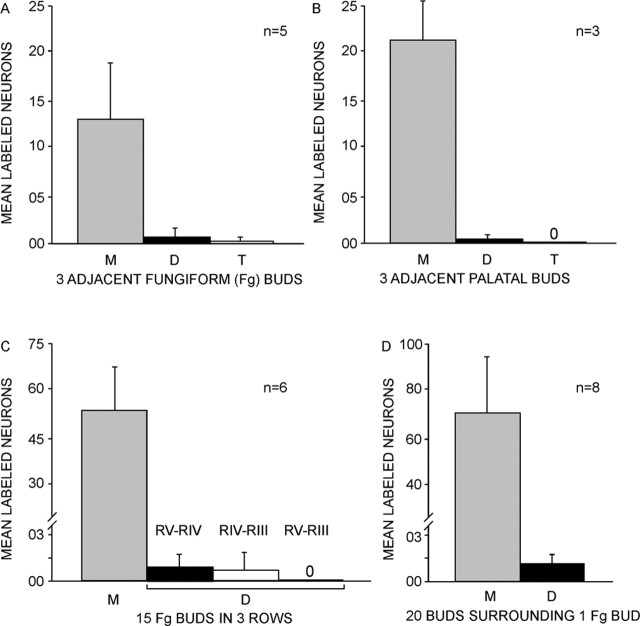
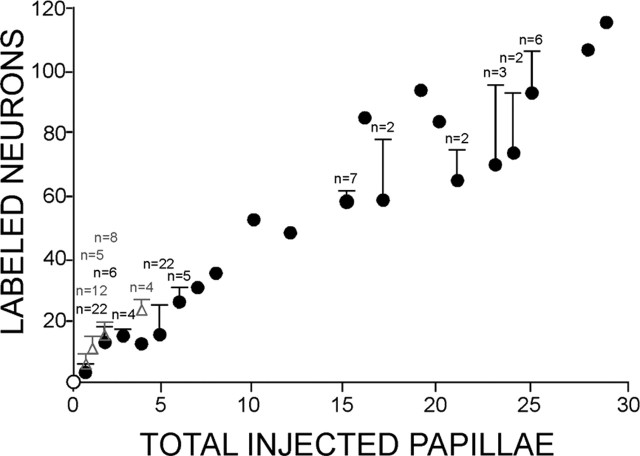
Three adjacent buds were injected to test whether a small patch of receptors was represented by a concentration of labeled cells with a discernible topography within the ganglion. The buds were injected with different color markers (DiI, DiD, and DiO) to identify the ganglion cells innervating each of the buds. The three injected buds were chosen randomly from each animal; all were near the tongue tip. Cells labeled by anterograde transport again were scattered throughout the ganglion (Fig. 3). Varying the locations of the injections did not reveal any pattern in the representation of patches on the tongue within the ganglion. Remarkably, the average number of ganglion cells labeled after injecting three buds (17 ± 1.29 SD; range, 15–18; n = 5) was quadruple the average number labeled after injecting a single bud (4 ± 1.85). The majority of ganglion cells were single labeled; only rarely were cells double labeled (see Fig. 11A). Cells in only two instances (3.6% of total cells) were triple labeled. Across all cases, including ones with many buds injected (see below), there was a close linear relationship between the number of injected buds and number of labeled ganglion cells. The number of neurons were typically multiples of four to five of the number of buds (Fig. 4). For example, injecting 15 buds label 58 (SD, 3.59; n = 7) and 25 buds label 95 (SD, 13.86; n = 6) ganglion cells.
Figure 3.
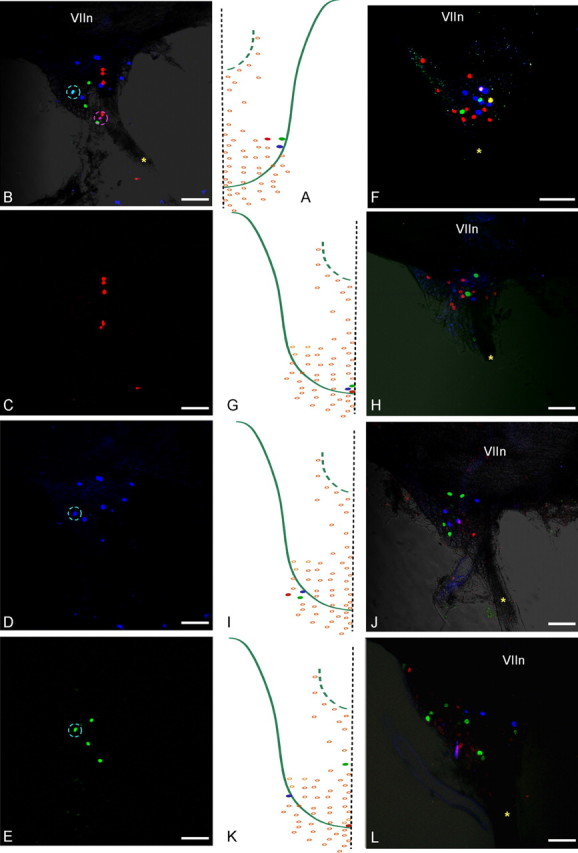
Injecting three adjacent buds with different color markers results in three separate groups of labeled neurons in the geniculate ganglion. A, Three adjacent buds, RIV-1, RV-1, and RV-2, were injected with DiD (blue), DiO (green), and DiI (red), respectively. B, Labeled ganglion cells from three buds in A, viewed with all three fluorescence settings, are predominantly single labeled and scattered in the ganglion. A double-labeled cell from RIV-1 and RV-1 injections is marked by the cyan circle (same cell circled in D and E); cells encircled in pink are two separate cells from RIV-1 and RV-2 buds as determined by confocal layer analysis. C–E, Cells innervating each bud imaged separately with the appropriate laser settings. G, I, Three adjacent buds injected with different color markers in two different regions show separate labeling of all ganglion cells (F, H, and J, respectively). K, Three widely separated buds (CI-6, CV-3, and CI-16) injected with the different markers. L, Separate labeling of ganglion cells. The asterisk marks the GSP nerve. VIIn marks the seventh cranial nerve. Scale bars, 100 μm.
Figure 11.
A, The average number of single-labeled ganglion cells (M) vastly outnumber double (D)- or triple (T)-labeled cells after injecting three adjacent fungiform buds with different color dyes (no triple-labeled cells). B, Similarly, single-labeled ganglion cells predominate after injection of three nearby palatal buds with different dyes. C, Injecting three adjacent rows with different dyes yielded many single-labeled and few double-labeled ganglion cells as in A. Only neurons innervating adjacent rows (RV and RIV, RIV and RIII, but not RV and RIII) were labeled, but rarely. D, Single-labeled cells, after injecting concentric rings of 20–22 buds with one color dye and a central bud with a different color dye predominate; the rare incidence of double labeled cells is similar to that in A. Error bars represent SDs.
Figure 4.
The numbers of labeled geniculate ganglion cells increase proportionately with increasing numbers of injected papillae. This plot includes most of the data in the present series of experiments, including controls (open circle; chorda tympani nerve was cut before the injections). Filled circles with error bars represent averages for fungiform tongue injections; those without error bars are single cases. Gray triangles represent palatal bud injections. Error bars represent SDs for each type of experiment (e.g., one bud injected per animal, five buds injected per animal, etc.; n = number of cases by type).
Several types of control experiments tested for the relative effectiveness of the three fluorescent markers and for possible collateral branches of ganglionic fibers that might have escaped detection with the three bud injections. Injecting a single bud with a mixture of DiI, DiO, and DiD retrogradely labeled geniculate ganglion cells, in this case with similar effectiveness; all cells were triple labeled (Fig. 5A–E). In most repetitions of this mixed dye injection, some multiply labeled ganglion cells contained variable amounts of each of the three markers, probably reflecting the physical chemistry of the dye mixture and possible limited miscibility of the reagents at the injection site. An additional control, on a bigger scale, labeling the chorda tympani nerve with the three markers, retrogradely labeled the majority of geniculate ganglion cells; all were triple labeled (Fig. 5F–L). Despite the close proximity of the buds in the three neighboring bud-injection cases (and the possibility that fibers innervating one bud might also innervate its neighbor by a branch), only once were double-labeled cells seen. To rule out the possibility of a thin collateral branch, harboring very little dye, and missing detection (weak fluorescence emission) or to unmask uncommon doubly innervated buds, all buds in two concentric rings (20+ buds) were injected first with one dye (DiI), except for the central bud, which was injected with a second contrasting dye (DiO) (Fig. 6). In every case, three to five ganglion cells were labeled with the second marker, whereas a vast majority was labeled only with the first marker (see Fig. 11D). Thus, collateral branches, even if sparse, were rare. Strikingly, in the typical case, only one cell (rarely two) (Fig. 6C–E, arrows) was double labeled. All of the other cells were purely single labeled (circled green in Fig. 6B–H). This indicates that only a fraction of ganglion cells send collaterals to multiple surrounding buds, whereas most of the neurons exclusively innervate one bud.
Figure 5.
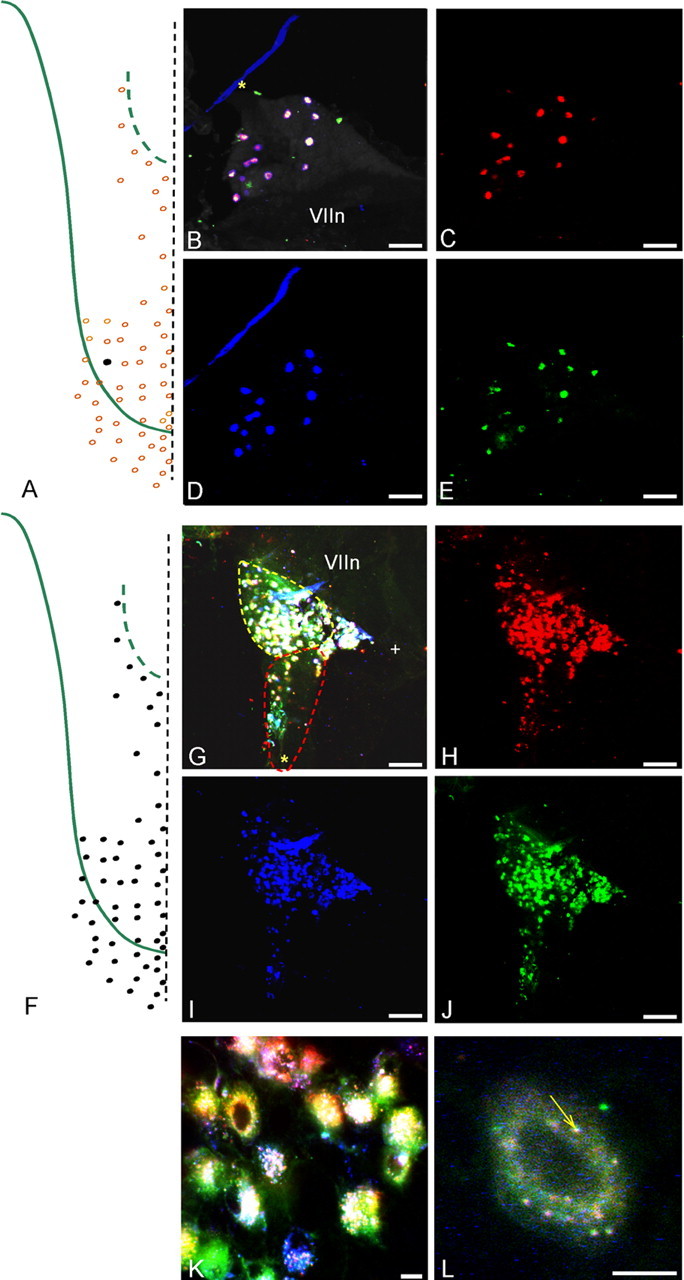
A–E, Injecting a single bud (RIII-2) with an equimolar mixture of the three dyes used in the present study (DiI, DiD, and DiO), a control for the equal effectiveness of dye uptake, labeled all of the same ganglion cells with every marker. A, Injection site. B, Merged image of all three colors showing all triple-labeled cells (white containing). The pink cast of some cells reflects the variable intensity of labeling because of physical chemistry of dye miscibility at the injection site. The blue line and green patches are artifacts. C–E, Separate images of each marker viewed with the appropriate fluorescence settings. F–L, All chorda tympani nerve fibers innervating taste buds (F) were labeled with an equimolar mixture of the three dyes. G, Most ganglion cells in the merged image of all three colors were triple labeled. H–J, Separate images of each marker viewed with the appropriate settings. K, L, Higher-magnification view showing that each marker could be discerned inside the cells as different colored vesicles, some of which show precise overlap of all three colors (white puncta at arrow in L). Scale bars: B–E, G–J, 100 μm; K, L, 10 μm. The asterisk marks the GSP nerve, whereas the + symbol marks the central (toward brain) corner of the ganglia. VIIn marks the facial nerve.
Specific innervation of buds by ganglion cells that do not branch to innervate neighboring buds was also confirmed by injecting identified, parallel rows of buds, each with a different fluorescent marker. Again, retrogradely labeled ganglion cells, with rare exceptions, bore only a single marker (Fig. 7). Double-labeled cells that were seen bore the marker of adjacent rows, never that of separated injected rows (see Fig. 11C). There was no apparent topography, no evidence that the stripes were represented by patterns in the ganglion. A similar approach was used to compare the distribution of labeled ganglion cells after injecting columns in different locations versus rows, with no apparent topography (Fig. 8).
Figure 7.
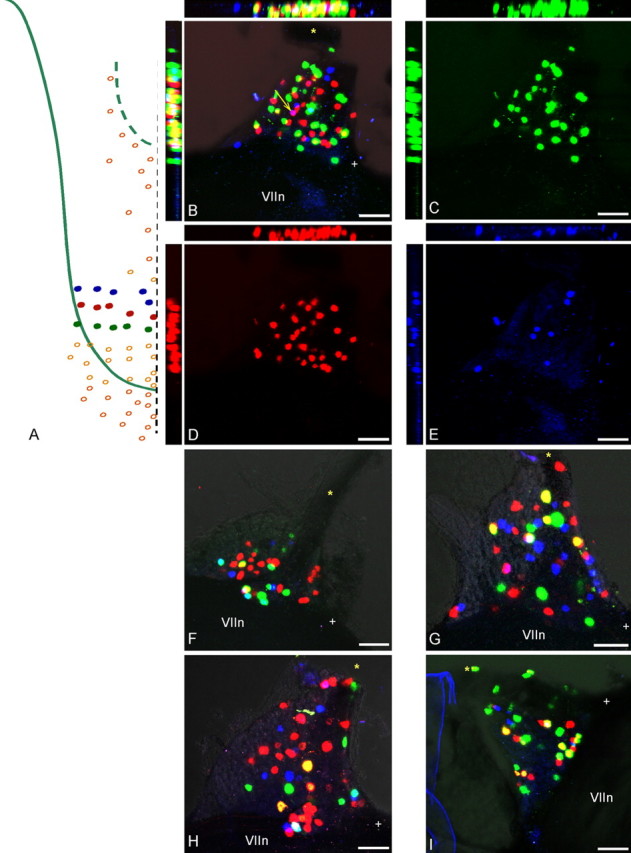
Injections of three adjacent rows of papillae with different color markers in attempts to reveal a corresponding topographic pattern in the geniculate ganglion. A, All five to six papillae of rows RIII, RIV, and RV were injected with DiO, DiI, and DiD. B, Merged image of all three colors shows apparently dispersed and random distributions of labeled cells; in this case, only one cell was double labeled (arrow). C–E, Individual images of each marker that were combined in B. The side panels show the confocal z-axis series merged along the y-axis (horizontal) and x-axis (vertical). F–I, Four additional cases showing merged views of all three markers after injections as in A. The few double-labeled cells were either yellow or pink (i.e., all double-labeled cells bore the labels from two adjacent rows only). The facial nerve (VII) is at the bottom of each figure. Scale bars, 100 μm. The asterisk marks the GSP nerve, whereas the + symbol marks the central (toward brain) corner of the ganglia.
Figure 8.
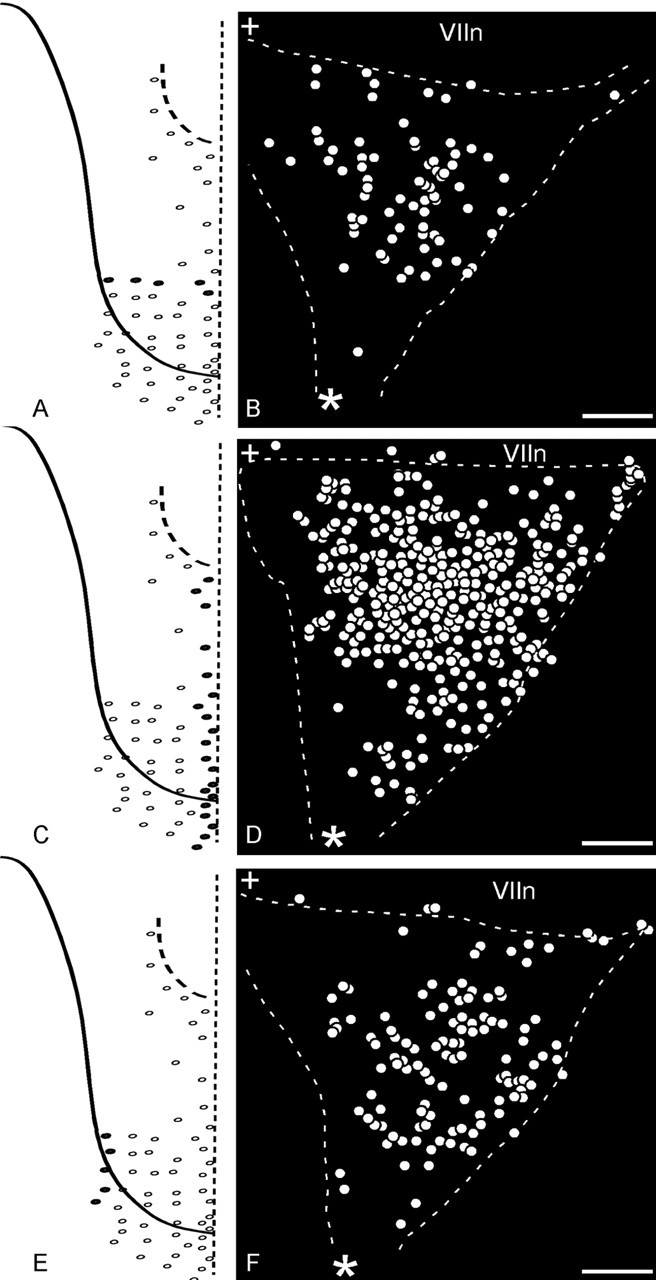
Distribution of ganglion cells after three different patterns of papillae were injected. A, Row injection of markers in five papillae of RV in four different animals resulted in the distribution of ganglion cells in B. Individual ganglia were aligned (such that their three corners overlapped) and superimposed, and the data were merged together. To enhance the clarity, white circles in the summary diagram of the ganglion replaced all labeled cells. C, Medial column injection of ∼20 papillae of CI in five animals resulted in the distribution of ganglion cells in D. E, Lateral column injection, of five papillae of CV in five animals resulted in the distribution of ganglion cells in F. The facial nerve VII runs parallel to the dashed line at the top of each figure. The asterisk represents the GSP nerve, and the + symbol represents the central stump of the VII nerve (toward brain) corner of the ganglia. Scale bars, 100 μm.
Bud and ganglion cell numbers
Counts of fungiform taste buds determined that an average of 52 ± 3.62 buds (n = 12) are present on each side of the anterior tongue and 60 ± 9.4 buds (n = 11) are present on each side of the palate (see Fig. 10B). Counts of geniculate ganglion cells determined that an average of 213 ± 6.24 cells (n = 3) innervate the fungiform field on each side of the anterior tongue. Thus, ganglion cells outnumber the fungiform buds they innervate 4–5:1.
Palate bud injections
Adjacent buds in the soft palate were injected with contrasting markers to test for innervation specificity and topography of ganglion cells for comparison with those innervating lingual buds. As with lingual buds, individual buds in the palate are innervated by small groups of five to eight ganglion cells (average, 6.41; SD, 1.16; n = 11) that exclusively innervate a bud but not its near neighbor; the neighbor is innervated by a separate group of ganglion cells (Figs. 9A–E, 11B) . One pattern in the distribution of ganglion cells innervating the palate that was apparent in every case of adjacent bud injection was their peripheral concentration within the ganglion, especially near the point where the GSP exits the ganglion. Injecting many buds in the palate and many buds on the anterior tongue with a contrasting marker established that ganglion cells innervating the tongue were prevalent in the area of the ganglion adjacent to the facial nerve, surrounded by a complimentary distribution of ganglion cells innervating the palate that were concentrated near the GSP (Fig. 9F,G).
Figure 9.
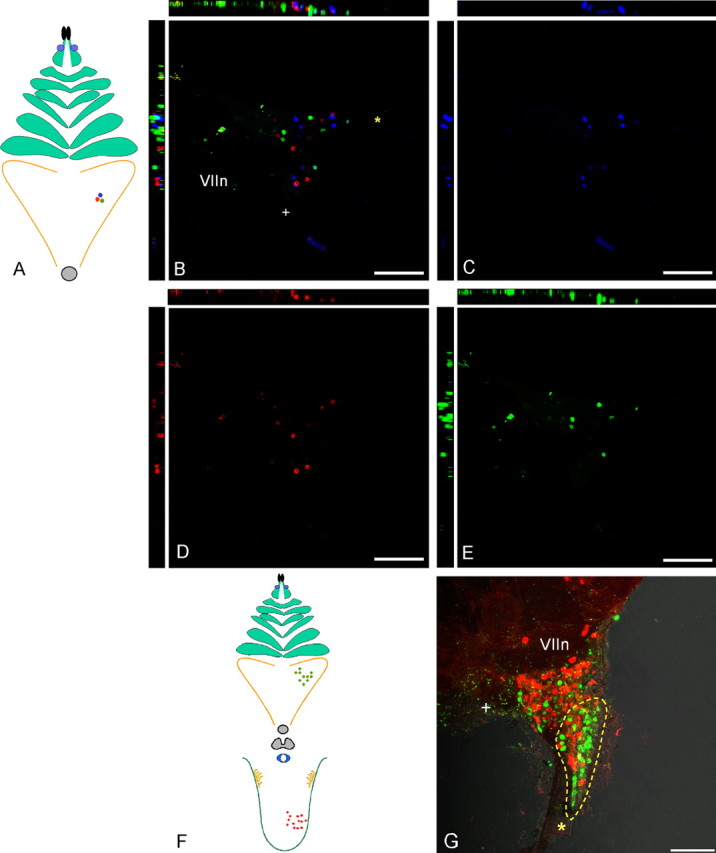
Distribution of ganglion cells labeled after injection of buds on the soft palate. A, B, Injecting three adjacent buds with different color markers results in three separate groups of labeled neurons in the geniculate ganglion (B). C–E, Individual images of each marker that were combined in B. Note the concentration of labeled cells surrounding a central void (near VII and +) in the ganglion. F, Injection of many buds on the soft palate with one marker and papillae on the anterior tongue with a contrasting marker results in regional and complementary concentrations of only single-labeled cells. G, Palate-innervating cells toward the GSP (yellow outline) and lingual-innervating cells toward the central (+) area of the ganglion adjacent to the facial nerve. Scale bars, 100 μm. The asterisk marks the GSP nerve, whereas the + symbol marks the central (toward brain) corner of the ganglia. VIIn marks the facial nerve.
Preferred distribution of ganglionic cells innervating palate and fungiform papillae
Counts of geniculate cells in four equal and precisely defined sectors of the ganglion showed that neurons innervating fungiform buds predominate (47%;SD, 8.99; n = 5) in the area of the geniculate that lies laterally near the entry point of the chorda tympani fibers (“P,” peripheral stump of facial nerve VII). In contrast, >40% (SD, 16.98; n = 5) of the total cells connecting the palate taste buds concentrate rostrally near the GSP exit (“G”) (Fig. 10C,D). Notably, G has only 16% (SD, 12.99; n = 5) cells of the total cells innervating the front of the tongue, whereas P has only 8% (SD, 9.23) of the total palate cells. The internal and central domains showed no preference and were populated equally by both palatal and lingual neurons.
Hamster bud injections
A control for failure of collaterals to label because of possible technical problems encountered in the three bud injection experiments was to label three adjacent buds in a species with ganglion cells known to have collaterals (e.g., the hamster) (Whitehead et al., 1999). The result was a higher incidence (23 cells or 35.3% of total labeled cells) of double-labeled geniculate ganglion cells in hamster, in contrast to the mouse (6 cells or 5.4% of total) (Fig. 12). The numbers of double-labeled cells were significantly increased [p < 0.001 in the hamster (n = 5 ganglia; 4.60 ± 1.67 SD) compared with the mouse (n = 7 ganglia; 0.86 ± 0.9 SD)].
Figure 12.
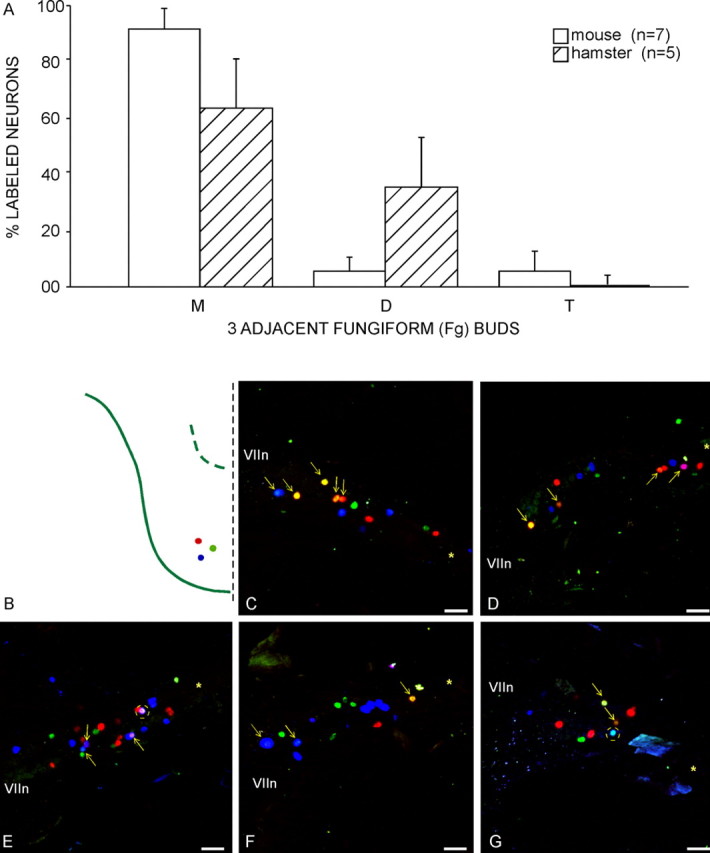
Injecting three adjacent buds in the hamster reveals a significant incidence of ganglion peripheral fiber branching among taste buds. A, Populations of single- and double-labeled ganglion cells in the hamster have a different profile than that for mice. The percentage of cells double labeled through fiber collaterals, known for the hamster (Whitehead et al., 1999), is markedly greater (35.3%) than in the mouse (5.4%). Error bars represent SDs. M, Single labeled; D, double labeled; T, triple labeled. B, Three adjacent buds, injected with different color markers in the same approximate sector of the tongue tip in hamster, multiply labels a notable subset of ganglion cells (4 cases; C–G; arrows, double labeled; circles, triple labeled) (compare with Fig. 3 for mouse). The asterisk marks the GSP nerve, whereas the + symbol marks the central (toward brain) corner of the ganglia. VIIn marks the seventh cranial nerve. Scale bars, 100 μm.
Discussion
Bud units in mouse
The principal finding made after injections of single murine buds with contrasting markers is that each bud, whether on the tongue or palate, is innervated by a small group of ganglion cells that innervate single buds exclusively. This discrete innervation pattern for the mouse, with predominantly unbranched ganglion cells, contrasts with reports of branching nerve fibers in the anterior tongue reaching several buds in rats and hamsters (Miller, 1971, 1974; Whitehead et al., 1999). This discrepancy could reflect true differences between species or technical differences between studies. In the rat, collections of silver-stained nerve fibers were described as branching below the taste bud (Miller, 1974). However, with silver staining it is difficult to resolve individual fibers or their branches. Electrophysiological study in rats found that single fiber responses to chemical stimulation of one papilla could also be obtained by electrical stimulation of nearby papillae (Miller, 1971) (<50% of fibers responded exclusively to one papilla). In cats, single geniculate ganglion cells responded to electrical stimulation of single buds in only one-fifth of tested neurons; four-fifths responded to two to five nearby buds (Boudreau et al., 1971). More recently, a similar result was obtained in sheep using more refined methods (Nagai et al., 1988). Thus, species differences in the selectivity of bud innervation by single ganglion cells seem likely.
Miller (1971) referred to the single afferent taste fiber and the papillae that supply its input as a “peripheral nerve fiber unit.” We have adopted a modification of this phrase, termed here as “bud unit,” to name the predominant receptoneural arrangement in mouse taste. A bud unit is a taste bud and the small group of ganglion cells that exclusively innervate it. A mouse’s bud units are remarkably discrete; only rarely do geniculate ganglion cells innervate two or more buds. Injecting adjacent buds in a mouse with different color dyes did not yield significant numbers of double- or triple-labeled ganglion cells. Moreover, control experiments in which one bud was injected with one marker, whereas all other surrounding buds (as many as 20–22) were injected with a contrasting marker, did not increase the number of double-labeled cells. Thus, the discrete innervation of mouse buds appears certain. A recent study of hamster fungiform bud innervation using iontophoretic application of tetramethyl rhodamine dextran to single buds labeled nerve fibers and their endings that terminated in three to five buds nearby the injected bud (Whitehead et al., 1999). This finding was interpreted as indicating that the marker labeled collaterals of fibers innervating the injected bud. If so, then the innervation pattern for the hamster would be expected to be more diffuse than that in the mouse. This was confirmed in the present control injections of three adjacent buds in hamsters, a repetition of the experiments done in mice. The marked increase in double-labeled hamster ganglion cells verified the significant incidence of branching of ganglion cell peripheral fibers in this species. Moreover, as a technical control, the increased multiple labeling in hamsters indicates that when collaterals are present they can successfully transport the lipophilic dyes to the ganglion.
Numbers of ganglion cells innervating single buds
An average of four to six geniculate ganglion cells innervate single taste buds in the mouse, whether on the anterior tongue or palate. This number suggests that fewer ganglion cells innervate fungiform taste buds in mice than in other species [e.g., rats (2–16) (Krimm and Hill, 1998) and hamsters (5–35) (Whitehead et al., 1999)]. Remarkably, however, in hamsters, when the number of geniculate ganglion cells innervating the tongue is divided by the number of fungiform buds, the result is four. Thus, if peripheral fiber branching were not present in hamsters, the ratio of ganglion cells to bud would be the same as in mice. In rats, the numbers of geniculate ganglion cells innervating single buds varies from 2 to 16 depending on the bud volume and the age of the animal (Krimm and Hill, 1998). Notwithstanding the difficulty tracing silver-stained fibers between sections and through purported branch points, all of the drawings of fibers innervating fungiform papillae in rats show, consistent with the present results, three to seven fibers per bud (Miller, 1974).
The small number of ganglion cells that innervate mouse taste buds has several implications for taste information coding and transmission to the brain. First, because the number of receptor cells in a bud (50–150) (Kinnamon, 1987) outnumber the innervating neurons by a factor of 10–30, the fiber of each ganglion cell either branches to innervate many cells within the bud, or it innervates only a small subset of available cells, at least at any time point. The latter possibility is supported by ultrastructural analysis of serially sectioned taste bud cells (Kinnamon et al., 1993; Royer and Kinnamon, 1994). Second, whatever the synaptic partners of the small group of innervating ganglion cells, the scarcity of collaterals as presently defined in mice requires that the electrophysiological responses of single primary neurons will usually reflect the activation of a single bud. Finally, the small number of innervating neurons may bear some relationship to the variety and small number of specific types of receptor cells in a single bud, some of which express a distinct heterodimer of two receptor proteins for sweet or umami taste, or a family of bitter receptors for bitter taste (Chandrashekar et al., 2000; Nelson et al., 2001). For example, cells expressing bitter receptors are distinct from those expressing sweet and number only a few per bud (Nelson et al., 2001). A caveat, however, is that the receptors for salt and sour tastes are not fully understood. Neither can coexpression of these latter receptors with bitter, sweet, and umami receptors be ruled out (Caicedo et al., 2002). Moreover, some single geniculate neurons are broadly sensitive to sodium salts, nonsodium salts, and acids. Nevertheless, in light of the presently reported relationship of four to five ganglion cells to one bud, we can speculate that each neuron may transmit information related to only one of the four to five commonly recognized taste qualities. Although the present data on the bud–ganglion cell wiring does not bear directly on taste quality coding, it is consistent with such a hypothesis and with the specificity of responses recorded from some ganglion cells and their peripheral fibers. On the other hand, the present results cannot rule out the possibility that branches of single fibers may synapse with several different types of receptor cells within a single bud, accounting for broad sensitivity (Boudreau, 1971; Frank, 1973; Pfaffmann et al., 1979; Frank et al., 1988; Lundy and Contreras, 1999; Breza et al., 2005; Sollars and Hill, 2005).
Taste bud–geniculate ganglion topography
Many patterns of buds on the tongue were labeled to test for a possible spatial representation of fungiform buds in the geniculate ganglion; none was apparent. Specific regions of buds on the tongue do not appear connected to cells in certain regions of the ganglion. Rather, in every peripheral pattern attempted, the ganglion cells appear randomly scattered. This result is consistent with previous attempts to discern such a topography in other species [in rat (Krimm and Hill, 1998), in hamster (Whitehead et al., 1999)]. However, although a topography of buds in the ganglion is not apparent, it remains conceivable that there may be a functional topography of ganglion cells based on the quality of receptor cells innervated (i.e., sweet, bitter, sour, salty, and umami). Such an arrangement would be similar to that in the olfactory system (Mombaerts et al., 1996; Gao et al., 2000; Vosshall et al., 2000). Moreover, as with olfaction, a pattern may be evident in the projections to the brain (i.e., within the NTS) for the different types of ganglion cells. Establishing this for taste is at the limits of our current technology. It would require point-to-point mapping by labeling all of the same quality receptor cells with a trans-synaptic marker or by engineering mice that express trans-synaptic proteins in all cells that respond to a single quality (Sugita and Shiba, 2005).
Anatomically, however, on a larger scale, the ganglion cell populations innervating the two taste receptor fields are arranged topographically; cells innervating the tongue are segregated from those innervating the palate. Some correspondence between the topography of cells in the ganglion and taste quality can be inferred in light of the differential representation of palate and anterior tongue seen here, and the different functional types of neurons that innervate these regions. For example, palatal neurons, unlike those innervating the tongue, include a subset that responds with high frequency to sucrose stimulation [in rat (Sollars and Hill, 2005)]. Conceivably, sucrose is represented rostrally on the periphery of the geniculate ganglion. That broadly different receptor areas are represented by neurons in different regions of the ganglion is consistent with previous differential location of ganglion cells responsive to palate, anterior tongue, and ear stimulation in cat (Boudreau et al., 1971). Moreover, the unbranched nature of geniculate ganglion cell peripheral fibers is preserved in the representations of entire peripheral fields in the ganglion; geniculate ganglion cells innervate fungiform or palatal taste buds, but not both.
Footnotes
This work was supported by National Institutes of Health Grant RO1 DC01091. We thank Dr. Charles S. Zuker for supporting and guiding this research and Mary Verdin-Alczar for major contributions to histology.
References
- Boudreau JC, Bradley BE, Bierer PR, Kruger S, Tsuchitani C (1971). Single unit recordings from the geniculate ganglion of the facial nerve of the cat. Exp Brain Res 13:461–488. [DOI] [PubMed] [Google Scholar]
- Breza JM, Curtis KS, Contreras RJ (2005). Temperature modulates taste responsiveness and stimulates gustatory neurons in the rat geniculate ganglion. J Neurophysiol 95:674–685. [DOI] [PubMed] [Google Scholar]
- Caicedo A, Kim KN, Roper SD (2002). Individual mouse taste cells respond to multiple chemical stimuli. J Physiol (Lond) 544:501–509. [DOI] [PMC free article] [PubMed] [Google Scholar]
- Chandrashekar J, Mueller KL, Hoon MA, Adler E, Feng L, Guo W, Zuker CS, Ryba NJ (2000). . T2Rs function as bitter taste receptors. Cell 100:703–711. [DOI] [PubMed] [Google Scholar]
- Chuong CM, Chodankar R, Widelitz RB, Jiang TX (2000). Evo-devo of feathers and scales: building complex epithelial appendages. Curr Opin Genet Dev 10:449–456. [DOI] [PMC free article] [PubMed] [Google Scholar]
- Frank ME (1973). Analysis of hamster afferent taste nerve response functions. J Gen Physiol 61:588–618. [DOI] [PMC free article] [PubMed] [Google Scholar]
- Frank ME, Bieber SL, Smith DV (1988). The organization of taste sensibilities in hamster chorda tympani nerve fibers. J Gen Physiol 91:861–895. [DOI] [PMC free article] [PubMed] [Google Scholar]
- Gao Q, Yau B, Chess A (2000). Convergent projections of Drosophila olfactory neurons to specific glomeruli in the antennal lobe. Nat Neurosci 3:780–785. [DOI] [PubMed] [Google Scholar]
- Hamilton RB, Norgren R (1984). Central projections of gustatory nerves in the rat. J Comp Neurol 222:560–577. [DOI] [PubMed] [Google Scholar]
- Jung HS, Oropeza V, Thesleff I (1999). Shh, Bmp-2, Bmp-4 and Fgf-8 are associated with initiation and patterning of mouse tongue papillae. Mech Dev 81:179–182. [DOI] [PubMed] [Google Scholar]
- Jung HS, Akita K, Kim JY (2004). Spacing patterns on tongue surface-gustatory papilla. Int J Dev Biol 48:157–161. [DOI] [PubMed] [Google Scholar]
- Krimm RF, Hill DL (1998). Quantitative relationships between taste bud development and gustatory ganglion cells. Ann NY Acad Sci 855:70–75. [DOI] [PubMed] [Google Scholar]
- Kinnamon SC (1987). Organization and innervation of taste buds. In: Neurobiology of taste and smell (Finger TE, Silver WL, eds) New York: Wiley.
- Kinnamon SC, Henzler DM, Royer SM (1993). HVEM ultrastructural analysis of mouse fungiform taste buds, cell types, and associated synapses. Microsc Res Tech 26:142–156. [DOI] [PubMed] [Google Scholar]
- Lundy RF, Contreras RJ (1999). Gustatory neuron types in rat geniculate ganglion. J Neurophysiol 82:2970–2988. [DOI] [PubMed] [Google Scholar]
- McPheeters M, Hettinger T, Nuding S, Savoy L, Whitehead M, Frank M (1990). Taste-responsive neurons and their locations in the solitary nucleus of the hamster. Neuroscience 34:745–759. [DOI] [PubMed] [Google Scholar]
- Miller IJ (1971). Peripheral interactions among single papilla inputs to gustatory nerve fibers. J Gen Physiol 37:1–24. [DOI] [PMC free article] [PubMed] [Google Scholar]
- Miller IJ (1974). Branched chorda tympani neurons and interactions among taste receptors. J Comp Neurol 158:155–166. [DOI] [PubMed] [Google Scholar]
- Mombaerts P, Wang F, Dulac C, Chao SK, Nemes A, Mendelsohn M, Edmonson J, Axel R (1996). Visualizing an olfactory sensory map. Cell 87:675–686. [DOI] [PubMed] [Google Scholar]
- Nagai T, Mistretta CM, Bradley RM (1988). Developmental decrease in size of peripheral receptive fields of single chorda tympani nerve fibers and relation to increasing NaCl taste sensitivity. J Neurosci 8:64–72. [DOI] [PMC free article] [PubMed] [Google Scholar]
- Nelson G, Hoon MA, Chandrashekar J, Zhang Y, Ryba NJP, Zuker CS (2001). Mammalian sweet taste receptors. Cell 106:381–390. [DOI] [PubMed] [Google Scholar]
- Nelson G, Chandrashekar J, Hoon MA, Feng L, Zhao G, Ryba NJP, Zuker CS (2002). An amino acid taste receptor. Nature 416:199–202. [DOI] [PubMed] [Google Scholar]
- Pfaffmann C, Frank M, Norgren R (1979). Neural mechanisms and behavioral aspects of taste. Annu Rev Psychol 30:283–325. [DOI] [PubMed] [Google Scholar]
- Royer SM, Kinnamon JC (1994). Application of serial sectioning and three-dimensional reconstruction to the study of taste bud ultrastructure and organization. Microsc Res Tech 29:381–407. [DOI] [PubMed] [Google Scholar]
- Sollars SI, Hill DL (2005). In vivo recordings from rat geniculate ganglia: taste response properties of individual greater superficial petrosal and chorda tympani neurones. J Physiol (Lond) 564:877–893. [DOI] [PMC free article] [PubMed] [Google Scholar]
- Sugita M, Shiba Y (2005). Genetic tracing shows segregation of taste neuronal circuitries for bitter and sweet. Science 309:781–785. [DOI] [PubMed] [Google Scholar]
- Tilney LG, Tilney MS, DeRosier DJ (1992). Actin filaments, stereocilia, and hair cells: how cells count and measure. Annu Rev Cell Biol 8:257–274. [DOI] [PubMed] [Google Scholar]
- Vosshall LB, Wong AM, Axel R (2000). An olfactory sensory map in the fly brain. Cell 102:147–159. [DOI] [PubMed] [Google Scholar]
- Whitehead MC, Ganchrow JR, Ganchrow D, Yao B (1999). Organization of geniculate and trigeminal ganglion cells innervating single fungiform taste papillae: a study with tetramethylrhodamine dextranamine labeling. Neuroscience 93:931–941. [DOI] [PubMed] [Google Scholar]


