

Abstract
Many real-life decision-making problems incorporate higher-order structure, involving interdependencies between different stimuli, actions, and subsequent rewards. It is not known whether brain regions implicated in decision making, such as the ventromedial prefrontal cortex (vmPFC), use a stored model of the task structure to guide choice (model-based decision making) or merely learn action or state values without assuming higher-order structure as in standard reinforcement learning. To discriminate between these possibilities, we scanned human subjects with functional magnetic resonance imaging while they performed a simple decision-making task with higher-order structure, probabilistic reversal learning. We found that neural activity in a key decision-making region, the vmPFC, was more consistent with a computational model that exploits higher-order structure than with simple reinforcement learning. These results suggest that brain regions, such as the vmPFC, use an abstract model of task structure to guide behavioral choice, computations that may underlie the human capacity for complex social interactions and abstract strategizing.
Keywords: decision making, state-based inference, ventromedial prefrontal cortex, fMRI, reversal learning, Bayesian
Introduction
Adaptive reward-based decision making in an uncertain environment requires the ability to form predictions of expected future reward associated with particular sets of actions and then bias action selection toward those actions leading to greater reward (Platt and Glimcher, 1999; Sugrue et al., 2005). Reinforcement learning (RL) models provide a strong theoretical account for how this might be implemented in the brain (Sutton and Barto, 1998). However, an important limitation of these models is that they fail to exploit higher-order structures in a decision problem such as interdependencies between different stimuli, actions, and subsequent rewards. Yet, many real-life decision problems do incorporate such structures (Herrnstein, 1974; O’Doherty et al., 2001; Sugrue et al., 2004).
To determine whether neural activity in brain areas involved in decision making is accounted for by a computational decision-making algorithm incorporating an abstract model of task structure or else by simple RL, we conducted a functional magnetic resonance imaging (fMRI) study in which subjects performed a simple decision-making problem with higher-order structure, probabilistic reversal learning (O’Doherty et al., 2001; J. O’Doherty et al., 2003; Cools et al., 2002) (see Fig. 1A). The higher-order structure in this task is the anticorrelation between the reward distributions associated with the two options and the knowledge that the contingencies will reverse.
Figure 1.

Reversal task setup and state-based decision model. A, Subjects choose one of two fractals that on each trial are randomly placed to the left or right of the fixation cross. Once the subject selects a stimulus, it increases in brightness and remains on the screen until 2 s after the choice. After an additional 3 s, a reward (winning 25 cents, depicted by a quarter dollar coin) or punishment (losing 25 cents, depicted by a quarter dollar coin covered by a red cross) is delivered, with the total money earned displayed at the top of the screen. One stimulus is designated the correct stimulus, and the choice of that stimulus leads to a monetary reward on 70% of occasions and a monetary loss 30% of the time. Consequently, choice of this correct stimulus leads to accumulating monetary gain. The other stimulus is incorrect, and choosing that stimulus leads to a reward 40% of the time and a punishment 60% of the time, leading to a cumulative monetary loss. After subjects choose the correct stimulus on four consecutive occasions, the contingencies reverse with a probability of 0.25 on each successive trial. Subjects have to infer the reversal took place and switch their choice, and at that point the process is repeated. B, We constructed an abstract-state-based model that incorporates the structure of the reversal task in the form of a Bayesian HMM that uses previous choice and reward history to infer the probability of being in the correct/incorrect choice state. The choice state changes (“transits”) from one period to another depending on (1) the exogenously given chance that the options are reversed (the good action becomes the bad one, and vice versa) and (2) the control (if the subject switches when the actual, but hidden, choice state is correct, then the choice state becomes incorrect, and vice versa). Y, Observed reward/punishment; S, observed switch/stay action; X, abstract correct/incorrect choice state that is inferred at each time step (see Materials and Methods). The arrows indicate the causal relationships among random variables. C, Observed choice frequencies that subjects switch (black) or stay (gray) against the inferred posterior probability of the state-based model that their last choice was incorrect. The higher the posterior incorrect probability, the more likely subjects switch (relative choice frequencies are calculated separately for each posterior probability bin).
To capture the higher-order structure in the task, we used a Markov model (see Fig. 1B) that incorporates an abstract state variable, the “choice state.” The model observes an outcome (gain or loss) with a probability that depends on the choice state; if the choice state is “correct,” then the outcome is more likely to be high; otherwise, the outcome is more likely to be low. The observations are used to infer whether the choice state is correct or not. The crucial difference between a simple RL model and the (Markov) model with an abstract hidden state is that in the former model, only the value of the chosen option is updated and the valuation of the option that was not chosen does not change (see Materials and Methods), whereas in the latter state-based model, both choice expectations change: if stimulus A is chosen and the probability that the choice state is correct is estimated to be, say, 3/4, then the probability that the other stimulus, B, is correct is assumed to be 1/4 (= 1 − 3/4).
One region that may be especially involved in encoding higher-order task structure is the prefrontal cortex (PFC). This region has long been associated with higher-order cognitive functions, including working memory, planning, and decision making (Goldman-Rakic, 1996; Owen, 1997; Bechara et al., 2000). Recent neurophysiological evidence implicates PFC neurons in encoding abstract rules (Wallis et al., 2001; Genovesio et al., 2005). On these grounds, we predicted that parts of the human PFC would correlate better with an abstract state-based decision algorithm than with simple RL. We focused on parts of the PFC known to play an important role in reward-based decision making, specifically its ventral and medial aspects (Bechara et al., 2000; J. O’Doherty et al., 2003).
Materials and Methods
Subjects.
Sixteen healthy normal subjects participated in this study (14 right handed; eight females). The subjects were preassessed to exclude those with a previous history of neurological or psychiatric illness. All subjects gave informed consent, and the review board at the California Institute of Technology approved the study.
Task description.
Subjects participated in a simple decision-making task with higher-order structure, probabilistic reversal learning. On each trial, they were simultaneously presented with the same two arbitrary fractal stimuli objects (random left–right spatial position) and asked to select one. One stimulus was designated the correct stimulus in that choice of that stimulus lead to a monetary reward (winning 25 cents) on 70% of occasions and a monetary loss (losing 25 cents) 30% of the time. Consequently, choice of this correct stimulus lead to accumulating monetary gain. The other stimulus was incorrect in that choice of that stimulus lead to a reward 40% of the time and a punishment 60% of the time, thus leading to a cumulative monetary loss. The specific reward schedules used here are based on those used in previous studies of probabilistic reversal learning (O’Doherty et al., 2001; Hornak et al., 2004). After having chosen the correct stimulus on four consecutive occasions, the contingencies reversed with a probability of 0.25 on each successive trial. Once reversal occurred, subjects then needed to choose the new correct stimulus, on four consecutive occasions, before reversal could occur again (with 0.25 probability). Subjects were informed that reversals occurred at random intervals throughout the experiment but were not informed of the precise details of how reversals were triggered by the computer (so as to avoid subjects using explicit strategies, such as counting the number of trials to reversal). The subject’s task was to accumulate as much money as possible and thus keep track of which stimulus was currently correct and choose it until reversal occurs. In the scanner, visual input was provided with Restech goggles (Resonance Technologies, Northridge, CA), and subjects used a button box to choose a stimulus. At the same time that the outcome was revealed, the total money won was also displayed. In addition to the reversal trials, we also included null event trials that were 33% of the total number of trials and randomly intermixed with the reversal trials. These trials consisted of the presentation of a fixation cross for 7 s. Before entering the scanner, subjects were informed that they would receive what they earned, plus an additional $25. If they sustained an overall loss, then that loss would be subtracted from the $25. On average, subjects accumulated a total of $3.80 (±$0.70) during the experiment.
Prescan training.
Before scanning, the subjects were trained on three different versions of the task. The first was a simple version of the reversal task, in which one of the two fractals yielded monetary rewards 100% of the time and the other yielded monetary losses 100% of the time. These then reversed according to the same criteria as in the imaging experiment proper, in which a reversal was triggered with a probability of 0.25 after four consecutive choices of the correct stimulus. This training phase was ended after the subject successfully completed three sequential reversals. The second training phase consisted of the presentation of two stimuli that delivered probabilistic rewards and punishments as in the experiment, but in which the contingencies did not reverse. The training ended after the subject consecutively chose the correct stimulus 10 times in a row. The final training phase consisted of the same task parameters as in the actual imaging experiment (stochastic rewards and punishments, and stochastic reversals, as described above). This phase ended after the subject successfully completed two sequential reversals. Different fractal stimuli were used in the training session from those used in the scanner. Subjects were informed that they would not receive remuneration for their performance during the training session.
RL model.
RL is concerned with learning predictions of the future reward that will be obtained from being in a particular state of the world or performing a particular action. Many different varieties of RL algorithms exist. In this study, we used a range of well known RL algorithms to find the one that provided the best fit to the subjects’ choice data (see supplemental Fig. 1, available at www.jneurosci.org as supplemental material, for the comparison of behavioral fits between algorithms). The best-fitting RL algorithm was then compared against the state-based decision model for the results reported in the study. A description of the model-fitting procedure is below (see Behavioral data analysis).
The best-fitting algorithm to the subjects’ choice data was a variant of Q-learning (Watkins and Dayan, 1992), in which action values are updated via a simple Rescorla-Wagner (RW) rule (Rescorla and Wagner, 1972). On a trial, t, in which action a is selected, the value of a is updated via a prediction error, δ, as follows:
where η is the learning rate. The δ(t) is calculated by comparing the actual reward received, r(t), after choosing a with the expected reward for that action as follows:
When choosing between two different states (a and b), the model compares the expected values to select which will give it the most reward in the future. The probability of choosing state a is as follows:
where ς (z) = 1/(1 − exp(− z)) is the Luce choice rule (Luce, 2003) or logistic sigmoid, α is the indecision point (when it is equiprobable to make either choice), and β is the degree of stochasticity in making the choice (i.e., the exploration/exploitation parameter).
Abstract state-based model.
We constructed a Bayesian Hidden State Markov Model (HMM) (Ghahramani, 2001) that incorporates the structure of the probabilistic reversal learning task (see Fig. 1B) and that can be solved optimally with belief propagation techniques (Jordan, 1998). Xt represents the abstract hidden state (correct or incorrect choice) that subjects have to infer at time t. Yt represents the reward (positive) or punishment (negative) value subjects receive at time t. St represents whether subjects switched or stayed between time t − 1 and time t. The conditional probabilities linking the random variables are as follows:
 |
The first two conditional probabilities describe the transition probabilities of the hidden-state variable from trial to trial. If the subjects stay (make the same choice as in the previous trial) and their last choice was correct (Xt-1 = correct), then their new choice is incorrect (Xt = incorrect) with probability δ, where δ is the reversal probability (probability that the contingencies in the task reverse) and that was considered to be learned during training. Likewise, if the subjects stay, and their last choice was incorrect (Xt-1 = incorrect), then their new choice will be correct with probability δ. On the other hand, if subjects switch, with their last choice being incorrect, the new choice might still be incorrect with probability δ. The state transition matrices in Equation 4 incorporate the structural relationship between the reversing task contingencies and the subjects’ switches. To complete the model, we include the probability of receiving a reward, P(Y/X), given the state (correct or incorrect choice) the subjects are in. This was modeled as a Gaussian distribution, the mean of which is the expected monetary reward each state has. In the present task, the actual expected value of the correct choice is 10 cents and the expected value of the incorrect choice is −5 cents. However, to allow for possible variation in the accuracy of the subjects’ estimates of the expected values of each choice, we left these expected values as free parameters when fitting the Bayesian model to each subject’s behavioral data. Fitted parameters for the reversal probability and expected rewards were close to the actual experimental parameters (supplemental Table 1, available at www.jneurosci.org as supplemental material).
With P(X0) = (0.5,0.5) at the beginning of the experiment, Bayesian inference was performed to calculate the posterior probability of the random variable X (correct/incorrect choice) given the obtained rewards and punishments (variable Y) and the subjects’ switches (variable S) using causal belief propagation (Eqs. 5, 6). Equation 5 specifies the subjects’ “prior,” or belief that they will be at a given internal state at time t as a consequence of their choice St and the internal state “posterior” from the previous trial. Equation 6 updates this prior with the observed reward/punishment Yt to obtain the current posterior, or optimal assessment, of the state at time t. These equations have the Markov property that knowledge of only the posterior from the previous trial as well as the last reward/punishment and behavioral action are needed to calculate the posterior of the next trial (an introduction to HMMs is provided in supplemental Materials and Methods, available at www.jneurosci.org as supplemental material).
 |
 |
For the reversal task, the consequence of action switch (or stay) is linear with the inferred posterior probability that the subjects are making the incorrect (or correct) choice (and so are the expected rewards). The decision to switch is thus based on the probability that the current choice is incorrect, Posterior(Xt = incorrect) (the close correspondence between the model-estimated posterior that the current choice was incorrect and the subjects’ actual choice behavior is illustrated in Fig. 1C). We assume a stochastic relationship between actual choice as well as the probability that the current choice is incorrect and use the logistic sigmoid as in Equation 3:
The state-based model we use here assumes that subjects use a fixed probability of reversal that is uniform on all trials in which the correct stimulus is being chosen. However, in actuality, the probability of reversal is not uniformly distributed over all the trials, because after subjects switch their choice, the reversal probability is set to zero until subjects make the correct choice on four consecutive occasions. We compared a version of the state-based model that incorporates the full reversal rule (zero probability of reversal until four consecutive correct choices are made, and a fixed probability thereafter) with that which incorporates a simple rule based on a single fixed probability. The latter model was found to provide a marginally better fit (with a log likelihood of −0.29 compared with −0.40 for the full model) to the subjects’ actual behavioral choices. This justifies use of a state-based model with this simplified reversal rule in all subsequent analyses.
Behavioral data analysis.
Both the RL and state-based model decision probabilities P(switch/stay) were fitted against the behavioral data B(switch/stay). The state-based model calculates the probability of switching through Equation 7. The RL model computes the probability of choosing one stimulus versus another but can be converted to a switch/stay probability based on the subject’s previous selection [i.e., P(switch) = P(choose A) if the subject chose B in the previous trial, and vice versa]. On average, subjects switched 22 ± 2 times during the experiment, of ∼104 trials, so we used a maximum log likelihood fitting criteria that weighed switching and staying conditions equally:
 |
Model parameters were fitted using a variant of a simulating annealing procedure (Kirkpatrick et al., 1983). A comparison of the log likelihood of the Bayesian model and a number of RL models is shown in supplemental Figure 1 (available at www.jneurosci.org as supplemental material), and a time plot of subject choices versus model predictions is shown in supplemental Figure 2 (available at www.jneurosci.org as supplemental material). The Bayesian model has a better log likelihood fit than the best-fitting RL model (p < 10−7, paired t test). This is also true even when using a penalized log likelihood measure [Bayes Information Criterion (BIC)] that takes into account the number of free parameters in each model (Schwarz, 1978), as shown in Eq. 9, where M is the number of free parameters (five for the Bayesian model, three for the model-free RL) and N is the total number of data points:
 |
The mean fitted parameter values across subjects for the Bayesian model and the best-fitting RL model are shown in supplemental Table 1 (available at www.jneurosci.org as supplemental material). These parameters were used when fitting the models to the fMRI data. We assumed subjects would learn the task structure and reward contingencies during the training period and keep these parameters fixed during task execution.
We note that although the approach we use here of deriving best-fitting parameters from the subjects’ behavior and regressing the model with these parameters against the fMRI data is perhaps the most parsimonious way to constrain our model-based analysis, this approach assumes that behavior is being controlled by a single unitary learning system with a single set of model parameters. However, it is possible that behavior may be controlled by multiple parallel learning systems, each with distinct model parameters (Tanaka et al., 2004; Glascher et al., 2005), and as such these multiple learning systems would not be discriminated using our approach.
fMRI data acquisition.
Functional imaging was conducted using a Siemens (Erlangen, Germany) 3.0 tesla Trio MRI scanner to acquire gradient echo T2*-weighted echo-planar images. To optimize functional sensitivity in the orbitofrontal cortex (OFC), we acquired the data using an oblique orientation of 30° to the anterior commissure–posterior commissure axis. A total of 580 volumes (19 min) were collected during the experiment in an interleaved-ascending manner. The imaging parameters were as follows: echo time, 30 ms; field of view, 192 mm; in-plane resolution and slice thickness, 3 mm; repetition time (TR), 2 s. High-resolution T1-weighted structural scans (1 × 1 × 1 mm) were acquired for anatomical localization. Image analysis was performed using SPM2 (Wellcome Department of Imaging Neuroscience, Institute of Neurology, London, UK). Preprocessing included slice-timing correction (centered at TR/2), motion correction, spatial normalization to a standard T2* template with a resampled voxel size of 3 mm, and spatial smoothing using an 8 mm Gaussian kernel. Intensity normalization and high-pass temporal filtering (128 s) were also applied to the data (Friston et al., 1995).
fMRI data analysis.
The event-related fMRI data were analyzed by constructing sets of δ (stick) functions at the time of the choice and at the time of the outcome. Additional regressors were constructed by using the model-estimated prior probabilities as a modulating parameter at the time of choice and the state-based prediction error signal (posterior–prior probabilities) as a modulating parameter at the time of outcome. In addition, we modeled the subjects’ behavioral decision (to switch vs stay) by time-locking a regressor to the expected time of onset of the next trial (2 s after the outcome is revealed). All of these regressors were convolved with a canonical hemodynamic response function (HRF). In addition, the six scan-to-scan motion parameters produced during realignment were included to account for residual motion effects. These were fitted to each subject individually, and the regression parameters were then taken to the random-effects level to obtain the results shown in Figures 2 and 4. All reported fMRI statistics and p values arise from group random-effects analyses. We report those activations as significant in a priori regions of interest that exceed a threshold of p < 0.001 uncorrected, whereas activations outside regions of interest are reported only if they exceed a threshold of p < 0.05 after whole-brain correction for multiple comparisons. Our a priori regions of interest are as follows: PFC (ventral and dorsal aspects), anterior cingulate cortex, anterior insula, amygdala, and striatum (dorsal and ventral), because these areas have previously been implicated in reversal learning and other reward-based decision-making tasks (J. O’Doherty et al., 2003; O’Doherty et al., 2004).
Figure 2.
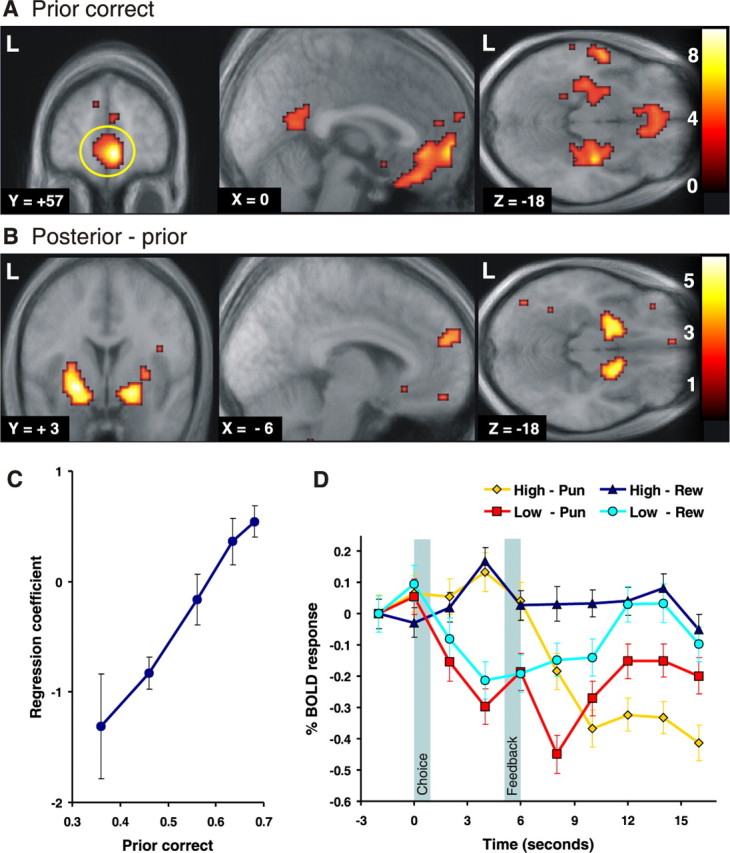
Correct choice prior and posterior–prior update signals in the brain. A, Brain regions showing a significant correlation with the prior correct signal from the state-based decision model (time-locked to the time of choice). Strong correlations with prior correct were found in the vmPFC (mPFC: 6, 57, −6 mm; z = 5.33; OFC: 0, 33, −24 mm; z = 4.04) as well as in the posterior dorsal amygdala (extending into the anterior hippocampus). The activations are shown superimposed on a subject-averaged structural scan, and the threshold is set at p < 0.001. L, Left. B, Brain regions correlating with the posterior–prior update signal. This is a form of prediction error signal that reflects the difference in value between the prior probability that the choice will be correct and the posterior probability that the choice was correct after receipt of the outcome (a reward or punishment). This signal is significantly correlated with activity in the bilateral ventral striatum (−24, 3, −9 mm; z = 4.64; 18, 3, −15 mm; z = 4.48), dorsomedial PFC (−6, 54, +24 mm; z = 3.54), and vmPFC (−12, 51, −15 mm; z = 3.72). These fMRI contrasts are from group random-effects analyses. C, The relationship between fMRI responses in the mPFC (A, yellow circle) at the time of choice and the prior correct signal from the state-based model showed a strong colinearity, supporting the idea of an optimal inference of state probabilities. To plot this activity against the prior probabilities, we sorted trials into one of five bins to capture different ranges in the prior probabilities and fitted each bin separately to the fMRI data. D, The time course for the averaged percentage of signal change in this same region (mPFC) is shown separately for trials with a high prior correct signal (p > 0.65) and low prior correct signal (p < 0.5). Error bars depict the SEM across all trials of that type. Trials are also separated according to whether a reward (Rew) or a punishment (Pun) was received at the time of outcome to illustrate updating of the signal after feedback. The leftmost shaded area indicates the period (1 s in length) in which subjects made their choice, and the second shaded area indicates the period in which subjects were presented with their rewarding or punishing feedback. Trials with a low prior in which a reward is obtained show an increase in signal at the time of the outcome (with the peak BOLD activity lagged by 4–6 s; see Materials and Methods), whereas trials with a high prior in which a punishment is obtained result in a decrease in signal at outcome, consistent with the possibility that the response at the time of outcome reflects an update signal. Error bars indicate SEM.
Figure 4.

Incorrect choice prior and switch–stay signals in the brain. A, Brain regions showing a significant correlation with the prior incorrect signal from the state-based algorithm (time-locked to the time of choice). Significant effects were found in the rDLPFC (39, 36, 33 mm; z = 4.30), the anterior cingulate cortex (6, 21, 45 mm; z = 3.37), and the right anterior insula (48, 15, 9 mm; z = 3.96). The threshold was set at p < 0.001. B, Plot showing relationship between fMRI responses in the dorsolateral PFC at the time of choice and the prior incorrect signal from the Bayesian model, illustrating strong colinearity between this signal and activity in this region. C, Brain regions responding to trials in which subjects decide to switch compared with when they do not switch (stay) their choice of stimulus. Significant effects were found in the anterior cingulate cortex (−3, 24, 30 mm; z = 4.54) and the anterior insula (−39, 18, −12 mm; z = 4.26; 51, 21, 3 mm; z = 4.23) bilaterally. The fact that the anterior cingulate and anterior insula respond on these switch trials, as well as responding to the prior incorrect signals, suggest that the decision to switch may be implemented in these regions. Error bars indicate SEM. L, Left.
Time series of fMRI activity in regions of interest (see Fig. 2D) were obtained by extracting the first eigenvariate of the filtered raw time series (after high-pass filtering and removal of the effects of residual subject motion) from a 3 mm sphere centered at the peak voxel (from the random-effects group level). This was done separately for each individual subject, binned according to different trial types, and averaged across trials and subjects. SPM normalizes the average fMRI activity to 100, so that the filtered signal is considered as a percentage of change from baseline. It is to be noted that the time series are not generated using canonical HRF functions. More specifically, peak blood oxygenation level-dependent (BOLD) activity is lagged with respect to the time of the event that generated it. For example, activity arising as a consequence of neural activity at the time of choice will have its maximum effect 4–6 s after the time of choice as expressed in the time-series plot.
We also compared the best-fitting model-free RL and Bayesian algorithms directly (see Fig. 3B) by fitting both models at the same time with the fMRI data. To make both models as similar as possible, we used the normalized value and prediction error signals from the RW model as regressors (modulating activity at the time of the trial onset and outcome, respectively) and the normalized prior correct and prediction error (posterior correct–prior correct) from the state-based model as regressors (modulating activity at the time of the trial onset and outcome, respectively). Separate reward and punishment regressors were also fitted at the time of the outcome. Prior correct–value contrasts were calculated at the individual level and taken to the random-effects level to determine which areas had a better correlation with the state-based model.
Figure 3.

Standard RL and abstract-state-based decision models make qualitatively different predictions about the brain activity after subjects switch their choice. A, Both models predict whether a decision is made to stay after being punished, the next action will have a lower expected value in the next trial (blue line). However, if a decision is made to switch choice of stimulus after being punished, simple RL predicts that the expected value of the new choice will also be low (red line; left) because its value was not updated since the last time it was chosen. In contrast, a state-based decision model predicts that the expected value of the new choice will be high. If the subjects have determined that their choice until now was incorrect (prompted by the last punishment), then their new choice after switching is now correct and has a high expected value (red line; middle). Mean fMRI signal changes (time-locked to the time of choice) in the mPFC (derived from a 3 mm sphere centered at the peak voxel) plotted before and after reversal (right) show that activity in this region is more consistent with the predictions of state-based decision making than that of standard RL. This indicates that the expected reward signal in the mPFC incorporates the structure of the reversal task. B, Direct comparison of brain regions correlating with the prior correct signal from the state-based model compared with the equivalent value signal (of the current choice) from the simple RL model. A contrast between the models revealed that the state-based decision model accounts significantly better for neural activity in the mPFC (6, 45, −9 mm; z = 3.68). L, Left.
To calculate the predicted value and prior correct signals for the standard RL and state-based model shown in Figure 3, we calculated the expected value (from the RW model) and prior correct value (derived from the state-based model) on all trials in which subjects received a punishment and for the immediately subsequent trial. We then sorted these estimates into two separate categories according to whether subjects switched their choice of stimulus or maintained their choice of stimulus (stay) on the subsequent trial.
Results
Behavioral measures
The decision to switch is implemented on the basis of the posterior probability that the last choice was incorrect. The higher this probability, the more likely a subject is to switch (Fig. 1C). The state-based model predicts the subjects’ actual choice behavior (whether to switch or not) with an accuracy of 92 ± 2%. On average, subjects made the objectively correct choice (chose the action associated with the high probability of reward) on 61 ± 2% of trials, which is close to the performance of the state-based model (using the parameters estimated from the subjects’ behavior) that correctly selected the best available action on 63% of trials. This is also close to the optimal performance of the state-based model that was 64% (using the actual task parameters).
Prior correct signal in the brain
The model-estimated prior probability that the current choice is correct (prior correct) informs about the expected reward value of the currently chosen action. The prior correct signal was found to have a highly statistically significant correlation with neural activity in the medial PFC (mPFC), the adjacent OFC, and the amygdala bilaterally (Fig. 2) (the correlation in the mPFC was significant at a corrected level for multiple comparisons across the entire brain at p < 0.05). These findings are consistent with previous reports of a role for the ventromedial PFC (vmPFC) and amygdala in encoding expected reward value (Thorpe et al., 1983; Schoenbaum et al., 1998; Gottfried et al., 2003; Holland and Gallagher, 2004; Knutson et al., 2005). This evidence has, however, generally been interpreted in the context of RL models.
To plot activity in the mPFC against the prior probabilities, we sorted trials into one of five bins to capture different ranges in the prior probabilities and fitted each bin separately to the fMRI data. This analysis showed a strong linear relationship between the magnitude of the evoked fMRI signal in this region and the prior correct probabilities (Fig. 2C). We also extracted the percentage of signal change time courses from the same region and show these results in Figure 2D, plotted separately for trials associated with high and low prior probabilities. The time courses show an increase in signal at the time of the choice reflected on trials with a high prior correct and a decrease in signal at the time of the choice for trials with a low prior correct.
Posterior–prior correct update
The difference between the posterior correct (at the time of the reward outcome) and the prior correct can be considered an update signal of the prior probabilities once a reward/punishment is received. This signal was significantly correlated with activity in the ventral striatum, as well as in other brain areas such as the dorsomedial and vmPFC (Fig. 2B). This update is also reflected in the time course plots from mPFC in Figure 2D. Trials with a low prior in which a reward is obtained show an increase in signal at the time of the outcome, whereas trials with a high prior in which a punishment is obtained result in a decrease in signal at outcome. Thus, the response at the time of the posterior differs depending on the prior probabilities and whether the outcome is a reward or punishment, fully consistent with the notion that this reflects an update of the prior probabilities.
Abstract-state model versus standard RL: the response profile of neural activity in the human vmPFC
The prior correct signal from the state-based model is almost identical to the expected reward signal from the RL model. Nevertheless, our paradigm permits sharp discrimination between the two models. The predictions of the two models differ immediately after a switch in the subjects’ action choice. According to both models, a switch of stimulus should be more likely to occur when the expected value of the current choice is low, which will happen after receiving monetary losses on previous trials. What distinguishes the two models is what happens to the expected value of the newly chosen stimulus after subjects switch. According to simple RL, the expected value of this new choice should also be low, because that was the value it had when the subject had previously stopped selecting it and switched choice (usually after receiving monetary losses on that stimulus). Because simple RL only updates the value of the chosen action, the value of the nonchosen action stays low until the next time that an action is selected. However, according to a state-based inference model, as soon as a subject switches action choice, the expected reward value of the newly chosen action should be high. The known structure of the reversal task incorporates the fact that once the value of one action is low, the value of the other is high. Thus, in a brain region implementing abstract-state-based decision making, the prior correct signal (that reflects expected value) should jump up after reversal, even before an outcome (and subsequent prediction error) is experienced on that new action. In RL, the value of the new action will only be updated after an outcome and subsequent prediction error. This point is illustrated in Figure 3A where the model-predicted expected value signals are plotted for simple RL and for the state-based model, before and after reversal. Changes in activation in the vmPFC after choice switches correspond to those predicted by the abstract-state-based model: activation decreases after a punishment and if the subject does not switch, but it increases after switching, rejecting the RL model in favor of the model with an abstract hidden state (supplemental Fig. 3, available at www.jneurosci.org as supplemental material).
To further validate this point, we conducted an fMRI analysis in which we pitted the state-based model and the best-fitting (to behavior) RL algorithm against each other, to test which of these provides a better fit to neural activity. A direct comparison between the regression fits for the state-based model and those for RL revealed that the former was a significantly better fit to the fMRI data in the mPFC at p < 0.001 (Fig. 3B). Although the peak difference was in the mPFC, the state-based model also fit activity better in the medial OFC at a slightly lower significance threshold (p < 0.01). This suggests that abstract state-based decision making may be especially localized to the vmPFC.
Prior incorrect
We also tested for regions that correlated negatively with the prior correct (i.e., areas correlating positively with the prior probability that the current action is incorrect). This analysis revealed significant effects in other sectors of the PFC, including the following: specifically, the right dorsolateral PFC (rDLPFC), the right anterior insular cortex, and the anterior cingulate cortex (Fig. 4A). Figure 4B shows the relation between the BOLD activity and the model prior incorrect signal in rDLPFC.
Behavioral decision to switch
Finally, we tested for regions involved in implementing the behavioral decision itself (to switch or stay). Enhanced responses were found in the anterior cingulate cortex and anterior insula on switch compared with stay trials (Fig. 4C). This figure shows that regions activated during the decision to switch are in close proximity to those areas that are significantly correlated with the prior probability that the current choice is incorrect as provided by the decision model.
Discussion
In this study, we set out to determine whether during performance of a simple decision task with a rudimentary higher-order structure, human subjects engage in state-based decision making in which knowledge of the underlying structure of the task is used to guide behavioral decisions, or if, on the contrary, subjects use the individual reward history of each action to guide their decision making without taking into account higher-order structure (standard RL). The decision-making task we used incorporates a very simple higher-order structure and is based on the following: the probability that one action is correct (i.e., leading to the most reward) is inversely correlated with the probability that the other action is incorrect (i.e., leading to the least reward). Over time, the contingencies switch, and once subjects work out that the current action is incorrect, they should switch their choice of action. We have captured state-based decision making in formal terms with an elementary Bayesian Hidden Markov computational model that incorporates the task structure (by encoding the inverse relationship between the actions and featuring a known probability that the action reward contingencies will reverse). By performing optimal inference on the basis of this known structure, the model is able to compute the probability that the subjects should maintain their current choice of action or switch their choice of action.
The critical distinction between the state-based inference model and standard RL is what happens to the expected value of the newly chosen stimulus after subjects switch. According to standard RL, the expected value of the new choice should be low, because that was the value it had when the subject had previously stopped selecting it (usually after receiving monetary losses on that stimulus). In contrast, the state-based algorithm predicts that the expected value for the newly chosen action should be high, because unlike standard RL, it incorporates the knowledge that when one action is low in value, the other is high. By comparing neural activity in the brain before and after a switch of stimulus, we have been able to show that, consistent with state-based decision making, the expected value signal in the vmPFC jumps up even before a reward is delivered on the newly chosen action. This updating therefore does not occur at the time of outcome via a standard reward prediction error (as in standard RL). Rather, the updating seems to occur using previous knowledge of the task structure. This suggests that the vmPFC participates in state-based inference rather than standard RL.
Our Bayesian Markov model is just one of a family of models that incorporates the simple abstract structure of the task. Thus, although we show that vmPFC implements state-based inference, we remain agnostic about the particular computational process by which this inference is implemented. Furthermore, our findings do not rule out a role for simple RL in human decision making, but rather opens the question of how abstract-state-based inference and simple RL might interact with each other to control behavior (Daw et al., 2005). This also raises the question of whether the dopaminergic system, the phasic activity of which has been traditionally linked with a reward prediction error in simple RL, subserves a similar function when the expected rewards are derived from an abstract-state representation. An important signal in our state-based model is the posterior correct that represents an update of the prior correct probability based on the outcome experienced on a particular trial. The difference between the posterior and the prior looks like an error signal, similar to prediction errors in standard RL, except that the updates are based on the abstract states in the model. We found significant correlations with this update signal (posterior–prior) in the ventral striatum and mPFC, regions that have been associated previously with prediction error coding in neuroimaging studies (McClure et al., 2003; J. P. O’Doherty et al., 2003; O’Doherty et al., 2004; Seymour et al., 2004; Tanaka et al., 2004) (Fig. 2B). These findings are consistent with the possibility that the vmPFC is involved in encoding the abstract-state space, whereas standard RL is used to learn the values of the abstract states in the model, an approach known as model-based RL (Sutton and Barto, 1998; Doya et al., 2002).
The final decision whether to switch or stay was associated with activity in the anterior cingulate cortex and anterior insula, consistent with previous reports of a role for these regions in behavioral control (Bush et al., 2002; Cools et al., 2002; Tanji et al., 2002; J. O’Doherty et al., 2003; Kerns et al., 2004; Walton et al., 2004). These regions are in close proximity to areas that were significantly correlated with the prior probability that the current choice was incorrect as provided by the decision model. A plausible interpretation of these findings is that the anterior insula and anterior cingulate cortex may actually be involved in using information about the inferred choice probabilities to compute the decision itself.
In the present study, we provide evidence that neural activity in the vmPFC reflects learning based on abstract states that capture interdependencies. Our results imply that the simple RL model is not always appropriate in the analysis of learning in the human brain. The capacity of the PFC to perform inference on the basis of abstract states shown here could also underlie the ability of humans to predict the behavior of others in complex social transactions and economic games, and it accounts more generally for the human ability of abstract strategizing (Camerer, 2003).
Footnotes
This work was supported by California Institute of Technology start-up funds to J.P.O. from the Gimbel Discovery Fund in Neuroscience. A.N.H. was partly supported by the Physical Sciences Division of the National Aeronautics and Space Administration Office of Biological and Physical Research. We thank Nathaniel Daw for helpful comments on this manuscript. We also thank Steve Flaherty and Mike Tyzska for technical and MRI support.
References
- Bechara A, Tranel D, Damasio H (2000). Characterization of the decision-making deficit of patients with ventromedial prefrontal cortex lesions. Brain 123:2189–2202. [DOI] [PubMed] [Google Scholar]
- Bush G, Vogt BA, Holmes J, Dale AM, Greve D, Jenike MA, Rosen BR (2002). Dorsal anterior cingulate cortex: a role in reward-based decision making. Proc Natl Acad Sci USA 99:523–528. [DOI] [PMC free article] [PubMed] [Google Scholar]
- Camerer CF (2003). Strategizing in the brain. Science 300:1673–1675. [DOI] [PubMed] [Google Scholar]
- Cools R, Clark L, Owen AM, Robbins TW (2002). Defining the neural mechanisms of probabilistic reversal learning using event-related functional magnetic resonance imaging. J Neurosci 22:4563–4567. [DOI] [PMC free article] [PubMed] [Google Scholar]
- Daw ND, Niv Y, Dayan P (2005). Uncertainty-based competition between prefrontal and dorsolateral striatal systems for behavioral control. Nat Neurosci 8:1704–1711. [DOI] [PubMed] [Google Scholar]
- Doya K, Samejima K, Katagiri K, Kawato M (2002). Multiple model-based reinforcement learning. Neural Comput 14:1347–1369. [DOI] [PubMed] [Google Scholar]
- Friston KJ, Ashburner J, Frith CD, Poline JB, Heather JD, Frackowiak RSJ (1995). Spatial registration and normalization of images. Hum Brain Mapp 3:165–189. [Google Scholar]
- Genovesio A, Brasted PJ, Mitz AR, Wise SP (2005). Prefrontal cortex activity related to abstract response strategies. Neuron 47:307–320. [DOI] [PMC free article] [PubMed] [Google Scholar]
- Ghahramani Z (2001). An introduction to hidden Markov models and Bayesian networks. Int J Pattern Recogn Artific Intell 15:9–42. [Google Scholar]
- Glascher J, Buchel C, Nord N (2005). Formal learning theory dissociates brain regions with different temporal integration. Neuron 47:295–306. [DOI] [PubMed] [Google Scholar]
- Goldman-Rakic PS (1996). The prefrontal landscape: implications of functional architecture for understanding human mentation and the central executive. Philos Trans R Soc Lond B Biol Sci 351:1445–1453. [DOI] [PubMed] [Google Scholar]
- Gottfried JA, O’Doherty J, Dolan RJ (2003). Encoding predictive reward value in human amygdala and orbitofrontal cortex. Science 301:1104–1107. [DOI] [PubMed] [Google Scholar]
- Herrnstein RJ (1974). Formal properties of the matching law. J Exp Anal Behav 21:159–164. [DOI] [PMC free article] [PubMed] [Google Scholar]
- Holland PC, Gallagher M (2004). Amygdala-frontal interactions and reward expectancy. Curr Opin Neurobiol 14:148–155. [DOI] [PubMed] [Google Scholar]
- Hornak J, O’Doherty J, Bramham J, Rolls ET, Morris RG, Bullock PR, Polkey CE (2004). Reward-related reversal learning after surgical excisions in orbito-frontal or dorsolateral prefrontal cortex in humans. J Cogn Neurosci 16:463–478. [DOI] [PubMed] [Google Scholar]
- Jordan MI (1998). In: Learning in graphical models Cambridge, MA: MIT.
- Kerns JG, Cohen JD, MacDonald AW III, Cho RY, Stenger VA, Carter CS (2004). Anterior cingulate conflict monitoring and adjustments in control. Science 303:1023–1026. [DOI] [PubMed] [Google Scholar]
- Kirkpatrick S, Gelatt CD, Vecchi MP (1983). Optimization by simulated annealing. Science 220:671–680. [DOI] [PubMed] [Google Scholar]
- Knutson B, Taylor J, Kaufman M, Peterson R, Glover G (2005). Distributed neural representation of expected value. J Neurosci 25:4806–4812. [DOI] [PMC free article] [PubMed] [Google Scholar]
- Luce DR (2003). In: Response times New York: Oxford UP.
- McClure SM, Berns GS, Montague PR (2003). Temporal prediction errors in a passive learning task activate human striatum. Neuron 38:339–346. [DOI] [PubMed] [Google Scholar]
- O’Doherty J, Kringelbach ML, Rolls ET, Hornak J, Andrews C (2001). Abstract reward and punishment representations in the human orbitofrontal cortex. Nat Neurosci 4:95–102. [DOI] [PubMed] [Google Scholar]
- O’Doherty J, Critchley H, Deichmann R, Dolan RJ (2003). Dissociating valence of outcome from behavioral control in human orbital and ventral prefrontal cortices. J Neurosci 23:7931–7939. [DOI] [PMC free article] [PubMed] [Google Scholar]
- O’Doherty J, Dayan P, Schultz J, Deichmann R, Friston K, Dolan RJ (2004). Dissociable roles of ventral and dorsal striatum in instrumental conditioning. Science 304:452–454. [DOI] [PubMed] [Google Scholar]
- O’Doherty JP, Dayan P, Friston K, Critchley H, Dolan RJ (2003). Temporal difference models and reward-related learning in the human brain. Neuron 38:329–337. [DOI] [PubMed] [Google Scholar]
- Owen AM (1997). Cognitive planning in humans: neuropsychological, neuroanatomical and neuropharmacological perspectives. Prog Neurobiol 53:431–450. [DOI] [PubMed] [Google Scholar]
- Platt ML, Glimcher PW (1999). Neural correlates of decision variables in parietal cortex. Nature 400:233–238. [DOI] [PubMed] [Google Scholar]
- Rescorla RA, Wagner AR (1972). A theory of Pavlovian conditioning: variations in the effectiveness of reinforcement and nonreinforcement. In: Classical conditioning II: Current research and theory (Black AH, Prokasy WF, eds) pp. 64–99. New York: Appleton-Century-Crofts.
- Schoenbaum G, Chiba AA, Gallagher M (1998). Orbitofrontal cortex and basolateral amygdala encode expected outcomes during learning. Nat Neurosci 1:155–159. [DOI] [PubMed] [Google Scholar]
- Schwarz G (1978). Estimating the dimension of a model. Ann Stat 6:461–464. [Google Scholar]
- Seymour B, O’Doherty JP, Dayan P, Koltzenburg M, Jones AK, Dolan RJ, Friston KJ, Frackowiak RS (2004). Temporal difference models describe higher-order learning in humans. Nature 429:664–667. [DOI] [PubMed] [Google Scholar]
- Sugrue LP, Corrado GS, Newsome WT (2004). Matching behavior and the representation of value in the parietal cortex. Science 304:1782–1787. [DOI] [PubMed] [Google Scholar]
- Sugrue LP, Corrado GS, Newsome WT (2005). Choosing the greater of two goods: neural currencies for valuation and decision making. Nat Rev Neurosci 6:363–375. [DOI] [PubMed] [Google Scholar]
- Sutton RS, Barto AG (1998). In: Reinforcement learning Cambridge, MA: MIT.
- Tanaka SC, Doya K, Okada G, Ueda K, Okamoto Y, Yamawaki S (2004). Prediction of immediate and future rewards differentially recruits cortico-basal ganglia loops. Nat Neurosci 7:887–893. [DOI] [PubMed] [Google Scholar]
- Tanji J, Shima K, Matsuzaka Y (2002). Reward-based planning of motor selection in the rostral cingulate motor area. Adv Exp Med Biol 508:417–423. [DOI] [PubMed] [Google Scholar]
- Thorpe SJ, Rolls ET, Maddison S (1983). The orbitofrontal cortex: neuronal activity in the behaving monkey. Exp Brain Res 49:93–115. [DOI] [PubMed] [Google Scholar]
- Wallis JD, Anderson KC, Miller EK (2001). Single neurons in prefrontal cortex encode abstract rules. Nature 411:953–956. [DOI] [PubMed] [Google Scholar]
- Walton ME, Devlin JT, Rushworth MFS (2004). Interactions between decision making and performance monitoring within prefrontal cortex. Nat Neurosci 7:1259–1265. [DOI] [PubMed] [Google Scholar]
- Watkins CJ, Dayan P (1992). Q-learning. Machine Learn 8:279–292. [Google Scholar]