

Abstract
To study the roles of the perirhinal cortex (PRh) and temporal cortex (area TE) in stimulus–reward associations, we recorded spike activities of cells from PRh and TE in two monkeys performing a visually cued go/no-go task. Each visual cue indicated the required motor action as well as the availability of reward after correct completion of the trial. Eighty object images were divided into four groups, each of which was assigned to one of four motor–reward conditions. The monkeys either had to release a lever (go response) or keep pressing it (no-go response), depending on the cue. Each of the go and no-go trials could be either a rewarded or unrewarded trial. A liquid reward was provided after correct responses in rewarded trials, whereas correct responses were acknowledged only by audiovisual feedback in unrewarded trials. Several measures of the monkeys' behavior indicated that the monkeys correctly anticipated the reward availability in each trial. The dependence of neuronal activity on the reward condition was examined by comparing mean discharges to each of the 40 rewarded stimuli with those to each of the 40 unrewarded stimuli. Many cells in both areas showed significant reward dependence in their responses to the visual cues, and this was not likely attributable to differences in behavior across conditions because the variations in neuronal activity were not correlated with trial-by-trial variations in latency of go responses or anticipatory sucking strength. These results suggest the involvement of PRh and TE in associating visual stimuli with reward outcomes.
Keywords: association, reward, inferotemporal, visual, perirhinal, macaque, unit recording
Introduction
The temporal area (area TE) of the inferotemporal cortex is the final unimodal visual stage in the occipitotemporal visual pathway (Gross, 1994). Cells in TE selectively respond to various complex features of objects (Logothetis and Scheinberg, 1996; Tanaka, 1996), and TE is thought to contribute to the perception of visual objects based on these selective neuronal responses. The perirhinal cortex (PRh) is a polymodal area that receives projections from later stages of various sensory modalities, including TE. Effects of lesioning PRh were first identified in visual recognition memory and then in visual–visual, visual–taste, and visual–tactile association memories (for review, see Murray and Bussey, 1999). Single-cell recordings also show evidence of involvement of PRh in visual–visual associations (Sakai and Miyashita, 1991; Higuchi and Miyashita, 1996; Naya et al., 2001, 2003). The converging afferents to PRh may underlie the associative functions of this area.
The visual–reward association is another fundamental association memory. PRh is well situated to associate visual information of objects with reward-related information, because it has strong connections with reward-related sites, such as the amygdala, orbitofrontal cortex, ventral striatum, and midbrain dopamine neurons (Richfield et al., 1989; Akil and Lewis, 1994; Carmichael and Price, 1995; Stefanacci et al., 1996; Rempel-Clower and Barbas, 2000). The ability to learn visual–reward associations has been tested by examining learning of visual object discriminations. Preoperatively learned visual object discriminations are damaged by PRh lesions (Gaffan and Murray, 1992; Buckley and Gaffan, 1997; Thornton et al., 1997). However, monkeys with PRh lesions can learn new visual object discriminations as effectively as intact monkeys can, making the interpretation of the deficits difficult.
Recent research has revived attention to the roles of PRh in processing reward-related information. In a task in which visual cues indicated the number of successful trials (one, two, or three) required to receive a reward and the position of the current trial in the schedule, the monkeys' performance depended on the reward schedule (Liu and Richmond, 2000), and this dependence disappeared by either lesioning PRh (Liu et al., 2000) or suppressing expression of dopamine D2 receptors in PRh (Liu et al., 2004). Also, responses of PRh cells to the visual cues represented the reward schedule (Liu and Richmond, 2000). These results suggest that the PRh has a key role in a monkey's ability to extract, from visual cues, information about the number of successful trials required to reach a reward and the position of the current trial in the schedule. However, we cannot generalize the results of such complicated information to cases of simple stimulus–reward association.
We hypothesized that the inferotemporal cortex has important role in visual–reward association. Monkeys were trained in a task in which some visual stimuli indicated the availability of a reward at the end of the trial and others indicated no reward even after a correct response. Single-cell activities were recorded from PRh and TE after the monkeys had learned the visual–reward association.
Materials and Methods
Two male macaque monkeys (Macaca fuscata, 7.6 and 9.5 kg) were used as subjects. All experiments were approved by the RIKEN Animal Experiment Committee, and all procedures were performed in accordance with National Institutes of Health guidelines. A titanium bar with six basis wings was implanted with titanium screws to the dorsal aspect of the skull of each monkey in an aseptic surgery under pentobarbiturate anesthesia.
Behavioral task.
The monkeys were trained in a visually cued go/no-go task (Fig. 1). A set of 80 object images was used as the visual cues. They were divided into four groups corresponding to four trial types: go/reward, no-go/reward, go/no-reward, and no-go/no-reward. The monkey sat in a chair, head position fixed by the titanium bar, facing a cathode ray tube display at a distance of 50 cm from the monkey's eyes. A lever was placed in front of the monkey's body. The monkey pressed the lever to start a trial. A fixation point (a white square, each side subtending 0.7° of visual angle) immediately appeared at the center of the display, and the monkey had to fixate on it within 500 ms. The window for eye fixation was 4.0 × 4.0° (monkey 1) or 2.5 × 2.5° (monkey 2). After fixating and lever pressing of 500 ms, a visual stimulus randomly selected from the stimulus set was presented for 350 ms. The monkey had to make a go or no-go response, depending on the visual stimulus. The go response was to release the lever and push it again, and the no-go response was to keep pressing the lever down. The whole go response had to be completed within a response window of 200–800 ms after the stimulus onset. The monkey had to keep the eye fixation and lever press until 1300 ms after the stimulus onset, at which time visual and auditory signals (a red circle of 2° in diameter lasting for 500 ms and a 100 ms tone of 2000 Hz) were provided to acknowledge the successful completion of the trial. A drop of liquid reward was also provided at this time (1300 ms) in go/reward and no-go/reward trials. The intertrial interval (ITI), which started at the offset of feedback signals, was 900 ms after correct responses.
Figure 1.
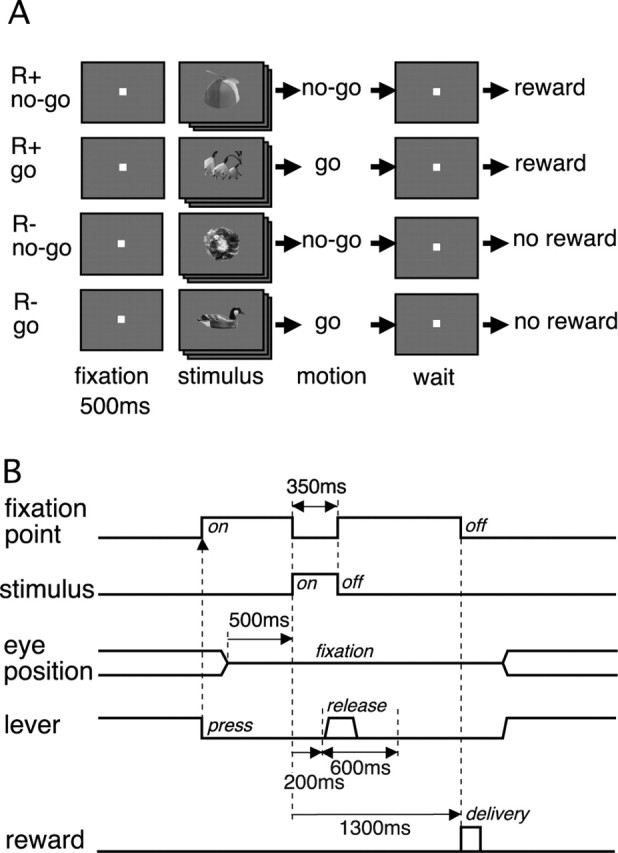
Behavioral task. A, Eighty images of objects were used as visual cues. They were divided into four groups, each representing a different motor and reward condition. The visual cue indicated the required motor action (go or no-go response) and also the availability of liquid reward (R+, reward; R−, no reward) at the end of trial after a correct motor response. B, Time sequence of events in a trial. The monkey's lever press started a trial. The go response was to release the lever and press it again within a 600 ms window starting 200 ms after the visual cue onset. The no-go response was to hold the lever down. The monkey had to keep pressing the lever and fixating the eyes on the fixation point until the time of reward delivery, which was 1300 ms after the visual cue onset.
When the monkey made an incorrect response (a go response in a no-go trial or a no-go response in a go trial), the trial was not immediately aborted and the monkey was informed of the incorrect response by a different set of visual and auditory signals (a green square 2° in side length lasting for 500 ms and a 100 ms tone of 200 Hz) at the end of the response window (800 ms after the stimulus onset). The green square was presented with the sides vertical and horizontal for missed go responses in go trials, whereas it was rotated by 45° for false go responses in no-go trials. The trial was immediately terminated when the monkey broke the eye fixation or lever press. A fixation break was marked by a presentation of a blue rectangle (1.5 × 0.9°) and the 200 Hz tone and a lever-press break with the 200 Hz tone only. All of the visual and auditory feedback signals were presented for 500 and 100 ms, respectively. An unsuccessful trial was followed by a trial with the same stimulus (correction trial). The ITI was longer (2000 ms) after incorrect responses to mildly punish the monkey.
The monkeys were first trained to learn the task with eight object images. We then introduced the 80 object images used during the later single-cell recordings, four or eight stimuli per day. The eight stimuli used for the initial training were removed when the monkey had learned approximately one-quarter of the 80 object images. The training with the 80 stimuli continued for 1 month after all of them had been introduced, and then the single-cell recording started. The monkeys' performance had become stable during this period, and there were no significant changes in the performance after the start of single-cell recordings. The monkeys performed 800–1200 trials per day.
Visual stimuli.
For each daily experiment, a fixed set of 80 color photographs of objects were used as visual stimuli. They were divided among the four trial conditions described above. Each stimulus remained in the same group throughout the recordings. For each trial, a stimulus was taken randomly from a stimulus pool. Used stimuli were not returned to the pool until it became empty, to make the presentation numbers of different stimuli balanced. When the pool became empty, a new pool composed of 80 stimuli was created again. The rewarded stimuli for one monkey were used as unrewarded stimuli for the other monkey, and the go stimuli for one monkey were used as no-go stimuli for the other monkey.
To reduce the possibility that the monkeys would use some simple features of stimulus images in learning the stimulus–motor mapping or stimulus–reward contingency, we calculated several parameters of stimuli, changed a part of them, and equalized their distributions among the four stimulus groups, as described below. The background was homogeneous gray of 35 cd/m2.
We first gathered ∼1000 object photographs. We carefully looked for pairs of similar images and removed one of them. After doing this, ∼800 stimuli remained. The images were centered by their center of gravity and expanded or shrunk to make the size (defined below) to be 5°. Stimuli were randomly selected from the set of 800 stimuli to create the four groups of stimuli. The distributions of area, elongation, axis of elongation, mean luminance averaged across the object part, and the mean color of the object part were calculated for each of the four stimulus groups. If any one of the values in any one of the groups deviated from that of the mother set of 800 stimuli by p < 0.2 (Kolmogorov–Smirnov test), we resampled all of the stimuli in four groups with a different random number series. Each of the four groups was compared with the mother set, rather than with one another, to increase the sensitivity of detecting differences.
The area A was given by A = ∫ dxdy I(x,y), where I(x,y) = 1 for points (x,y) within the object, and I = 0 for points in the background. The size of object was defined as follows: size = {A−1 ∫ dxdy (x2 + y2) I(x,y)1/2. The variance along an axis with an angle of θ from the x-axis was calculated as follows: L(θ) = ∫ dxdy (xcosθ + ysinθ)2 I(x,y), and the axis of elongation was defined by the axis that gave the largest θ. The square root of the variance approximately corresponds to the length of the object image along the axis. The elongation of the object image was defined by the ratio of the square roots of L(θ) along the longest and shortest axes. Note that the shortest axis is always perpendicular to the longest axis because of a theorem of linear algebra.
Recording.
Immediately before the start of single-cell recordings, a titanium recording chamber was implanted to the dorsal aspect of the skull with titanium screws and dental acrylic in a second aseptic surgery. Extracellular unit recordings were conducted from the perirhinal cortex (area 35/36) and from the anterodorsal part of area TE (TEad) (Saleem and Tanaka, 1996) with tungsten microelectrodes (Frederick Haer Company, Bowdoinham, ME) while the monkeys were performing the task. We penetrated two electrodes simultaneously to obtain data more quickly. The recording position ranged from anterior 17 to 23 in monkey 1 and from 16 to 22 in monkey 2. Locations of PRh and TEad were determined by reference to magnetic resonance images (Fig. 2). The electrode was advanced from the dorsal surface of the brain through a guide cannula, which was inserted ∼20 mm into the brain. The positions of gray matter were estimated by the frequency and shapes of recorded action potentials. We also determined the position of the dura at the ventral surface of the brain by detecting the characteristic noise in the monitored voltage when the electrode tip contacted the dura. These pieces of information were used to confirm the estimated position of electrodes relative to the sulci and gyri. All of the stable and well separated units were recorded and included in the analyses to diminish sampling bias. The recordings from the perirhinal cortex and those from TEad were intermixed in the course of experiments: the recording position was moved between the two regions every 1–2 weeks. MSD (Alpha Omega, Nazareth, Israel) was used to separate units. The timing of action potentials and behavioral data were recorded with 1 ms resolution using TEMPO system (Reflective Computing, St. Louis, MO). The eye position was measured by an infrared pupil position monitoring system (i_rec, http://staff.aist.go.jp/k.matsuda/eye/). The recording continued 68 and 48 d in monkey 1 and monkey 2, respectively. For the analysis, we used cells from which activity was recorded during at least 200 trials. The median number of trials for the analyzed cells was 418.
Figure 2.
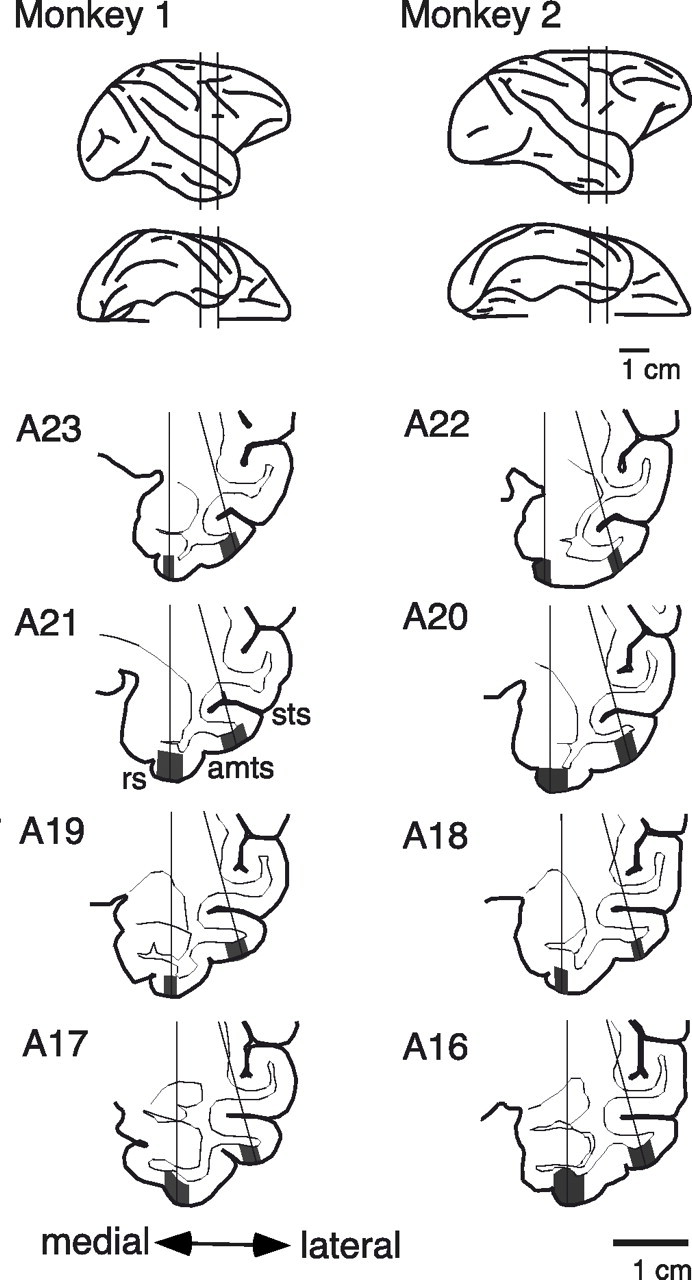
Recording positions shown in lateral and ventral views (top two lines) and frontal sections (bottom four lines) of the brain. The vertical lines in the lateral and ventral views indicate the posterior and anterior limits of recordings. The gray regions in the frontal sections indicate areas from which the recordings were made. The medial regions were within the perirhinal cortex, and the lateral regions were in area TEad. The recordings were conducted in the right hemisphere in both monkeys. sts, Superior temporal sulcus; amts, anterior middle temporal sulcus; rs, rhinal sulcus. The numbers to the left of the drawings indicate the distance (in millimeters) of the section from the ear bar position.
Data analysis.
For analysis, we included data only from the trials in which the monkey succeeded on the first try (correction trials were excluded), unless otherwise stated. The firing rate in each trial was calculated in a moving window of 100 ms, unless otherwise stated. Let xr,m,s,i(t) denote the firing rate in the window centered at time t from the stimulus onset. r and m designate the reward (+, rewarded vs −, unrewarded) and motor (+, go vs −, no-go) conditions, respectively. s indexes visual stimuli, and i indexes the trials of the same stimulus presentation. The number of repetitions could be different among stimuli. The trial i average of xr,m,s,i(t) is denoted by xr,m,s(t). The stimulus s average xr,m,s(t) within a reward–motor condition (r,m) is denoted by xr,m(t). The average of xr,m(t) across m is denoted by xr(t), and the reward dependence r(t) is provided by r(t) = xr = + (t) − xr = − (t). The average of xr,m(t) across r is denoted by xm(t), and the motion dependence m(t) is provided by m(t) = xm = + (t) − xm = − (t).
The variance of xr,m,s(t) across s is denoted by vr,m(t). The root of vr,m(t) provides an estimate of the magnitude of stimulus selectivity within the condition (r,m), the mean vr(t) = (vr,m = + (t) + vr,m = − (t))/2 provides the averaged visual stimulus selectivity within the condition r, and the mean v(t) = (vr = + (t) + vr = − (t))/2 provides the averaged visual stimulus selectivity (Fig. 3E).
Figure 3.

Responses of a PRh cell. A–D, Individual mean responses (black) to 20 rewarded go stimuli (A), 20 rewarded no-go stimuli (B), 20 unrewarded go stimuli (C), and 20 unrewarded no-go stimuli (D), together with the mean (red) and the SD (blue) within each motor–reward condition. The number of trials included in producing the plots of each type were 116, 111, 102, and 111, respectively. E, Root of the variance  (blue), which represents the magnitude of stimulus selectivity, and
  (black), which was used to normalize r(t) and m(t) for t test. S = 20. F, The averaged responses in the rewarded conditions xr
= + (red) and unrewarded conditions xr
= − (green). r(t) is the difference between the two lines. G, The averaged responses in the go conditions xm
= + (red) and no-go conditions xm
= − (cyan). m(t) is the difference between the two lines.
(black), which was used to normalize r(t) and m(t) for t test. S = 20. F, The averaged responses in the rewarded conditions xr
= + (red) and unrewarded conditions xr
= − (green). r(t) is the difference between the two lines. G, The averaged responses in the go conditions xm
= + (red) and no-go conditions xm
= − (cyan). m(t) is the difference between the two lines.
The significance of reward dependence r(t) was tested by t test after normalization by  . S = 20 is the number of stimuli in one group. This procedure of t test is identical to a factorial two-way ANOVA with two levels (reward/motor conditions and stimuli). A hierarchical ANOVA (with reward/motor conditions, stimuli, and trials as the three hierarchical levels) could be applied to xr,m,s,i(t). We used our method, rather than the hierarchical ANOVA, in determining the significance of reward dependence in individual cells, because r(t) explicitly appears in our procedure, as illustrated in Figures 3 and 4. Our method is slightly more conservative than hierarchical ANOVA method, because the trial variance contributes to the estimate of within-condition variance by vEn̄, whereas the contribution occurs by vEn̄′ in the hierarchical ANOVA method. Here n̄ is harmonic mean of trial numbers ni, which is always smaller than n̄′ (arithmetic mean of ni) Whereas ni represents the number of trials with stimulus i, vE represents the trial variance within each stimulus. When ni is the same among i, the values given by the two formulae are identical to each other, otherwise vE/n̄ is larger than vE/n̄′. In our data, ni varied a little: typically it was either 4 or 5, therefore the difference is small. The onset of reward dependence was determined by the time (at a resolution of 10 ms) when the significance first reached p < 0.02 between 100 and 300 ms from the stimulus onset.
Figure 4.

Two examples of cells that showed significant dependence on the reward condition. A, C, The red and green lines indicate averaged responses in the rewarded and unrewarded conditions, respectively. The blue line indicates the magnitude of the stimulus selectivity. The cyan line at the bottom indicates the histograms of the times of start (upward) and end (downward) of the eye fixation. The red and green lines at the bottom indicate the histograms of the times of bar release (downward) and re-press (upward) in rewarded (red) and unrewarded (green) trials. The period of visual cue presentation is indicated by the light blue shading, and the time of reward delivery is indicated by the red vertical lines. B, D, Rastergrams of spike occurrence in individual trials of unrewarded (green) and rewarded (red) conditions for the cell shown in A and C, respectively. A vertical short line segment indicates a spike, and a horizontal line represents a trial. The trials shown here were consecutive trials in each condition with different stimuli. Cell shown in A and B was recorded from PRh, and that in C and D was from TE. The cell in A and B is the same cell as that in Figure 3.
Figure 3 illustrates the procedure to examine the reward dependence for an example cell. First, within each (r,m) condition, xr,m(t) and vr,m(t) were calculated from responses to individual stimuli xr,m,s (Fig. 3A–D). Then, v(t) was calculated by averaging vr,m(t) (Fig. 3E) and r(t) = xr
= + (t) − xr =− (t) by averaging xr,m,s (Fig. 3F). Finally, r(t) was divided by  for t test. The motor dependence can be examined similarly on m(t) = xm
= + (t) − xm =
− (t) normalized by
for t test. The motor dependence can be examined similarly on m(t) = xm
= + (t) − xm =
− (t) normalized by  (Fig. 3G).
We examined the reward dependence for the period before the onset of reward delivery. Three time windows were set in each of the periods 100–500, 500–900, and 900–1300 ms from stimulus onset. The p value was corrected for the multiple comparison. To avoid spurious differences attributable to differences of motor actions between rewarded and unrewarded conditions, the difference in activity was examined with neuronal activities aligned at (1) stimulus onset, (2) bar release, and (3) bar re-press. A cell was judged to have a significant difference only when all three alignments showed significant differences. The ratio of the number of cells selected by this “and” criterion to the total number of tested cells provides a conservative estimate of the real proportion of cells with reward dependence. When activities in go trials were aligned at the time of bar release, those in no-go trials were aligned at the stimulus onset, and activities in go and no-go trials were combined by using the averaged time from the stimulus onset to bar release in go trials. The same method was used when activities in go trials were aligned to the time of bar re-press.
Because the stimulus selectivity vr,m(t) contains a component attributable to the trial-by-trial variance and the reward dependence r(t) contains components attributable to the stimulus selectivity and trial-by-trial variance, we have to calculate unbiased estimators to estimate the true magnitudes of the stimulus selectivity and reward dependence. Let us denote unbiased estimators of variance of neural firing rate resulting from stimulus by uS, unbiased estimate of variance from trial-by trial error by uE, and unbiased estimate of variance from reward dependence by uR. These variables are given by the following formulae:
 |
where S = 20 is the number of stimuli in one group, Nr,m is the total number of trials in the group, x̄r,m = Σs,i xr,m,s,i/Nr,m, and time t is abbreviated. This method of determining unbiased estimators is identical to the method of determining the group, subgroup, and error mean squares in hierarchical ANOVA with three levels.
The statistical significance of the visual stimulus selectivity was examined by F test comparing the variance attributable to stimulus selectivity v(t) with the unbiased estimator of trial-by-trial error uE divided by the averaged number of trials per stimulus. The onset of stimulus selectivity was determined by the time (at a resolution of 10 ms) when the significance first reached p < 0.02 between 50 and 250 ms from the stimulus onset. The same window of 100 ms width (29 ms in SD) was used to analyze the onset of reward dependence. Although this large window provides a less accurate estimate for absolute value of latency, it is a more reliable way to show relative differences of the latencies between different areas and different signals.
Results
Behavior
Each visual stimulus in this task indicated not only the required motor action but also the availability of reward at the end of trial. Although the task did not require the monkeys to do so, three separate behavioral measures showed that the monkeys correctly anticipated the reward outcome in each trial. First, the monkeys made fewer errors in rewarded trials. On average, monkey 1 succeeded in 91% of rewarded trials and 82% of unrewarded trials. The performance of monkey 2 was 92 and 86% in rewarded and unrewarded trials, respectively. These differences in the success rates between rewarded and unrewarded trials were significant (p < 10−10 in both monkeys, t test). The success rate was significantly (p < 0.05, t test) different between rewarded and unrewarded trials in 92% of task days for monkey 1 and in 82% of task days for monkey 2.
The anticipation of reward outcomes was also reflected by the latency of responses in go trials. The monkeys responded more quickly in rewarded trials than in unrewarded trials. The averaged latency of bar release from stimulus onset was 337 ms for rewarded trials and 367 ms for unrewarded trials in monkey 1, and 264 ms for rewarded trials and 342 ms for unrewarded trials in monkey 2. These differences were significant (p < 10−10 in both monkeys). Monkey 1 showed a significant (p < 0.05) difference in response latency on 79% of days, and monkey 2 did so on all the experimental days.
The sucking of the liquid reward pipe was monitored by a pressure sensor in a later part of experiments on monkey 1. After the visual cue presentation, the monkey started to suck the pipe, even well before the time of reward delivery. The strength of this anticipatory sucking, averaged in a period from 500 to 900 ms after the stimulus onset, was significantly larger (p < 0.05, t test, two-tailed) in rewarded trials than in unrewarded trials on 25 of 33 d (76%).
Neuronal activity
The results described in this paper are based on 201 PRh neurons (113 from monkey 1 and 88 from monkey 2) and 140 TE neurons (57 from monkey 1 and 83 from monkey 2) recorded during >200 trials.
Reward dependence
Reward dependence was found in both PRh and TE cortex (Table 1) (see Materials and Methods, Data analysis). Significant reward dependence in activity was observed in 61 PRh cells (30%) (as exemplified in Fig. 4A,B) and in 29 TE cells (21%) (Fig. 4C,D). The proportion of cells with significant reward dependence was larger in PRh than in TE (p = 0.02, χ2 test). There were cells with higher activities in rewarded trials and cells with higher activities in unrewarded trials. The ratio of the number of cells with higher activities in rewarded versus unrewarded trials was 43:57 in PRh and 40:60 in TE.
Table 1.
Percentages of cells that showed significant reward dependence
| PRh |
TE |
||
|---|---|---|---|
| Monkey 1 | Monkey 2 | Monkey 1 | Monkey 2 |
| 113 cells tested | 88 cells tested | 57 cells tested | 83 cells tested |
| 23% (26) | 39% (35) | 14% (8) | 25% (21) |
Numbers in parentheses indicate the number of cells with significant reward dependence.
The strength of reward dependence varied from cell to cell. It was quantified by the ratio of the variance attributable to reward conditions (r(t))2/2 to the sum of the variance attributable to stimulus selectivity and that attributable to reward dependence (r(t))2/2 + v(t). The variances were calculated for mean discharges in the window at 250–350 ms from stimulus onset, in which the reward dependence was most prominent in the two areas (see below, Time course of reward dependence). Figure 5 plots a cumulative histogram of this ratio for each region. A cumulative histogram is used to emphasize the difference in the tail of distribution. It can be read from the plot that ∼18% of PRh cells showed reward dependence larger than one-quarter of their stimulus selectivity and ∼10% of PRh cells larger than one-half. Approximately 5% of PRh cells showed larger reward dependence than stimulus selectivity (Fig. 5B, cell 1), whereas the magnitude of reward dependence was smaller in other cells (Fig. 5C, cell 2).
Figure 5.

Comparison of the magnitude of reward dependence with that of stimulus selectivity. A, The ratio of the variance attributable to reward conditions (r(t))2/2 to the sum of the variance attributable to stimulus selectivity and that attributable to reward dependence (r(t))2/2 + v(t) are displayed as a cumulative frequency histogram. The number of cells was cumulated and normalized by the total number of cells in each area. The half of the cells with smaller ratios in each area is not shown, because the distribution among these cells was very close to the theoretical distribution of pseudo dependence expected from visual stimulus selectivity in both areas. The variances of responses shown here were calculated for the mean firing rate in a window 250–350 ms from the stimulus onset. The broken line indicates the theoretical distribution of false reward dependence originating in visual stimulus selectivity. Approximately  of PRh cells showed reward dependence comparable with stimulus selectivity (that is, r > 0.7v). TE cells showed smaller reward dependence than PRh cells. B, An example of a PRh cell with strong dependence on the reward condition. The cell is indicated as “cell 1” in A. The magnitudes of responses to rewarded stimuli (red line) essentially segregated from those of responses to unrewarded stimuli (blue line). C, An example of a PRh cell with nonsignificant reward dependence. The cell is indicated as “cell 2” in B.
The reward dependence was more prominent in PRh than in TE. The ratio of the variance attributable to reward conditions to the variance attributable to stimulus selectivity and reward dependence was higher in PRh than in TE (Fig. 5). The two distributions were significantly different (p = 0.036, by a χ2 test with five bins). This difference between PRh and TE was clearer in the upper part of the population (Fig. 5A, top part in the ordinate) than the other parts of the population, in which both curves approach the curve of theoretical distribution of pseudo reward dependence expected from visual stimulus selectivity. To confirm this, we divided each of the two populations into five bins and compared the ratios between corresponding bins. The differences were significant in the upper two bins, ranging from 0.8 to 1.0 and from 0.6 to 0.8 (p = 3.8 × 10⁻⁶ for 0.8–1.0 and p = 1.4 × 10⁻⁴ for 0.6–0.8, Wilcoxon's rank sum test) but were not significant in the other three bins (p > 0.05).
Control analyses
There were several behavioral aspects that differed between trials of rewarded and unrewarded conditions. To exclude the possibility that these differences might have caused the differences in neuronal activities between the two reward conditions (reward dependence), we performed the following control analyses.
As described above (see Behavior), the latency of monkeys' bar responses was significantly shorter in rewarded trials compared with unrewarded trials. If transient discharges of cells had been synchronized with monkeys' bar responses, the use of a window fixed to the stimulus onset would have resulted in pseudo dependence of the discharges on the reward condition. We excluded such a pseudo dependence by calculating the significance of reward dependence on neuronal discharges aligned to (1) stimulus onset, (2) bar release, and (3) bar re-press (see Materials and Methods, Data analysis). A cell was judged to have reward dependence only when all the three alignments showed significant reward dependence.
Even after the adjustment of discharge timing, the differences in the latency of bar responses might have evoked the differences in the magnitude of neuronal discharges in PRh and TE. To examine this possibility, we divided trials with each visual stimulus into two equal groups (short-latency and long-latency) according to the latency of bar release. The latency of bar release varied considerably within trials with the same visual stimulus. The SD of trial-by-trial fluctuations of response latency within trials with the same visual stimulus was, on average, 40 ms in monkey 1 and 42 ms in monkey 2, which were the same order of magnitude as the difference between mean response latencies in rewarded and unrewarded trials (21 ms in monkey 1 and 56 ms in monkey 2). Neuronal activity in the pre-reward period was compared between the long- and short-latency trials by a two-way ANOVA, with latency and stimulus as factors. Cells that were recorded for >400 trials were used for this and other analyses in this section, because these analyses, which depended on trial-by-trial differences in responses to each stimulus, needed larger trial sets. We found that 36 of 96 PRh cells and 23 of 87 TE cells showed significant (p < 0.05/3, in which 3 is for correction for multiple comparison) reward dependence. Among them, only one PRh cell and one TE cell showed significant dependence on the response latency in the consistent direction (cells with higher activity to rewarded stimuli showed higher activity in short-latency trials, and cells with higher activity to unrewarded stimuli showed higher activity in long-latency trials) in all of the pre-reward time windows in which the cell showed significant reward dependence (Table 2). These small numbers are smaller than those expected from chance (1 of 36 and 1 of 23 < 0.05).
Table 2.
Number of cells that showed significant dependence on bar response latency among those that showed significant reward dependence
| 100–500 ms | 500–900 ms | 900–1300 ms | Total 1 | Total 2 | |
|---|---|---|---|---|---|
| PRh | 2/16 | 1/15 | 1/22 | 3/53 | 1/36 |
| TE | 0/8 | 1/8 | 1/11 | 2/27 | 1/23 |
The denominator indicates the number of cells that showed significant differences in firing rate between the two reward conditions (p < 0.05/3) in each pre-reward window. The numerator indicates the number of cells, among the cells with significant reward dependence, that showed significant correlation between the firing rate and the latency of the monkey's bar response (p < 0.05, one-tailed), in the direction consistent with that of reward dependence of the cell (for cells that showed larger activities in rewarded trials, the tendency to show larger activities in trials with shorter bar-response latencies was tested, and for cells that showed larger activities in unrewarded trials, the tendency to show larger activities in trials with longer bar response latencies was tested). The correlation between the firing rate and the latency of the monkey's bar response was examined for the activities aligned with the stimulus onset. The numbers of cells that showed significant reward dependence was smaller than that shown in Table 1 because, in this analysis, we included only cells that had been recorded for >400 trials. Total 1 provides a simple total of numbers in the three time windows. The denominator of Total 2 provides the number of cells that showed significant reward dependence in one or more time windows, and the numerator indicates the number of cells that showed significant latency dependence in all of the windows in which the cell showed significant reward dependence. In most of the cells with reward dependence, the firing was not correlated with the latency of the monkeys' bar response.
The strength of monkeys' anticipatory sucking was significantly larger in rewarded trials than in unrewarded trials (see above, Behavior). While the strength of sucking was monitored, 32 cells were recorded in monkey 1. To examine the correlation between the strength of anticipatory sucking and neuronal firing rate, we calculated the mean sucking strength in each of the three pre-reward windows for each stimulus and examined the correlation of its variation across stimuli with the firing rate in the same window with the same stimulus. Only two cells showed significant correlation (p < 0.05, t test) (Table 3). This small number is close to the number expected from chance (2 of 32, ∼0.05): the probability to have this or larger numbers by chance is 0.48 (binomial test).
Table 3.
Number of cells that showed significant dependence on sucking pressure
| 100–500 ms | 500–900 ms | 900–1300 ms | Total | |
|---|---|---|---|---|
| PRh | 0/9 | 0/9 | 0/9 | 0/9 |
| TE | 0/23 | 0/23 | 2/23 | 2/23 |
The denominators indicate the number of cells from which the activity was recorded while the monkey's sucking pressure was monitored. The numerators indicate the number of cells that showed significant (p < 0.05) correlation between their activity and the sucking pressure in each pre-reward window. Only cells that had >400 trials were used in this analysis.
There were more errors in unrewarded trials than in rewarded trials (see above, Behavior). The same stimulus was repeatedly presented after an error (correction trial). Therefore, the presentation frequency was ∼10% larger for stimuli associated with no reward than those associated with reward (Table 4). This evoked a possibility that the neural differences between rewarded and unrewarded trials might be caused by the difference in presentation frequency. To examine this possibility, we calculated the correlation between the magnitude of neuronal activity and the presentation frequency, after subtracting mean values of both variables in each motor–reward condition, for the cells that showed significant reward dependency. Of the 36 PRh and 23 TE cells with significant reward dependence, only three PRh cells and no TE cells showed significant (p < 0.05) dependence on presentation frequency in all of the pre-reward time windows in which the cell showed significant (p < 0.05/3, in which 3 is for correction for multiple comparison) reward dependence (Table 5). These small numbers were smaller than or close to those expected from chance: the probability to have pseudo significance in 3 or more of 36 cells by chance is 0.27 (binomial test).
Table 4.
Total numbers of presentation of stimuli associated with each motor–reward condition from the introduction of the stimuli until the end of recordings
| R+/no-go | R+/go | R−/no-go | R−/go | |
|---|---|---|---|---|
| Monkey 1 | 17,789 (23.5%) | 18,061 (23.9%) | 19,653 (26.0%) | 20,133 (26.6%) |
| Monkey 2 | 12,535 (24.5%) | 11,867 (23.2%) | 13,488 (26.4%) | 13,229 (25.9%) |
The accumulated numbers of presentations across days are shown. The percentages are calculated against all of the presentations for each monkey.
Table 5.
Number of cells that showed significant dependence on presentation frequency of individual stimuli among those that showed significant reward dependence
| 100–500 ms | 500–900 ms | 900–1300 ms | Total 1 | Total 2 | |
|---|---|---|---|---|---|
| PRh | 4/16 | 2/15 | 1/22 | 7/53 | 3/36 |
| TE | 0/8 | 0/8 | 0/11 | 0/27 | 0/23 |
The denominator indicates the number of cells that showed significant (p < 0.05/3) reward dependence in each pre-reward window. The numerator indicates the number of cells, among those that showed significant reward dependence, in which a significant (p < 0.05, one-tailed) correlation was found between the firing rate to each stimulus and the presentation frequency of the stimulus in the direction consistent with that of reward dependence of the cell (for cells that showed larger activities in rewarded trials, the tendency to show larger activities to stimuli presented less frequently was tested, and for cells that showed larger activities in unrewarded trials, the tendency to show larger activities to stimuli presented more frequently was tested). The mean responses and mean presentation frequency in each motor–reward condition were subtracted from individual responses and frequencies before the regression analysis. Total 1 provides simple sums of the numbers in the three time windows. The denominator of Total 2 provides the number of cells that showed significant reward dependence in one or more time windows, and the numerator indicates the number of cells that showed significant dependence on stimulus-presentation frequency in all of the windows in which it showed significant reward dependence. In a majority of the cells with reward dependence, the firing was not correlated with the presentation frequency of individual stimuli.
These results indicate that the reward dependence of neuronal activity was not coupled with differences in behavioral parameters. Therefore, it is unlikely that the differences in behavior caused the differences in the firing rate between the two reward conditions. The averaged difference in deviation of eye position from the fixation center was very small in both monkeys (Table 6). It is unlikely that these small differences in eye position contributed to the apparent reward dependence of neuronal activities.
Table 6.
Distances between mean eye positions in rewarded and unrewarded trials
| 100–500 ms | 500–900 ms | 900–1300 ms | |
|---|---|---|---|
| Monkey 1 | 0.07° (0.21) | 0.12° (0.32) | 0.12° (0.71) |
| Monkey 2 | 0.03° (0.10) | 0.17° (0.33) | 0.21° (0.46) |
Distances between mean eye positions in rewarded trials and those in unrewarded trials were calculated during the recording from each cell, and the median values are shown here. The numbers in parentheses are the maximal values. The differences were small.
Visual selectivity in rewarded and unrewarded trials
The selectivity of neuronal responses for visual stimuli was examined in the same three pre-reward windows as those used for the test of reward dependence. Significant selectivity was found in 61% of 201 PRh cells and in 81% of 139 TE cells (p < 0.05 corrected, F test).
The strength of stimulus selectivity was not different between rewarded and unrewarded stimuli, as can be seen in the scatter diagram in Figure 6 plotted for activities in the window from 100 to 500 ms from stimulus onset. To quantitatively evaluate the difference in stimulus selectivity between rewarded and unrewarded stimuli, we defined an index, (vr = + (t) − vr = − (t))/(vr = + (t) + vr = − (t)), at t = 300 ms. The average of this index across cells was 0.014 in PRh and −0.018 in TE, which were both not significantly different from 0 (p = 0.28 in PRh, p = 0.35 in TE, t test, two-tailed).
Figure 6.

Comparison of the visual stimulus selectivity between rewarded and unrewarded stimuli. The magnitude of the stimulus selectivity in rewarded trials was defined by the root of mean variance of firing rates in go rewarded and no-go rewarded conditions, which can be written as  . The magnitude of the stimulus selectivity in unrewarded trials was calculated similarly but from firing rates in the go unrewarded and no-go unrewarded conditions, that is
  . The mean firing rates in the window from 100 to 500 ms from the stimulus onset were used. The magenta dots represents PRh cells, and the cyan dots represent TE cells. The stimulus selectivity was comparable between the rewarded and unrewarded conditions in both areas.
Time course of reward dependence
The time course of the population average of normalized magnitude of reward dependence uR/(uS + uE) is shown in Figure 7, together with that of population average of normalized magnitude of stimulus selectivity uS/uE. The reward dependence appeared later than the visual stimulus selectivity in both TE and PRh (Fig. 7A,B). The stimulus selectivity disappeared soon after the stimulus offset, whereas the reward dependence remained large until the time of reward delivery. Both the reward dependence and stimulus selectivity appeared earlier in TE than in PRh (Fig. 7C,D).
Figure 7.

Time courses of reward dependence and visual stimulus selectivity. A, B, The blue lines indicate the time course of averaged normalized stimulus selectivity uS/uE in PRh cells (A) and in TE cells (B). All of the cells (201 PRh cells and 139 TE cells) were included. The unbiased estimate of the variance attributable to stimulus selectivity was normalized by the trial variance and then averaged across cells in each area. The red and cyan lines indicate the time course of averaged normalized reward dependence uR/(uS + uE). The unbiased estimate of the variance attributable to reward dependence was normalized by a sum of the unbiased estimate of the stimulus selectivity variance and the trial variance and then averaged across cells in each area. All of the lines in A and B were scaled by the peak value of each line to facilitate the comparison of their time courses. The light blue area indicates the period of visual cue presentation, and the red vertical line indicates the time of reward delivery. The peak value of the reward dependence was 4.8% and that of stimulus selectivity was 73% in A, and they were 2.9 and 114% in B, respectively. The stimulus selectivity preceded the reward dependency in both areas. C, The time courses of reward dependence in PRh cells (cyan) and TE cells (magenta). D, The time courses of stimulus selectivity in PRh cells (purple) and TE cells (blue). The two lines are scaled by the peak value of each line. Both the stimulus selectivity and reward dependence appeared and developed earlier in TE.
The onset latencies of stimulus selectivity and reward dependence measured in individual cells confirmed these observations. The averaged onset latency of reward dependence was ∼93–99 ms longer than that of stimulus selectivity in each region (Table 7). The difference between onset latencies of stimulus selectivity and reward dependence was significant in both regions (p < 10−10 in PRh and p < 10−10 in TE, Mann–Whitney U test). Both the onset latency of stimulus selectivity and that of reward dependence were ∼20 ms longer in PRh than in TE. The regional difference in the latency of reward dependence was significant (p = 2.5 × 10⁻³, Mann–Whitney U test).
Table 7.
Onset latency of reward dependence and stimulus selectivity
| PRh | TE | Difference | |
|---|---|---|---|
| Reward dependence | 222 ms (49) | 198 ms (24) | 24 ms |
| Stimulus selectivity | 123 ms (122) | 105 ms (112) | 18 ms |
| Difference | 99 ms | 93 ms |
The latency was determined in each of the cells with significant reward dependence or stimulus selectivity (see Materials and Methods) and then averaged across the cells. The numbers in parentheses indicate the numbers of cells that showed enough strong dependence for determining the latency.
Motor dependence
The normalized magnitude of motor dependence in the window from 100 to 500 ms after the stimulus onset is plotted in Figure 8 as a cumulative frequency histogram, together with that of reward dependence in the same time window. We limited the analysis of motor dependence to this window because the onset latency of go responses was ∼300–350 ms. The motor dependence in the later windows might include effects of executed go responses. The curve of motor dependence magnitude was close to that of expected distribution of fake dependence (p = 0.21 in PRh and p = 0.82 in TE, Kolmogorov–Smirnov test). When the magnitude of motor dependence was compared with that of reward dependence between the top 20% values of motor distribution and those of reward distribution, the motor dependence was significantly smaller than the reward dependence in PRh (p = 2.1 × 10⁻⁷, t test, one-tailed). The comparison in individual monkeys provided p = 4.6 × 10⁻⁴ in monkey 1 and p = 1.1 × 10⁻⁶ in monkey 2. The motor dependence was also smaller than the reward dependence in TE, but the significance was marginal (p = 0.058) even in the combined data.
Figure 8.

Comparison of the strength of motor dependence with that of reward dependence in PRh (A) and TE (B). The green lines show the cumulative frequency of the cell in terms of the strength of motor dependence, calculated by the ratio of the variance attributable to motor conditions to the total variance but excluding the trial variance (m(t))2/2[(m(t))2/2 + (r(t))2/2 + v(t)]. The red lines show the cumulative frequency of the cell in terms of the strength of reward dependence (r(t))2/2[(m(t))2/2 + (r(t))2/2 + v(t)]. The variances of responses were calculated in a window from 100 to 500 ms after the stimulus onset. The broken lines indicate the theoretical distribution of false dependence originating in visual stimulus selectivity. The motor dependence was smaller than the reward dependence in both areas.
Discussion
After experiencing the contingency between visual stimuli and reward outcomes for >1 month, PRh and TE responses to the stimuli showed significant information about the reward conditions coupled with the stimuli. Approximately one-third of PRh cells and one-fifth of TE cells showed responses with significant differences between responses to the stimuli coupled with rewards and responses to those not coupled with rewards. Some cells showed stronger responses to the stimuli coupled with rewards, and others showed stronger responses to the stimuli not coupled with rewards. Although this dependency on the coupled reward conditions appeared as a part of the selectivity for stimuli, the component of selectivity represented the reward outcomes coupled with the visual stimuli rather than physical properties of visual stimuli. The ratio of this reward dependence to the genuine visual selectivity varied from cell to cell, but it was larger on average in PRh than in TE (Fig. 5). Responses of some PRh cells appeared nearly categorical with respect to the reward conditions, with only a small overlap between the magnitudes of responses to the stimuli coupled with rewards and those not coupled with rewards (e.g., the cell shown in Fig. 5B).
The present results thus demonstrate that responses of cells in PRh and TE are not purely visual, but they can represent nonvisual events associated with visual stimuli. However, PRh and TE cells do not respond equally to all kinds of nonvisual events associated with visual stimuli. The motor actions indicated by the visual cues were less represented in PRh and TE activity than were the reward outcomes. PRh and TE are therefore more involved in representation of reward consequences of visual stimuli than motor requirements associated with visual stimuli.
A dependence of responses to visual stimuli on the reward conditions coupled with the stimuli could arise through several possible mechanisms. First, the neuronal networks in TE and PRh might have changed through experience of the coupling throughout the experiment. In this case, the reward contingency would have been coded through the forward pathway as was the stimulus selectivity.
A more indirect mechanism would be via a difference in the monkeys' motivational or arousal state that influences animals' behavior. For example, the monkey would anticipate the reward outcome in a trial based on activity in brain regions other than PRh and TE, the anticipation of different reward outcomes would change the monkey's motivation or arousal, and these differences in the monkey's state would modulate neuronal responses in PRh and TE. This scenario does not fit well with the present results because we found cells with larger responses in unrewarded trials as well as cells with larger responses in rewarded trials. Although we find it unlikely that an increase in motivation or arousal would have enhanced responses in some cells but suppressed responses in others, we examined this possibility using the latency of monkeys' go responses and the strength of anticipatory sucking of the liquid pipe. The response latency and strength of drinking behavior have been shown to covary with discharges of dopamine neurons and neurons in the ventral striatum (Shidara et al., 1998; Satoh et al., 2003; Tobler et al., 2005). The variations in these behavioral parameters included both stimulus-dependent components and stimulus-independent components in our experiments. We used the stimulus-dependent components to demonstrate that the monkeys correctly anticipated the reward outcomes based on the visual stimuli. The neuronal responses in PRh and TE did not covary with the stimulus-independent components of behavioral variations, which were as large as the stimulus-dependent components. Therefore, it is not likely that the reward dependence of neuronal responses in PRh and TE was a mere reflection of the monkeys' state of motivation/arousal. However, additional studies are necessary to conclusively exclude that possibility.
The results regarding the onset latency of the reward dependence provide constraints on the mechanisms of reward dependence. The onset latency of the reward dependence in neuronal responses in PRh and TE was ∼93–99 ms longer than the onset latency of visual stimulus selectivity. This period of 93–99 ms may be long enough for the visual signals to reach some downstream brain region, such as the orbitofrontal cortex or amygdala, get translated into reward information, and fed back to PRh and TE. However, whereas the feedback connections to PRh from the reward-related brain regions are stronger than those to TE (Richfield et al., 1989; Akil and Lewis, 1994; Carmichael and Price, 1995; Stefanacci et al., 1996; Rempel-Clower and Barbas, 2000; Stefanacci and Amaral, 2002), the onset latency of the reward dependence was 24 ms shorter in TE than in PRh. This shorter onset latency in TE could not be explained if the reward information had come from downstream regions in a simple serial-backward manner (Fig. 9A). A possibility consistent with the present results is that the conversion from visual to reward information takes place within the neuronal circuitries in TE and PRh. A partial conversion from visual to reward information first occurs in TE, and then a more extensive conversion occurs in PRh (Fig. 9B). However, the period of 93–99 ms may be too long for the conversion within intrinsic circuitries. It is also possible that the two mechanisms work together.
Figure 9.

Two models for translating visual information (white part) to reward information (black part). A, Feedback model. The visual-to-reward conversion (indicated by the white downward arrow) occurs in a higher center, and the reward information is sent along the feedback pathway. According to this model, the onset latency of the reward signal should be longer in TE than in PRh. B, Progressive model. The visual-to-reward conversion occurs progressively along the forward pathway. This model predicts a longer onset latency of reward signal in PRh than in TE, which is what we found in the present study.
Previous studies reported changes in the stimulus selectivity of TE cells through long-term experience. After long-term training on a task to discriminate a particular group of shapes from one another, responses to the stimuli became larger (Logothetis et al., 1995; Kobatake et al., 1998) and more selective (Baker et al., 2002). Training of categorical discrimination of similar shapes into two groups made TE cells more selective to the features useful for the discrimination than to the features irrelevant to the discrimination (Sigala and Logothetis, 2002). The present results are consistent with these previous results in indicating the changeability of the selectivity of TE cells in adult monkeys through long-term experience.
Liu and Richmond (2000) found that neuronal responses in PRh, but not in TE, represented the type of reward schedule (one, two, and three successful trials to reach a reward) and the position of the current trial in the schedule. The absence of TE cells representing the reward schedule by Liu and Richmond (2000) might appear inconsistent with the current finding of reward dependence in TE cells, because schedule state predicts reward. However, the apparent inconsistency could be attributable to differences in criteria. In the experiments of Liu and Richmond (2000), the same cue (the darkest bar) was used to indicate the last trials in the schedules consisting of one, two, and three trials (1 of 1, 1 of 2, and 3 of 3). A cell was judged to be selective only when its responses to the cue were different among the three cases. However, suppose a cell responded to an immediate availability of rewards in the trial. The cell should have responded with equal strength in the three cases and then be regarded as nonselective. Therefore, the results of Liu and Richmond (2000) are not inconsistent with the representation of stimulus–reward association in TE cells.
Rolls et al. (1977) reversed the contingency between visual objects and their reward values during recordings from single TE cells. They found that the stimulus selectivity of TE cells did not follow the reversal. The capability of cells to quickly follow the reversal is different from that of learning the stimulus–reward contingency through long-term experience. Responses after such a reversal within 1 d have been found in the lateral hypothalamus by the same group of authors (Rolls et al., 1979) and more recently in the prefrontal cortex (Watanabe, 1990; Matsumoto et al., 2003).
The amygdala and orbitofrontal cortex have been thought to be the sites in which sensory information is associated with reward information. As discussed above, the present results concerning the onset latency of reward dependency in PRh and TE are not in accordance with the idea that reward information in PRh and TE reflects information received from these downstream brain sites. The amygdala, orbitofrontal cortex, and PRh may store the memory of visual–reward association independently. It has been found that cells in the orbitofrontal cortex quickly adjust their activity after a reversal in the visual–reward contingency (Thorpe et al., 1983). The behavior of PRh cells in response to such a reversal has not yet been examined. If the absence of quick adjustment to a reversal found by Rolls et al. (1977) for TE cells is also true for PRh cells, the representations of reward contingency in the orbitofrontal cortex and the inferior temporal areas will be different in the time domain. The orbitofrontal cortex represents the context-dependent reward value of the visual stimuli at a given moment in time, whereas PRh and TE represent attributes more stably associated with the visual stimuli.
In conclusion, the present results show that PRh is a brain region in which reward outcomes associated with visual object stimuli are represented. We also shown that the conversion of visual features into reward contingencies already starts in TE, indicating that TE is not a purely “sensory” area.
Footnotes
This work was supported in part by the Grant-in-Aid for Scientific Research on Priority Areas (17022047) from the Ministry of Education, Culture, Sports, Science, and Technology of Japan.
References
- Akil M, Lewis DA (1994). The distribution of tyrosine hydroxylase-immunoreactive fibers in the human entorhinal cortex. Neuroscience 60:857–874. [DOI] [PubMed] [Google Scholar]
- Baker CI, Behrmann M, Olson CR (2002). Impact of learning on representation of parts and wholes in monkey inferotemporal cortex. Nat Neurosci 5:1210–1216. [DOI] [PubMed] [Google Scholar]
- Buckley MJ, Gaffan D (1997). Impairment of visual object-discrimination learning after perirhinal cortex ablation. Behav Neurosci 111:467–475. [DOI] [PubMed] [Google Scholar]
- Carmichael ST, Price JL (1995). Limbic connections of the orbital and medial prefrontal cortex in macaque monkeys. J Comp Neurol 363:615–641. [DOI] [PubMed] [Google Scholar]
- Gaffan D, Murray EA (1992). Monkeys (Macaca fascicularis) with rhinal cortex ablations succeed in object discrimination learning despite 24-hr intertrial intervals and fail at matching to sample despite double sample presentations. Behav Neurosci 106:30–38. [DOI] [PubMed] [Google Scholar]
- Gross CG (1994). How inferior temporal cortex became a visual area. Cereb Cortex 4:455–469. [DOI] [PubMed] [Google Scholar]
- Higuchi S, Miyashita Y (1996). Formation of mnemonic neuronal responses to visual paired associates in inferotemporal cortex is impaired by perirhinal and entorhinal lesions. Proc Natl Acad Sci USA 93:739–743. [DOI] [PMC free article] [PubMed] [Google Scholar]
- Kobatake E, Wang G, Tanaka K (1998). Effects of shape-discrimination training on the selectivity of inferotemporal cells in adult monkeys. J Neurophysiol 80:324–330. [DOI] [PubMed] [Google Scholar]
- Liu Z, Richmond BJ (2000). Response differences in monkey TE and perirhinal cortex: stimulus association related to reward schedules. J Neurophysiol 83:1677–1692. [DOI] [PubMed] [Google Scholar]
- Liu Z, Murray EA, Richmond BJ (2000). Learning motivational significance of visual cues for reward schedules requires rhinal cortex. Nat Neurosci 3:1307–1315. [DOI] [PubMed] [Google Scholar]
- Liu Z, Richmond BJ, Murray EA, Saunders RC, Steenrod S, Stubblefield BK, Montague DM, Ginns EI (2004). DNA targeting of rhinal cortex D2 receptor protein reversibly blocks learning of cues that predict reward. Proc Natl Acad Sci USA 101:12336–12341. [DOI] [PMC free article] [PubMed] [Google Scholar]
- Logothetis NK, Sheinberg DL (1996). Visual object recognition. Annu Rev Neurosci 19:577–621. [DOI] [PubMed] [Google Scholar]
- Logothetis NK, Pauls J, Poggio T (1995). Shape representation in the inferior temporal cortex of monkeys. Curr Biol 5:552–563. [DOI] [PubMed] [Google Scholar]
- Matsumoto K, Suzuki W, Tanaka K (2003). Neuronal correlates of goal-based motor selection in the prefrontal cortex. Science 301:229–232. [DOI] [PubMed] [Google Scholar]
- Murray EA, Bussey TJ (1999). Perceptual-mnemonic functions of the perirhinal cortex. Trends Cogn Sci 3:142–151. [DOI] [PubMed] [Google Scholar]
- Naya Y, Yoshida M, Miyashita Y (2001). Backward spreading of memory-retrieval signal in the primate temporal cortex. Science [Erratum (2001) 291:1703] 291:661–664. [DOI] [PubMed] [Google Scholar]
- Naya Y, Yoshida M, Miyashita Y (2003). Forward processing of long-term associative memory in monkey inferotemporal cortex. J Neurosci 23:2861–2871. [DOI] [PMC free article] [PubMed] [Google Scholar]
- Rempel-Clower NL, Barbas H (2000). The laminar pattern of connections between prefrontal and anterior temporal cortices in the rhesus monkey is related to cortical structure and function. Cereb Cortex 10:851–865. [DOI] [PubMed] [Google Scholar]
- Richfield EK, Young AB, Penney JB (1989). Comparative distribution of dopamine D-1 and D-2 receptors in the cerebral cortex of rats, cats, and monkeys. J Comp Neurol 286:409–426. [DOI] [PubMed] [Google Scholar]
- Rolls ET, Judge SJ, Sanghera MK (1977). Activity of neurons in the inferotemporal cortex of the alert monkey. Brain Res 130:229–238. [DOI] [PubMed] [Google Scholar]
- Rolls ET, Sanghera MK, Roper-Hall A (1979). The latency of activation of neurones in the lateral hypothalamus and substantia innominata during feeding in the monkey. Brain Res 164:121–135. [DOI] [PubMed] [Google Scholar]
- Sakai K, Miyashita Y (1991). Neural organization for the long-term memory of paired associates. Nature 354:152–155. [DOI] [PubMed] [Google Scholar]
- Saleem KS, Tanaka K (1996). Divergent projections from the anterior inferotemporal area TE to the perirhinal and entorhinal cortices in the macaque monkey. J Neurosci 16:4757–4775. [DOI] [PMC free article] [PubMed] [Google Scholar]
- Satoh T, Nakai S, Sato T, Kimura M (2003). Correlated coding of motivation and outcome of decision by dopamine neurons. J Neurosci 23:9913–9923. [DOI] [PMC free article] [PubMed] [Google Scholar]
- Shidara M, Aigner TG, Richmond BJ (1998). Neuronal signals in the monkey ventral striatum related to progress through a predictable series of trials. J Neurophysiol 18:2613–2625. [DOI] [PMC free article] [PubMed] [Google Scholar]
- Sigala N, Logothetis NK (2002). Visual categorization shapes feature selectivity in the primate temporal cortex. Nature 415:318–320. [DOI] [PubMed] [Google Scholar]
- Stefanacci L, Amaral DG (2002). Some observations on cortical inputs to the macaque monkey amygdala: an anterograde tracing study. J Comp Neurol 451:301–323. [DOI] [PubMed] [Google Scholar]
- Stefanacci L, Suzuki WA, Amaral DG (1996). Organization of connections between the amygdaloid complex and the perirhinal and parahippocampal cortices in macaque monkeys. J Comp Neurol 375:552–582. [DOI] [PubMed] [Google Scholar]
- Tanaka K (1996). Representation of visual features of objects in the inferotemporal cortex. Neural Netw 9:1459–1475. [DOI] [PubMed] [Google Scholar]
- Thornton JA, Rothblat LA, Murray EA (1997). Rhinal cortex removal produces amnesia for preoperatively learned discrimination problems but fails to disrupt postoperative acquisition and retention in rhesus monkeys. J Neurosci 17:8536–8549. [DOI] [PMC free article] [PubMed] [Google Scholar]
- Thorpe SJ, Rolls ET, Maddison S (1983). The orbitofrontal cortex: neuronal activity in the behaving monkey. Exp Brain Res 49:93–115. [DOI] [PubMed] [Google Scholar]
- Tobler PN, Fiorillo CD, Schultz W (2005). Adaptive coding of reward value by dopamine neurons. Science 307:1642–1645. [DOI] [PubMed] [Google Scholar]
- Watanabe M (1990). Prefrontal unit activity during associative learning in the monkey. Exp Brain Res 80:296–309. [DOI] [PubMed] [Google Scholar]
- Watanabe M, Cromwell HC, Tremblay L, Hollerman JR, Hikosaka K, Schultz W (2001). Behavioral reactions reflecting differential reward expectations in monkeys. Exp Brains Res 140:511–518. [DOI] [PubMed] [Google Scholar]