

Abstract
The Nougaret form of dominant stationary night blindness is linked to a G38D mutation in the rod transducin-α subunit (Tα). In this study, we have examined the mechanism of Nougaret night blindness using transgenic mice expressing TαG38D. The biochemical, electrophysiological, and vision-dependent behavioral analyses of the mouse model revealed a unique phenotype of reduced rod sensitivity, impaired activation, and slowed recovery of the phototransduction cascade. Two key deficiencies in TαG38D function, its poor ability to activate PDE6 (cGMP phosphodiesterase) and decreased GTPase activity, are found to be the major mechanisms altering visual signaling in transgenic mice. Despite these defects, rod-mediated sensitivity in heterozygous mice is not decreased to the extent seen in heterozygous Nougaret patients.
Keywords: photoreceptor, phototransduction, transducin, retina, G-proteins, night blindness
Introduction
In the rod phototransduction cascade, transducin (T) couples photoexcitation of rhodopsin (R) to the activation of cGMP phosphodiesterase (PDE6) (Burns and Baylor, 2001; Arshavsky et al., 2002). The GTP-bound form of the α subunit of transducin (Tα) binds to the γ subunit of PDE6 (Pγ), activating the enzyme. Deactivation of this complex requires the GTPase activity of Tα, which is stimulated by the GTPase activating protein (GAP) complex RGS9-1/Gβ5/R9AP (He et al., 1998; Makino et al., 1999; Chen et al., 2000). In humans, mutations in key components of the cascade can cause either photoreceptor degeneration or congenital stationary night blindness (CSNB) (for review, see Dryja, 2000; Lem and Fain, 2004). One intriguing example of such a disease-linked mutation is the G38D mutation in Tα, which was found in patients with a particular form of CSNB that originated in the Nougaret family (Dryja et al., 1996). Nougaret patients show an ∼100-fold reduction in rod sensitivity (Sandberg et al., 1998), but the mechanism by which the mutation leads to this impairment is not known.
The functional consequences of the G38D mutation have been analyzed using a transducin-like chimeric Tα (Tα*) expressed in Escherichia coli (Muradov and Artemyev, 2000). The G38D substitution did not affect the affinity of Tα* for Tβγ nor the ability of the heterotrimer to be activated by photoexcited R (R*). However, the mutation did reduce the GTPase activity of Tα* and its stimulation by RGS9-1. Surprisingly, the most striking impairment was a defect in the mutant effector function. Tα*G38D failed to bind Pγ and to activate PDE6 in a reconstituted system (Muradov and Artemyev, 2000).
Based on these observations, two distinct mechanisms can contribute to the phenotype of Nougaret patients. First, the defect in GTPase activity suggested by the chimeric mutant may slow deactivation, leading to a constitutive level of Tα and PDE activity that suppresses the dark current and reduces the amplitude of rod responses. Support for this hypothesis stems from studies of the corresponding amino acid Gly12 in p21ras, which is one of the most common transforming mutations (Barbacid, 1987). A substitution of Gly12 by Val blocks the GTPase activity of p21ras and prevents its stimulation by GAPs, leading to constitutive activation of p21ras-mediated pathways (Lowy and Willumsen, 1993). A second distinct mechanism is that the desensitizing effect of TαG38D arises from its impaired ability to activate PDE6, as is the case in vitro for the chimera Tα*G38D (Muradov and Artemyev, 2000). This mechanism would be expected to reduce the amplitude and slow the recovery kinetics of flash responses (Tsang et al., 1998). Because Nougaret CSNB is dominantly inherited (Dryja et al., 1996) and because complete loss of one Tα allele produces little change in rod sensitivity (Calvert et al., 2000), this proposed mechanism requires a dominant-negative phenotype for TαG38D, whereby the mutant protein must block the signaling by Tα expressed from the wild-type allele. To test these two hypotheses in vivo, we have generated transgenic mice expressing TαG38D and examined the mutant function using biochemical, electrophysiological, and vision-dependent behavioral approaches.
Materials and Methods
Generation of G38D transgenic mice.
All experimental procedures involving the use of mice were performed in accordance with the National Institutes of Health (NIH) guidelines and the protocol approved by the University of Iowa Animal Care and Use Committee. A pBRH Tα transgenic construct contained the mouse Tα genomic sequence of ∼5.5 kb (Raport et al., 1989) flanked by the 4.4 kb mouse rod opsin promoter fragment (Lem et al., 1991) and polyadenylation signal. The Glu-Glu (EE) monoclonal antibody epitope was introduced into Tα to quantitatively assess the level of expression of the G38D mutant (see Fig. 1A). The two substitutions required to convert the Tα sequence 162GYVPTE167 into the epitope sequence EYMPTE, and the G38D substitution, were created using the QuickChange mutagenesis kit (Stratagene, La Jolla, CA) according to the manufacturer’s protocol. The DNA fragment of 9 kb was released from the pBRH-TαEEG38D plasmid by restriction with NotI and gel purified. The DNA fragment was microinjected into mouse embryos and implanted into pseudopregnant females in the transgenic core facilities at the University of Iowa. Transgenic mice were identified by PCR using mouse tail DNA with a pair of primers chosen to amplify a 300 bp fragment surrounding the junction between the Tα and polyadenylation signal sequences. Five potential TαEEG38D transgenic mouse founders were generated, which were then mated to C57BL/6 mice. Three of the founders transmitted the TαEEG38D transgene with a Mendelian inheritance pattern, and two of the three transgenic lines expressed the Tα mutant. To move the transgene into the hemizygous (Tα+/−) and knock-out (Tα−/−) background, one transgenic mouse line (G38D/Tα+/+) was selected for breeding with the rod Tα knock-out mice (Calvert et al., 2000), which were homozygous for the Leu450 variant of RPE65 (Danciger et al., 2000). Control transgenic mice expressing the EE-tagged Tα in the Tα+/− background were generated previously (Kerov et al., 2005). The TαEE/Tα+/− mice were bred with the Tα knock-out mice to produce TαEE/Tα−/− control animals.
Figure 1.

A, Transgenic construct used for generation of mutant TαEE and TαEEG38D mice. B, C, Expression of G38D in G38D/Tα−/− and G38D/Tα+/− mice. Immunoblot analysis with anti-rod Tα (K-20) (B) and anti-EE epitope (C) antibodies is shown. EE–Tα*-purified recombinant His6- and EE-tagged Tα* are also shown. The Tα*EE standards were used with the addition of 40 μg of Tα−/− retinal homogenate. Retinas from transgenic G38D/Tα−/−, G38D/Tα+/−, and control (Tα+/+) mice were homogenized and subjected to SDS-PAGE and Western blotting. ret. protein, Retinal protein.
Immunoblot analysis and quantification of transgene expression.
Total mouse retinal homogenates were obtained by solubilization of one to two retinas in 100 μl of 10% SDS-Na using brief sonication and heating. Protein concentrations were determined using the DC Protein Assay (Bio-Rad, Hercules, CA) and bovine serum albumin (BSA) dissolved in 10% SDS-Na as a standard. Typically, the total protein content of a homogenate obtained from a single mouse retina was ∼400–450 μg. Samples of retinal homogenates were subjected to SDS-PAGE in 8–12% gels, electrotransferred onto nitrocellulose membranes, and probed with the following antibodies: anti-rod Tα (K-20), anti-Gβ1 (M-14), and anti-Gγ1 (P-19) (Santa Cruz Biotechnology, Santa Cruz, CA); EE monoclonal (Covance, Princeton, NJ); 1D4 monoclonal anti-rod opsin (National Cell Culture Center, Minneapolis, MN); anti-PDE6α (PA1-720) and anti-PDE6β (PA1-722) (Affinity Bioreagents, Golden, CO); or anti-RGS9. Anti-peptide RGS9-469-484 antibodies were generated in sheep by Elmira Biologicals (Iowa City, IA). The antibody–antigen complexes were detected using anti-rabbit, anti-mouse, or anti-sheep antibodies conjugated to horseradish peroxidase (Sigma, St. Louis, MO) and ECL reagent (Amersham Biosciences, Piscataway, NJ). The EE-tagged tranducin-like chimeric Tα* (Tα*EE) was constructed by PCR-directed mutagenesis similar to that described by Muradov and Artemyev (2000). E. coli-expressed and purified Tα*EE with the addition of 40 μg of Tα−/− retinal homogenate was used as a standard. Nitrocellulose membranes were exposed to film, and integrated densities of scanned individual bands were measured with Scion Image software (version Beta 4.0.2; Scion, Frederick, MD).
Immunohistochemistry.
For dark adaptation, mice were kept in the dark for at least 12 h. All dark procedures were performed under infrared illumination using night vision goggles. For light adaptation, the pupils were dilated by applying one drop of 1% tropicamide, followed by one drop of 2.5% phenylephrine hydrochloride before exposure to a fluorescent white light (50 min, ∼200 lux). The mice were killed with CO2. Mouse eyeballs were enucleated, and the corneas were perforated with a 21 gauge needle and fixed in 4% formaldehyde in PBS for 1 h at 22°C. After fixation, the eyeballs were cut in half, the cornea and lens were removed, and the eyecups were submersed in a 30% sucrose solution in PBS for 5 h at 4°C. The eyecups were then embedded in tissue freezing medium (American Master*Tech Scientific, Lodi, CA) and frozen on dry ice. Radial sectioning (10 μm) of the retina was performed using a cryomicrotome (HM 505E; Microm, Oxon, UK). Retinal cryosections were air-dried and kept at −80°C until use. Before staining, sections were warmed up to 22°C and incubated in 0.1% Triton/PBS for 30 min, followed by incubation with 2% normal goat serum/5% BSA in PBS for 30 min. Sections were then incubated with rabbit anti-rod Tα antibody TF-15 (1:200), a monoclonal anti-EE antibody (Covance), or rabbit anti-arrestin antibodies (1:100) for 3 h. After a 1 h incubation with goat anti-rabbit AlexaFluor 568 or goat anti-mouse AlexaFluor 488 secondary antibodies (1:1000; Invitrogen, Eugene, OR), the sections were visualized using a Zeiss (Thornwood, NY) LSM 510 confocal microscope. To evaluate mouse retina morphology, eyeballs were fixed in 2.5% gluteraldehyde in cacodylate buffer for 2 h at 22°C, cut in half to remove the cornea and lens, dehydrated through a series of acetones, and embedded in Epon. Radial sections (1 μm) were stained with toluidine blue and photographed through a Nikon (Tokyo, Japan) Optiphot microscope using a Spot camera (Diagnostic Instruments, Sterling Heights, MI).
Biochemical analysis of transducin function in preparations of mouse rod outer segments.
Mouse rod outer segment (ROS) membranes were prepared as described previously (Tsang et al., 1998). Rhodopsin concentrations were determined using the difference in absorbance at 500 nm before and after photobleaching of ROS preparations solubilized in 1% Ammonix LO. To measure light-dependent binding of GTPγS, ROSs (12 μl) from dark-adapted G38D/Tα+/−, G38D/Tα−/−, or control Tα+/+ mice containing 10 μm rhodopsin were mixed with 6 μl of 10 μm [35S]GTPγS under infrared illumination. After a 10 s incubation, the amount of bound GTPγS was determined in a 7 μl aliquot by the nitrocellulose filter binding assay (Tsang et al., 1998). The rest of the sample was bleached to determine the GTPγS binding in the light. The single-turnover GTPase measurements were initiated by mixing photobleached ROS (17 μl) containing 10 μm rhodopsin with 17 μl of 0.1 μm [γ-32P]GTP. The time course of 32Pi formation was determined using the activated charcoal procedure (Tsang et al., 1998) after the reactions were stopped with perchloric acid. The GTPase rate constants were calculated by fitting the experimental data to an exponential function: %GTP hydrolyzed = 100(1 − e−kt), where k is the rate constant for GTP hydrolysis.
The interaction between the Tα subunit and Pγ was measured using a fluorescence-based assay in which Pγ was labeled with 3-(bromoacetyl)-7-diethyl aminocoumarin at Cys68 (PγBC) and mixed with ROS purified from transgenic or control mice. The relative change (F/Fo) in PγBC (10 nm) fluorescence (excitation, 445 nm; emission, 495 nm) was determined after the addition of increasing concentrations of ROS and 1 μm GTPγS (Artemyev, 1997).
To measure PDE6 activation by transducin, photobleached ROSs (4 μm R* for G38D/Tα+/− or Tα+/+ ROS; 10 μm R* for G38D/Tα−/−) were incubated with 3 μm cGMP for 3 min to stabilize the PDE6 basal activity (Tsang et al., 1998). The reactions were started by the addition of 2 mm [3H]cGMP with or without 2 μm GTPγS. cGMP hydrolysis was terminated after 10 s by heating the samples for 2 min at 100°C. After cooling, 0.1 U of bacterial alkaline phosphatase (Sigma) was added to each sample, followed by incubation for 20 min at 37°C. Nonhydrolyzed cGMP was removed with AG1-X2 anion exchange resin (Bio-Rad), and [8-3H]guanosine was counted in a liquid scintillation counter.
Suction electrode recordings from intact rods.
Mice were cared for and handled following an approved protocol from the Animal Care and Use Committee of the University of California–Davis and in compliance with NIH guidelines for the care and use of experimental animals. Before an experiment, animals were dark adapted overnight for a minimum of 12 h. Animals were anesthetized and killed under infrared light, and the retinas were dissected and stored on ice in L-15 solution with 10 mm glucose and 0.1 mg/ml BSA (Sigma). Suction electrode recordings were performed as described previously (Krispel et al., 2003). Briefly, the retina was chopped into small pieces in a chamber containing the L-15 solution supplemented with DNase I (∼25 U/ml; Amersham Biosciences). Tissue was then placed in a recording chamber perfused with bicarbonate solution, pH 7.4, supplemented with 10 mm glucose held at 35–37°C. Individual rods were visualized under infrared light using a CCD camera (Stanford Photonics, Palo Alto, CA). The outer segment (OS) of an individual rod was gently drawn into the tip of a capillary pipette containing HEPES solution, pH 7.4. The membrane currents were recorded by a current-to-voltage converter (Axopatch 1B; Molecular Devices, Union City, CA) and low-pass filtered (8-pole Bessel; Frequency Devices, Haverhill, MA) using 30 Hz corner frequency. Data were digitized at 200 Hz using IGOR-National Instruments (Austin, TX) acquisition software (IgorPro for NIDAQ for Windows; Wavemetrics, Lake Oswego, OR) and analyzed off-line. Rods were presented with 10 ms flashes of 500 nm light. The intensity of the light was controlled by using calibrated neutral density filters.
The time course of the light-activated PDE6 activity can be described by the following equation (Pugh and Lamb, 1993):
where r(t) is the mean flash response over time, rmax is the saturating response amplitude, and n is the cooperativity of the cGMP-gated channel, which we assume to be 3. The rate of rise of PDE6 activity, dPDE*(t)/dt, was measured as the slope of a line fitted to the initial rising phase of PDE*(t) for a duration of at least 10 ms. To measure τtail, the tail end of the falling phase of the average flash response was fitted with a single exponential function. For responses with amplitudes that exceeded the linear range (20% of the saturating response amplitude), the average response was first decompressed assuming exponential current saturation.
Electroretinography.
Electroretinograms (ERGs) were recorded and analyzed as described previously (Kennedy et al., 2001). Mice homozygous for the RPE65Leu450 allele were selected for the paired flash recovery and dark adaptation experiments to exclude the effects of the RPE65 polymorphism on rhodopsin regeneration (Danciger et al., 2000). Mice were dark adapted overnight, anesthetized with ketamine/xylazine (140/0.5 mg/kg), and maintained at 37°C. Pupils were dilated with tropicamide and phenylephrine. Flashes were focused on the eye through a fiber-optic cable and lens. A gold ring electrode embedded in a contact lens (Bayer, 1999) was placed on one drop of 2–3% methyl cellulose on the cornea with a reference electrode in the mouth. The unattenuated energy of the flash of white light measured at the position of the cornea was 2.9 mJ/cm2. This intensity was used for the light-adapting flash for mice (see Fig. 7C), and the adapting flash was 30 μJ (see Fig. 7B). ERG signals were filtered between 1 Hz and 3 kHz and sampled at 5 kHz.
Figure 7.
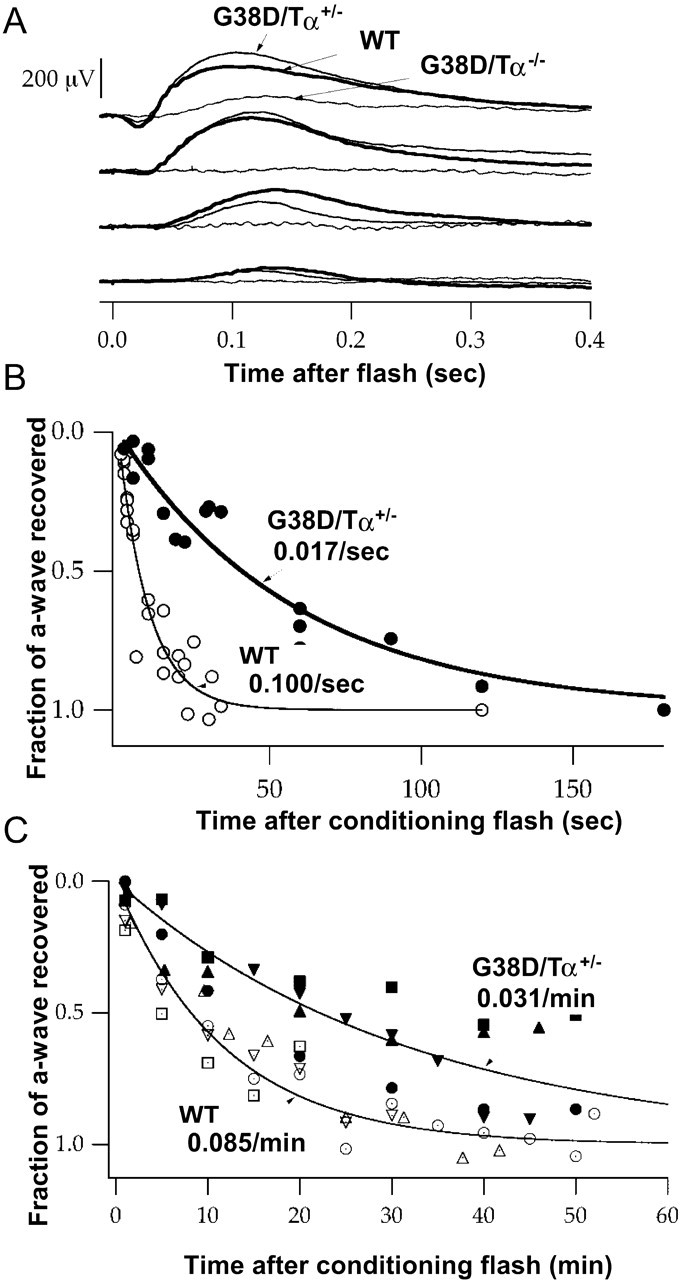
A, Dim flash ERG responses. Mice were dark adapted overnight, and ERGs were recorded. Thin curve, G38D/Tα−/− mice; medium curve, G38D/Tα+/− mice; bold curve, wild-type mice. Flashes were estimated to produce between 4 × 10⁻¹ (dimmest) to 4 × 10² (brightest) photoisomerisations per rod. B, Recovery after a bright flash. Paired flash analysis was used to measure recovery of the rod photocurrent after a bright conditioning flash that caused ∼2 × 10⁵ photoisomerisations per rod. The probe flash was identical to the conditioning flash. C, Recovery after a very bright flash. Paired flash analysis was used to measure recovery of the rod photocurrent after a bright conditioning flash that bleached 10–20% of rhodopsin in the retina. The probe flash stimulated ∼2 × 10⁵ photoisomerisations per rod. WT, Wild type.
Visual threshold measurements.
We measured visual thresholds with a water maze as described previously (Hayes and Balkema, 1993; Sampath et al., 2005). Each mouse received four training trials per day for at least 10 d under ambient light. Times to find the platform ranged from 1 to 45 s. The platform and black wall were rinsed and moved to a new location between trials. Testing was performed first with the brightest illumination and then decreasing one log unit in intensity per day until there was a significant increase in the time to find the platform.
Results
Expression of TαG38D in the wild-type, Tα+/−, and Tα−/− backgrounds
To estimate the relative levels of expression of G38D and to locate the mutant and wild-type Tα in transgenic rods, the Glu-Glu (EE) monoclonal antibody epitope was created within the loop between helices E and F of the Tα helical domain (Fig. 1A). The EE tagging of different G-protein α subunits, such as Gqα, Gsα, and Giα, at this location does not alter signaling activity (Wilson and Bourne, 1995; Medina et al., 1996). The EE-tagged transducin-like chimeric Tα* (Tα*EE) was similar to Tα* in all biochemical tests including coupling to R*, GTPase activity, and interactions with RGS9 and PDE6 (Kerov et al., 2005). Two transgenic lines expressing the EE-tagged G38D mutant were established. These lines expressed G38D at similar levels (∼20% of total Tα; data not shown), and therefore only one was selected for breeding the transgene into the hemizygous (Tα+/−) and knock-out (Tα−/−) background.
The immunoblot analysis with anti-rod Tα antibody indicated that the total Tα (G38D plus native Tα) level in G38D/Tα+/− mice is similar to the Tα level in control Tα+/+ mice (∼2.4–2.6 μg Tα/retina) (Fig. 1B). Based on the analysis with EE antibody, expression of G38D in the Tα+/− background was ∼25% of total Tα (Fig. 1C). The level of G38D was higher in the Tα knock-out background (0.8–0.9 μg G38D/retina; i.e., ∼30–35% of native Tα content in control retina), suggesting that the expression from the wild-type allele slightly suppresses expression of the transgene (Fig. 1C). The potential effect of transgene expression on levels of several key phototransduction proteins was examined by Western blot analysis with antibodies against R, Tβ, Tγ, RGS9-1, and PDE6αβ. The levels of all these proteins were comparable in the G38D/Tα−/− and control mice (Fig. 2A). In addition, at 5 months of age, mice expressing G38D on the heterozygous Tα+/− and knock-out Tα−/− backgrounds showed normal gross morphology of the retina with no apparent signs of retinal degeneration (Fig. 2B).
Figure 2.

A, Expression of major phototransduction proteins in G38D/Tα−/− mice. Retinal homogenates from control (C) and G38D/Tα−/− mice (M) were analyzed by Western blotting using antibodies against rod opsin, Tβ, Tγ, RGS9, PDE6α, and PDE6β. B, Retinal morphology at 5 months. Radial sections obtained from Epon-embedded mouse retinas were counterstained with toluidine blue and viewed with a Nikon Optiphot microscope, and pictures were captured using a Spot camera (Diagnostic Instruments). WT, Wild type; ONL, outer nuclear layer; OPL, outer plexiform layer; INL, inner nucler layer; IPL, inner plexiform layer; GCL, ganglion cell layer. Scale bar, 20 μm.
Localization and light-dependent translocation of G38D in transgenic mice
Native transducin is known to reside in the OS of dark-adapted photoreceptors. Prolonged exposure to light causes rod transducin to translocate from the OS to the inner segment (IS) (Brann and Cohen, 1987; Philp et al., 1987; Whelan and McGinnis, 1988; Sokolov et al., 2002). We compared the localization and translocation of G38D to that of wild-type Tα. Immunohistochemical analysis of mouse retinal sections using anti-rod Tα and EE antibodies revealed that G38D is correctly localized to the rod OS in dark-adapted G38D/Tα+/− and G38D/Tα−/− mice and does not interfere with the proper OS localization of the wild-type Tα in G38D/Tα+/− rods (Fig. 3A). The patterns of light-induced translocation of Tα and G38D in G38D/Tα+/−, G38D/Tα−/−, and control Tα+/+ mice were similar (Fig. 3A). The possibility that G38D may alter the movement of transducin to the OS during dark adaptation was also investigated. The distributions of Tα and G38D were probed in G38D/Tα+/− mice dark adapted for 4 and 10 h after light exposure (1000 lux, 40 min). No differences were detected in the return of Tα and G38D to the OS in control and G38D/Tα+/− mice (data not shown).
Figure 3.

A, Localization and light-dependent translocation of Tα and G38D. Cryosections of the mouse retinas were obtained from dark-adapted (top row) and light-adapted (bottom row) mice (light adaptation: 50 min, ∼200 lux). The sections were stained with rabbit anti-rodTα antibody T1A or a monoclonal anti-EE antibody (Covance) and visualized with goat anti-rabbit AlexaFluor 568 and goat anti-mouse AlexaFluor 488 secondary antibodies using a Zeiss LSM 510 confocal microscope. WT, Wild type. B, Light-dependent translocation of arrestin (Arr). Cryosections of the mouse retinas from dark- and light-adapted mice (light adaptation: 50 min, ∼200 lux) were stained with rabbit anti-arrestin antibody and visualized with goat anti-rabbit AlexaFluor 568 secondary antibodies using a Zeiss LSM 510 confocal microscope. C, G38D is not expressed in cone photoreceptor cells. Cryosection of mouse retina from a dark-adapted G38D/Tα−/− mouse was double stained with rabbit anti-coneTα antibody and a monoclonal anti-EE antibody (Covance) and visualized with goat anti-rabbit AlexaFluor 568 and goat anti-mouse AlexaFluor 488 secondary antibodies using a Zeiss LSM 510 confocal microscope. Scale bars: A, B, 20 μm; C, 10 μm.
Visual arrestin is another major photoreceptor protein that undergoes light-dependent translocation (Philp et al., 1987; Whelan and McGinnis, 1988). The light-induced redistribution of arrestin from the IS to the OS was normal in G38D/Tα−/− mice (Fig. 3B). In addition, because the rod opsin promoter fragment used in the transgenic construct was reported to direct expression to both rods and cones (Woodford et al., 1994), we performed double immunostaining of retinal sections from G38D/Tα−/− mice with anti-EE- and cone Tα-specific antibodies. We could detect no significant expression of the G38D transgene in cones (Fig. 3C). Thus, the expression pattern and light-dependent translocation of G38D mimics that of endogenous Tα.
Biochemical analysis of G38D function
Biochemical characterization of G38D mice was performed using ROS membrane fractions isolated from the G38D/Tα+/−, G38D/Tα−/−, and control Tα+/+ mice. The total amount of transducin, and its gross ability to be activated by R*, was determined by light-dependent binding of GTPγS. The basal (dark) and maximal light-dependent [35S]GTPγS binding levels in control and G38D/Tα+/− ROSs were similar (Fig. 4A). The level of light-dependent binding of [35S]GTPγS to G38D/Tα−/− ROS was approximately threefold lower (Fig. 4A), which is in agreement with the expression level of G38D in G38D/Tα−/− mice (see above). This suggests that the exchange of GDP for GTP catalyzed by R* is normal for the G38D protein.
Figure 4.

A, Light-dependent binding of GTPγS to transducin in the ROSs from control and transgenic mice. ROSs isolated from dark (D)-adapted mice (12 μl) containing 10 μm rhodopsin were mixed with 6 μl of 10 μm [35S]GTPγS under infrared illumination. After a 10 s incubation, the amount of bound GTPγS was determined in a 7 μl aliquot by the nitrocellulose filter binding assay. The rest of the sample was bleached to determine the GTPγS binding in the light (L). Error bars indicate SE (n = 3). B, Transducin GTPase activities in the ROSs from control and transgenic mice. The single-turnover GTPase reactions were started by mixing bleached ROSs (17 μl) containing 10 μm rhodopsin with 17 μl of 0.1 μm [γ-32P]GTP. The time course of 32Pi formation was determined using the activated charcoal procedure after the reactions were stopped with perchloric acid. The GTPase rate constants from one-phase exponential fits for the control and G38D/Tα−/− ROSs were 0.076 ± 0.005 and 0.039 ± 0.003 s−1 (mean ± SE; n = 3). The data for G38D/Tα+/− ROS were analyzed with two-phase exponential fit (Y1max fixed at 75% and k1 fixed at 0.076 s−1) yielding a k2 of 0.032 s−1. max, Maximium. C, Fluorescence PγBC binding assay. The relative fluorescence change (F/Fo) of PγBC (10 nm; excitation, 445 nm; emission, 495 nm) was determined after the addition of increasing concentrations of the ROSs from control, G38D/Tα+/−, and G38D/Tα−/− mice in the presence of 1 μm GTPγS. The results from one of three similar experiments are shown. D, PDE activation assay. Bleached ROSs from control and G38D/Tα+/− mice (4 μm R*) and from G38D/Tα−/− mice (10 μm R*) were incubated with 3 μm cGMP for 3 min to stabilize the PDE6 basal activity. The reactions were started by the addition of 2 mm [3H]cGMP with or without 2 μm GTPγS. cGMP hydrolysis was terminated after 10 s by heating the samples for 2 min at 100°C, and the amount of hydrolyzed cGMP was measured as described in Materials and Methods. Error bars indicate SE (n = 3). WT, Wild type; mol, molecular.
The rates of GTP hydrolysis by transducin were measured under single-turnover conditions ([GTP]<[Tαβγ]). Single exponential fits to the data yielded transducin GTP hydrolysis rates of 0.076 and 0.039 s−1 for control and G38D/Tα−/− ROS preparations, respectively (Fig. 4B). The GTP hydrolysis data for ROSs from heterozygous transgenic mice were fitted using a double exponential function weighted by the estimated expression levels for G38D/Tα+/− retinas (∼75% of the wild-type Tα and ∼25% of the G38D mutant; see above). Holding the amplitude of the wild-type component to 75% and its rate constant to 0.076 s−1 produced a good fit (r = 0.99) and yielded a second rate constant of 0.032 s−1 (Fig. 4B), which is similar to that obtained in G38D/Tα−/− ROS preparations. Thus, the G38D mutant appears to exhibit the same slowed rate of GTP hydrolysis in both heterozygous and homozygous rods.
The effector function of transducin in transgenic mice was probed by both a fluorescence binding assay of the Tα–Pγ interaction and by GTPγS-induced activation of PDE6 in the ROS. Binding of Tα to the Pγ subunit labeled at Cys68 with 3-(bromoacetyl)-7-diethyl aminocoumarin, PγBC, causes a large increase in the probe fluorescence (Artemyev, 1997). The addition of increasing concentrations of the ROS from G38D/Tα+/− mice to PγBC in the presence of 1 μm GTPγS produced a dose-dependent elevation of the PγBC fluorescence, which was ∼30% lower than that caused by equivalent concentrations of ROSs from control Tα+/+ mice (Fig. 4C). In contrast, G38D/Tα−/− ROS had no effect in this assay (Fig. 4C). Therefore, the smaller effect in G38D/Tα+/− ROS apparently reflects only the wild-type Tα, with the G38D mutant protein showing no appreciable binding to PγBC under the assay conditions. Consistent with these results, the presence of GTPγS markedly stimulated cGMP hydrolysis in control ROS, produced moderately lower stimulation in G38D/Tα+/− ROS, and had no significant effect in G38D/Tα−/− ROS (Fig. 4D). The lack of PDE6 activation in G38D/Tα−/− ROS was not attributable to lower G38D concentrations, because a higher ROS concentration was used to adjust the level of mutant transducin. Thus, in these assays, G38D did not bind to Pγ, nor did it stimulate PDE6 activity.
Physiology of G38D rods
Although the G38D mutant protein could be activated by R* in vitro, it was not capable of activating PDE6, suggesting that G38D may not be able to mediate phototransduction in intact rods. To test this hypothesis, suction electrode recordings were made from ROSs of G38D/Tα+/−, G38D/Tα−/−, and control mice. Control mice included both standard laboratory mice (wild-type; C57BL/6 from Charles River Laboratories, Wilmington, MA) and TαEE transgenic controls in the Tα+/− (Kerov et al., 2005) and Tα−/− backgrounds. The responses of TαEE/Tα+/− and TαEE/Tα−/− control rods were similar to wild-type rods in almost all respects (Table 1), except that TαEE control rods had significantly larger dark currents for some unknown reason. In addition, TαEE/Tα−/− rods were slightly less sensitive (Table 1, Io in photons μm−2), consistent with the fact that TαEE/Tα−/− mice expressed ∼60–65% TαEE relative to the native Tα in wild-type mice (data not shown). TαEE/Tα+/− rods, which showed normal flash sensitivity, were estimated to express ∼50% of TαEE and ∼50% of Tα (Kerov et al., 2005). Thus, the addition of the EE tag to Tα did not alter the light responses of transgenic rods.
Table 1.
Characteristics of flash responses of single rods
| Id (pA) | Io (photons μm−2)a | Time to peak (ms) | Elementary amplitude (pA) | Flash sensitivity (pA/photons μm−2) | τrec (ms) | Integration time (ms) | |
|---|---|---|---|---|---|---|---|
| Wild type | 13.2 ± 0.6 (33) | 48.3 ± 2.1 (25) | 111 ± 6 (28) | 0.58 ± 0.07 (18) | 0.186 ± 0.018 (26) | 200 ± 9 (26) | 278 ± 22 (26) |
| G38D/Tα+/− | 12.1 ± 0.5 (27)#### | 77.4 ± 6.0 (22)****# | 109 ± 9 (22) | 0.37 ± 0.06 (14)*## | 0.116 ± 0.014 (24)**## | 207 ± 14 (20) | 301 ± 33 (22) |
| TαEE/Tα+/− | 17.3 ± 0.8 (30)**** | 57.7 ± 4.7 (23) | 115 ± 8 (24) | 0.79 ± 0.10 (19) | 0.255 ± 0.041 (22) | 181 ± 24 (21) | 270 ± 23 (22) |
| G38D/Tα−/− | 11.5 ± 0.5 (26)*#### | 2,296 ± 125 (26)****#### | 192 ± 43 (25)* | ND | 0.0035 ± 0.0003 (23)****#### | 2,992 ± 331 (19)****#### | 1,892 ± 284 (18)****#### |
| TαEE /Tα−/− | 16.5 ± 0.7 (31)*** | 59.0 ± 3.7 (20)* | 132 ± 11 (26) | 0.62 ± 0.05 (19) | 0.203 ± 0.019 (23) | 209 ± 9 (24) | 317 ± 18 (25) |
All values are mean ± SE (number of cells). ND, Not determined. Significance values from t test versus wild type:
*p < 0.05;
**p < 0.01;
***p < 0.001;
****p < 0.0001. Significance values from t test versus TαEE/Tα+/− or TαEE/Tα−/−:
#p < 0.05;
##p < 0.01;
###p < 0.001;
####p < 0.0001.
aFlash strength that elicited a half-maximal response.
Quite surprisingly, rods expressing only the G38D mutant protein showed light responses, indicating that the mutation did not completely abolish the ability of transducin to activate PDE6 (Fig. 5A). However, G38D/Tα−/− rods did show a marked decrease in sensitivity to light, requiring an ∼40-fold brighter flash than wild-type rods to generate a half-maximal response (Io) (Table 1, Fig. 5B). G38D/Tα+/− rods were also less sensitive, requiring, on average, a flash ∼40% brighter than that needed for wild-type rods (Table 1, Fig. 5B). To examine this further, we calculated the rate of change of the light-activated PDE6 activity from wild-type, G38D/Tα+/−, and G38D/Tα−/− rods (Fig. 5C). At all flash strengths, G38D/Tα−/− rods reliably produced less light-activated PDE6 activity than wild-type rods. G38D/Tα−/− rods required ∼40-fold brighter flashes to produce the same light-induced change in PDE6 activity.
Figure 5.

A, Flash responses from wild-type, G38D/Tα+/−, and G38D/Tα−/− rods. Suction electrodes were used to record light responses from single dark-adapted rods. The normalized responses to increasing flash strengths of light from representative wild-type, G38D/Tα+/−, and G38D/Tα−/ rods are shown. Maximal response amplitudes (rmax in picoamperes) for these rods were 14.3 (wild type), 13.6 (G38D/Tα+/−), and 15.8 (G38D/Tα−/−). Ten-millisecond flashes of light (500 nm) were given at t = 0 and ranged in strength from 5 to 97,000 photons μm−2 for wild-type and G38D/Tα+/− rods and from 650 to 94,000 photons μm−2 for G38D/Tα−/− rods. B, Plot of normalized response amplitude as a function of flash strength for representative rods. The flash strengths required to elicit a half-maximal response (Io in photons μm−2) for these cells were 48 (wild type), 77 (G38D/Tα+/−), and 2219 (G38D/Tα−/−). C, The slope of the light-evoked rise in PDE6 activity (dPDE*/dt) in response to flashes of light is plotted with respect to the flash strength of the stimulus (photons μm−2). The data were collected from 12 wild-type, 17 G38D/Tα+/−, and 19 G38D/Tα−/− rods. Because every flash strength was not presented to every cell, each point is the average of at least four values ±SEM.
In addition to reduced sensitivity, rods expressing G38D displayed impaired response recoveries. The responses of G38D/Tα−/− rods were very slow to recover at all flash strengths of light (Fig. 5A). The recovery time constant (τrec) (Table 1) of the smallest evoked responses was ∼3 s, on average >10-fold slower than that of control responses (Fig. 6A). As the flash strength increased, so did the recovery time constant (τtail) (Fig. 6C), probably because the very bright flashes depleted factors required for deactivating the cascade. In the heterozygous rods, recovery was slow only in response to bright flashes of light. The kinetics of the dim flash response of G38D/Tα+/− rods were similar in all respects to those of control rods (Table 1, Fig. 6A), suggesting that G38D did not significantly contribute to or interfere with the signaling of native Tα under these conditions. As the flash strength increased, however, striking differences between G38D/Tα+/− and control responses became apparent. Brighter, saturating flashes produced responses that were initially normal but developed a very slow final phase of recovery (Fig. 6B,C). Taking into account the properties of G38D in vitro (the reduced GTPase activity and the greatly impaired ability to activate PDE6), we interpret the results from single-cell recordings to indicate that light-activated G38D molecules activated PDE6 so poorly that their effect was not discernible until a great number of them were activated by a bright flash. Once activated, the G38D/PDE6 complexes took a longer than normal time to inactivate, thereby prolonging response recovery.
Figure 6.

A, Dim flash responses recover slowly in G38D/Tα−/− rods but not in G38D/Tα+/− rods. Left, G38D/Tα−/− rods were much slower to recover to dim flashes of light than TαEE/Tα−/− rods. Right, G38D/Tα+/− and TαEE/Tα+/− rods recovered along similar time courses. Dim flash responses from seven rods were averaged and normalized by the peak amplitude of the average dim flash response, which were (in picoamperes) 0.9 (G38D/Tα−/−), 1.7 (TαEE/Tα−/−), 1.5 (G38D/Tα+/−), and 1.8 (TαEE/Tα+/−). The average flash strength for each group (in photons μm−2) was 255 (G38D/Tα−/−), 10.2 (TαEE/Tα−/−), 12.5 (G38D/Tα+/−), and 7.3 (TαEE/Tα+/−). B, G38D/Tα+/− rods recovered more slowly than control rods in response to bright flashes. Representative saturating flash responses from G38D/Tα+/− (gray) and TαEE/Tα+/− (black) rods matched for both time in saturation and dominant time constant of recovery. From left to right, the flash strengths (in photons μm−2) used to elicit the responses were 2161 and 7322 (G38D/Tα+/−) and 2048 and 6940 (TαEE/Tα+/−). Note the slow “tail” of recovery of the G38D/Tα+/− responses. The maximal responses for these two cells were 13.1 pA (G38D/Tα+/−) and 12.3 pA (TαEE/Tα+/−) C, The final falling phase of recovery from wild-type, G38D/Tα+/−, and G38D/Tα−/− responses was fitted with a single exponential (τtail). At dim flash strengths, recovery of responses from G38D/Tα+/− rods was indistinguishable from that of wild-type rods. As the flash strength increased, the τtail increased until, at the brightest flash strengths, it was very similar to G38D/Tα−/− rods.
It has been postulated that impaired GTPase activity may lead to desensitization in Nougaret patients because of constitutive activity of the phototransduction cascade (Sandberg et al., 1998). If G38DTα were a constitutively active mutation, one would expect a decrease in the dark current (measured by the maximal response amplitudes) of G38D-expressing rods. However, the dark currents of G38D/Tα+/− rods were not significantly different than wild-type rods (Table 1, Id). In addition, although the average Id value for G38D/Tα−/− rods was lower than the wild-type value (p = 0.04) (Table 1), the effect was modest and may be attributable to the fact that the saturating flashes used to calculate Id were usually given toward the end of a recording session because of the very long times required to obtain full response recovery. Thus, we found no evidence for rod desensitization by constitutive activity. In G38D/Tα+/− rods, the small reduction in sensitivity can best be explained by the reduced ability of G38D to activate PDE6. G38D does not seem to exert a dominant-negative effect on wild-type transducin.
ERG analysis of recovery and dark adaptation of G38D mutant mice
To support our single-cell analysis, we performed ERG analysis on G38D/Tα+/−, G38D/Tα−/−, and wild-type mice (Kennedy et al., 2001). The ERG responses to dim flashes confirmed that the rod sensitivity in dark-adapted G38D/Tα+/− mice is near normal but is greatly reduced in G38D/Tα−/− mice (Fig. 7A). Paired flash analysis was then used to measure recovery of the rod photocurrent after a bright conditioning flash that caused ∼2 × 10⁵ photoisomerisations per rod. The rate of recovery of the ERG a-wave was markedly slower for G38D/Tα+/− mice compared with wild-type mice (Fig. 7B), in agreement with the light responses recorded from individual G38D/Tα+/− rods. Paired flash analysis was also used to measure recovery of the rod photocurrent after a much brighter conditioning flash, bleaching 10–20% of rhodopsin in the retina. The rate of recovery from the very bright flash for wild-type mice (0.085 per minute) was almost three times faster than that for G38D/Tα+/− mice (Fig. 7C). Because recovery of the a-wave after such an intense conditioning flash represents a measure of dark adaptation (Kennedy et al., 2001), these results indicate that slow inactivation of G38D limits the kinetics of dark adaptation after an intense flash.
To examine dark adaptation in mutant mice after continuous illumination, we exposed mice to 200 lux of white light for 50 min and allowed them to dark-adapt again for 35 or 60 min. To avoid potential effects of anesthesia on dark adaptation, the mice were not anesthetized until 5 min before the ERGs were recorded. The ERG responses from G38D/Tα+/− and wild-type mice had similar time courses of dark adaptation (Fig. 8). Apparently, the rate of dark adaptation in mice under these experimental conditions is so slow that differences in the rates of transducin inactivation have a negligible effect.
Figure 8.

Dark adaptation after continuous light exposure. ERG a-wave recordings are shown. Left, Mice were dark adapted overnight, and ERGs were recorded. Middle, Mice were dark adapted overnight, exposed to 200 lux white light for 50 min, and dark adapted again for 35 min. The mice were not anesthetized until 5 min before the ERGs were recorded. Right, Mice were dark adapted overnight, exposed to 200 lux white light for 50 min, and dark adapted again for 60 min. The mice were not anesthetized until 5 min before the ERGs were recorded. Top panels, Wild-type mice; bottom panels, G38D/Tα+/− mice. Flashes were estimated to produce between 4 × 10² (dimmest) to 2 × 10⁵ (brightest) photoisomerisations per rod.
Effect of the G38D mutation on the sensitivity of scotopic vision
Because Nougaret patients have difficulty functioning under low light conditions (Sandberg, 1998), we evaluated the thresholds for scotopic vision behaviorally using a water maze (Sampath et al., 2005). The back walls of five chambers of the maze were white, whereas the sixth wall, associated with a ramp and platform, was black. Mice were trained to find the black wall and the ramp. We evaluated the average time required to find the platform (relative to the average time in complete darkness) over a range of light intensities. The visual thresholds were estimated as the light intensity at which the average time to find the platform was 50% of that in darkness. The analysis showed that the visual threshold for G38D/Tα+/− mice is higher than the thresholds for either Tα+/+ or Tα+/− mice (Fig. 9). G38D/Tα−/− mice displayed markedly reduced visual sensitivity with a threshold similar to that of Tα−/− mice, which use only cones for vision. These results are consistent with the decrease in sensitivity observed in the single-cell recordings and the lack of G38D-driven PDE6 activity observed in vitro.
Figure 9.

Visual sensitivities of control and transgenic mice. Visual sensitivities of Tα+/+, Tα+/−, Tα−/−, G38D/Tα+/−, and G38D/Tα−/− mice (n > 4 for each genotype), as measured using a vision-dependent behavior, are shown. Mice were trained to find a black wall in a water maze where one wall was black and five walls were white. They were then tested for their ability to find the black wall at various levels of illumination.
Discussion
The G38D mutation in Tα is important from the perspectives of both retinal disease and G-protein signaling in general. Mutations in Gα subunits that cause abnormal signaling have been linked to a variety of inherited diseases (Farfel et al., 1999). The two principal mechanisms of G-protein-linked diseases are excessive (constitutive) and reduced signal transduction. GTPase-deficient Gα mutants represent the best-characterized mechanism of excessive signaling caused by delayed signal termination (Landis et al., 1989; Masters et al., 1990; Weinstein et al., 1991). Decreased signaling typically results from the reduced ability of mutant G-proteins to interact with and be activated by cognate receptors (Farfel et al., 1999). Although no specific disease with subnormal G-protein signaling has been found to result from the reduced ability of the mutant G-proteins to activate their effectors, this is clearly a plausible mechanism.
The mechanism by which the G38D mutation in transducin causes impaired rod function in Nougaret patients has been unclear but has been expected to arise from excessive signaling, based on analogous mutations in related proteins. The G38D counterpart mutation in p21ras, G12V, inhibits the intrinsic GTPase activity and the stimulation by GAPs (Trahey and McCormick, 1987; Lowy and Willumsen, 1993). Likewise, the Giα1G42V mutant has a 30-fold lower kcat for GTP hydrolysis compared with the wild-type Giα1, and it is insensitive to RGS proteins (Raw et al., 1997). Provided that the substitution of a Gly residue in Gα subunits does not interfere with their ability to interact with effectors, these Gα mutants are expected to produce excessive signaling. However, in addition to a moderate GTPase deficiency, analysis of the G38D substitution in the context of chimeric Tα* in vitro indicated marked impairment of the mutant capacity to activate PDE6, suggesting that inadequate effector activation might be an underlying mechanism in Nougaret night blindness (Muradov and Artemyev, 2000).
Transgenic mouse lines expressing G38D in the Tα+/− and Tα−/− backgrounds were generated to elucidate the Nougaret mechanism in vivo. Immunohistochemical analysis showed correct localization of G38D to the OS in dark-adapted transgenic rods and a normal translocation of the mutant to the IS in response to light. Interestingly, this phenotype contrasts with that of a “true” constitutively active GTPase-deficient Q200L mutant of Tα. The severe impairment of the Q200L GTPase activity coincides with an extremely delayed and incomplete translocation of the mutant from the rod IS to the OS during dark adaptation (Kerov et al., 2005). Furthermore, Q200L causes dramatic downregulation of the PDE6 catalytic subunits in transgenic rods (Raport et al., 1994; Kerov et al., 2005), whereas the PDE6 levels in G38D transgenic rods are normal.
Biochemical analysis of G38D using ROSs isolated from G38D/Tα−/− mice indicated both reduced GTPase activity and impaired effector activation by the mutant. The physiological phenotypes of G38D mice supported the mutant deficiencies identified in vitro because both activation and recovery of photoresponses were affected in transgenic rods. Flash responses from individual G38D/Tα−/− rods displayed an ∼40-fold reduction in sensitivity, and the rate of rise of the light-activated PDE6 activity was much smaller than in wild-type rods. In addition, the PDE6 activation defect of G38D led to a dramatic loss of sensitivity of rod-mediated vision in G38D/Tα−/− mice as assessed by vision-dependent behavior using a water maze. This reduced sensitivity may reflect both the inefficient activation of PDE6 by the mutant protein as well as the reduced overall expression level of Tα. The fact that G38D protein can activate PDE6 in vivo but not in vitro is likely explained by the fact that a higher concentration of the activated mutant is produced in intact rods. For example, flashes producing the half-maximal responses in G38D/Tα−/− rods (2200 photons μm−2) elicit one or more photoisomerizations per disc and cause activation of a sizable fraction of the total transducin pool (Lyubarsky and Pugh, 1996). Under these conditions, the concentration of activated G38D in G38D/Tα−/− rods would be much higher than under the PDE assay conditions in vitro.
In addition to inefficient activation of PDE6, G38D mutant rods showed light responses that recovered much more slowly than those of control mice. The slow component of the recovery phase was apparent in the responses of single rods to bright flashes from G38D/Tα+/− mice and at all flash strengths in G38D/Tα−/− rods. The ERG responses of G38D/Tα+/− mice also demonstrated slowed recovery and delayed dark adaptation after intense flashes. The slowed recovery is likely attributable to the reduced intrinsic GTPase activity of G38D combined with its weak stimulation by the GAP complex RGS9/Gβ5/R9AP (He et al., 1998; Makino et al., 1999; Chen et al., 2000; Muradov and Artemyev, 2000; Hu and Wensel, 2002). Moreover, because G38D has reduced affinity for Pγ, Pγ is likely to be less effective at increasing the affinity of the RGS9 complex for the mutated Tα (Martemyanov et al., 2003), thereby further diminishing the GAP activity.
Modeling of the TαG38D mutant using the crystal structure of the Giα1G42V mutant (Raw et al., 1997) offers a solid structural rationale for both the deactivation and effector defects of the Nougaret mutant. The side chains of Asp and Val have similar size, and the G38D mutation in Tα is likely to lead to similar structural consequences as G42V in Giα1. The structure of the Tα/Pγ/RGS9 complex shows that Gln200 of Tα, a key residue for GTP hydrolysis, interacts with the critical RGS9 GAP residue Asn364, whereas Ser202 of Tα makes contacts with Asn364 and Trp362 of RGS9 (Slep et al., 2001). The model of G38D suggests the Asp side chain forces the peptide planes of Tα residues 199–202 to rotate, thereby pushing Gln200 out of the active site for GTP hydrolysis and disrupting the critical interaction site with RGS9 (supplemental Fig. 1A, available at www.jneurosci.org as supplemental material). Concurrent rotation of the side chain of TαArg201 would disrupt its contacts with the Pγ residues Val66 and Ile67 (Slep et al., 2001) (supplemental Fig. 1B, available at www.jneurosci.org as supplemental material). Also, Arg201, through its contacts with Glu232 and Glu241 of Tα, is essential to the linkage between the switch II and switch III/α3-helix regions. This linkage is critical for the interaction with Pγ, and its disruption in the Nougaret mutant may contribute to the ineffective activation of PDE6 (Natochin et al., 1998; Slep et al., 2001).
Our experiments clearly suggest that the elevated dark-adapted thresholds in Nougaret patients heterozygous for the mutation do not arise from constitutive activity or a dominant-negative function of the G38D mutant, because the maximal response amplitudes were unaffected in G38D-expressing rods and because the sensitivity of G38D/Tα+/− rods was similar to that of Tα+/− rods, which have comparable Tα levels. It is striking that the visual thresholds in Nougaret patients are elevated 100-fold (Sandberg et al., 1998), whereas the loss of sensitivity in G38D/Tα+/− rods was considerably less. The nature of the phenotypic difference between humans and mice is not clear. However, impaired rod signaling caused by the mutation may have a greater impact for human vision because of potential differences in processing rod signals in primate and mouse retina (Field and Rieke, 2002; Field et al., 2005). Although mouse models are widely accepted as excellent tools to examine molecular consequences of disease-causing mutations in vivo, our study also provides an illustration of limitations of mouse models for the full understanding of human visual disease mechanisms.
Footnotes
This work was supported by National Institutes of Health Grants RO1 EY12682, EY10843 (N.O.A.), EY14047 (M.E.B.), EY06641 (J.B.H.), and EY13811 (C.-K.C.), by the E. Matilda Ziegler Foundation for Blindness (M.E.B.), and by the Knights Templar Eye Foundation (C.-K.C.). We thank T. Dryja for the valuable discussion and Geetha Mylvaganam for repeating the sequence analysis of the entire coding region of the transducin-α gene in some Nougaret patients.
References
- Arshavsky VY, Lamb TD, Pugh EN Jr (2002). G proteins and phototransduction. Annu Rev Physiol 264:153–187. [DOI] [PubMed] [Google Scholar]
- Artemyev NO (1997). Binding of transducin to light-activated rhodopsin prevents transducin interaction with the rod cGMP-phosphodiesterase γ-subunit. Biochemistry 36:4188–4193. [DOI] [PubMed] [Google Scholar]
- Barbacid M (1987). Ras genes. Annu Rev Biochem 56:779–828. [DOI] [PubMed] [Google Scholar]
- Bayer AU, Mittag T, Cook P, Brodie SE, Podos SM, Maag KP (1999). Comparisons of the amplitude size and the reproducibility of three different electrodes to record the corneal flash electroretinogram in rodents. Doc Ophthalmol 98:233–246. [DOI] [PubMed] [Google Scholar]
- Brann MR, Cohen LV (1987). Diurnal expression of transducin mRNA and translocation of transducin in rods of rat retina. Science 235:585–587. [DOI] [PubMed] [Google Scholar]
- Burns ME, Baylor DA (2001). Activation, deactivation, and adaptation in vertebrate photoreceptor cells. Annu Rev Neurosci 24:779–805. [DOI] [PubMed] [Google Scholar]
- Calvert PD, Krasnoperova NV, Lyubarsky AL, Isayama T, Nicolo M, Kosaras B, Wong G, Gannon KS, Margolskee RF, Sidman RL, Pugh EN Jr, Makino CL, Lem J (2000). Phototransduction in transgenic mice after targeted deletion of the rod transducin α-subunit. Proc Natl Acad Sci USA 97:13913–13918. [DOI] [PMC free article] [PubMed] [Google Scholar]
- Chen CK, Burns ME, He W, Wensel TG, Baylor DA, Simon MI (2000). Slowed recovery of rod photoresponse in mice lacking the GTPase accelerating protein RGS9-1. Nature 403:557–560. [DOI] [PubMed] [Google Scholar]
- Danciger M, Matthes MT, Yasamura D, Akhmedov NB, Rickabaugh T, Gentleman S, Redmond TM, La Vail MM, Farber DB (2000). A QTL on distal chromosome 3 that influences the severity of light-induced damage to mouse photoreceptors. Mamm Genome 11:422–427. [DOI] [PubMed] [Google Scholar]
- Dryja TP (2000). Molecular genetics of Oguchi disease, fundus albipunctatus, and other forms of stationary night blindness: LVII Edward Jackson Memorial Lecture. Am J Ophthalmol 130:547–563. [DOI] [PubMed] [Google Scholar]
- Dryja TP, Hahn LB, Reboul T, Arnaud B (1996). Missense mutation in the gene encoding the alpha subunit of rod transducin in the Nougaret form of congenital stationary night blindness. Nat Genet 13:358–360. [DOI] [PubMed] [Google Scholar]
- Farfel Z, Bourne HR, Iiri T (1999). The expanding spectrum of G protein diseases. N Engl J Med 340:1012–1020. [DOI] [PubMed] [Google Scholar]
- Field GD, Rieke F (2002). Nonlinear signal transfer from mouse rods to bipolar cells and implications for visual sensitivity. Neuron 34:773–785. [DOI] [PubMed] [Google Scholar]
- Field GD, Sampath AP, Rieke F (2005). Retinal processing near absolute threshold: from behavior to mechanism. Annu Rev Physiol 7:491–514. [DOI] [PubMed] [Google Scholar]
- Hayes JM, Balkema GW (1993). Elevated dark-adapted thresholds in hypopigmented mice measured with a water maze screening apparatus. Behav Genet 23:395–403. [DOI] [PubMed] [Google Scholar]
- He W, Cowan CW, Wensel TG (1998). RGS9, a GTPase accelerator for phototransduction. Neuron 20:95–102. [DOI] [PubMed] [Google Scholar]
- Hu G, Wensel TG (2002). R9AP, a membrane anchor for the photoreceptor GTPase accelerating protein, RGS9-1. Proc Natl Acad Sci USA 99:9755–9760. [DOI] [PMC free article] [PubMed] [Google Scholar]
- Kennedy MJ, Lee KA, Niemi GA, Craven KB, Garwin GG, Saari JC, Hurley JB (2001). Multiple phosphorylation at rhodopsin and the in vivo chemistry underlying rod photoreceptor dark adaptation. Neuron 31:87–101. [DOI] [PubMed] [Google Scholar]
- Kerov V, Chen D, Moussaif M, Chen YJ, Chen CK, Artemyev NO (2005). Transducin activation state controls its light-dependent translocation in rod photoreceptors. J Biol Chem 280:41069–41076. [DOI] [PubMed] [Google Scholar]
- Krispel CM, Chen CK, Simon MI, Burns ME (2003). Novel form of adaptation in mouse retinal rods speeds recovery of phototransduction. J Gen Physiol 122:703–712. [DOI] [PMC free article] [PubMed] [Google Scholar]
- Landis CA, Masters SB, Spada A, Pace AM, Bourne HR, Vallar L (1989). GTPase inhibiting mutations activate the alpha chain of Gs and stimulate adenylyl cyclase in human pituitary tumours. Nature 340:692–696. [DOI] [PubMed] [Google Scholar]
- Lem J, Fain GL (2004). Constitutive opsin signaling: night blindness or retinal degeneration? Trends Mol Med 10:150–157. [DOI] [PubMed] [Google Scholar]
- Lem J, Applebury ML, Falk JD, Flannery JG, Simon MI (1991). Tissue-specific and developmental regulation of rod opsin chimeric genes in transgenic mice. Neuron 6:201–210. [DOI] [PubMed] [Google Scholar]
- Lowy DR, Willumsen BM (1993). Function and regulation of ras. Annu Rev Biochem 62:851–891. [DOI] [PubMed] [Google Scholar]
- Lyubarsky AL, Pugh EN Jr (1996). Recovery phase of the murine rod photoresponse reconstructed from electroretinographic recordings. J Neurosci 16:563–571. [DOI] [PMC free article] [PubMed] [Google Scholar]
- Makino ER, Handy JW, Li T, Arshavsky VY (1999). The GTPase activating factor for transducin in rod photoreceptors is the complex between RGS9 and type 5 G protein β subunit. Proc Natl Acad Sci USA 96:1947–1952. [DOI] [PMC free article] [PubMed] [Google Scholar]
- Martemyanov KA, Hopp JA, Arshavsky VY (2003). Specificity of G protein-RGS protein recognition is regulated by affinity adapters. Neuron 38:857–862. [DOI] [PubMed] [Google Scholar]
- Masters SB, Landis CA, Bourne HR (1990). GTPase-inhibiting mutations in the α subunit of Gs. Adv Second Messenger Phosphoprotein Res 24:70–75. [PubMed] [Google Scholar]
- Medina R, Grishina G, Meloni EG, Muth TR, Berlot CH (1996). Localization of the effector-specifying regions of Gi2αand Gqα. J Biol Chem 271:24720–24727. [DOI] [PubMed] [Google Scholar]
- Muradov KG, Artemyev NO (2000). Loss of the effector function in a transducin-α mutant associated with Nougaret night blindness. J Biol Chem 275:6969–6974. [DOI] [PubMed] [Google Scholar]
- Natochin M, Granovsky AE, Artemyev NO (1998). Identification of effector residues on photoreceptor G-protein, transducin. J Biol Chem 273:21808–21815. [DOI] [PubMed] [Google Scholar]
- Philp NJ, Chang W, Long K (1987). Light-stimulated protein movement in rod photoreceptor cells of the rat retina. FEBS Lett 225:127–132. [DOI] [PubMed] [Google Scholar]
- Pugh EN Jr, Lamb TD (1993). Amplification and kinetics of the activation steps in phototransduction. Biochim Biophys Acta 1141:111–1149. [DOI] [PubMed] [Google Scholar]
- Raport CJ, Dere B, Hurley JB (1989). Characterization of the mouse rod transducin α subunit gene. J Biol Chem 264:7122–7128. [PubMed] [Google Scholar]
- Raport CJ, Lem J, Makino C, Chen CK, Fitch CL, Hobson A, Baylor D, Simon MI, Hurley JB (1994). Downregulation of cGMP phosphodiesterase induced by expression of GTPase-deficient cone transducin in mouse rod photoreceptors. Invest Ophthalmol Vis Sci 35:2932–2947. [PubMed] [Google Scholar]
- Raw AS, Coleman DE, Gilman AG, Sprang SR (1997). Structural and biochemical characterization of the GTPγS-, GDP·Pi-, and GDP-bound forms of a GTPase-deficient Gly42→Val mutant of Giα1 Biochemistry 36:15660–15669. [DOI] [PubMed] [Google Scholar]
- Sampath AP, Strissel KJ, Elias R, Arshavsky VY, McGinnis JF, Chen J, Kawamura S, Rieke F, Hurley JB (2005). Recoverin improves rod-mediated vision by enhancing signal transmission in the mouse retina. Neuron 46:413–420. [DOI] [PubMed] [Google Scholar]
- Sandberg MA, Pawlyk B, Dan J, Arnaud B, Dryja TP, Berson EL (1998). Rod and cone function in the Nougaret form of stationary night blindness. Arch Ophthalmol 116:867–872. [DOI] [PubMed] [Google Scholar]
- Slep KC, Kercher MA, He W, Cowan CW, Wensel TG, Sigler PB (2001). Structural determinants for regulation of phosphodiesterase by a G protein at 2.0 A. Nature 409:1071–1077. [DOI] [PubMed] [Google Scholar]
- Sokolov M, Lyubarsky AL, Strissel KJ, Savchenko AB, Govardovskii VI, Pugh EN Jr, Arshavsky VY (2002). Massive light-driven translocation of transducin between the two major compartments of rod cells: a novel mechanism of light adaptation. Neuron 34:95–106. [DOI] [PubMed] [Google Scholar]
- Trahey M, McCormick F (1987). A cytoplasmic protein stimulates normal N-ras p21 GTPase, but does not affect oncogenic mutants. Science 238:542–545. [DOI] [PubMed] [Google Scholar]
- Tsang SH, Burns ME, Calvert PD, Gouras P, Baylor DA, Goff SP, Arshavsky VY (1998). Role for the target enzyme in deactivation of photoreceptor G protein in vivo. Science 282:117–121. [DOI] [PubMed] [Google Scholar]
- Weinstein LS, Shenker A, Gejman PV, Merino MJ, Friedman E, Spiegel AM (1991). Activating mutations of the stimulatory G protein in the McCune-Albright syndrome. N Engl J Med 325:1688–1695. [DOI] [PubMed] [Google Scholar]
- Whelan JP, McGinnis JF (1988). Light-dependent subcellular movement of photoreceptor proteins. J Neurosci Res 20:263–270. [DOI] [PubMed] [Google Scholar]
- Wilson PT, Bourne HR (1995). Fatty acylation of αz. Effects of palmitoylation and myristoylation on αz signaling. J Biol Chem 270:9667–9675. [DOI] [PubMed] [Google Scholar]
- Woodford BJ, Chen J, Simon MI (1994). Expression of rhodopsin promoter transgene product in both rods and cones. Exp Eye Res 58:631–635. [DOI] [PubMed] [Google Scholar]