

Abstract
Experiments performed in normal animals suggest that the basal ganglia (BG) are crucial in motor program selection. BG are also involved in movement disorders. In particular, BG neuronal activity in parkinsonian animals and patients is more oscillatory and more synchronous than in normal individuals.
We propose a new model for the function and dysfunction of the motor part of BG. We hypothesize that the striatum, the subthalamic nucleus, the internal pallidum (GPi), the thalamus, and the cortex are involved in closed feedback loops. The direct (cortex–striatum–GPi–thalamus–cortex) and the hyperdirect loops (cortex–subthalamic nucleus–GPi–thalamus–cortex), which have different polarities, play a key role in the model. We show that the competition between these two loops provides the BG–cortex system with the ability to perform motor program selection. Under the assumption that dopamine potentiates corticostriatal synaptic transmission, we demonstrate that, in our model, moderate dopamine depletion leads to a complete loss of action selection ability. High depletion can lead to synchronous oscillations. These modifications of the network dynamical state stem from an imbalance between the feedback in the direct and hyperdirect loops when dopamine is depleted.
Our model predicts that the loss of selection ability occurs before the appearance of oscillations, suggesting that Parkinson's disease motor impairments are not directly related to abnormal oscillatory activity. Another major prediction of our model is that synchronous oscillations driven by the hyperdirect loop appear in BG after inactivation of the striatum.
Keywords: neural network, models, action selection, oscillations, synchrony, Parkinson's disease
Introduction
The basal ganglia (BG) are a complex network of subcortical nuclei involved in motor control, sensorimotor integration, and in cognitive and motivational processes (Gerfen and Wilson, 1996; Bolam et al., 2000). Their functions remain a subject of debate. Several experiments and anatomical considerations suggest that BG may be involved in the selection of motor programs (Chevalier and Deniau, 1990; Mink and Thach, 1991; Mink, 1996; Turner and Anderson, 1997). Other experiments lead to the view that BG play a critical role in reinforcement learning (Apicella et al., 1991; Schultz et al., 1993; Bar-Gad and Bergman, 2001).
Parkinson's disease (PD) and Huntington's disease involve BG dysfunctions. A model of motor symptoms of these diseases was proposed by Albin et al. (1989) and DeLong (1990). It relies on a segregation between the direct and indirect pathways going from the striatum to BG output structures. It also assumes that dopamine (DA) has opposing effects in these two pathways mediated through D1 and D2 receptors, respectively. This model predicts successfully that inactivation of internal pallidum (GPi) or subthalamic nucleus (STN) palliates PD symptoms (Bergman et al., 1990; Benazzouz et al., 1993). However, it is not sufficient to account for the modifications in firing patterns observed over the BG–cortical network after DA depletion (Bergman et al., 1994; Nini et al., 1995; Hutchison et al., 1997; Raz et al., 2001). Moreover, striatal neurons are involved in both the direct and indirect pathways (Bolam et al., 2000; Wu et al., 2000; Levesque and Parent, 2005), D1 and D2 receptors are colocalized on striatal neurons (Aizman et al., 2000), and the effects of DA mediated through D1 and D2 receptors are not always opposing (Calabresi et al., 2000; Kerr and Wickens, 2001; Nicola et al., 2004). Last but not least, a recent study concludes that lesions in the external pallidum in the monkey do not induce parkinsonian-like motor symptoms and do not affect the activity pattern in GPi (Soares et al., 2004). This raises additional questions regarding the primary involvement of the indirect pathway in PD symptoms.
Here, we propose a new model for the motor part of BG, which does not require a segregation between the direct and indirect pathways. Instead, the model assigns a primary role to the hyperdirect pathway, which goes from the cortex to the STN and the GPi (Nambu et al., 2000). It also assumes that the direct and hyperdirect pathways operate as competing feedback loops (Deniau et al., 1996; Hoover and Strick, 1999; Kelly and Strick, 2004). Hence, it is a dynamical model of the BG–cortical network. We show that the competition between these two loops may be a basis for BG functions and dysfunctions. Specifically, it provides a natural mechanism for action selection and its loss after DA depletion. It also suggests that pathological synchronous oscillations can stem from a dynamical imbalance between the direct and hyperdirect pathways. Part of this work has been presented previously in abstract form (Leblois et al., 2002, 2003).
Materials and Methods
The model
In the present study, we focus on the implications of the direct and hyperdirect pathways in BG physiology and pathophysiology. Therefore, in most of our study, the indirect pathway and the external segment of the globus pallidus (GPe) are not included. Hence, our model of the BG network contains five populations of neurons. Three of these populations are excitatory. These are the motor cortex (Ctx), the ventral anterior and ventral lateral nucleus of the thalamus (Th), and the STN. Two populations are inhibitory. They correspond to the sensory–motor territories of the striatum (Str) and the GPi. The impact of adding a GPe population to the network is briefly addressed in Discussion.
Anatomical and electrophysiological studies have shown that the connectivity along the direct pathway is topographically organized and that the flow of information through this pathway displays functional and somatotopic segregation (Alexander et al., 1986; Deniau et al., 1996; Nakano, 2000). In line with these features, our BG network model consists of two parallel circuits that control two motor programs (Fig. 1). It can be thought of as one “somatotopic channel” involved in the execution of these two motor programs. We also assume that the two circuits interact at the level of the STN to GPi connection. This hypothesis is supported by anatomy and electrophysiological evidence, which shows that the connectivity between STN and GPi is more divergent than the connectivity along the direct pathway, and that the functional segregation observed along the direct pathway is only partly maintained along the hyperdirect pathway (Parent and Hazrati, 1995b). The architecture of our model is summarized in Figure 1. In particular, each STN population interacts with the GPi populations in the two circuits. A motor program is executed only if the average activity of the cortical population crosses some defined threshold in the corresponding circuit.
Figure 1.

Architecture of the model. The network consists of two circuits, each comprising a cortical, a striatal, a thalamic, a subthalamic, and a pallidal population. The two circuits interact via diffused subthalamic–pallidal connections. Arrows, Excitatory connections. Dots, Inhibitory connections. The substancia nigra pars compacta is not explicitly represented in the model.
It is also clear from this figure that each circuit can be thought of as being composed of two feedback loops as follows: (1) A global positive feedback loop: Ctx→Str→GPi→Th→Ctx. In this loop, the cortex acts on the thalamus through a sequence of one excitatory and two inhibitory sets of connections. Therefore, the cortex disinhibits the thalamus. Because the Ctx→Str→ GPi path is usually called the direct pathway, this loop will be referred to in the following as the “direct loop.” (2) A global negative feedback loop: Ctx→STN→GPi→Th→ Ctx. In this loop, the cortex acts on the thalamus through a sequence of three sets of connections: two excitatory (Ctx→STN→GPi) and one inhibitory (GPi→Th). Therefore, it inhibits the thalamus. Following Nambu et al. (2000), we call this loop the “hyperdirect loop.”
Neuronal dynamics
The number, Nα, and the cell properties of the neurons in a given population α (α = Ctx, Str, GPi, Th, STN) are assumed to be identical in the two circuits. The single neuron dynamics are described by a rate model (Wilson and Cowan, 1972; Hopfield, 1984; Shriki et al., 2003). A neuron in population α in circuit k is characterized by its instantaneous activity Aikα(t), where i = 1, …, Nα, and k = 1, 2. If Iikα is the total input to the neuron and Sikα(x) is its nonlinear input–output transfer function, its instantaneous activity is given by the following: Aikα(t) = Sikα(Iikα). For simplicity, we will consider threshold linear transfer functions, Sikα(x) = βα[x − Tiα]+, where [x]+ = x for x > 0 and 0 otherwise; Tiα is the threshold of neuron i in population α, and βα > 0 is the gain of the input–output transfer function of the neurons in that population. For simplicity, we take Tiα = Tα independently of i for α = Ctx, GPi, Th, STN. In contrast, we take a broad Gaussian distribution for the thresholds of the striatal neurons (average, TStr; SD, TStr/2) to reproduce the distribution of spontaneous activity of the striatal projection neurons observed in experiments (Sandstrom and Rebec, 2003; Slaght et al., 2004), as shown in Results.
The synaptic output of neuron (i, α, k) to a neuron in population β is characterized by a smooth variable mikβα(t), which is a low-pass filtered version of its instantaneous level of activity (Ermentrout, 1996; Shriki et al., 2003). This variable follows the dynamical equation as follows:
 |
where τβα, which only depends on α and β, is the time constant of the synapses between neurons in population α and in population β. We will assume that τβα = τ for (α, β) ≠ (Ctx, STN). To account for the presence of NMDA receptors on STN neurons, τCtxSTN is assumed to be larger than τ. The ratio τCtxSTN/τ will be denoted by μ.
Connectivity
The connectivity from population α to population β in circuit k = 1, 2 is random. The connectivity matrix, Jijkβα, is such that Jijkβα = 1 if neuron j, α, k is connected presynaptically to neuron i, β, k, and Jijkβα = 0 otherwise. The average number of inputs from population α to neuron i, β, k depends solely on α and β and will be denoted by Kβα. The strength of the interaction between two neurons in the same circuit depends solely on the populations to which they belong. It will be denoted Gβα. As stated above, populations belonging to different circuits do not interact, except for the STN and the GPi. The strength of the cross-connection between the STN in one circuit and the GPi in the other circuit is ΓGGPiSTN, where Γ is a constant and GGPiSTN is the strength of interaction between the STN and the GPi in the same circuit. The connectivity along the cross-connection from circuit k to circuit k′ is denoted by Jijcrossk′k.
For the sake of simplicity, we do not introduce any lateral interactions in the various populations of the model.
Total inputs to the neurons
The total synaptic inputs Iikα received by neuron i in population α (for α = Ctx, Str, GPi, Th, STN) in circuit k, are given by the following:
 |
 |
 |
 |
 |
where Δαβ denotes the synaptic delay from population β to population α. The cortical and striatal populations receive external inputs (see below) denoted by HikCtx and HikStr, respectively. The last term in these equations, ηikα(t), represents additional Gaussian white noisy inputs with a zero mean and a SD, σα.
External inputs to the network in relation to the planning and execution of movements.
We assume that, in relation to the planning and execution of a movement, the neurons in the cortical and the striatal populations receive additional external inputs. These inputs represent synaptic entries to cortical and striatal neurons coming from other cortical areas and brain regions that are not explicitly incorporated in the model. For simplicity, the inputs to the cortical and striatal populations in circuit k (k = 1, 2) are taken to be homogeneous over the populations. In the text and figures, external inputs are displayed in arbitrary units.
The inputs to cortical neurons.
The two cortical populations in our model represent neurons in the motor cortex encoding for two motor programs. Because other brain regions sending inputs to the motor cortex are not explicitly represented in the model, we take these inputs into account by including an external input, HikCtx, in the dynamics. We assume that the temporal profile of this external input has the following form:
 |
for tm − Dmvt/2 < t < tm + Dmvt/2 and zero otherwise. Hence, Dmvt is the total duration of the input related to the movement and tm is the time at which this input takes its maximal value, HkCtx.
The degree of selectivity of the external inputs to the cortex (i.e., the extent to which the external inputs to the two cortical populations in the two circuits are different) will be measured by the following:
 |
A weakly selective external input to the cortex corresponds to a small ϵ. In reality, the input to the cortex related to action execution is presumably selective to some extent. However, our idea is that this selectivity may not be sufficient to induce action selection in normal situations but that the BG network is required for it to occur. To highlight this role of the BG, we assume in most of this study that the cortical input is nonselective [i.e., identical in the two cortical populations (ϵ = 0)]. We will show that even in this case the BG can make the response of the cortex selective.
The inputs to striatal neurons.
During motor planning, information coming from sensorimotor cortical area, and related to the motor program to be executed, is sent to the sensory–motor striatum (Gardiner and Nelson, 1992; Boussaoud and Kermadi, 1997; Lee and Assad, 2003). This sensory information is represented in the model by adding a transient and weakly selective external input to the striatum. This input starts at the same time as the cortical input, but its duration, DStr, is much shorter than the duration of the cortical input (Dmvt). We take the following for its profile:
for tm − Dmvt/2 < t < tm − Dmvt/2 + dIstr, where dIstr = 200 ms is the duration of this input, and zero otherwise.
Modeling the effect of DA
Dopaminergic SNc neurons project to several BG nuclei (for review, see Graybiel, 2000), but these projections and the dopaminergic receptors are more numerous in the striatum (Haber and Fudge, 1997). Thus, we have assumed that the DA primarily affects the BG dynamics via its effects in the striatum. The effects of DA on synaptic and cellular properties in the striatum is still a topic of debate (for review, see Calabresi et al., 2000; O’Donnell, 2003; Nicola et al., 2004). Most of the available data regarding the presynaptic and postsynaptic effects of DA were obtained in vitro. These data are often contradictory, presumably because of the different experimental conditions under which they were obtained, and whether the changes in DA concentration are phasic and/or attributable to local fluctuations or whether they are pathological. Here, we focus on the pathological changes in the dynamics of the cortex–BG network induced by a depletion in the average extracellular DA concentration. Previous in vitro studies suggest that the threshold of striatal neurons increases with DA (Calabresi et al., 2000; O’Donnell, 2003). Consistent with this idea, in vivo studies have shown that the activity of striatal projection neurons increases after DA depletion both in anesthetized and awake animals (Kish et al., 1999; Tseng et al., 2001). We modeled this increase in activity after DA depletion phenomenologically by the following dependence of the average threshold of striatal neurons, TStr, on the level of DA as follows:
 |
where D is the relative level of striatal DA compared with its normal level (D = 100%). This function is plotted in Figure 2A. In addition, corticostriatal transmission is altered by DA depletion (Calabresi et al., 2000) and the signal-to-noise ratio in the striatum increases with the level of DA (O’Donnell, 2003; Nicola et al., 2004). Although little is known about the change in corticostriatal synaptic strength with DA, it seems reasonable to assume that the DA potentiates this synaptic connection. In fact, the combined increase in corticostriatal synaptic strength and average striatal threshold would result in a higher signal-to-noise ratio in the striatum. Moreover, the phasic activation induced by glutamate in striatal neurons is amplified by DA (Kiyatkin and Rebec, 1996), suggesting a postsynaptic potentiation of the corticostriatal synapses. We thus consider variations of the corticostriatal synaptic strength with DA of the following form:
 |
as shown on Figure 2B.
Figure 2.

The effects of DA. A, The effect on the threshold of striatal neurons (Eq. 10). B, The effect on the effective strength of the corticostriatal synapses (Eq. 11). D = 100% corresponds to the “normal” physiological level of DA.
Note that the two effects of DA depletion captured by Equations 10 and 11 are antagonistic because the first increases the response of the striatal neurons to an elevation of cortical activity, whereas the second effect decreases it.
Numerical simulations of the detailed model
The complexity of the model described above makes it very hard to study analytically. For this reason, we will investigate it with numerical simulations.
The BG–cortical circuitry is characterized by high probabilities of connections between interacting neurons. Recent estimates of connectivity from cortex to striatum and STN indicate that the number of cortical neurons connected to given neurons in these two structures are in the order of KStrCtx = 5000 (Kincaid et al., 1998) and KSTNCtx = 100 (Mink, 1996), respectively. The connectivity from the striatum to the GPi, the STN to GPi, and the GPi to the thalamus are less well known. In our simulations, we took KGPiSTN = 800 and KThGPi = 500. For the connectivity between the striatum and GPi, we chose KGPiStr = 50. We also checked that all the results were unchanged if KGPiStr = 500. To account for the large connectivity from the thalamus to cortex, we took KCtxTh = 1000.
Obviously, it is unfeasible to simulate a model of the cortex–BG network that would incorporate a number of neurons in each of the populations that would be similar to reality. The issue is thus how best to scale the network to a size suitable for simulations with reasonable time and memory consumption. In the present study, we used the approach developed by Golomb and Hansel (2000). The idea is that a network in which all the populations have the same size, Nsim, will display properties very close to those of the original network, provided that the connectivity between population α and population β is scaled as follows:
 |
where Nα and Kβα are the number of neurons in population α and the average connectivity between populations α and β in the original system, and Kβαsim is the average connectivity between the two populations in the simulated scaled network.
In our simulations, we took Nsim = 1000. The scaled connectivity parameters are subsequently KCtxStrsim = 909, KCtxSTNsim = 92, KSTNGPisim = 446, KGPiThsim = 333, KThCtxsim = 500, and KStrGPisim = 48.
Integration method.
The simulations of the model were performed by integrating the dynamics using a standard first-order Euler algorithm with fixed time step Δt = 0.5 ms (Press et al., 1993). We also ran several simulations with a smaller time step (0.05 ms) to check that the dynamics were unchanged.
Single-unit and population activity.
Spike trains for a given neuron (i, α, k) were generated according to an inhomogeneous Poisson process with an average rate given by its instantaneous firing rate, Aikα. Population activities were calculated by averaging the instantaneous firing rates over one set of 20 units taken randomly in the populations.
PETH analysis of movement related activity.
To characterize the movement-related activity in our model, we generated the perievent time histogram (PETH) of a single unit around the movement initiation. To that end, we repeated Ntrial = 30 times the simulation of the system when the movement related external inputs, Hctx(t), HStr(t), were applied. The initial conditions as well as the noise were different from trial to trial. The PETH was computed by averaging the activities in these trials centered on the onset of movement related input, tm − Dmvt/2 (see above), as is usually done to analyze experimental data. We proceeded as follows. For each trial i, the neuron firing-rate time course Fi(t) was first determined with a time in 10 ms by a kernel estimator in which the spike times Tij were convolved with a kernel function K(t): Fi(t) = Σj=1n
K(t − Tij). We used a Gaussian kernel K(t) =  , where s determined the kernel width, controlling the degree of smoothing. We took s = 0.25/F, where F is the mean firing rate of the neuron over the recording period (Baker and Gerstein, 2001). The mean firing rate of the neuron across the trials, aligned on the onset of cortical additional input, was then calculated, and yielded a smoothed version of the standard PETH. The mean and SD of the mean rate were determined over a baseline region (during the 500 ms preceding onset of additional input to cortex). The onset time was defined as the first bin where the estimate rate was modified by 10% from the mean in the same direction (i.e., elevation or suppression). Neurons were classified according to the polarity of the response: inhibition or activation.
Spectral analysis.
Spectral analysis was performed on spike trains formed over 100 s of unitary activity in the full-DA (D = 100%) and DA-depleted (D = 20%) states. Single neuron oscillatory behavior was analyzed using power spectral analysis of the spike trains, whereas synchronized oscillatory activity between neurons was detected using coherence spectra between pairs of spike trains. Both autospectra and coherence functions were calculated with Hanning windows and mean detrending of data segments. Coherence is a function of frequency and is calculated from the cross-spectral density between the two waveforms normalized by the power spectral density of each waveform. Coherence values can range from 0 if the spike trains are not linearly related to a value of 1 if the spike trains have a perfectly linear relationship. A statistically significant coherence value between the discharge of two neurons was used to indicate the presence of oscillatory synchronization. A 95% confidence level was determined by calculating a coherence value given by 1−(1−  , where a = 0.95, L is the number of windows used, and the factor 0.375 results from Hanning window weighting (Halliday and Rosenberg, 2000). This value or greater was considered to indicate a significant probability (p < 0.05) of synchronized oscillatory activity between two cells. For statistical analysis of the autospectra, the elements of the interspike intervals of each spike train were randomly shuffled, and the power spectrum of the resulting (random) spike train was calculated (Soares et al., 2004). The mean and SD of the resulting power spectra of 20 iterations of shuffled data were computed. Peaks in the power spectra of the original data stream were considered significant if they were at least 5 SD greater than the mean of the shuffled data. An autospectrum (resp. coherence function) displaying one or more significant peak(s) is referred to an oscillatory spectrum [respectively (resp.) coherence].
The reduced model
We will also consider a simplified version of the model described above, which has the advantage that several aspects of its dynamics can be investigated analytically. The knowledge of the properties of this reduced model will guide us in the investigation of the detailed model.
In the reduced model, the connectivity between two interacting populations β and α (α presynaptic to β) is all-to-all (e.g., Jijkβα = Jβα = 1 for any neuron i and j in population β and α, respectively). To make the analysis more tractable, we also assumed that there is no noise in the system. The thresholds are assumed to be the same for all the neurons in a given population. Therefore, all the neurons in a given population receive the same total synaptic input. Hence, the dynamics of the system can be fully described in terms of 12 activity variables, mkβα(t).
The steady states of the network for time-independent external inputs as well as their stability can be determined analytically as a function of the synaptic weights, the external inputs, synaptic delays, and synaptic time constants.
The steady states of the network
Steady states of the network are obtained by solving the fixed point equations for the dynamics. Here, we focus on the steady states when the external inputs are nonselective (i.e., the external inputs are the same for the two circuits). Obviously, by symmetry, solutions of the fixed point equations in which the activities in the two circuits are the same always exist. We will call such solutions “symmetric” steady states. In particular, states in which the total inputs are above threshold for all the populations are symmetric. In these states, referred below as “linear steady states,” the activities are determined by a set of linear equations that can be solved straightforwardly (see Appendix, Eqs. 26272829–30). To be consistent, such a solution must fulfill the condition that all the inputs are above threshold (five conditions).
Other symmetric steady states, in which the total input to at least one of the neuronal populations in each circuit is under threshold, may exist. In such states, at least one of the feedback loops is open. For a given set of synaptic parameters, several such steady states may coexist. They can also coexist with the linear steady state.
Under certain conditions that are analyzed below, symmetry breaking occurs and the response of the network is asymmetric (populations from the two circuits display different levels of activity) despite the fact that the external inputs are the same on both circuits. This second type of solution exists because of the threshold nonlinearities of the transfer functions. As we will see below, these solutions play a central role in the ability of the BG network to perform action selection.
Stability of steady states
A fixed point solution of the dynamical equations is stable if any small perturbation around it eventually decays at large time. If certain perturbations increase with time, the fixed point is unstable.
To investigate the stability of a steady state, we need to study the equations of the dynamics linearized around that state and look for solutions of the following form (Strogatz, 1994):
This is a solution for the linearized dynamics, provided that λ satisfies a transcendental equation, P(λ) = 0, which depends on the coupling strengths, delays, and synaptic time constants. The solutions to this equation are in general complex numbers. The steady state is stable provided that Re(λ) < 0 for all the solutions. It is unstable if at least one solution with Re(λ) > 0 exists. If, for this solution, Im(λ) = 0, the system undergoes a nonoscillatory instability. If Im(λ) ≠ 0, the instability is an Hopf bifurcation (Strogatz, 1994) at a frequency ω = Im(λ). In general, at the onset of an instability, the spatial structure of the unstable mode is obtained by determining the prefactors δkαβ.
In the case of linear steady states, one finds that (for details, see Appendix):
 |
with:
and
Note that G+ and G− are the products of the synaptic strength along the direct (positive feedback) and hyperdirect (negative feedback) loops respectively and that Δ+ and Δ− are the total delays along these two loops.
In other steady states that play an important role in our analysis, the cortical population is silent in one of the circuits, whereas all of the populations in the other circuit are active. These states are nonsymmetric. For these states, the function P(λ) is as follows (for details, see Appendix):
 |
Finally, note that steady states in which all the feedback loops are open are always stable.
Results
The properties of the reduced model
The phase diagram of the reduced model for nonselective time-independent external inputs
In this section, we consider the case of nonselective external inputs [i.e., we assume that the inputs to the cortex are the same in the two circuits (ϵ = 0) and that there is no external input to the striatum (HkStr = 0 for k = 1,2)].
When the total synaptic input to the cortical populations is smaller than the threshold TCtx, they are inactive. This happens in particular if the external input to the cortex is too small, for HCtx < HrestCtx, where HrestCtx is given by Equation 32 in the Appendix. Note that, if HCtx satisfies this condition, the state of the network does not depend on HCtx. Note also that the rest state is always stable, because all of the feedback loops are open in that state.
For sufficiently large external input to the cortex, the feedback is suppressed in the direct and hyperdirect loops, because either the GPi or the thalamus becomes inactive. If G+ > G−, the GPi is silent in the two circuits for HCtx > Hmax1Ctx, where Hmax1Ctx is given by Equation 33 in the Appendix. Similarly, if G− > G+ and HCtx > Hmax2Ctx, where Hmax2Ctx is given by Equation 34 in the Appendix, the thalamus is strongly inhibited by the GPi and it becomes inactive in the two circuits.
For intermediate values of the external input to the cortex, HCtx, (HrestCtx < HCtx < Hmax1Ctx if G− < G+ or HrestCtx < HCtx < Hmax2Ctx if G+ < G−), the linear steady state in which all the populations are active in the network exists. As explained in Materials and Methods, in this state, the activities of the various populations are determined by a set of linear equations (see Appendix, Eqs. 26272829–30). This state is symmetric (i.e., the activities in the populations are the same in the two circuits). In particular, the activities of the cortex in the two circuits are as follows:
 |
where I0 is given by Equation 31 in the Appendix.
We now consider the stability of the linear steady state (see Materials and Methods).
Nonoscillatory instabilities.
Such an instability occurs when a real eigenvalue, λ, changes its sign from negative to positive as a control parameter is varied. This happens if P(0) = 0 [for the definition of the function P(λ), see Eqs. 14 and 20]. Two nonoscillatory instabilities may occur, one for the following:
and the other for the following:
Calculation of the coefficients δkαβ (Eq. 13) shows that, for the first of these instabilities, the unstable mode is inhomogeneous [i.e., this instability breaks the symmetry between the two circuits (Fig. 3A)]. This symmetry-breaking instability requires strong feedback in the direct loop but also sufficiently strong negative feedback in the hyperdirect loops. Its occurrence can be intuitively understood as follows. If activity is increased in the cortical population of one of the two circuits, the strong positive feedback in this circuit amplifies this increase. In contrast, the cortical populations in the two circuits tend to inhibit each other via the negative polarity “cross-path” Ctx–STN–GPi–Th–Ctx, which goes from the cortical population in one circuit to the other one in the other circuit. As a result, the increase in the activity of one cortical population reduces the total input received by the other one, and hence its activity is reduced. If this effect is sufficiently strong, it breaks the symmetry between the two circuits.
Figure 3.

Instabilities of the symmetric fixed point solution of Equations 12345–6. In A and B, the network settles at the unstable symmetric fixed point at t = −500 ms. It remains there until t = 0 when the cortical population in circuit 1 is perturbed by a brief external current. After a short while, an instability develops. Red, Cortex; black, thalamus; blue, GPi. Solid (resp. dashed) lines, The activities in circuit 1 (resp. circuit 2). A, Symmetry-breaking instability for G+ = 2.47, G− = 2.85. The network ends in an asymmetric state in which the cortical population is active in one circuit alone. B, Oscillatory instability for G+ = 0.18 and G− = 2.85. The network settles in a homogeneous oscillatory state. C, Solid line, The frequency of the unstable mode at instability onset as a function of the overall delay Δ derived from Equation 36. Circles, The frequency of the oscillations as a function of Δ at the instability onset for G− = 2.85.
Oscillatory instabilities.
An oscillatory Hopf instability occurs if the real part of a complex eigenvalue changes sign when a control parameter is varied. Therefore, at the onset of an oscillatory instability, λ = iν is pure imaginary. The complex equation P(iν) = 0 determines the values of ν and the conditions that G+, G−, Δ+, Δ−, μ satisfy at the instability onset.
The instability condition simplifies if one assumes that Δ+ = Δ− ≡ Δ and μ = 1. Then one finds that the linear steady state undergoes a Hopf instability for the following:
where G0 and ν are determined by Equations 36 and 37 (see Appendix). In particular, the frequencies of the unstable modes depend only on the synaptic delays. For a given value of Δ, Equation 36 has an infinite discrete set of solutions, νn, n = 1, 2, …; ν1 < ν2 < …. The solution νn corresponds to a mode that is unstable when G− is larger than the critical value G−c = G+ + G0(Δ, νn). Hence, the stationary fixed point first becomes unstable via the mode n = 1, for which G−c is the smallest. The frequency of this mode at instability onset is plotted in Figure 3C as a function of Δ. It decreases monotonically with Δ. For Δ = 0, ν = 31.8 Hz. For Δ = 20 ms, ν = 12.8 Hz.
Using simulations, we determined the frequency of the actual oscillations that developed at the instability onset for G− = 2.85 for several values of Δ. As shown in Figure 3C (circles), in the range of delays we explored, the frequency is extremely well approximated by the imaginary part of the instability eigenvalue.
The oscillatory instability (Fig. 3B) is driven by the negative feedback in the hyperdirect loops, which induces oscillations if it is sufficiently strong. This is because an increase in the activity of the cortical populations in the two circuits leads, through this negative feedback, to a decrease in the input that feeds back from the network to both cortical populations. This decrease opposes the initial increase in cortical activities. If it is strong enough, oscillations occur. The positive feedback present in the direct loop compensates for this tendency. This is the meaning of Equation 24.
Clearly, in the unstable mode, oscillations are present in all of the populations in each circuit. The oscillations of the two circuits are in-phase, but different populations in the same circuit oscillate with some phase shifts that are functions of the various synaptic delays.
The phase diagram of the reduced model.
The results described above concerning the stability of the linear steady state can be summarized in a phase diagram in the plane (G+, G−) like the one shown in Figure 4. This phase diagram corresponds to the case Δ+ = 26 ms, Δ− = 20 ms, τ = 5 ms, and μ = 4. The linear steady state is stable in the region between the dashed and the solid line.
Figure 4.

The phase diagram for the various dynamical regimens of the reduced model as a function of G+ and G− for Γ = 0.4, Δ+ = 26 ms and Δ− = 20 ms. The synaptic time constant is τ = 5 ms for all of the synapses except synapses from the cortex to STN for which τSTNCtx = 20 ms.
On the solid line, the linear steady state undergoes a symmetry-breaking instability. Below this line, G+ > G−, and the symmetric linear steady state exists if the external input to the cortex is such that HrestCtx < HCtx < Hmax1Ctx, where HrestCtx and Hmax1Ctx are given by Equations 32 and 33 in the Appendix. However, because of the symmetry-breaking instability in this region, any small asymmetric perturbation leads the system to an asymmetric state in which the cortical population is active in one of the circuits but is inactive in the other. Because of the symmetry between the two circuits, there are two such states. They differ in terms of the circuit which has an active cortical population. The activity of the cortex in the circuit where it is active is as follows:
 |
where TCtx is the threshold of the cortical neurons and I0 is given by Equation 31 in the Appendix. These two states also differ in term of the activity in the other populations. In particular, activity in the GPi is smaller in the circuit in which the cortex is active than in the circuit in which it is inactive. As a consequence, activity in the thalamus is greater in the former circuit than in the latter. The stability boundary of these latter states, given by Equation 23, is represented by the dotted line.
On the dashed line, the linear steady state undergoes an oscillatory Hopf bifurcation driven by the negative feedback on the hyperdirect loop. This instability to oscillations depends on Δ+, Δ−, and μ. In the special case in which Δ+ = Δ− and μ = 1, the corresponding line in the phase diagram is straight. This is not the case in general. For instance, if Δ+ > Δ−, or if μ > 1, this line is shifted toward larger values of G− and it is convex as shown in Figure 4.
When G+ = 1 + G−, AkCtx in Equation 25 diverges. This indicates that the asymmetric state becomes unstable on this line (Fig. 4, dotted line). In fact, in the region G+ > 1 + G− (below the dotted line), a detailed analysis shows that depending on the external input, HCtx, one, two, or three stable steady states exist. In all of these states, the two feedback loops are open. If HCtx < Hmax1Ctx, only one steady state exists in which the cortical populations are inactive in the two circuits. If Hmax1Ctx < HCtx < HrestCtx, this steady state still exists, but it coexists with two other states in which the cortical population is active in one of the two circuits and the GPi population is silent, whereas in the other circuit, the cortical population is silent and the GPi population is active. Thus, for these parameters, the network displays tristability. If HrestCtx < HCtx, only two asymmetric states coexist.
The phase diagram of Figure 4 was obtained with the values of the synaptic delays given in Table 1. These parameters are sufficient to reproduce recent experimental results on response latencies in BGs after cortical stimulation (Nambu et al., 2000) (see below). In particular, the latency from the STN to the GPi is smaller than from the Str to GPi, and the overall latency is shorter in the hyperdirect pathway than in the direct pathway (Δ+ = 26 ms; Δ− = 20 ms). We also studied the phase diagram as a function of the parameters. We found that the location of the symmetry-breaking bifurcation does not depend on the delays, but the location of the bifurcation to oscillations does. However, the phase diagram remains qualitatively the same in a range of delays compatible with the data reported by Nambu et al. (2000) (data not shown).
Table 1.
Values of the various parameters of the model
| Reduced model | Detailed model | |
|---|---|---|
| G GPiStr | 12 | 16 |
| G ThGPi | 0.3 | 0.2 |
| G ThCtx | 0.97 | 1.25 |
| G STNCtx | 2 | 2 |
| G GPiSTN | 3.4 | 12.5 |
| ΔStrCtx | 6 | 6 |
| ΔGPiStr | 10 | 10 |
| ΔThGPi | 5 | 5 |
| ΔThCtx | 5 | 5 |
| ΔSTNCtx | 5 | 5 |
| ΔGPiSTN | 5 | 5 |
| T Ctx | 0.1 | 0.11 |
| T Str | 0 | See Eq. 10 |
| T GPi | 0.1 | 1.35 |
| T STN | −0.1 | −0.08 |
| T Th | −0.25 | −0.185 |
| Γ | 0.4 | 0.4 |
| σctx | 0 | 0.03 |
| σstr | 0 | 0.005 |
| σGPi | 0 | 0.05 |
| σcha | 0 | 0.05 |
| σSTN | 0 | 0.02 |
Delays are in milliseconds. GStrCtx varies with the level of striatal DA as indicated in Equation 11.
Response of the network to an external transiently selective input in the various regimens
With the network parameters given in Table 1 and in the absence of external input, the average firing rates of the GPi, thalamus, STN, striatum, and cortex are 80, 20, 25, 0, and 0 spikes/s, respectively. Moreover, the negative feedback of the hyperdirect loop generates oscillations if it is not compensated for by a sufficiently strong positive feedback in the direct loop. Hence, as the strength of the corticostriatal interactions decreases, the parameter G+ decreases and the network moves in the phase diagram from the symmetry-breaking regimens, to the linear regimen and eventually to the oscillatory regimen.
In this section, we describe how the network responds in these various regimens to a time-dependent input that is nonselective on the cortex (ϵ = 0) and transiently and slightly selective on the striatum. This input is shown in Figure 5A. The nonselective input to the cortex and the slightly selective input to the striatum start at the same time. The input to the striatum has a duration of 200 ms.
Figure 5.

The responses of the reduced network model to a weakly and transiently selective external input in the various regimens of the phase diagram. Network parameters are given in Table 1. Activities in and inputs to circuit 1 (resp. circuit 2) are plotted with solid lines (resp. dashed lines). A, The external input. Top, The input to the cortical populations in the two circuits. Bottom, The input to the striatum. The responses of the cortex (red), the thalamus (black), and the GPi (blue) are plotted in B, the symmetry-breaking regimen (GStrCtx = 0.7); C, the linear regimen (GStrCtx = 0.4); and D, the oscillatory regimen (GStrCtx = 0.05). Note that only one cortical population is activated in the symmetry-breaking regimen (B), whereas both populations are activated in the other regimens. E, The response of the network to a strong cortical input in the oscillatory regimen (GStrCtx = 0.05). The striatal input and the profile of the cortical input are as in A. The amplitude of the latter has been increased by a factor of 3. The oscillation is suppressed because the thalamus is silent, and subsequently the feedback loops are open. F, The response of the network to the input displayed in A in the multistability regimen (GStrCtx = 0.9). As in the symmetry-breaking regimen, one cortical population is activated, whereas the other is silent.
Selectivity in the symmetry-breaking regimen.
The response of the network in this regimen is shown in Figure 5B. At the input onset, the cortical populations in the two circuits are activated in the same way. Hence, initially, the striatal neurons in both circuits receive the same excitation from the cortex. However, the transient input to the striatum, which is slightly larger in circuit 1, induces a slight difference between the activities of the striatum in the two circuits, with the striatum in circuit 1 being more active. Just like the brief external input in Figure 3A, this transient striatal input induces a symmetry breaking in the system. As a result, the cortex becomes more active in circuit 1 than in circuit 2. After the transient component of the external input is over, the difference between the activities in the two circuits persists and even amplifies. This is the outcome of the symmetry-breaking instability that drives the network toward an asymmetric state in which the cortical population in one of the circuits is quiescent. Therefore, in this regimen, a transient weakly biased input to the striatum is sufficient to induce a strongly asymmetric response of the cortex even if the two cortical populations are activated exactly the same way. In this sense, the cortex–BG network is able to perform action selection.
Linear regimen.
The network is in this regimen if the cortex–striatum synaptic efficacies are not strong enough to achieve symmetry breaking but are sufficiently strong to compensate for the oscillations induced by the negative feedback of the hyperdirect loop. In this regimen, the nonselective input to the cortex leads to coactivation of both cortical populations (Fig. 5C). The GPi neurons also increase their activity in relation to this additional input. This is because the excitatory input on the GPi coming via the hyperdirect pathway increases more than the inhibitory input coming via the direct pathway. The striatal selective input induces a transient, small asymmetry between the activities in the two circuits. This asymmetry is proportional to HStr (data not shown). However, once the striatal input is over, the symmetry between the two circuits is rapidly restored, and the activities in the cortex are the same in the two circuits. Hence, in this regimen, once the transient input to the striatum is over, the response of the cortex is qualitatively similar to what would happen in the absence of the cortex–BG–thalamus network. The effect of the latter is only to change the value of the gain of the effective input–output relation of the cortical neurons.
Oscillatory regimen.
If the weight of the corticostriatal synapses is too small, the direct loop cannot prevent the oscillations from appearing. Hence, when the cortex is activated, the network tends to develop oscillatory activity. As in the linear regimen, the input to the striatum induces a transient asymmetry in the response of the two circuits, which rapidly decays once the input to the striatum is over. The pattern of the response is shown in Figure 5D. Interestingly, if HCtx is sufficiently strong, the oscillations are suppressed because the activity of the GPi becomes so strong that it completely inhibits the thalamus. The feedback is then suppressed in the hyperdirect loop and the system cannot display oscillations. This is shown in Figure 5E.
The multistability regimen.
The response of the network in the multistability regimen is shown in Figure 5F. The external input induces an asymmetric response of the network because the symmetric steady state is unstable. One cortical population is activated, whereas the other is inhibited, as in the symmetry-breaking regimen. However, in contrast to what happens in this latter regimen, the strong positive feedback sustains the activity in the active cortical population and the network remains in an asymmetric state even after removal of the external input. Hence, the network displays multistability between the rest state and the two asymmetric states. This regimen can be relevant for modeling the physiology of the substantia nigra pars reticulata, where selective delayed activity is found (Hikosaka et al., 2000). However, a detailed study of the behavior of the network in this region of the phase diagram is beyond the scope of the present study.
The physiological regimen.
Symmetry breaking occurs in the whole region of the phase diagram below the solid line. This region can be divided into two parts. Between the solid and the dotted line, the network is monostable. Below the dotted line, it displays multistability. In this regimen, the positive feedback sustains the activity and prevents the network to return to rest state after the removal of the external input, inducing persistent activity. We interpret the first of these regions as the one in which the system (which represents the motor part of the BG–cortical network) performs normally. The fact that the size of this region is reduced means that normal function can only be achieved for a right balance between the hyperdirect and direct feedbacks. We will show in the framework of our more detailed model that dopamine depletion disturbs this balance, because it reduces G+, leaving G− constant. As a consequence, selectivity is impaired, because the DA level is reduced. If G− is large, oscillations can emerge for sufficiently strong DA depletion. Interestingly, the range of G+ for which the system behaves “normally” is broader for larger G−. Hence, the propensity of the network to display pathological oscillations increases with the robustness of its functional state.
The detailed model
A major asset of the reduced model is that its phase diagram can be derived analytically. This allows us to show how the BG network can perform action selection and how this ability is lost if the feedback on the direct loop is too weak. We also show that oscillatory activity can emerge in the BG network if the feedback in hyperdirect pathway is strong and the feedback in the direct pathway does not compensate for it.
However, our reduced model is too simplified to account for the resting properties of the BG network, because in this model, in the absence of external input the cortex is not active. This prompted us to investigate the more realistic model of the cortex–basal–ganglia network described above (see Materials and Methods, Numerical simulations of the detailed model). In this model, the connectivity is random, the thresholds of striatal neurons are distributed, and noise is present in all of the populations. The parameters (synaptic strength, delays, thresholds) of the model are given in Table 1. Note that the synaptic strength, Gαβ, and the thresholds of the neurons have been modified compared with their values in the reduced model. With these synaptic coupling values, the feedback in the hyperdirect loop is strong enough to induce oscillatory activities driven by this loop (see below).
The resting state in the normal situation (D = 100%)
Neuronal activities at rest for D = 100%.
We define the rest state of the network as the state in the absence of external inputs. In contrast to the reduced model, in the detailed model, the neurons in the cortical and striatal populations display some low but nonzero level of activity at rest. This is because noise is present in their input. For the chosen parameters, the average activity of the cortical neurons is ∼5 spikes/s. In the GPi, STN, thalamus, and striatum, the activities are 80, 20, 25, and 0.6 spikes/s, respectively. In the GPi and striatum, the average activities are broadly distributed as shown in Figure 6A. In particular, the distribution of the activity in the striatum is very skewed, with one-half of the neurons completely quiescent.
Figure 6.
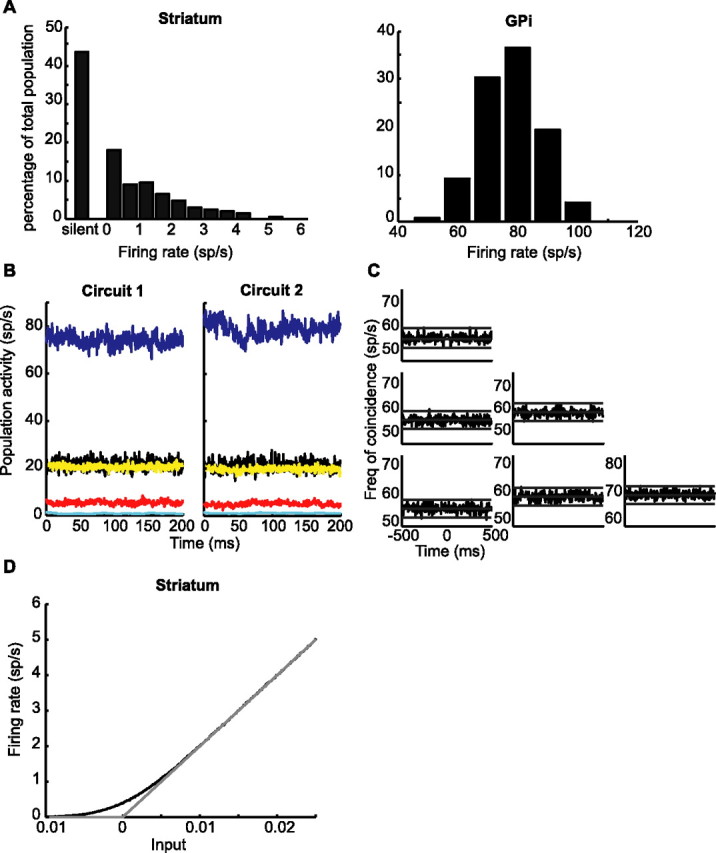
Neuronal activities in the network at rest. A, The distributions of the average spontaneous firing rates of striatal and GPi neurons. B, Population activities of groups of 20 neurons randomly chosen in the GPi (blue lines), the thalamus (black lines), the STN (yellow lines), the cortex (red lines), and the striatum (cyan lines). C, Correlation matrix of three GPi neurons. Diagonal, Autocorrelograms. Off-diagonal, Cross-correlations. D, The effective input–output transfer function of a neuron in the striatum in the absence (gray line) and in the presence of noise (black line, SD of the noise given in Table 1). In the presence of noise and for low input, the effective gain of striatal neurons is reduced.
In this rest state, there is no symmetry breaking and the average and distribution of activity in populations of the same type are the same in the two circuits. This is because the activity in the striatal populations is very low. In fact, as shown in Figure 6D, the effective transfer function of the striatal neurons in the presence of noise is nonlinear, and the effective gain of the striatal neurons is decreased for low activities. Hence, the effective feedback of the direct loop is too small for symmetry breaking to occur in the rest state. Nevertheless, in the normal rest state, the feedback in the direct loop is sufficiently strong to compensate for the oscillatory instability driven by the negative feedback in the hyperdirect loop. This is clear from Figure 6, B and C, which shows that the activities in cortex, thalamus, and GPi do not oscillate and are not synchronous across neurons.
Response of the neurons to brief cortical stimulations.
The emergence of oscillations and their frequency depend on the delays in the various pathways (for values, see Table 1). Therefore, it is important to verify that the values we have selected for these parameters are compatible with experimental data.
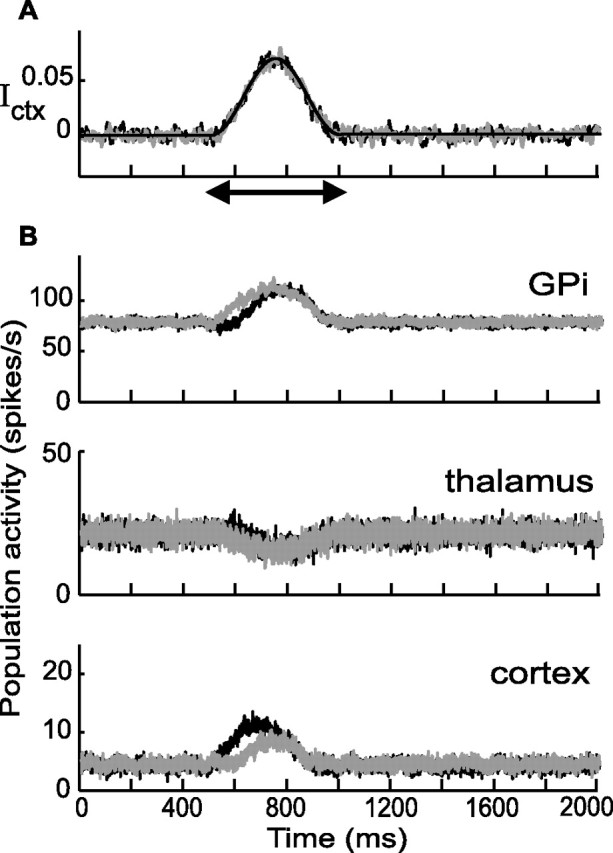
One way to characterize these delays is by looking at the dynamics of the activity changes in the different populations following a brief and sufficiently strong stimulation in the cortex. This approach has been used in several experimental studies (Deniau et al., 1978; Maurice et al., 1998; Nambu et al., 2000). In particular, Nambu et al. (2000) showed that a cortical stimulation induces triphasic response in the GPi with an early excitation followed by a suppression and by a late excitation. They argued that the early excitation was mediated by the hyperdirect pathway and that the suppression was mediated by the direct pathway. They also argued that the hyperdirect pathway contributes to the late excitation, because inactivation of the GPe did not completely eliminate this phase of the response.
To compare the behavior of our model with the results of Nambu et al. (2000), we studied the response of the network to a brief (1 ms duration) stimulation in the cortical population in one of the circuits. The population response of a group of 20 neurons in the GPi is shown in Figure 7. It displays a triphasic pattern (Fig. 7, top graph) with an early excitation followed, 10 ms later, by a strong inhibition lasting ∼25 ms and by a late excitation before a decay to baseline. Similar patterns are found in the PETH or in the raster plot of single unit activities. The origin of this triphasic response in our model can easily be understood. The early excitation is attributable to the hyperdirect pathway. Indeed, the delay along this pathway is shorter than the one along the direct pathway. The suppression of activity that follows it, is mediated by the direct pathway. The late excitation is attributable to the feedback GPi–cortex–GPi. In fact, as a result of the suppression of activity in GPi (second phase), the activity in the cortex and in the STN increase. This induces a reexcitation of the GPi. Hence, the behavior of our model is in line with the results of Nambu et al. (2000). However, a late disinhibition of the STN through the indirect pathway may also contribute to the late component of the response (Maurice et al., 1998). Another contribution for the reexcitation may be a rebound after inhibition through the direct one (Nambu et al., 2000). However, these effects cannot be accounted for in our simplified model.
Figure 7.

Neuronal response in the GPi after a cortical stimulation in the normal state (D = 100%). At t = 100 ms, a brief excitatory stimulation, lasting 5 ms, is applied to the cortex. From top to bottom, population activity averaged over 20 neurons in GPi, PETH of one GPi neuron aligned on the cortical stimulation (30 repetitions), and the corresponding raster plots are shown. The response of the GPi is triphasic.
Action selection in the normal situation (D = 100%)
We now show that, in the detailed model, the BG network is able to perform action selection as in the reduced model. The input to the cortex and to the striatum during preparation and execution of an action are modeled as in the reduced model, except that now a noisy nonselective component is added to both inputs (see Materials and Methods). They are shown in Figure 8A.
Figure 8.

Action selection in the normal situation (D = 100%). A, Top, In gray, the nonselective external input to the cortex. In black, average over 100 trials of the input. The input is zero outside the double arrow. The bell shape is given by Equation 7 with ϵ = 0, H1Ctx = 0.15, tm = 750 ms, and Dmvt = 500 ms. Bottom, The transient and weakly selective input to the striatal population in circuit 1 (black) and circuit 2 (gray) (Eq. 9 with HStr = 0.001). B, Activities averaged over a population of 20 neurons in GPi (top), thalamus (middle), and cortex (bottom) in response to the input depicted in A. Black, Circuit 1; gray, circuit 2. C, PETH of four units in GPi. D, Four units in the cortex. In C and D, Left (top and bottom), circuit 1; right, circuit 2.
The response of the network is depicted in Figure 8B. Before the input onset (at t = 500 ms), the activities in the various populations are at their spontaneous level and the network is in a symmetric state. After this onset, the activities in the cortical populations of the two circuits begin to increase. The transient selective external input to the striatum induces an asymmetry first between the GPi of the two circuits and after a short while in all of the other populations of the network. In particular, the activity in the cortical population in one of the circuits becomes significantly larger than its rest level, whereas it is reduced in the other network. This asymmetry persists even after the transient striatal input is over. Only when the network is back to rest does the state become symmetric again. Hence, as in the reduced model, the cortex–BG network can perform action selection. The action that is selected is the one implemented by the circuit in which the transient striatal input is the largest. In the example shown in Figure 8B, the state of the network is also selected according to this rule.
As in the reduced model, the GPi populations in the two circuits respond with opposite polarity to the additional input. However, the random connectivity induces some diversity in the single unit responses as shown in Figure 8C. Although the average population activity in the GPi decreases in the circuit associated with the selected action, the activity of some of the neurons in that population can remain practically not changed.
The external inputs act directly on the cortical and striatal populations. As a result, changes in activity in these populations precede the modifications of activity in other populations. A detailed analysis (see Materials and Methods) shows that the latency of the response of the cortical neurons can be ∼20 ms after external input onset, whereas it is ∼90 ms for the GPi. However, it is important to note that early cortical activity is not selective, and it is only after the feedback has become effective that activity in the cortex becomes different in the two circuits.
The effect of DA depletion on action selection and activity patterns
In our model, DA depletion affects the corticostriatal synapses by reducing their strength. Therefore, when DA decreases, G+ becomes smaller. DA depletion also affects the threshold of the striatal neurons: the average value of the threshold distribution decreases when there is less DA. In this section, we investigate the impact of these effects on the dynamics of the detailed model.
Changes in the time average activities.
Figure 9A displays the time and population average of cortical and pallidal activities in the rest state as a function of the DA level (solid line). The averaged activity of the GPi remains essentially constant when the DA decreases, whereas in the cortex it increases by <20% for full DA depletion. These changes are small because of the competition between the effects of DA on the corticostriatal transmission and on the striatal threshold. On one hand, the synaptic input from the cortex to the striatum decreases with the DA level, and this tends to reduce activity in the striatum. On the other hand, the threshold of the striatal neurons also decreases with the DA level, and this compensates for the effect on the reduction of the corticostriatal synaptic strength. For comparison, Figure 9A, dashed-dotted line, plots the activity of the GPi as a function of DA if one assumes that DA depletion only affects the corticostriatal synapses but not the striatal threshold. In this case, GPi activity increases when DA is depleted.
Figure 9.

Activities in GPi and cortex as a function of the DA level. A, Population activities in GPi (left) and in cortex (right). The activities are averaged over 20 neurons chosen at random in the GPi or cortex in the two circuits and over 10 trials. The activity was averaged over a 200 ms window starting 200 ms after the input onset (see Materials and Methods). Solid lines, Rest state. Dashed lines, Activities in response to the input plotted in Figure 8A. The average striatal threshold and strength of corticostriatal synapses are given by Equations 10 and 11 for the solid and dashed lines. Dashed dotted line, Rest state for constant average striatal threshold. The strength of corticostriatal synapses is still given by Equation 11, but the average threshold of striatal neurons is TStr = −0.02 and no longer depends on the level of DA. Note that the GPi average rest activity is increasing with DA depletion in this case. B, Population activities (20 neurons; 10 trials) in response to the input of Figure 8A. Left, GPi; right, cortex. Black, Circuit 1; gray, circuit 2. In the normal condition (D = 100%), symmetry breaking occurs and the activities in the two circuits are different. As DA is depleted, this difference diminishes and symmetry is restored for D ≈ 70%.
The effect of DA depletion on the GPi and cortical activities becomes more significant when the input to the cortex is large. This is because the reduction in GStrCtx has more effect on striatal activity for large external input to the cortex, whereas the effect of the change in threshold remains the same. Thus, these two antagonist effects do not compensate for high external input to the cortex and the average activities are more dependent on the DA level in response to an input such as the one in Figure 8A than at rest. In fact, the GPi becomes hyperactive by ∼20%, whereas the cortex becomes hypoactive by >40% in the former situation.
The ability to perform action selection is lost when the DA level decreases.
Because DA depletion reduces the feedback in the direct loop, it induces an impairment of the ability of the BG network to perform action selection. This is depicted in Figure 9B, where the responses of the cortex and the GPi to the input of Figure 8A are shown separately for the two circuits. For D = 100%, the responses in the two circuits are different because the BG network performs action selection as described above. The difference is reduced when DA decreases and eventually it becomes negligible for D < 70%. Hence, overly strong DA depletion induces a complete loss of the action selection ability.
The loss of selectivity for D = 70% is also depicted in Figure 10A. The two top panels display the external inputs to the cortex and the striatum. The bottom three panels show the corresponding responses in the pallidal, thalamic, and cortical populations in the two circuits. During the first 200 ms of external input, the activities are slightly different from one circuit to the other. However, this asymmetry is attributable to the transient selective component of the input and disappears once this component is over. Hence, the BG network is not able to perform action selection any more.
Figure 10.
Response of the network after partial DA depletion (D = 70%). A, The external input is the same as in Figure 8A (striatal input not shown). B, The population activity of a group of 20 neurons in GPi (top panel), thalamus (middle panel), and cortex (bottom panel). Black, Circuit 1; gray, circuit 2. The transient selective input to the striatum induces a small difference in the activities of the two circuits. This difference disappears after the selective input to the striatum is over.
Rest activity becomes oscillatory and synchronous when the DA level is very low.
Another effect of DA depletion on the dynamics of the network is the change in activity pattern of the neurons. Activity in the rest state becomes oscillatory and synchronous when the DA level is sufficiently low. These synchronous oscillations emerge because as DA is depleted the positive feedback in the direct loop decreases because the efficacy of the corticostriatal synapses is reduced. When this feedback is too weak to counterbalance the negative feedback in the hyperdirect loop, oscillations appear. For the parameters of Table 1, this happens for DA ≈ 35%. The oscillations are shown in Figure 11A for D = 20%. Their frequency, which is ∼11 Hz, is fairly insensitive to the DA level (for D = 0, the frequency is 10 Hz) (data not shown). This contrasts with the amplitude of the oscillations, which increases significantly when DA decreases. It is 1.7 times larger for D = 0 than for D = 20%. Interestingly, the oscillations are hardly visible in the spike trains of individual neurons (Fig. 11A, raster plots) but are revealed by the autocorrelations and cross-correlations of neurons (Fig. 11B).
Figure 11.

Rest activity in the GPi after strong DA depletion (D = 20%). A, Top, The population activity (averaged over 20 neurons) in the GPi displays oscillations with a frequency ∼11 Hz. Bottom, Raster plots for the spike trains of the 20 units in the top figure. B, Correlation matrix of the spike trains of three units in GPi. Diagonal, Autocorrelations. Off-diagonal, Cross-correlations (see Materials and Methods). C, The distribution of the average firing rates of GPi neurons for D = 20%. Despite the dramatic change in the pattern of neuronal activity, the time average distribution does not change greatly after DA depletion [compare with the distribution in the normal situation (Fig. 6A)].
Despite the change in activity pattern in the network, the distribution of time average spontaneous firing rates in the GPi is not substantially affected by DA depletion. This can be seen in Figure 11C (D = 20%), which shows that this distribution is very similar to the one in the normal condition (compare with Fig. 6). This is consistent with the weak dependence of the rest population activity in the GPi when DA is depleted (Fig. 9). Note that the assumption that DA increases striatal average firing threshold is not crucial for the loss of action selection and the emergence of oscillations. However, as explained above, it is required to keep the average spontaneous activity of the GPi neurons almost unchanged as dopamine is depleted.
Suppression of oscillations in the presence of strong external input to the cortex.
The activity pattern is also oscillatory in response to an external input to the cortex provided it is not too strong. This is shown in Figure 12A for an input that, for D = 100%, would select an action. In contrast, for D = 20%, the response of the network is symmetric: the two circuits respond in the same way, with an average level of activity that is significantly lower than in the normal situation and with pronounced synchronous oscillations. However, the oscillations are suppressed if the amplitude of the external input is sufficiently strong as shown in Figure 12B. This happens when the GPi is so highly excited via the STN that it inhibits the activity in the thalamus sufficiently to bring it in the nonlinear range of the effective input–output transfer function of the neurons (Fig. 12C). In this range, the gain of the thalamic neurons is substantially reduced. As a consequence, the feedback in the hyperdirect loop is not sufficient to induce oscillations.
Figure 12.

Response of the network to external inputs in the high DA depletion condition, D = 20%. Black, Circuit 1; gray, circuit 2. In A–C, from top to bottom, the input to the cortical populations and the average population activities (20 neurons) in the GPi, the thalamus, and the cortex are shown. The input to striatal neurons is always the same as in Figure 8. A, The external input is slightly selective as in Figure 8A. Oscillatory activities occur in the three populations represented. During input, activity in both cortical populations increases only slightly. B, The external input to the cortex, which is three time larger than in A, is plotted in the top panel. The thalamus is strongly inhibited during input. The oscillatory activity in the network is suppressed. C, Response to the large and strongly selective input to the cortex (ϵ = 0.6) plotted in the top panel. Oscillations are stopped and selectivity is trivially restored. D, Effective input–output transfer function of neurons in the thalamus in presence of noise (black, SD of the noise given in Table 1). For comparison, the function without noise is plotted in gray.
Although oscillations can be highly suppressed in presence of a strong input to the cortex, this is not enough to restore the ability of the BG network to perform action selection. However, an asymmetric response can still be obtained if the external input is itself selective. This trivial mechanism in which the BG network does not contribute to the selection is illustrated in Figure 12C.
Discussion
The hypotheses of the model
Our model assumes that BG–cortical circuits involved in the execution of different motor programs are made up of feedback loops. Thus, motor cortical areas are involved in closed loops within this network (Alexander et al., 1986; Nakano, 2000; Kelly and Strick, 2004). For instance, the primary motor cortex (M1) sends information to the motor part of the GPi via the sensory- motor striatal area (Alexander et al., 1986; Parent and Hazrati, 1995a). It also receives information, relayed by the thalamus, from the motor part of the GPi (Kayahara and Nakano, 1996; Hoover and Strick, 1999). Moreover, closed loops exist at a finer scale. For instance, the direct pathway (Alexander et al., 1986; Deniau et al., 1996) and the GPi–thalamus–cortex pathways (Hoover and Strick, 1993; Hoover and Strick, 1999) are somatotopically and functionally organized. In particular, there is evidence that arm-related areas in M1, striatum, and GPi are involved in closed loops starting and finishing in M1 (Kelly and Strick, 2004). Local intracortical connections may also contribute to closing these loops.
Our claim is that competition between the direct and the hyperdirect feedback loops plays a key role in the dynamics of BG. Pathologies of the network dynamics emerge in our model, because we have assumed that DA primarily affects the direct pathway, in line with current data (but see Cossette et al., 1999; Graybiel, 2000).
The indirect pathway has negative polarity, and it may also contribute to action selection. However, how DA depletion could affect this contribution depends crucially on the degree of segregation between the direct and indirect pathways. Because recent experiments indicate that this is incomplete (Aizman et al., 2000; Wu et al., 2000; Levesque and Parent, 2005), we suggest that the indirect pathway only plays a secondary role in the emergence of pathological oscillations in GPi and impairment of movement, in line with Soares et al. (2004).
We have assumed that only the cortex and the striatum receive the early command for action execution. This is in line with the fact that movement-related modifications of activity occur later in the BG output structures than in the motor cortex (Brotchie et al., 1991; Mink and Thach, 1991) and with the involvement of striatal sensorimotor territories in movement initiation (Gardiner and Nelson, 1992; Boussaoud and Kermadi, 1997; Lee and Assad, 2003).
Effects of DA depletion on the state of the BG
Hypokinetic symptoms of PD are classically thought to be attributable to abnormally strong inhibition of the thalamus and cortex by a hyperactive GPi (Albin et al., 1989; DeLong, 1990). However, recent experiments in MPTP (1-methyl-4-phenyl-1,2,3,6-tetrahydropyridine)-treated monkeys have found that the mean rates in M1 during periods of immobility do not change compared with normal situations (Goldberg et al., 2002). Also, Raz et al. (2000) failed to find increases in GPi spontaneous average activity. Accordingly, in our model, the changes in GPi and cortical activity with DA depletion are weak in the absence of external input but become larger for large input. Hence, our work suggests that DA depletion may not affect the spontaneous average activity but still can contribute substantially to impeding the execution of movement.
DA depletion induces loss of functional segregation in the BG and in their target structure (Filion et al., 1988; Mink, 1996; Boraud et al., 2000; Pessiglione et al., 2005). We suggest that these pathologies stem from a reduction of the feedback in the direct pathways when DA is depleted, which moves the BG network out of the symmetry-breaking regimen.
Synchronous oscillations are another pathology of BG attributable to DA depletion (for review, see Boraud et al., 2002; Hutchison et al., 2004). Our model indicates that these oscillations may be driven by the hyperdirect loop when its strong negative feedback is not counterbalanced by the positive feedback in the direct loop. The frequency of the oscillations depends on the delays along the loops. For the chosen values that are compatible with experimental data (Nambu et al., 2000), the frequency is ∼10–12 Hz, in line with experiments in nonhuman primate models of PD (Nini et al., 1995; Raz et al., 2000) and in PD patients (Hutchison et al., 1997; Brown et al., 2001).
When DA is strongly depleted in our model, the execution of a program requires a large strongly selective input to the cortex that suppresses the oscillations. A similar mechanism may explain the suppression of synchronous oscillations during voluntary movement in parkinsonian patients (Levy et al., 2002).
The role of the striatum in the dynamics of the BG network
According to recent estimates (Sandstrom and Rebec, 2003; Slaght et al., 2004), most of the striatal projection neurons are silent at rest, whereas 30% fire at a rate in the range of 0.2–5 Hz. Our work indicates that, although small, this activity plays a role in BG dynamics. Because of the high convergence from the striatum to the GPi, one GPi neuron receives input from many striatal projection neurons. The sparse activity in this large population allows for the effective gain of the striatopallidal path to be sufficient to balance the feedback in the hyperdirect loop and prevent pathological oscillations.
Comparison with other models of BGs
Chevalier and Deniau (Deniau, 1985; Chevalier and Deniau, 1990) have suggested that the direct pathway may facilitate wanted motor programs via focused disinhibition of specific thalamic neurons. Mink and Thach (1993) argued that a center surround inhibitory pattern of pallidal activity resulting from focused striatal inhibition combined with diffused excitation from the STN may provide the basis of program selection. Gurney et al. (2001a,b) studied a model that is similar in spirit and in which the BG select the most salient input from a set of incoming cortical inputs. More recently, Rubchinsky et al. (2003) claimed that the ability to switch between motor programs depends on an interplay between rebound properties of neurons and slow GABAB synapses in the STN–GP network. In all of these models, the BG network processes in a feedforward manner cortical information that is already selective. This is in contrast to our model, which relies on symmetry breaking. Symmetry breaking has also been proposed as a candidate mechanism for perceptual decision making (Wang, 2002).
Action selection in BG may also be a consequence of a “winner-take-all” mechanism among striatal neurons interacting via lateral inhibition (Wickens et al., 1991; Beiser and Houk, 1998). This idea shows similarities with ours: in both cases, selection emerges from competition among neurons or population of neurons. However, the effect of lateral inhibition among striatal output neurons on their overall activity is still unclear (Jaeger et al., 1994; Tepper et al., 2004; Venance et al., 2004).
One recent theory is that oscillatory activity that appears in BG after DA depletion can be driven by the STN–GPe network (Plenz and Kitai, 1998; Bevan and Wilson, 1999; Terman et al., 2002). Another possibility is that the indirect loop can become oscillatory when DA is depleted (Goldberg et al., 1999). As in our model, in these scenarios, oscillations are the result of a network effect. However, they differ as regards the specific network involved.
Conclusions
The model we have put forward is unique in several respects. To our knowledge, it is the first dynamical model to address both the physiology and the pathophysiology of BG in a unified framework. It does not require segregation between direct and indirect pathways. It explains how the BG can perform action selection, how this deteriorates gradually when DA is depleted, and why sufficient DA depletion changes the activity patterns in BG without significantly affecting the average level of spontaneous activity in GPi. The model also explains the suppression of pathological oscillations in GPi during movement execution.
According to the behavior of our model, selection ability is lost before the appearance of oscillations. Oscillations may not even appear if the feedback in the hyperdirect loop is too small. This suggests that behavioral changes induced by DA depletion are not directly related to an increase in the level of synchronicity in BG neural activity.
Our model predicts that the loss of selection ability is correlated with a change in the proportion of GPi neurons activated in relation to specific actions (Fig. 13A) and that this occurs before changes in power spectra of the neural activity, if any (Fig. 13B). Another major prediction of our model is that synchronous oscillations driven by the hyperdirect loop appear in BG after inactivation of the striatum. Consistent with this prediction, Slaght et al. (2004) showed that striatal projection neurons are strongly inhibited during spike-and-wave discharges in absence epilepsy. The strong feedback in the hyperdirect loop, no longer balanced by the direct loop when the striatum is silent, could then contribute to the 7–10 Hz oscillatory activity in the BG–cortical loop during absence seizures. Verifying these predictions further would be a powerful test of our model.
Figure 13.

Activity pattern and response to action execution in the GPi during progressive DA depletion. A, Ratio of GPi neurons that are inhibited during action execution for several levels of striatal DA. Action selection in the model relies on the bimodal response to action execution in the GPi (one population is inhibited, whereas the other is activated). The decrease in the proportion of inhibited neurons in the GPi in response to movement reflects the loss of action selection properties that occur for low DA depletion. B, Ratio of oscillatory autospectra and coherence for several levels of striatal DA in the model. For each DA level, the spectral analysis is applied to 40 GPi units (see Materials and Methods). The emergence of synchronized oscillatory activity occurs only after high DA depletion.
Appendix
The dynamics of the network in the reduced model can be described in terms of global parameters: the products of the synaptic strength along the direct (positive-feedback) and the hyperdirect (negative-feedback) loops:
 |
the total delays along these two loops:
and the ratio between cortico-STN synaptic time constant and time constant of other synapses:
 |
The linear symmetric steady state
The activities of the various populations when the network is at the linear fixed point are determined by a set of linear equations. These equations can be solved straightforwardly. One finds the following:
 |
 |
 |
 |
 |
with k = 1, 2 and
 |
This symmetric linear steady state exists if the external input to the cortex is such that
and, if G− ≤ G+,
 |
or, if G− > G+,
 |
To investigate the stability of the linear symmetric steady state, we study the equations of the dynamics linearized around that state and look for solutions of the following form (Strogatz, 1994):
 |
It is easy to see that the eigenvalue λ is a solution of the following equation:
 |
where the 10 × 10 matrix M is as follows:
 |
with (α, β) two populations of the network. Note that Gαβ ≠ 0 only if the population β is postsynaptic to α. The determinant of M can be calculated analytically. One finds the following:
 |
Symmetry-breaking instability
Solving the equation P(0) = 0, one finds that the linear steady state undergoes a symmetry-breaking instability for the following:
 |
In network then settles into an asymmetric steady state, in which the activity of the cortex in the circuit where it is active is as follows:
 |
As in the case of the linear symmetric steady state, we determine the stability of the asymmetric steady states through the linearized dynamics. One find the following matrix:
 |
with ∼Gαβ = Gαβ if population α is active, 0 else. The stability of these states is thus determined by the function P(λ):
 |
and, in particular, the asymmetric steady states become unstable for the following:
 |
Oscillatory instability
We then look for oscillatory instabilities to the linear symmetric steady state. The precise conditions that G+, G−, Δ+, Δ−, μ satisfy at the instability onset are determined by the equation P(iν) = 0. The instability condition simplifies if one assumes that Δ+ = Δ− ≡ Δ and μ = 1. In this case, one finds that the linear steady state undergoes a Hopf instability for the following:
where
 |
and
 |
The frequency of the corresponding oscillatory mode is  .
.
Footnotes
This work was supported by Action Concertée Incitative “Neurosciences Intégratives et Computationnelles” NIC0013 and PID CTI01-01. Additional support was provided by Association Franco-Israélienne pour la Recherche en Neurosciences. We thank Stephane Charpier, Jean Michel Deniau, and Nicolas Maurice for very fruitful discussions. We are grateful to Jean Michel Deniau for critical reading of this manuscript.
References
- Aizman O, Brismar H, Uhlen P, Zettergren E, Levey AI, Forssberg H, Greengard P, Aperia A (2000). Anatomical and physiological evidence for D1 and D2 dopamine receptor colocalization in neostriatal neurons. Nat Neurosci 3:226–230. [DOI] [PubMed] [Google Scholar]
- Albin RL, Young AB, Penney JB (1989). The functional anatomy of basal ganglia disorders. Trends Neurosci 12:366–375. [DOI] [PubMed] [Google Scholar]
- Alexander GE, DeLong MR, Strick PL (1986). Parallel organization of functionally segregated circuits linking basal ganglia and cortex. Annu Rev Neurosci 9:357–381. [DOI] [PubMed] [Google Scholar]
- Apicella P, Ljungberg T, Scarnati E, Schultz W (1991). Responses to reward in monkey dorsal and ventral striatum. Exp Brain Res 85:491–500. [DOI] [PubMed] [Google Scholar]
- Baker SN, Gerstein GL (2001). Determination of response latency and its application to normalization of cross-correlation measures. Neural Comput 13:1351–1377. [DOI] [PubMed] [Google Scholar]
- Bar-Gad I, Bergman H (2001). Stepping out of the box: information processing in the neural networks of the basal ganglia. Curr Opin Neurobiol 11:689–695. [DOI] [PubMed] [Google Scholar]
- Beiser DG, Houk JC (1998). Model of cortical-basal ganglionic processing: encoding the serial order of sensory events. J Neurophysiol 79:3168–3188. [DOI] [PubMed] [Google Scholar]
- Benazzouz A, Gross C, Feger J, Boraud T, Bioulac B (1993). Reversal of rigidity and improvement in motor performance by subthalamic high-frequency stimulation in MPTP-treated monkeys. Eur J Neurosci 5:382–389. [DOI] [PubMed] [Google Scholar]
- Bergman H, Wichmann T, DeLong MR (1990). Reversal of experimental parkinsonism by lesions of the subthalamic nucleus. Science 249:1436–1438. [DOI] [PubMed] [Google Scholar]
- Bergman H, Wichmann T, Karmon B, DeLong MR (1994). The primate subthalamic nucleus. II. Neuronal activity in the MPTP model of parkinsonism. J Neurophysiol 72:507–520. [DOI] [PubMed] [Google Scholar]
- Bevan MD, Wilson CJ (1999). Mechanisms underlying spontaneous oscillation and rhythmic firing in rat subthalamic neurons. J Neurosci 19:7617–7628. [DOI] [PMC free article] [PubMed] [Google Scholar]
- Bolam JP, Hanley JJ, Booth PAC, Bevan MD (2000). Synaptic organisation of the basal ganglia. J Anat 196:527–542. [DOI] [PMC free article] [PubMed] [Google Scholar]
- Boraud T, Bezard E, Bioulac B, Gross CE (2000). Ratio of inhibited-to-activated pallidal neurons decreases dramatically during passive limb movement in the MPTP-treated monkey. J Neurophysiol 83:1760–1763. [DOI] [PubMed] [Google Scholar]
- Boraud T, Bezard E, Bioulac B, Gross CE (2002). From single extracellular unit recording in experimental and human Parkinsonism to the development of a functional concept of the role played by the basal ganglia in motor control. Prog Neurobiol 66:265–283. [DOI] [PubMed] [Google Scholar]
- Boussaoud D, Kermadi I (1997). The primate striatum: neuronal activity in relation to spatial attention versus motor preparation. Eur J Neurosci 9:2152–2168. [DOI] [PubMed] [Google Scholar]
- Brotchie JM, Iansek R, Horne MK (1991). Motor function of the monkey globus pallidus. I. Neuronal discharge and parameters of movements. Brain 114:1667–1683. [DOI] [PubMed] [Google Scholar]
- Brown P, Oliviero A, Mazzone P, Insola A, Tonali P, Di Lazzaro V (2001). Dopamine dependency of oscillations between subthalamic nucleus and pallidum in Parkinson's disease. J Neurosci 21:1033–1038. [DOI] [PMC free article] [PubMed] [Google Scholar]
- Calabresi P, Centonze D, Bernardi G (2000). Electrophysiology of dopamine in normal and denervated striatal neurons. Trends Neurosci 23:S57–S63. [DOI] [PubMed] [Google Scholar]
- Chevalier G, Deniau JM (1990). Disinhibition as basic process in the expression in striatal functions. Trends Neurosci 13:277–280. [DOI] [PubMed] [Google Scholar]
- Cossette M, Levesque M, Parent A (1999). Extrastriatal dopaminergic innervation of human basal ganglia. Neurosci Res 34:51–54. [DOI] [PubMed] [Google Scholar]
- DeLong MR (1990). Primate models of movement disorders of basal ganglia. Trends Neurosci 13:281–285. [DOI] [PubMed] [Google Scholar]
- Deniau JM (1985). Disinhibition as a basic process in the expression of striatal functions. II. The striato-nigral influence on thalamocortical cells of the ventromedial thalamic nucleus. Brain Res 334:227–233. [DOI] [PubMed] [Google Scholar]
- Deniau JM, Lackner D, Feger J (1978). Effect of substantia nigra stimulation on identified neurons in the VL-VA thalamic complex: comparison between intact and chronically decorticated cats. Brain Res 145:27–35. [DOI] [PubMed] [Google Scholar]
- Deniau JM, Menetrey A, Charpier S (1996). The lamellar organization of the rat substantia nigra pars reticulata: segregated patterns of striatal afferents and relationship to the topography of corticostriatal projections. Neuroscience 73:761–781. [DOI] [PubMed] [Google Scholar]
- Ermentrout B (1996). Type I membranes, phase resetting curves, and synchrony. Neural Comput 8:979–1001. [DOI] [PubMed] [Google Scholar]
- Filion M, Tremblay L, Bedard PJ (1988). Abnormal influences of passive limb movement on the activity of globus pallidus neurons in parkinsonian monkeys. Brain Res 444:165–176. [DOI] [PubMed] [Google Scholar]
- Gardiner TW, Nelson RJ (1992). Striatal neuronal activity during the initiation and execution of hand movements made in response to visual and vibratory cues. Exp Brain Res 92:15–26. [DOI] [PubMed] [Google Scholar]
- Gerfen CR, Wilson CJ (1996). The basal ganglia. In: Handbook of chemical neuroanatomy, Vol 12, Integrated systems of the CNS, Pt III (Swanson LW, Bjorklund A, Hokfelt T, eds) pp. 371–468. Amsterdam: Elsevier.
- Goldberg JA, Hansel D, Bergman H, Sompolinsky H (1999). Network model of parkinsonian neuronal oscillations in the cortico-basal ganglionic circuit. Soc Neurosci Abstr 25:765.3. [Google Scholar]
- Goldberg JA, Boraud T, Maraton S, Haber SN, Vaadia E, Bergman H (2002). Enhanced synchrony among primary motor cortex neurons in the MPTP primate model of Parkinson's disease. J Neurosci 22:4639–4953. [DOI] [PMC free article] [PubMed] [Google Scholar]
- Golomb D, Hansel D (2000). The number of synaptic inputs and the synchrony of large, sparse neuronal networks. Neural Comput 12:1095–1139. [DOI] [PubMed] [Google Scholar]
- Graybiel AM (2000). The basal ganglia. Curr Biol 10:R509–R511. [DOI] [PubMed] [Google Scholar]
- Gurney K, Prescott TJ, Redgrave P (2001a). A computational model of action selection in the basal ganglia. I. A new functional anatomy. Biol Cybern 84:401–410. [DOI] [PubMed] [Google Scholar]
- Gurney K, Prescott TJ, Redgrave P (2001b). A computational model of action selection in the basal ganglia. II. Analysis and simulation of behaviour. Biol Cybern 84:411–423. [DOI] [PubMed] [Google Scholar]
- Haber SN, Fudge JL (1997). The primate substantia nigra and VTA: integrative circuitry and function. Crit Rev Neurobiol 11:323–342. [DOI] [PubMed] [Google Scholar]
- Halliday DM, Rosenberg JR (2000). On the application, estimation and interpretation of coherence and pooled coherence. J Neurosci Methods 100:173–174. [DOI] [PubMed] [Google Scholar]
- Hikosaka O, Takikawa Y, Kawagoe R (2000). Role of the basal ganglia in the control of purposive saccadic eye movements. Physiol Rev 80:953–978. [DOI] [PubMed] [Google Scholar]
- Hoover JE, Strick PL (1993). Multiple output channels in the basal ganglia. Science 259:819–821. [DOI] [PubMed] [Google Scholar]
- Hoover JE, Strick PL (1999). The organization of cerebellar and basal ganglia outputs to primary motor cortex as revealed by retrograde transneuronal transport of herpes simplex virus type 1. J Neurosci 19:1446–1463. [DOI] [PMC free article] [PubMed] [Google Scholar]
- Hopfield JJ (1984). Neurons with graded response have collective computational properties like those of two-state neurons. Proc Natl Acad Sci USA 81:3088–3092. [DOI] [PMC free article] [PubMed] [Google Scholar]
- Hutchison WD, Lozano AM, Tasker RR, Lang AE, Dostrovsky JO (1997). Identification and characterization of neurons with tremor-frequency activity in human globus pallidus. Exp Brain Res 113:557–563. [DOI] [PubMed] [Google Scholar]
- Hutchison WD, Dostrovsky JO, Walters JR, Courtemanche R, Boraud T, Goldberg J, Brown P (2004). Neuronal oscillations in the basal ganglia and movement disorders: evidence from whole animal and human recordings. J Neurosci 24:9240–9243. [DOI] [PMC free article] [PubMed] [Google Scholar]
- Jaeger D, Kita H, Wilson CJ (1994). Surround inhibition among projection neurons is weak or nonexistent in the rat neostriatum. J Neurophysiol 72:2555–2558. [DOI] [PubMed] [Google Scholar]
- Kayahara T, Nakano K (1996). Pallido-thalamo-motor cortical connections: an electron microscopic study in the macaque monkey. Brain Res 706:337–342. [DOI] [PubMed] [Google Scholar]
- Kelly RM, Strick PL (2004). Macro-architecture of basal ganglia loops with the cerebral cortex: use of rabies virus to reveal multisynaptic circuits. Prog Brain Res 143:449–459. [DOI] [PubMed] [Google Scholar]
- Kerr JN, Wickens JR (2001). Dopamine D-1/D-5 receptor activation is required for long-term potentiation in the rat neostriatum in vitro. J Neurophysiol 85:117–124. [DOI] [PubMed] [Google Scholar]
- Kincaid AE, Zheng T, Wilson CJ (1998). Connectivity and convergence of single corticostriatal axons. J Neurosci 18:4722–4731. [DOI] [PMC free article] [PubMed] [Google Scholar]
- Kish LJ, Palmer MR, Gerhardt GA (1999). Multiple single-unit recordings in the striatum of freely moving animals: effects of apomorphine and d-amphetamine in normal and unilateral 6-hydroxydopamine-lesioned rats. Brain Res 833:58–70. [DOI] [PubMed] [Google Scholar]
- Kiyatkin EA, Rebec GV (1996). Dopaminergic modulation of glutamate-induced excitations of neurons in the neostriatum and nucleus accumbens of awake, unrestrained rats. J Neurophysiol 75:142–153. [DOI] [PubMed] [Google Scholar]
- Leblois A, Boraud T, Bergman H, Hansel D (2002). A model of the basal ganglia physiology and pathophysiology built on competition between direct and hyperdirect pathways. Soc Neurosci Abstr 28:915.11. [Google Scholar]
- Leblois A, Boraud T, Bergman H, Hansel D (2003). The roles of feedback loops in the physiology and physiopathology of the basal ganglia. Soc Neurosci Abstr 29:358.1. [Google Scholar]
- Lee IH, Assad JA (2003). Putaminal activity for simple reactions or self-timed movements. J Neurophysiol 89:2528–2537. [DOI] [PubMed] [Google Scholar]
- Levesque M, Parent A (2005). The striatofugal fiber system in primates: a reevaluation of its organization based on single-axon tracing studies. Proc Natl Acad Sci USA 102:11888–11893. [DOI] [PMC free article] [PubMed] [Google Scholar]
- Levy R, Ashby P, Hutchison WD, Lang AE, Lozano AM, Dostrovsky JO (2002). Dependence of subthalamic nucleus oscillations on movement and dopamine in Parkinson's disease. Brain 125:1196–1209. [DOI] [PubMed] [Google Scholar]
- Maurice N, Deniau JM, Glowinski J, Thierry AM (1998). Relationships between the prefrontal cortex and the basal ganglia in the rat: physiology of the corticosubthalamic circuits. J Neurosci 18:9539–9546. [DOI] [PMC free article] [PubMed] [Google Scholar]
- Mink JW (1996). The basal ganglia: focused selection and inhibition of competing motor programs. Prog Neurobiol 50:381–425. [DOI] [PubMed] [Google Scholar]
- Mink JW, Thach WT (1991). Basal ganglia motor control. II. Late pallidal timing relative to movement onset and inconsistent pallidal coding of movement parameters. J Neurophysiol 65:301–329. [DOI] [PubMed] [Google Scholar]
- Mink JW, Thach WT (1993). Basal ganglia intrinsic circuits and their role in behavior. Curr Opin Neurobiol 3:950–957. [DOI] [PubMed] [Google Scholar]
- Nakano K (2000). Neural circuits and topographic organization of the basal ganglia and related regions. Brain Dev 22:S5–S16. [DOI] [PubMed] [Google Scholar]
- Nambu A, Tokuno H, Hamada I, Kita H, Imanishi M, Akazawa T, Ikeuchi Y, Asegawa N (2000). Excitatory cortical inputs to pallidal neurons via the subthalamic nucleus in the monkey. J Neurophysiol 84:289–300. [DOI] [PubMed] [Google Scholar]
- Nicola SM, Woodward Hopf F, Hjelmstad GO (2004). Contrast enhancement: a physiological effect of striatal dopamine? Cell Tissue Res 318:93–106. [DOI] [PubMed] [Google Scholar]
- Nini A, Feingold A, Slovin H, Bergman H (1995). Neurons in the globus pallidus do not show correlated activity in the normal monkey, but phase-locked oscillations appear in the MPTP model of parkinsonism. J Neurophysiol 74:1800–1805. [DOI] [PubMed] [Google Scholar]
- O’Donnell P (2003). Dopamine gating of forebrain neural ensembles. Eur J Neurosci 17:429–435. [DOI] [PubMed] [Google Scholar]
- Parent A, Hazrati LN (1995a). Functional anatomy of the basal ganglia. I. The cortico-basal ganglia-thalamo-cortical loop. Brain Res Brain Res Rev 20:91–127. [DOI] [PubMed] [Google Scholar]
- Parent A, Hazrati LN (1995b). Functional anatomy of the basal ganglia. II. The place of subthalamic nucleus and external pallidum. Brain Res Brain Res Rev 20:128–154. [DOI] [PubMed] [Google Scholar]
- Pessiglione M, Guehl D, Rolland AS, Francois C, Hirsch EC, Feger J, Tremblay L (2005). Thalamic neuronal activity in dopamine-depleted primates: evidence for a loss of functional segregation within basal ganglia circuits. J Neurosci 25:1523–1531. [DOI] [PMC free article] [PubMed] [Google Scholar]
- Plenz D, Kitai ST (1998). Regulation of the nigrostriatal pathway by metabotropic glutamate receptors during development. J Neurosci 18:4133–4144. [DOI] [PMC free article] [PubMed] [Google Scholar]
- Press WH, Flannery BP, Teukolsky SA, Vetterling WT (1993). In: Numerical recipes in C Ed 2 Cambridge, UK: Cambridge UP.
- Raz A, Vaadia E, Bergman H (2000). Firing patterns and correlations of spontaneous discharge of pallidal neurons in the normal and the tremulous MPTP-treated vervet model of Parkinsonism. J Neurosci 20:8559–8571. [DOI] [PMC free article] [PubMed] [Google Scholar]
- Raz A, Frechter-Mazar V, Feingold A, Abeles M, Vaadia E, Bergman H (2001). Activity of pallidal and striatal tonically active neurons is correlated in MPTP-treated monkeys but not in normal monkeys. J Neurosci 21:RC128(1–5). [DOI] [PMC free article] [PubMed] [Google Scholar]
- Rubchinsky LL, Kopell N, Sigvardt KA (2003). Modeling facilitation and inhibition of competing motor programs in basal ganglia subthalamic nucleus-pallidal circuits. Proc Natl Acad Sci USA 100:14427–14432. [DOI] [PMC free article] [PubMed] [Google Scholar]
- Sandstrom MI, Rebec GV (2003). Characterization of striatal activity in conscious rats: contribution of NMDA and AMPA/kainate receptors to both spontaneous and glutamate-driven firing. Synapse 47:91–100. [DOI] [PubMed] [Google Scholar]
- Schultz W, Apicella P, Ljungberg T (1993). Responses of monkey dopamine neurons to reward and conditioned stimuli during successive steps of learning a delayed response task. J Neurosci 13:900–913. [DOI] [PMC free article] [PubMed] [Google Scholar]
- Shriki O, Hansel D, Sompolinsky H (2003). Rate models for conductance-based cortical neuronal networks. Neural Comput 15:1809–1841. [DOI] [PubMed] [Google Scholar]
- Slaght SJ, Paz T, Chavez M, Deniau JM, Mahon S, Charpier S (2004). On the activity of the corticostriatal networks during spike-and-wave discharges in a genetic model of absence epilepsy. J Neurosci 24:6816–6825. [DOI] [PMC free article] [PubMed] [Google Scholar]
- Soares J, Kliem MA, Betarbet R, Greenamyre JT, Yamamoto B, Wichmann T (2004). Role of external pallidal segment in primate parkinsonism: comparison of the effects of 1-methyl-4-phenyl-1,2,3,6-tetrahydropyridine-induced parkinsonism and lesions of the external pallidal segment. J Neurosci 24:6417–6426. [DOI] [PMC free article] [PubMed] [Google Scholar]
- Strogatz SH (1994). In: Nonlinear dynamics and chaos: with applications in physics, biology, chemistry, and engineering Cambridge, MA: Westview.
- Tepper JM, Koos T, Wilson CJ (2004). GABAergic microcircuits in the neostriatum. Trends Neurosci 27:662–669. [DOI] [PubMed] [Google Scholar]
- Terman D, Rubin J, Yew A, Wilson C (2002). Activity patterns in a model for the subthalamopallidal network of the basal ganglia. J Neurosci 22:2963–2976. [DOI] [PMC free article] [PubMed] [Google Scholar]
- Tseng KY, Kasanetz F, Kargieman L, Riquelme LA, Murer MG (2001). Cortical slow oscillatory activity is reflected in the membrane potential and spike trains of striatal neurons in rats with chronic nigrostriatal lesions. J Neurosci 21:6430–6439. [DOI] [PMC free article] [PubMed] [Google Scholar]
- Turner RS, Anderson ME (1997). Pallidal discharge related to the kinematics of reaching movements in two dimensions. J Neurophysiol 77:1051–1074. [DOI] [PubMed] [Google Scholar]
- Venance L, Glowinski J, Giaume C (2004). Electrical and chemical transmission between striatal GABAergic output neurones in rat brain slices. J Physiol (Lond) 559:215–230. [DOI] [PMC free article] [PubMed] [Google Scholar]
- Wang XJ (2002). Probabilistic decision making by slow reverberation in cortical circuits. Neuron 36:955–968. [DOI] [PubMed] [Google Scholar]
- Wickens JR, Alexander ME, Miller R (1991). Two dynamic modes of striatal function under dopaminergic-cholinergic control: simulation and analysis of a model. Synapse 8:1–12. [DOI] [PubMed] [Google Scholar]
- Wilson HR, Cowan JD (1972). Excitatory and inhibitory interactions in localized populations of model neurons. Biophys J 12:1–24. [DOI] [PMC free article] [PubMed] [Google Scholar]
- Wu Y, Richard S, Parent A (2000). The organization of the striatal output system: a single-cell juxtacellular labeling study in the rat. Neurosci Res 38:49–62. [DOI] [PubMed] [Google Scholar]