Abstract
Gap junctions are common between cortical GABAergic interneurons but little is known about their quantitative distribution along dendritic profiles. Here, we provide direct morphological evidence that parvalbumin-containing GABAergic neurons in layer 2/3 of the cat visual cortex form dense and far-ranging networks through dendritic gap junctions. Gap junction-coupled networks of parvalbumin neurons were visualized using connexin36 immunohistochemistry and confocal laser-scanning microscopy (CLSM). The direct correspondence of connexin36-immunopositve puncta and gap junctions was confirmed by examining the same structures in both CLSM and electron microscopy. Single parvalbumin neurons with large somata (≥200 μm2) formed 60.3 ± 12.2 (mean ± SD) gap junctions with other cells whereby these contacts were not restricted to proximal dendrites but occurred at distances of up to 380 μm from the soma. In a Sholl analysis of large-type parvalbumin neurons, 21.9 ± 7.9 gap junctions were within 50 μm of the soma, 21.7 ± 7.6 gap junctions in a segment between 50 and 100 μm, 11.2 ± 4.7 junctions between 100 and 150 μm, and 5.6 ± 3.6 junctions were in more distal segments. Serially interconnected neurons could be traced laterally in a boundless manner through multiple gap junctions. Comparison to the orientation-preference columns revealed that parvalbumin-immunoreactive cells distribute randomly whereby their large dendritic fields overlap considerably and cover different orientation columns. It is proposed that this dense and homogeneous electrical coupling of interneurons supports the precise synchronization of neuronal populations with differing feature preferences thereby providing a temporal frame for the generation of distributed representations.
Keywords: gap junction, connexin36, interneuron, parvalbumin, visual cortex, orientation column
Introduction
Parvalbumin (PV)-containing neurons constitute ∼50% of cortical GABAergic interneurons. They establish inhibitory synaptic contacts on the perisomatic membrane domain of hundreds of surrounding neurons and thereby control the frequency and the timing of discharges in the targeted neuronal populations (Buzsáki and Chrobak, 1995; Cobb et al., 1995). PV neurons innervate not only excitatory neurons but also other PV neurons, forming reciprocal inhibitory circuits (Kisvárday et al., 1993; Sik et al., 1995; Fukuda et al., 1996). Another distinctive feature of the network of PV neurons is its additional coupling through gap junctions (Katsumaru et al., 1988; Galarreta and Hestrin, 1999; Gibson et al., 1999; Fukuda and Kosaka, 2000a, 2003; Tamás et al., 2000). These dual modes of communication among PV neurons and their reciprocal interactions with excitatory cells have been proposed to be instrumental for the temporal patterning of population activity and, in particular, for the generation of oscillations and their synchronization (Buzsáki and Chrobak, 1995; Traub et al., 1997, 2004). This coordination of temporally structured responses has in turn been proposed to play an important role in a variety of cognitive processes (Gray, 1999; Singer, 1999). However, the precise relationship between this spatiotemporal patterning of neuronal activity and gap-junctional coupling still remains unclear, because no data are available on the topological distribution of gap junctions and their relations to the functional architecture of the cortex.
The physiological correlate of gap junctions is the electrical coupling among neurons. Intracellular recordings from cell pairs have revealed frequent coupling between cortical interneurons, particularly between fast-spiking (FS) cells and between low-threshold spiking cells (Galarreta and Hestrin, 1999, 2001, 2002; Gibson et al., 1999; Beierlein et al., 2000; Venance et al., 2000; Amitai et al., 2002), the former corresponding to PV neurons (Kawaguchi and Kubota, 1993). FS cells have specific physiological properties such as high temporal precision in spike transmission, facilitating EPSPs at excitatory afferents, and fast kinetics in FS–FS mutual inhibitory synapses (Geiger et al., 1997; Galarreta and Hestrin, 2001; Bartos et al., 2002). Because of these properties, the FS–PV neuron network has been proposed to play a special role in the generation and propagation of synchronous population activity within the neocortex. Electrical coupling has been found mainly between neighboring pairs of interneurons, suggesting a rather proximal location of the respective gap junctions (Tamás et al., 2000; Amitai et al., 2002; Gibson et al., 2005). However, previous electron microscopy (EM) studies directly (Kosaka and Hama, 1985) and indirectly (Sloper and Powell, 1978; Fukuda and Kosaka, 2003) demonstrated a more remote location of gap junctions. The goal of the present study was to obtain comprehensive and quantitative data on the topology of gap-junctional coupling among PV-containing interneurons. To this end, we developed a method that permitted us to unequivocally identify gap junctions at the light microscopy level. This allowed us to study the topology of gap junctions along the entire dendritic arbor of PV neurons and to relate the network of gap-junction-coupled neurons to the functional architecture of the cat visual cortex.
Materials and Methods
Animals.
Five adult cats of both sexes raised in the colony at the Max Planck Institute were included in this study. All animal experiments have been performed according to the German Law on the Protection of Animals, the corresponding European Communities Council Directive (86/609/EEC), and the guidelines of the Society for Neuroscience.
Immunocytochemistry.
Under deep anesthesia induced with an intramuscular injection of ketamine hydrochloride (10 mg/kg, Ketanest; Parke-Davis, Courbevoie, France) and xylazine hydrochloride (2.5 mg/kg, Rompun; Bayer, Leverkusen, Germany), animals were perfused through the ascending aorta with PBS followed by 4% paraformaldehyde in 0.1 m phosphate buffer (PB), pH 7.4. Serial coronal or tangential (parallel to the surface of area 18) sections 40–50 μm in thickness were cut with a vibrating microtome (VT1000; Leica, Heidelberg, Germany). After cryoprotection in 30% sucrose in PB, sections put on aluminum foil were rapidly frozen in vapor of liquid N2, rapidly thawed in PB, then processed for double-fluorescent immunohistochemistry as described previously (Fukuda and Kosaka, 2000a, 2003) with slight modifications. Briefly, sections were incubated with mouse anti-PV antibody (1:5000; Swant, Bellinzona, Switzerland) and rabbit anti-connexin36 (Cx36) antibody (1:250; Zymed 36-4600, lot no. 30477005; Invitrogen, Carlsbad, CA) for 7 d at room temperature, with Alexa488-conjugated donkey anti-mouse IgG (Invitrogen) and Rhodamine Red-conjugated donkey anti-rabbit IgG (Jackson ImmunoResearch, West Grove, PA) overnight, mounted in Vectashield (Vector Laboratories, Burlingame, CA), and examined with confocal laser-scanning microscopy (CLSM; TCS SP2; Leica). The long incubation period with primary antibodies was essential to obtain labeling along the entire dendritic tree of PV-positive cells. Some sections were prepared for analyzing the colocalization of PV and calbindin by using rabbit anti-cat PV antibody (1:5000; gift from Dr. Heizmann, University of Zürich, Zürich, Switzerland) and mouse anti-calbindin antibody (1:8000; gift from Dr. Heizmann). These sections were fluorescence labeled as described above. Results were corrected for shrinkage of the tissue by comparison of the size and thickness of several sections before and after immunohistochemical procedures. Shrinkage by fixation was not corrected.
Correlated CLSM-EM.
After CLSM, sections were rinsed in PBS and incubated with mouse peroxidase-antiperoxidase complex (Dako, Fort Collins, CO) overnight. No detergent was included in the incubation medium for EM specimens. Sections were treated with 0.1% glutaraldehyde for 10 min, colored with diaminobenzidine chloride (DAB) and postfixed with 1% OsO4, then stained en bloc with uranyl acetate and mounted in Araldite. Areas previously examined with CLSM were identified by matching the profiles in the PV labeling, photographed, and re-embedded in Araldite. Serial ultrathin sections were collected in Formvar-coated single slot grids, stained with uranyl acetate and lead citrate, and examined in a transmission electron microscope (H-7100; Hitachi, Tokyo, Japan). For the second series of CLSM-EM, primary antibodies were visualized with Alexa488 anti-mouse IgG for PV signal and Alexa Fluor 594 Fluoronanogold-conjugated goat anti-rabbit IgG (Invitrogen) for Cx36 signal. After CLSM, sections were treated with HQ Silver (Nanoprobes, Yaphank, NY) to enhance nanogold signals to be detectable in EM, then PV labeling was visualized by DAB as above.
Cell reconstructions.
CLSM images were taken from layer 2/3 of area 18 in dual-labeled sections by using a high-resolution objective [PL APO ×100; numerical aperture (NA), 1.40; Leica]. Images were acquired as stacked files through the whole section thickness (step size, 0.16 μm) and from neighboring areas to cover the entire dendritic fields of several connected neurons. After transferring CLSM files to a personal computer (Think Centre; IBM Japan, Tokyo, Japan), both dendritic arborization of PV-immunoreactive (IR) neurons and positions of Cx36-IR dendrodendritic contacts along the traced dendrites were reconstructed with a computer-assisted system (Neurolucida confocal module; MicroBrightField, Colchester, VT). Sholl analysis was performed using an attached software (Neuroexplorer; MicroBrightField).
Optical imaging and subsequent histological analysis.
Orientation preference maps of the visual cortex were obtained in two adult cats using optical imaging of intrinsic signals, a technique that has been described in detail previously (Galuske et al., 2002). To this end, animals were anesthetized by intramuscular injection of ketamine (10 mg/kg) and xylazine (1 mg/kg) and maintained after tracheotomy by artificial ventilation with a mixture of N2O (70%), O2 (30%), and halothane (0.8%), and a systemic muscle relaxant (pancuronium, 0.8 mg/h) was administered to prevent eye movements. A round craniotomy with a diameter of 20 mm was performed over the occipital cortex centered on the midline 2 mm anterior to the interaural line. A titanium chamber was fixed with dental acrylic on the skull over the craniotomy. After removal of the dura over the exposed cortical tissue, the recording chamber was filled with silicone oil and closed with a glass plate. The epicortical blood vessel patterns were documented by taking camera frames under illumination with light at 570 nm (green).
Visual stimuli consisted of rectangular gratings (0.15 cycles/°; 15 °/s), which were presented at eight different orientations in steps of 45°, filling the entire screen of a 21 inch monitor at a distance of 57 cm. Stimuli were shown for 3 s while intrinsic signals were detected with a cooled charge-coupled device camera system (ora2001; Optical Imaging, Munich, Germany) under illumination with light of a wavelength of 620 nm (red). During each phase of visual stimulation, five camera frames were obtained, each lasting 600 ms. The different stimuli were presented pseudorandomized within each set and each full set of stimuli was repeated 16–32 times. For additional analysis, all camera frames were added up according to the stimulus orientation and iso-orientation maps were calculated by normalization to the sum of all different stimulation conditions (“cocktail blank”). Subsequently, the resulting iso-orientation maps were combined by pixelwise vectorial addition and visualized as “angle maps” in which the orientation preference of each pixel is indicated by its color (see Fig. 7). Because only an area of ∼4 × 5 mm could be covered in one field of view of the camera system, usually two to three adjacent fields of view were imaged on each hemisphere to cover a larger region of area 18.
Figure 7.
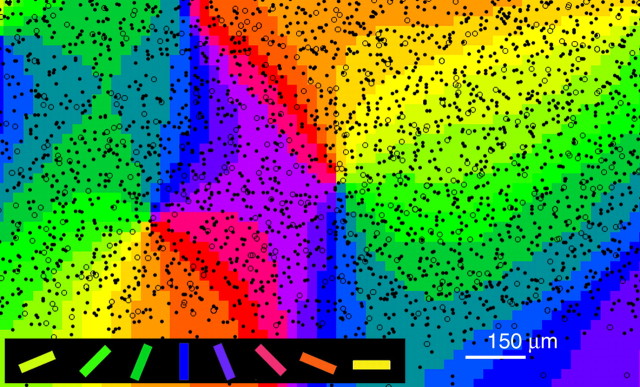
Spatial relationship between an orientation preference map and the two-dimensional distribution of PV neurons in layer 2/3 of area 18. All PV neurons residing in layer 2/3 with large (≥200 μm2; open circles) and small (<200 μm2; closed circles) somata are superimposed on the orientation map.
After the recording, glass electrodes were inserted for 5 min to mark the tissue surrounding the recorded area. Thereafter, animals were perfused as above and serial tangential sections 40 μm in thickness were cut through the recorded area, processed for PV immunohistochemistry using DAB as a chromogen, postfixed with 1% OsO4, and embedded in Araldite. PV neurons were plotted in individual sections by Neurolucida (MicroBrightField). Cells were divided into large-type (L-type) (≥200 mm2) or small-type (S-type) (<200 mm2) according to the cross sectional area of the soma. The very precise matching of serial sections was successfully conducted by using the cut ends of the same capillaries as landmarks in adjacent sections (Kosaka et al., 1985). Cell plots were projected into a single plane to yield a two-dimensional map of PV neurons viewed from the cortical surface. The cell plots were matched with the orientation-preference map using the tracks of electrodes as landmarks and calculating with a custom-made algorithm the best match between the tracks and the positions registered during optical imaging. The most superficial sections containing blood vessels were used in addition for further fine adjustment of the sections with the functional maps. The dendritic morphology of L-type PV neurons was reconstructed with Neurolucida in regions where optical imaging had been performed.
Nearest-neighbor distance analysis.
Distribution patterns of PV neurons were analyzed according to the nearest-neighbor distance method (Diggle, 1983). The mathematical contents of the method are summarized in supplemental Figures 1 and 2 (available at www.jneurosci.org as supplemental material). PV-IR neurons located in rectangles of 400 × 400 μm around an orientation singularity or in the middle of adjacent singularities were sampled and analyzed by using Excel (Microsoft, Tokyo, Japan).
Results
Connexin36 immunohistochemistry
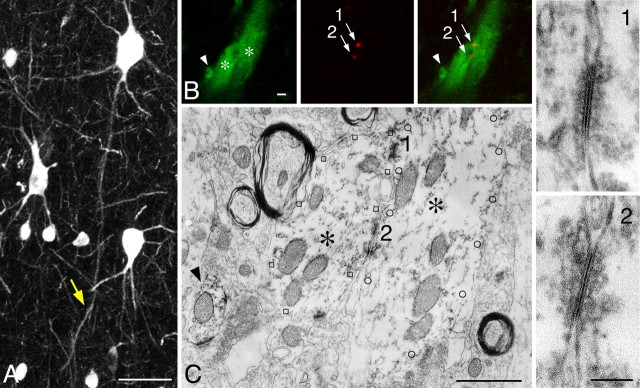
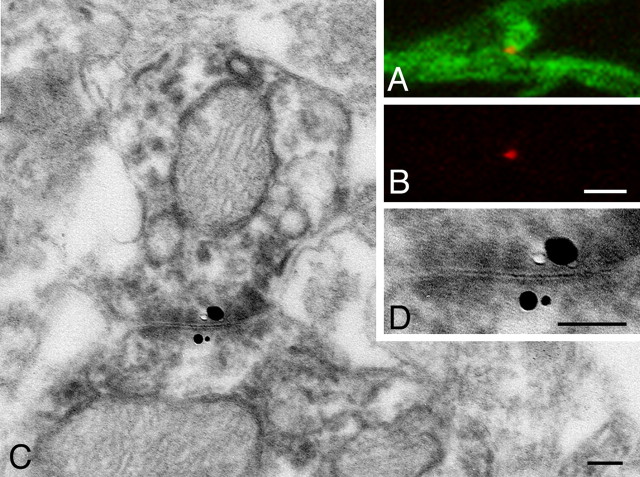
Because neuronal gap junctions in mammalian brains are composed of the specific transmembrane protein Cx36 (Condorelli et al., 1998; Söhl et al., 1998), we investigated the distribution of Cx36-IR structures in the cat visual cortex using immunohistochemical double-labeling techniques for Cx36 and PV (Fig. 1). In CLSM, Cx36-IR elements appeared as punctate structures located at contact sites between PV-IR dendrites (Fig. 1B). After converting fluorescent signals for PV into DAB reaction products, the same contact sites were re-examined by EM. As shown in Figure 1C, these contact sites always exhibited unambiguous ultrastructural features of gap junctions in DAB-labeled specimens, confirming the results of previous studies (Fukuda and Kosaka, 2000a,b, 2003). Coincidence of Cx36-IR puncta with gap junctions was further confirmed in a second approach of correlated CLSM-EM (Fig. 2). Fluorescent labeling for Cx36 was visualized by CLSM using Fluoronanogold-conjugated secondary antibodies in conjunction with silver enhancement of gold particles for visualization in EM. This approach was combined with a different fluorescent label for PV and conversion of the PV-specific fluorescent signals into DAB reaction products. Here too, the Cx36-labeled contact sites identified with CLSM showed the typical ultrastructural features of gap junctions between the PV-IR dendrites, the silver grains being located in close vicinity to the junctional sites. This proved that the Fluoronanogold-labeled Cx36-IR puncta in CLSM reliably identified neuronal gap junctions. All of the 17 Cx36-positive contact sites on which correlated CLSM-EM was performed had the ultrastructural features of gap junctions between PV-IR dendrites. Based on these controls, we conclude that Cx36-IR puncta on PV-IR dendrites identified at the CLSM level reliably indicate sites of gap-junctional coupling.
Correlated CLSM-EM images of Cx36-labeled gap junctions. A, PV-IR neuron in layer 5 of area 18, shown in a projected image from a stack file, gives rise to a descending dendrite that forms a dendrodendritic contact at a distal site (arrow). B, Enlargement of the contact site in A, visualized by dual CLSM for PV (green) and Cx36 (red). Two Cx36-IR punctate structures (1, 2) are located between the contacting dendrites (asterisks). C, Immunoelectron micrograph of the same structures shown in B. The contacting dendrites (asterisks) demarcated by open squares and circles, as well as another neighboring profile (arrowhead), can be identified with DAB labeling for PV. Enlarged views of the contact sites (1, 2) clearly indicate ultrastructural profiles of gap junctions at the positions corresponding to Cx36-IR puncta in B. Scale bars: A, 50 μm; B, C, 1 μm; right panels, 0.1 μm.
Figure 2.
Direct confirmation of Cx36-labeled gap junction in dual labeled CLSM-EM. A, B, A Cx36-IR spot (red) is located at the contact site between PV-IR dendrites (green). C, Electron micrograph of the contact site in A with DAB labeling for PV and silver-enhanced Fluoronanogold labeling for Cx36. D, Enlargement of the contact site showing gap junction and silver grains on both sides. Scale bars: A, B, 1 μm; C, D, 0.1 μm.
In the following analyses, we therefore used Cx36 immunoreactivity to identify gap junctions at the CLSM level. In this application, it was essential to determine whether positions of Cx36-IR puncta precisely matched sites of contact between PV-IR dendrites (supplemental Figs. 3, 4, available at www.jneurosci.org as supplemental material). Confocal images taken through a large NA objective (1.40) are most suitable for this purpose, because CLSM has the advantage to obtain high resolution along the z-axis of the tissue, whereas the objective of high quality secures sufficient resolution along x–y directions. As shown in supplemental Figures 3 and 4 (available at www.jneurosci.org as supplemental material), we always surveyed a series of confocal optical slices to confirm that the brightest Cx36-IR signal corresponded three-dimensionally to the contact site between PV-IR dendrites.
Cx36-IR puncta were occasionally located on the boundary of PV-positive dendrites that did not have a PV-labeled partner in CLSM. The corresponding profile in correlated EM was confirmed to be a gap junction formed between PV-positive and -negative dendrites (data not shown), corroborating our previous ultrastructural observations in rats (Fukuda and Kosaka, 2003). Some Cx36-positive puncta were located away from PV-IR elements. They were assumed to be the labeling of gap junctions between PV-negative, presumptive low-threshold spiking cells or other types of interneurons. For quantitative analysis, we counted the number of Cx36-positive puncta in single-channel confocal images and thereafter determined whether these puncta were associated with PV-IR elements by merging two-channel images. Among 547 puncta, 342 (62.5%) were located between two PV-IR elements, 39 (7.1%) between PV-positive and -negative elements, 159 (29.1%) were not associated with PV-IR elements, and 7 (1.2%) were undetermined because of ambiguities resulting from faint PV signals. Thus, ∼90% of gap junctions on PV neurons were formed with other PV neurons, whereas 10% were made with different neuronal classes.
Estimation of junctional conductances
We previously developed a method to estimate theoretical values of maximum conductance across single gap junctions by measuring the length of gap junctions along apposing membranes in electron micrographs (Fukuda and Kosaka, 2003). In the present data, this length was 0.19 ± 0.08 μm (mean ± SD; n = 17), which corresponds to 140–360 connexons clustering in a hypothetical disc-shaped membrane patch of that diameter. Multiplying this number with the estimated single-channel conductance of 14 pS (Teubner et al., 2000) yields a conductance of 2.0–5.0 nS for the junction, which is comparable with the value found in the rat neocortex (2.1–5.3 nS) (Fukuda and Kosaka, 2003).
Large-type PV neurons
Cx36-specific labeling made it possible to investigate the three-dimensional distribution of gap junctions in the cortical architecture at the light microscopy level. Detailed analysis of the distribution of Cx36-specific labeling also revealed that some PV neurons did not appear to have Cx36-IR puncta on their surfaces. Characteristically, these cells had small somata. We examined Cx36 immunoreactivity in 82 PV-IR neurons and measured cross-sectional areas of their somata. Thirteen cells (15.9%) were devoid of Cx36-IR puncta and all of these neurons had cell bodies smaller than 200 μm2 (Fig. 3A). Because cortical PV neurons do not form a homogeneous population but are composed of at least three different subtypes (basket cells, chandelier cells, multipolar bursting cells) (DeFelipe et al., 1989; Kawaguchi and Kubota, 1997; Blatow et al., 2003), it was necessary to define the populations in which morphometrical analysis was to be performed. A previous study in cat area 18 has revealed that PV neurons that receive synaptic contacts from large basket cells in layer 2/3 have large somata of >200 μm2 [Kisvárday et al. (1993), their Fig. 7C]. It had been concluded that these large PV neurons correspond to the population of basket cells that form mutual inhibitory connections. Multipolar bursting cells, characterized by colocalization of PV and calbindin (CB), are electrically coupled to each other but not to FS cells (Blatow et al., 2003). Although multipolar bursting cells might be included in the present L-type (≥200 μm2), they were assumed to constitute only a small population, because PV/CB double-positive cells amounted to only 9.2% (12 of 130) and 11.2% (33 of 293) of L-type and all PV-IR neurons, respectively (Fig. 3B,C). The same double-positive populations constituted 17.6% (33 of 188) of all CB-IR neurons. Superficial pyramidal cells in rodent neocortex generally show weak immunoreactivity for CB, but this labeling pattern was absent in the cat neocortex. We did not distinguish between the two types of FS cells (basket and chandelier cells) in the present classification of L-type cells because (1) dendritic morphology alone is not sufficient for this distinction, (2) previous studies have shown that chandelier cell somata are small (Somogyi et al., 1982), constituting only a minor fraction of L-type cells, and (3) both basket and chandelier cells belong to the class of FS cells (Kawaguchi and Kubota, 1997). For these reasons, we consider it justified to treat the two populations as components of the same network of gap junction-coupled interneurons. Therefore, we focused our analysis on these large (L-type) PV neurons.
Figure 3.
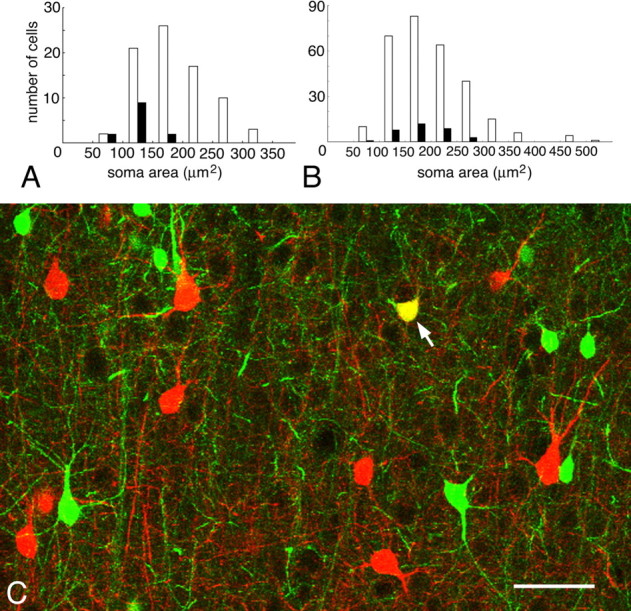
Size distributions of heterogeneous PV neurons in layer 2/3 of cat area 18. A, Cross-sectional areas of somata of Cx36-negative (filled columns) and the entire (open columns) populations of PV neurons. B, Somatic areas of CB/PV double-positive (filled) and the entire population of PV neurons. C, CLSM image, shown in a projected image from a stack file, demonstrates CB (green) and PV (red) immunoreactivity. One small cell (arrow) is double-labeled. Scale bar, 50 μm.
Three-dimensional distribution of gap junctions
CLSM in dual-labeled specimens revealed that dendrites arising from PV-IR somata frequently encountered dendrites of other PV neurons making Cx36-IR contacts at both proximal and distal sites. Figure 4A–C shows an example where a PV-IR soma gave rise to a vertically oriented dendrite spanning the entire thickness of layer 2/3, forming a distal gap junction as far as 380 μm away from the soma (Fig. 4B,C). Both horizontal and oblique dendrites also had gap junctions in proximal as well as distal sites along their courses (Fig. 4D,E). These results are in contrast to previous physiological observations, which suggested a rather proximal location of gap junctions.
Figure 4.
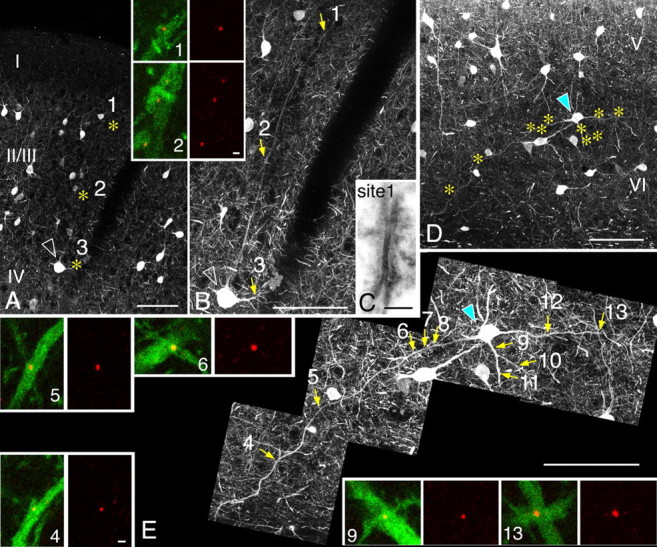
Distal gap junctions. A–C, PV neuron (arrowhead) in the deepest layer 3 (layers are represented as roman numerals) of area 18, shown in a projected image from a stack file, gives rise to an ascending dendrite, along which Cx36-IR puncta (insets, red) are observed at the contact sites (asterisks) between PV-IR dendrites (insets, green). The most distal contact (site 1), located 380 μm away from the soma at the most superficial part of layer 2, shows the ultrastructure of the gap junction in C. Continuity of this ascending dendrite was ascertained in serial ultrathin sections in EM. D, E, PV neuron (cyan arrowhead) in layer 6 of area 18, shown in a projected image from a stack file, has many Cx36-labeled contact sites (asterisks), both proximally (sites 6–12) and distally (sites 4, 5, 13). Part of the contact sites are shown in colors (insets). Scale bars: A, B, D, E, 100 μm; insets, 1 μm; C, 0.1 μm.
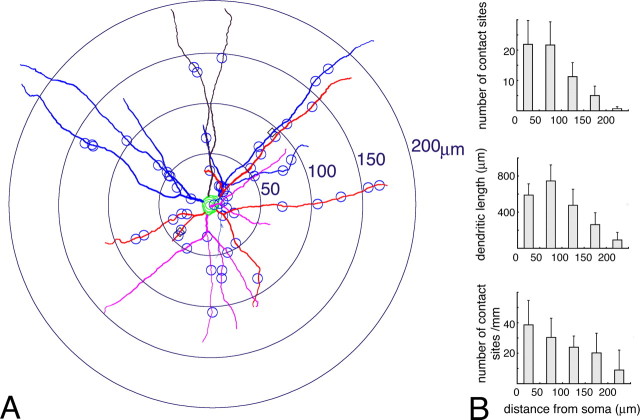
In serial sections double-labeled for PV and Cx36, dendritic trees of single L-type PV neurons were reconstructed using a computer-assisted neuron tracing system that is applicable for CLSM image files (Fig. 5). Sites of Cx36-positive contacts were plotted along dendritic trajectories and linear distances between these contact sites and the somata were analyzed using the Sholl method (Fig. 5A). The total number of Cx36-IR contacts on single L-type PV neurons was 60.3 ± 12.2 (range 47–79; n = 9). Within 50 μm of the soma, L-type neurons had 21.9 ± 7.9 gap junctions, which correspond to 37 ± 15% of the total number in single cells (Fig. 5B, top). Between 50 and 100 μm from the soma, an equal number of gap junctions (21.7 ± 7.6) corresponding to 35 ± 8% of the total was found, and in a segment between 100 and 150 μm, 11.2 ± 4.7 gap junctions (18 ± 7%) were encountered. More distal segments (>150 μm) formed ∼9% of all gap junctions with other PV-neurons. We further compared the density of gap junctions along the unit of dendritic length (1 mm) between each segment (Fig. 5B, bottom). It was found that the occupation density of distal segments from 100 to 200 μm was about one-half of the density at the most proximal segment.
Figure 5.
Single-cell analysis of the distribution of Cx36-IR contact sites. A, Reconstruction of a PV neuron in layer 2/3 of area 18. Small circles along dendrites indicate 59 Cx36-IR contact sites. Shells with different radii (50–200 μm) are used for analyzing the distribution by the Sholl method. B, Comparison of the number of Cx36-IR contact sites (top), dendritic length (middle), and density of contact sites per unit of dendritic length (1 mm; bottom) for 50-μm-wide segments. Data are averaged values from nine cells; error bars indicate SD.
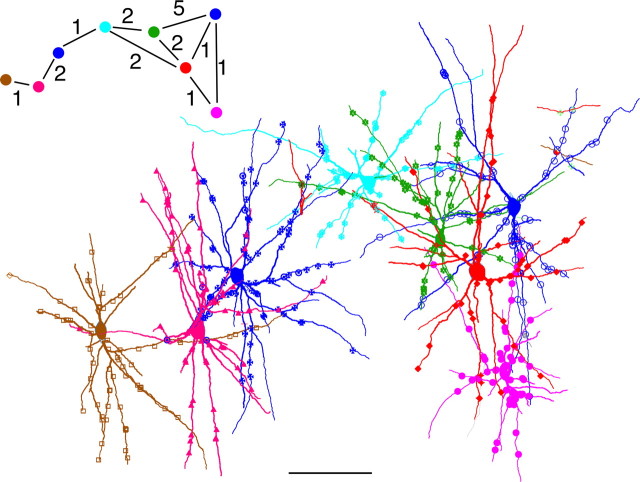
These findings suggest the presence of an extended and dense network of gap junction-coupled interneurons. To further characterize this network, we traced multiple serially interconnected neurons and estimated the lateral spread of the network (Fig. 6). We found that these networks could be traced laterally in a boundless manner by way of multiple Cx36-IR nodes arranged like an endless chain. Different symbols along dendrites shown in Figure 6 indicate Cx36-IR contact sites, all of which had contacting pairs, most of which had not been traced further. If one considers that only a small fraction of gap junction-coupled partners are shown in Figure 6, it becomes evident that the dendritic network is characterized by an exceedingly high degree of interconnectivity.
Figure 6.
Reconstruction of a dendritic network of PV neurons linked by gap junctions in layer 2/3 of area 18. Cells shown are linked to one another through Cx36-IR contact sites, with the interconnectivity and number of mutual contacts depicted in the inset. Different symbols along dendrites indicate contact sites belonging to the traced cells. Note that all of these sites have contacting partners, only a small part of which were traced and included in the graph. Scale bar, 100 μm.
Topological analysis
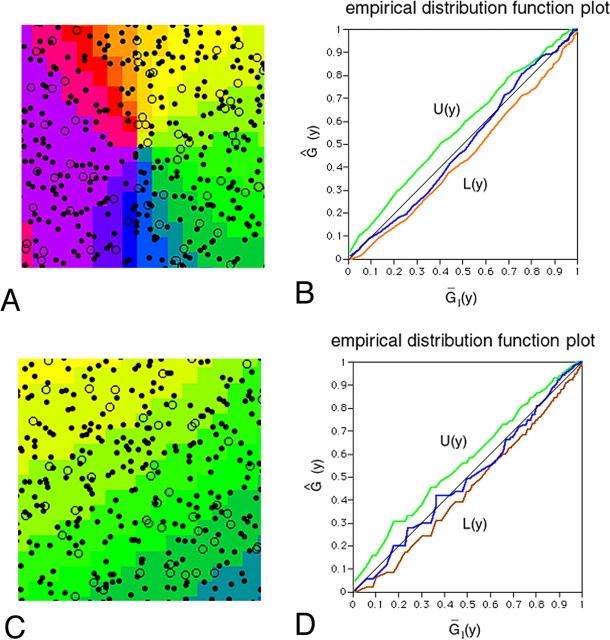
To analyze the relation between gap junction-coupled dendritic fields and the functional columnar architecture of the cortex, we determined the two-dimensional distribution of PV-positive somata and related this pattern to the topology of orientation columns visualized by previous optical imaging of intrinsic signals (Figs. 7, 8). Subsequently, the extent of the dendritic fields of the L-type neurons was related to the functional maps (Fig. 9). Serial tangential sections were cut parallel to the surface of area 18 and immunostained for PV using DAB labeling. All PV neurons residing in layer 2/3 were plotted in individual sections and then projected on a single tangential plane after very precise alignment of neighboring sections (Kosaka et al., 1985). In the projected map, the radial distance of somata from the cortical surface was ignored because cells of similar functional properties are assumed to be arranged in a columnar manner and layer 2/3 PV neurons encountered in different depths were linked both directly (Fig. 4A–C) and indirectly through gap junctions. In total, two series of sections were analyzed from brains on which optical recording of orientation columns had been performed. An additional series of sections was examined from an animal that had not been subject to optical recording. According to a statistical nearest-neighbor analysis (Diggle, 1983), two-dimensional distribution patterns of somata can be classified as clustered, regularly spaced, or random. In all three samples investigated in the present study, the somata of layer 2/3 PV neurons distributed in a completely random manner (Fig. 8). This was true for both the L-type cells as well as for the entire population, regardless of whether the sampled areas were centered on orientation singularities (n = 4) (Fig. 8A,B) or in the middle between adjacent singularities (n = 4) (Fig. 8C,D).
Figure 8.
Random distribution of PV neurons. A, A rectangle centered on an orientation singularity in Figure 7, 400 × 400 μm in size, contains 344 PV neurons including 63 L-type cells. The rank of u1 (see supplemental Fig. 1, available at www.jneurosci.org as supplemental material) among 99 Monte Carlo tests for L-type cells and the entire population is 53 and 22, respectively, both indicating a random distribution pattern. B, The empirical distribution function for observed cells (the entire population) in A (blue line) is within the envelope between U(y) and L(y), also suggesting a random distribution (see supplemental Fig. 2, available at www.jneurosci.org as supplemental material). C, A square located between two singularities in Figure 7, 400 × 400 μm in size, contains 330 PV neurons, including 55 L-type cells. The rank of u1 among 99 Monte Carlo tests for L-type cells and the entire population is 71 and 50, respectively, indicating random distribution. D, The empirical distribution function for observed cells (the entire population) in B (blue line) is within the envelope.
Figure 9.
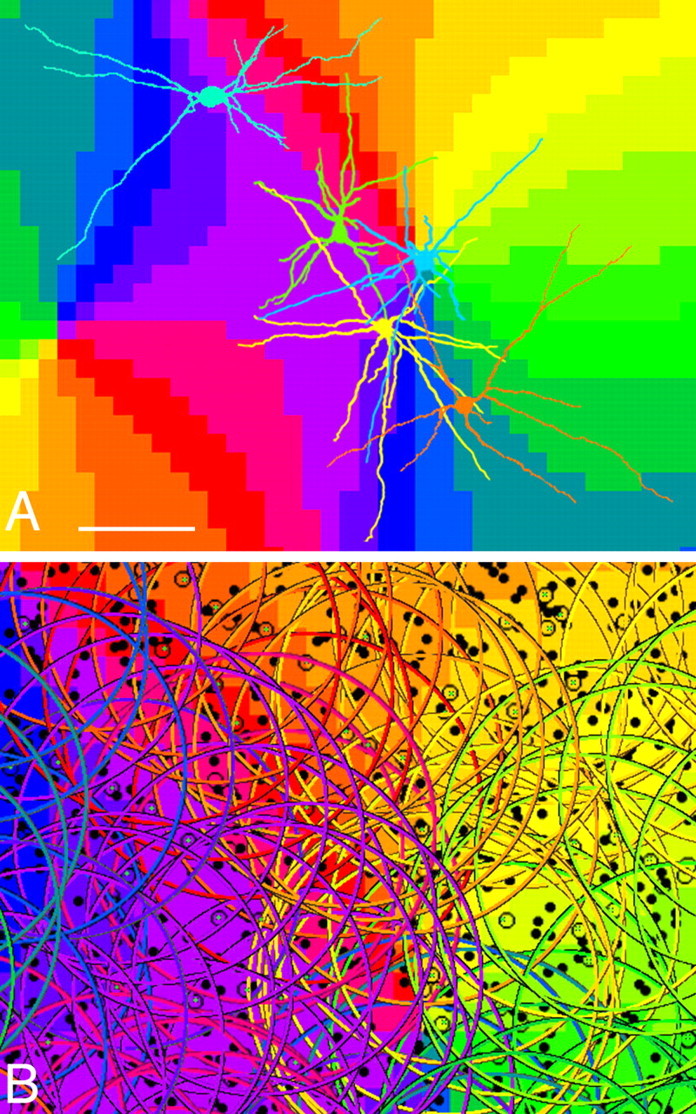
Spatial relationship between an orientation preference map and dendritic fields of L-type PV neurons. A, Dendrites arising from five PV neurons are reconstructed and shown in arbitrary colors. Note the substantial overlap of their large dendritic fields that extend across different orientation columns. Scale bar, 150 μm. B, Circles with radii of 150 μm are centered on L-type PV neurons. Each circle is colored according to the position of the parent soma. Note the dense overlap between the dendritic arbors of neurons located in different orientation compartments.
Our analysis also revealed that L-type PV neurons had large dendritic fields covering different orientation-preference columns (Fig. 9A) and, accordingly, that a particular orientation domain was covered by dendrites originating from somata located in different orientation-preference columns. These spatial relationships suggest that L-type PV neurons sample globally over a wide range of inputs from neurons with differing functional properties. According to our analysis, 397 ± 56 (mean ± SD; n = 3) L-type PV neurons are contained within a cylinder of layer 2/3 with a tangential surface of 1 mm2. Each L-type neuron in that space will have 60 gap junctions in average, both proximally and distally (Figs. 5, 6). On the basis of our single-cell analysis, a substantial number of gap junctions are expected to occur within 150 μm of each soma. When we drew circles with a radius of 150 μm around L-type PV neurons in the map, the high degree of overlap of dendritic fields became apparent (Fig. 9B). Although relationships between positions of gap junctions and orientation-preference maps were not directly studied here, the spatial arrangement in Fig. 9 suggests dense and relatively homogeneous coupling in the gap-junctional network that extends across different columns rather than remaining confined to iso-orientation domains.
Discussion
Unambiguous identification of neuronal gap junctions requires EM analysis of their ultrastructure (Sotelo and Korn, 1978), and previous EM studies have demonstrated the existence of gap junctions in various brain regions (Sotelo and Palay, 1970; Sloper, 1972; Sotelo et al., 1974; Kosaka, 1983; Kita et al., 1990; Fukuda and Kosaka, 2000a, 2003; Rash et al., 2000; Tamás et al., 2000; Kosaka and Kosaka, 2005). However, it has been almost impossible to investigate the three-dimensional distribution of neuronal gap junctions. In this study, the neuron-specific gap-junction marker Cx36 enabled us to identify gap junctions at the CLSM level and allowed a quantitative analysis of the topological distribution of gap junctions along dendritic processes of identified single neurons within large domains of cortical tissue. The specificity of the labeling was ascertained by direct observations of the same structures in correlated CLSM and EM analyses. Specimens were prepared without using glutaraldehyde for initial fixation, but the structural integrity of gap junctions was well preserved, presumably because of the stabilizing function of connexon bridges. Even in cases of rather weak labeling of Cx36-IR spots, the corresponding EM profile confirmed a gap junction at the contact site. On the other hand, for every gap junction found in the EM there was a corresponding Cx36-stained punctum in the confocal images. Therefore, we are confident that the present quantitative analysis estimated the number and distribution of gap junctions with sufficient reliability. However, very small junctions consisting of only a single connexon channel, if present as in retina, might have gone undetected. We could not exclude the possibility that some gap junctions are composed of connexins other than connexin36. In that case, the number of gap junctions might have been underestimated, although data currently available do not support this possibility (Rash et al., 2000).
The results clearly show the occurrence of gap junctions, not only between proximal dendritic sites but also among distal dendritic segments of PV-containing GABAergic neurons. Previous physiological studies have repeatedly emphasized the restriction of electrical coupling to neighboring neurons, suggesting preferential coupling among proximal profiles. This discrepancy is likely to reflect methodological restrictions of physiological approaches. First, preparing tissue slices inevitably severs neuronal processes and limits recordings to a narrow depth range. This is likely to reduce the chance of detecting coupling between distant pairs. Second, because of electrotonic attenuation, coupling among distal dendritic segments is more difficult to detect in somatic recordings. These factors are likely to account for the apparent rarity of electrical coupling between distant pairs. Another confounding factor could be the age of the animals. Except in one study (Galarreta and Hestrin, 2002), electrical coupling has always been examined in slices from 3- to 4-week-old animals. During this stage, the brain is still smaller and neurons are more densely packed than in adulthood. Finally, discrepancies between physiological and anatomical approaches are likely to arise because investigations were performed in different cortical layers, areas, and species. So far, models on the significance of electric coupling were based on measurements in layer 4 of the rat somatosensory cortex (Amitai et al., 2002; Gibson et al., 2005). In this layer, interneurons are particularly compact. Approximately 80–90% of the total dendritic length distributes within 200 μm from the soma (Amitai et al., 2002), as compared with only 38% in layer 5/6 interneurons (Fukuda and Kosaka, 2003).
We estimated the maximum junctional conductance to be between 2.0–5.0 nS, if all connexon channels are open. Similar values have been estimated previously for rat somatosensory cortex (Fukuda and Kosaka, 2003). Physiological measurements of junctional conductance between FS cells gave values of 0.7–2.4 nS for the immature cortex (Galarreta and Hestrin, 1999; Gibson et al., 1999, 2005) and 0.2 nS for the adult cortex (Galarreta and Hestrin, 2002). If one assumes that a given pair of FS cells is coupled on average with 1.8 gap junctions (Fig. 6), the physiological data from the mature cortex suggest a junctional conductance of 0.1 nS. This would imply that only 2–5% of the connexons are actually open simultaneously.
There is accumulating evidence that networks of reciprocally coupled interneurons play a critical role in the generation of oscillatory and synchronous activity in the cerebral cortex. Here, gap junctions are thought to facilitate these coherent activities in conjunction with rhythmic inhibitory synaptic actions impinging on both excitatory and inhibitory neurons (Buzsáki and Chrobak, 1995; Galarreta and Hestrin, 1999, 2001; Gibson et al., 1999; Beierlein et al., 2000; Tamás et al., 2000; Bartos et al., 2002). Data from Cx36 knock-out mice support this notion (Deans et al., 2001; Buhl et al., 2003).
Our data indicate that the network of dendritic gap junctions is boundless and homogeneous across columns with different orientation preferences. This suggests homogeneous coupling with an essentially distance-dependent decrement. Despite weak coupling between individual cell pairs, it is likely that the distributed interactions supported by such a network contribute substantially to the synchronization of neuronal activity. The characteristic property of gap junctions to permit reciprocal exchange of signals with minimal temporal delays is ideally suited to support precise phase locking among oscillatory neuronal populations. This synchronizing effect is likely to be further enhanced by active dendritic responses that occur in vivo when the network is in a high-conductance state (Destexhe et al., 2003). FS cells (Galarreta and Hestrin, 2001), as well as other GABAergic neurons (Martina et al., 2000) can generate active dendritic responses, especially when activated by synchronized volleys of EPSPs. Previous modeling studies have mainly investigated the action of gap junctions close to the soma (Amitai et al., 2002; Gibson et al., 2005). In the light of the present study, these simulations need to be extended to distal dendritic compartments and should consider the combined effects of synchronized excitatory input to peripheral dendrites, active dendritic responses, and electrical coupling.
The topological features of the gap junctional network can be related to certain characteristics of developmental plasticity. Ocular dominance columns in cat visual cortex expand or shrink in response to altered visual experience, and this susceptibility to use-dependent modifications depends on the strength of GABA-mediated inhibition during the critical period (Hensch and Stryker, 2004). Among the various types of cortical interneurons, PV-IR basket cells have been assigned a special role in these plastic processes (Fagiolini et al., 2004). Clustering and segregation of eye-specific afferents depends on the temporal correlation between activity in retinal afferents and cortical target cells (Rauschecker and Singer, 1979). Because the coupled network of PV neurons promotes synchronization of cortical neurons (Galarreta and Hestrin, 2001), the homogeneously coupled network of randomly distributed PV neurons is ideally suited to provide the framework for the temporal matching and selection process that leads to the formation of functionally homogeneous domains.
The present finding of homogeneous gap junction coupling across the boundaries of columns with different orientation preferences permits two predictions on the synchronization behavior of distributed neuronal populations, provided that gap-junction coupling contributes to the synchronization among coupled interneurons and that the coordinated firing of interneurons synchronizes in turn the spiking activity of pyramidal cells. First, synchronization should be observable between neurons with differing orientation preference and, second, the strength and precision of synchrony should, in general, decrease smoothly with the distance between the analyzed neurons. Both predictions are in line with experimental data (Gray et al., 1989; Das and Gilbert, 1999). The exception from this general rule, the high synchronization probability between neurons with preferences for similar, especially colinear orientations, is most likely because of the anisotropies of the excitatory horizontal connections (T'so et al., 1986; Gilbert and Wiesel, 1989; Bosking et al., 1997, Schmidt et al., 1997), which have been shown to be instrumental for the synchronization of neuronal populations over larger distances (Engel et al., 1991; Fries et al., 2001). Finally, the broad orientation spectrum of lateral inhibitory connections (Kisvárday et al., 1997) could also provide the basis for coherent activities across different columns.
In layer 2/3, neighboring cells can be tuned in various combinations to a variety of different stimulus features (orientation, direction of movement, polarity of contrast, spatial frequency), which appears as a superposition of different functional maps (Hübener et al., 1997). These functionally heterogeneous domains are overlaid by the homogeneously coupled net of PV-containing inhibitory interneurons whose spacing and dendritic coverage assures bias-free sampling of activity across different columns. If electrical coupling serves synchronization, this topological arrangement could assure synchronization of activity across different functional domains, and if synchronization promotes joint processing (Singer, 1999) it could support binding of different features into distributed representations of visual objects. However, it is also conceivable that electrical coupling serves other functions such as spatial smoothing of activity distributions or averaging of activity for purposes of gain control.
Footnotes
This work was supported by fellowships from the Alexander von Humboldt Foundation and Max Planck Geselschaft and by grants from the Japanese Ministry of Education, Science, and Culture to T.F. We thank M. Stephan for developing a custom algorithm and W. Hofer, P. Janson, and S. Noda for expert technical assistance.
References
- Amitai Y, Gibson JR, Beierlein M, Patrick SL, Ho AM, Connors BW (2002). The spatial dimensions of electrically coupled networks of interneurons in the neocortex. J Neurosci 22:4142–4152. [DOI] [PMC free article] [PubMed] [Google Scholar]
- Bartos LM, Vida I, Frotscher M, Meyer A, Monyer H, Geiger JRP, Jonas P (2002). Fast synaptic inhibition promotes synchronized gamma oscillations in hippocampal interneuron networks. Proc Natl Acad Sci USA 99:13222–13227. [DOI] [PMC free article] [PubMed] [Google Scholar]
- Beierlein M, Gibson JR, Connors BW (2000). A network of electrically coupled interneurons drives synchronized inhibition in neocortex. Nat Neurosci 3:904–910. [DOI] [PubMed] [Google Scholar]
- Blatow M, Rozov A, Katona I, Hormuzdi SG, Meyer AH, Whittington MA, Caputi A, Monyer H (2003). A novel network of multipolar bursting interneurons generates theta frequency oscillations in neocortex. Neuron 38:805–817. [DOI] [PubMed] [Google Scholar]
- Bosking WH, Zhang Y, Schofield B, Fitzpatrick D (1997). Orientation selectivity and the arrangement of horizontal connections in tree shrew striate cortex. J Neurosci 17:2112–2127. [DOI] [PMC free article] [PubMed] [Google Scholar]
- Buhl DL, Harris KD, Hormuzdi SG, Monyer H, Buzsáki G (2003). Selective impairment of hippocampal gamma oscillations in connexin-36 knock-out mouse in vivo. J Neurosci 23:1013–1018. [DOI] [PMC free article] [PubMed] [Google Scholar]
- Buzsáki G, Chrobak JJ (1995). Temporal structure in spatially organized neuronal ensembles: a role for interneuronal networks. Curr Opin Neurobiol 5:504–510. [DOI] [PubMed] [Google Scholar]
- Cobb SR, Buhl EH, Halasy K, Paulsen O, Somogyi P (1995). Synchronization of neuronal activity in hippocampus by individual GABAergic interneurons. Nature 378:75–78. [DOI] [PubMed] [Google Scholar]
- Condorelli DF, Parenti R, Spinella F, Salinaro AT, Belluardo N, Cardile V, Cicirata F (1998). Cloning of a new gap junction gene (CX36) highly expressed in mammalian brain neurons. Eur J Neurosci 10:1202–1208. [DOI] [PubMed] [Google Scholar]
- Das A, Gilbert CD (1999). Topography of contextual modulations mediated by short-range interactions in primary visual cortex. Nature 399:655–661. [DOI] [PubMed] [Google Scholar]
- Deans MR, Gibson JR, Sellitto C, Connors BW, Paul DL (2001). Synchronous activity of inhibitory networks requires electrical synapses containing connexin36. Neuron 31:477–485. [DOI] [PubMed] [Google Scholar]
- DeFelipe J, Hendry SHC, Jones EG (1989). Visualization of chandelier cell axons by parvalbumin immunoreactivity in monkey cerebral cortex. Proc Natl Acad Sci USA 86:2093–2097. [DOI] [PMC free article] [PubMed] [Google Scholar]
- Destexhe A, Rudolph M, Pare D (2003). The high-conductance state of neocortical neurons in vivo. Nat Rev Neurosci 4:739–751. [DOI] [PubMed] [Google Scholar]
- Diggle PJ (1983). In: Statistical analysis of spatial point patterns London: Academic.
- Engel AK, König P, Kreiter AK, Singer W (1991). Interhemispheric synchronization of oscillatory neuronal responses in cat visual cortex. Science 252:1177–1179. [DOI] [PubMed] [Google Scholar]
- Fagiolini M, Fritschy J-M, Löw K, Möhler H, Rudolph U, Hensch T (2004). Specific GABAA circuits for visual cortical plasticity. Science 303:1681–1683. [DOI] [PubMed] [Google Scholar]
- Fries P, Neuenschwander S, Engel AK, Goebel R, Singer W (2001). Rapid feature selective neuronal synchronization through correlated latency shifting. Nature Neurosci 4:194–200. [DOI] [PubMed] [Google Scholar]
- Fukuda T, Kosaka T (2000a). Gap junctions linking the dendritic network of GABAergic interneurons in the hippocampus. J Neurosci 20:1519–1528. [DOI] [PMC free article] [PubMed] [Google Scholar]
- Fukuda T, Kosaka T (2000b). The dual network of GABAergic interneurons linked by both chemical and electrical synapses: a possible infrastructure of the cerebral cortex. Neurosci Res 38:123–130. [DOI] [PubMed] [Google Scholar]
- Fukuda T, Kosaka T (2003). Ultrastructural study of gap junctions between dendrites of parvalbumin-containing GABAergic neurons in various neocortical areas of the adult rat. Neuroscience 120:5–20. [DOI] [PubMed] [Google Scholar]
- Fukuda T, Aika Y, Heizmann CW, Kosaka T (1996). Dense GABAergic input on somata of parvalbumin-immunoreactive neurons in the hippocampus of the mouse. Neurosci Res 26:181–194. [DOI] [PubMed] [Google Scholar]
- Galarreta M, Hestrin S (1999). A network of fast-spiking cells in the neocortex connected by electrical synapses. Nature 402:72–75. [DOI] [PubMed] [Google Scholar]
- Galarreta M, Hestrin S (2001). Spike transmission and synchrony detection in networks of GABAergic interneurons. Science 292:2295–2299. [DOI] [PubMed] [Google Scholar]
- Galarreta M, Hestrin S (2002). Electrical and chemical synapses among parvalbumin fast-spiking GABAergic interneurons in adult mouse neocortex. Proc Natl Acad Sci USA 99:12438–12443. [DOI] [PMC free article] [PubMed] [Google Scholar]
- Galuske RAW, Schmidt KE, Goebel R, Lomber SG, Payne BR (2002). The role of feedback in shaping neural representations in visual cortex. Proc Natl Acad Sci USA 99:17083–17088. [DOI] [PMC free article] [PubMed] [Google Scholar]
- Geiger JRP, Lübke J, Roth A, Frotscher M, Jonas P (1997). Submillisecond AMPA receptor-mediated signaling at a principal neuron-interneuron synapse. Neuron 18:1009–1023. [DOI] [PubMed] [Google Scholar]
- Gibson JR, Beierlein M, Connors BW (1999). Two networks of electrically coupled inhibitory neurons in neocortex. Nature 402:75–79. [DOI] [PubMed] [Google Scholar]
- Gibson JR, Beierlein M, Connors BW (2005). Functional properties of electrical synapses between inhibitory interneurons of neocortical layer 4. J Neurophysiol 93:467–480. [DOI] [PubMed] [Google Scholar]
- Gilbert CD, Wiesel TN (1989). Columnar specificity of intrinsic horizontal and corticocortical connections in cat visual cortex. J Neurosci 9:2432–2442. [DOI] [PMC free article] [PubMed] [Google Scholar]
- Gray CM (1999). The temporal correlation hypothesis of visual feature integration: still alive and well. Neuron 24:31–47. [DOI] [PubMed] [Google Scholar]
- Gray CM, König P, Engel AK, Singer W (1989). Oscillatory responses in cat visual cortex exhibit inter-columnar synchronization which reflects global stimulus properties. Nature 338:334–337. [DOI] [PubMed] [Google Scholar]
- Hensch TK, Stryker MP (2004). Columnar architecture sculpted by GABA circuits in developing cat visual cortex. Science 303:1678–1681. [DOI] [PMC free article] [PubMed] [Google Scholar]
- Hübener M, Shoham D, Grinvald A, Bonhoeffer T (1997). Spatial relationships among three columnar systems in cat area 17. J Neurosci 17:9270–9284. [DOI] [PMC free article] [PubMed] [Google Scholar]
- Katsumaru H, Kosaka T, Heizmann CW, Hama K (1988). Gap junctions on GABAergic neurons containing the calcium-binding protein parvalbumin in the rat hippocampus (CA1 region). Exp Brain Res 72:363–370. [DOI] [PubMed] [Google Scholar]
- Kawaguchi Y, Kubota Y (1993). Correlation of physiological subgroupings of nonpyramidal cells with parvalbumin- and calbindinD28k-immunoreactive neurons in layer V of rat frontal cortex. J Neurophysiol 70:387–396. [DOI] [PubMed] [Google Scholar]
- Kawaguchi Y, Kubota Y (1997). GABAergic cell subtypes and their synaptic connections in rat frontal cortex. Cereb Cortex 7:476–486. [DOI] [PubMed] [Google Scholar]
- Kisvárday ZF, Beaulieu C, Eysel UT (1993). Network of GABAergic large basket cells in cat visual cortex (area 18): implication for lateral disinhibition. J Comp Neurol 327:398–415. [DOI] [PubMed] [Google Scholar]
- Kisvárday ZF, Tóth É, Rausch M, Eysel UT (1997). Orientation-specific relationship between populations of excitatory and inhibitory lateral connections in the visual cortex of the cat. Cereb Cortex 7:605–618. [DOI] [PubMed] [Google Scholar]
- Kita H, Kosaka T, Heizmann CW (1990). Parvalbumin-immunoreactive neurons in the rat neostriatum: a light and electron microscopic study. Brain Res 536:1–15. [DOI] [PubMed] [Google Scholar]
- Kosaka T (1983). Gap junctions between non-pyramidal cell dendrites in the rat hippocampus (CA1 and CA3 regions). Brain Res 271:157–161. [DOI] [PubMed] [Google Scholar]
- Kosaka T, Hama K (1985). Gap junctions between non-pyramidal cell dendrites in the rat hippocampus (CA1 and CA3 regions): a combined Golgi-electron microscopy study. J Comp Neurol 231:150–161. [DOI] [PubMed] [Google Scholar]
- Kosaka T, Kosaka K (2005). Intraglomerular dendritic link connected by gap junctions and chemical synapses in the mouse main olfactory bulb: electron microscopic serial section analysis. Neuroscience 131:611–625. [DOI] [PubMed] [Google Scholar]
- Kosaka T, Kosaka K, Tateishi K, Hamaoka Y, Yanaihara N, Wu J-Y, Hama K (1985). GABAergic neurons containing CCK-8-like and/or VIP-like immunoreactivities in the rat hippocampus and dentate gyrus. J Comp Neurol 239:420–430. [DOI] [PubMed] [Google Scholar]
- Martina M, Vida I, Jonas P (2000). Distal initiation and active propagation of action potentials in interneuron dendrites. Science 287:295–300. [DOI] [PubMed] [Google Scholar]
- Rash JE, Staines WA, Yasumura T, Patel D, Furman CS, Stelmack GL, Nagy JI (2000). Immunogold evidence that neuronal gap junctions in adult brain and spinal cord contain connexin-36 but not connexin-32 or connexin-43. Proc Natl Acad Sci USA 97:7573–7587. [DOI] [PMC free article] [PubMed] [Google Scholar]
- Rauschecker J, Singer W (1979). Changes in the circuitry of the kitten visual cortex are gated by postsynaptic activity. Nature 280:58–60. [DOI] [PubMed] [Google Scholar]
- Schmidt KE, Goebel R, Löwel S, Singer W (1997). The perceptual criterion of colinearity is reflected by anisotropies of connections in the primary visual cortex. Eur J Neurosci 9:1083–1089. [DOI] [PubMed] [Google Scholar]
- Sik A, Penttonen M, Ylinen A, Buzsáki G (1995). Hippocampal CA1 interneurons: an intracellular labeling study. J Neurosci 15:6651–6665. [DOI] [PMC free article] [PubMed] [Google Scholar]
- Singer W (1999). Neuronal synchrony: a versatile code for the definition of relations? Neuron 24:49–65. [DOI] [PubMed] [Google Scholar]
- Sloper JJ (1972). Gap junctions between dendrites in the primate neocortex. Brain Res 44:641–646. [DOI] [PubMed] [Google Scholar]
- Sloper JJ, Powell TPS (1978). Gap junctions between dendrites and somata of neurons in the primate sensori-motor cortex. Proc R Soc Lond B Biol Sci 203:39–47. [DOI] [PubMed] [Google Scholar]
- Söhl G, Degen J, Teubner B, Willecke K (1998). The murine gap junction gene connexin36 is highly expressed in mouse retina and regulated during brain development. FEBS Lett 428:27–31. [DOI] [PubMed] [Google Scholar]
- Somogyi P, Freund TF, Cowey A (1982). The axo-axonic interneuron in the cerebral cortex of the rat, cat and monkey. Neuroscience 7:2577–2607. [DOI] [PubMed] [Google Scholar]
- Sotelo C, Korn H (1978). Morphological correlates of electrical and other interactions through low-resistance pathways between neurons of the vertebrate central nervous system. Int Rev Cytol 55:67–107. [DOI] [PubMed] [Google Scholar]
- Sotelo C, Palay SL (1970). The fine structure of the lateral vestibular nucleus in the rat. II. Synaptic organization. Brain Res 18:93–115. [DOI] [PubMed] [Google Scholar]
- Sotelo C, Llinas R, Baker R (1974). Structural study of inferior olivary nucleus of the cat: morphological correlates of electron coupling. J Neurophysiol 37:541–559. [DOI] [PubMed] [Google Scholar]
- Tamás G, Buhl EH, Lorincz A, Somogyi P (2000). Proximally targeted GABAergic synapses and gap junctions synchronize cortical interneurons. Nat Neurosci 3:366–371. [DOI] [PubMed] [Google Scholar]
- Teubner B, Degen J, Söhl G, Güldenagel M, Bukauskas FF, Trexler EB, Verselis VK, De Zeeuw CI, Lee CG, Kozak CA, Petrasch-Parwez E, Dermietzel R, Willecke K (2000). Functional expression of the murine connexin 36 gene coding for a neuron-specific gap junction protein. J Membr Biol 176:249–262. [DOI] [PMC free article] [PubMed] [Google Scholar]
- Traub RD, Jefferys JGR, Whittington MA (1997). Simulation of gamma rhythms in networks of interneurons and pyramidal cells. J Comput Neurosci 4:141–150. [DOI] [PubMed] [Google Scholar]
- Traub RD, Bibbig A, LeBeau FEN, Buhl EH, Whittington MA (2004). Cellular mechanisms of neuronal population oscillations in the hippocampus in vitro. Annu Rev Neurosci 27:247–278. [DOI] [PubMed] [Google Scholar]
- T'so, Gilbert CD, Wiesel TN (1986). Relationships between horizontal interactions and functional architecture in cat striate cortex as revealed by cross-correlated analysis. J Neurosci 6:1160–1170. [DOI] [PMC free article] [PubMed] [Google Scholar]
- Venance L, Rozov A, Blatow M, Burnashev N, Feldmeyer D, Monyer H (2000). Connexin expression in electrically coupled postnatal rat brain neurons. Proc Natl Acad Sci USA 97:10260–10265. [DOI] [PMC free article] [PubMed] [Google Scholar]


