

Abstract
Magnetoencephalographic (MEG) studies have revealed enhancement of neural activity of the N1m response of auditory evoked fields in long-term trained musicians, reflecting neuroplastic modification of the representation of the auditory cortex. In contrast, the amplitude of the P2 response of auditory evoked potentials is modified by musical experience, with no alteration of N1. Here, we performed a comprehensive MEG study using stimulation of successive musical-instrument tones to examine how the neural activities of different MEG responses are modified in long-term experienced musicians who commenced musical lessons at ages of ∼5 years and had continued to practice. The dipole moment of the P2m response occurring at 160–180 ms was significantly enlarged in musicians compared with that in individuals who had not received musical lessons. The enlargement was found for the dipole moment of N1m occurring at 100–120 ms in a restricted condition but not for the moment of P1m at 50–60 ms. Furthermore, the dipole moment of P2m for successive stimuli, normalized by the moment for the first stimulus, was significantly larger for chord tones than single tones and was significantly larger in the musicians than controls. These results suggest that the P2m response is susceptible to be modified by musical training in a period of neural maturation, with a short refractory period of neural activity for the auditory input of composite tones. The P2m activity may be specialized to the processing of multifrequency sounds, such as musical timbre consisting of abundant harmonics.
Keywords: auditory cortex, evoked responses, magnetoencephalography, plasticity, refractory effect, localization
Introduction
Long-term musical training modulates representation of the human auditory cortex, which is reflected in auditory evoked potentials (AEP) and evoked fields of magnetoencephalography. Pantev et al. (1998) revealed that the cortical N1m activity of the MEG response is larger for piano tones than for pure tones in skilled musicians, whereas no difference exists in nonmusicians. Enhancement of N1m activity in musicians is specific to the tone of the instrument they practiced (Pantev et al., 2001). Modification of N1m activity can also be induced after intensive discrimination training of acoustic stimuli and listening to manipulated musical sounds (Pantev et al., 1999; Menning et al. 2000). Those studies on modification of the N1m response did not report change in the subsequent response of P2m. In contrast, recent AEP studies have shown enlarged P2 responses in musicians without appreciable alteration of N1, compared with those in nonmusicians (Shahin et al., 2003). A radial component of N1c, which is not detected by magnetoencephalography, is enlarged in musicians. The P2 response is also enhanced in adults after discrimination training of acoustic and speech sounds (Tremblay et al., 2001; Atienza et al., 2002; Bosnyak et al., 2004). Thus, questions arise on whether P2m (i.e., the magnetic counterpart of P2), is enhanced in musicians and, if so, how the N1m and P2m activities are related to each other.
Long-latency neural responses, such as N1/N1m and P2/P2m, are generally reduced in amplitude when identical stimulus is repeatedly presented. Results of AEP studies indicate that a P2 peak of appreciable magnitude persists in the responses to a sequence of chords of piano tones, whereas the N1 peak is greatly reduced in amplitude (Janata, 1995; Koelsch et al., 2000). This robustness of P2 activity against repetition of musical tones suggests its specific selectivity to sounds having rich frequency components. Neural activities of P2m and P2 have common sources in the superior temporal plane (Godey et al., 2001). However, little is known about the functional role of P2m activity in the processing of auditory inputs. The location of the P2m source in the auditory cortex is not well established. Given the possibility of modification of the neural response by musical experience and robustness against repetitive stimuli, stimulation using successive musical-instrument tones may highlight the activity of P2m responses.
In this paper, we present the results of a comprehensive study on the MEG responses of P1m, N1m, and P2m, using stimuli of successive piano tones to investigate how these responses are modified by long-term musical experience and whether or not P2m exhibits a distinct response to a sequence of piano tones, especially piano tones in chord, compared with N1m. We expect specificity of P2m activity to the richness of frequency components of the stimulus sounds. We performed the localization of the sources of different MEG responses in the auditory cortex in individual magnetic resonance (MR) images. Results of a pilot study on P2m response using chord stimuli have been presented previously (Kanda et al., 2004).
Materials and Methods
Twenty male subjects participated in the experiment. They were university students and all right-handed with Edinburgh Handedness Inventory scores of >85%. Ten subjects (mean age ± SD of 21.5 ± 1.7 years) had started music lessons at the age of 4.6 ± 1.1 years, eight subjects having practiced the piano for 8.7 ± 4.1 years and two subjects having practiced the electronic organ for 8.5 ± 0.7 years. After the lessons, they all had training in various musical instruments for 5.8 ± 2.3 years and were continuing the training at the time of MEG recording. This subject group is hereafter referred to as the experienced (EP) group. The other 10 subjects (mean age of 23.7 ± 0.8 years) had not received lessons or training in musical instruments except for music courses in elementary and junior high schools. This group is referred to as the nonexperienced (NE) group. All of the subjects gave informed consent in writing for participation in the study after receiving a thorough explanation of MEG recording. The experiment in this study was approved by the Ethics Committee of the School of Medicine of Hokkaido University.
Auditory stimuli of piano tones and chords were generated with a software synthesizer [Yamaha (Hamamatsu, Japan) YXG-50 V3.0], and their timing and order were controlled by a program. The tones comprised 19 notes from A3 to D#5, and the chords comprised 12 major triads having root notes from A3 to G#4. Thus, the pitches of the 19 tones covered all of the pitches included in the notes of the 12 chords. Five identical tones/chords of 625 ms in length were connected in series and served as a 3125-ms-long stimulus. An example of the score and the sound intensity signals of serial tones and chords are shown in Figure 1a. Figure 1b illustrates the frequency spectrum of a major chord (C4-E4-G4), which comprises pitch frequencies and higher harmonics. The tone and chord sequences of 19 pitches and 12 chords, respectively, were mixed in a random order with interstimulus intervals of 1000–1050 ms. Oddball stimuli were also prepared by replacing the first, third, or fifth tone/chord with one having deviated in pitch by five semitones from the original notes. Such oddballs were mixed with the standard stimuli to ∼10% probability. The stimuli were delivered binaurally to subjects with magnetic-free ear pieces and tubes. The intensities of the stimuli were 67–68 dB SPL (sound-pressure level) for tones and 68–70 dB SPL for chords. The slight difference in the intensities was caused by a technicality of the software used to generate the sounds.
Figure 1.
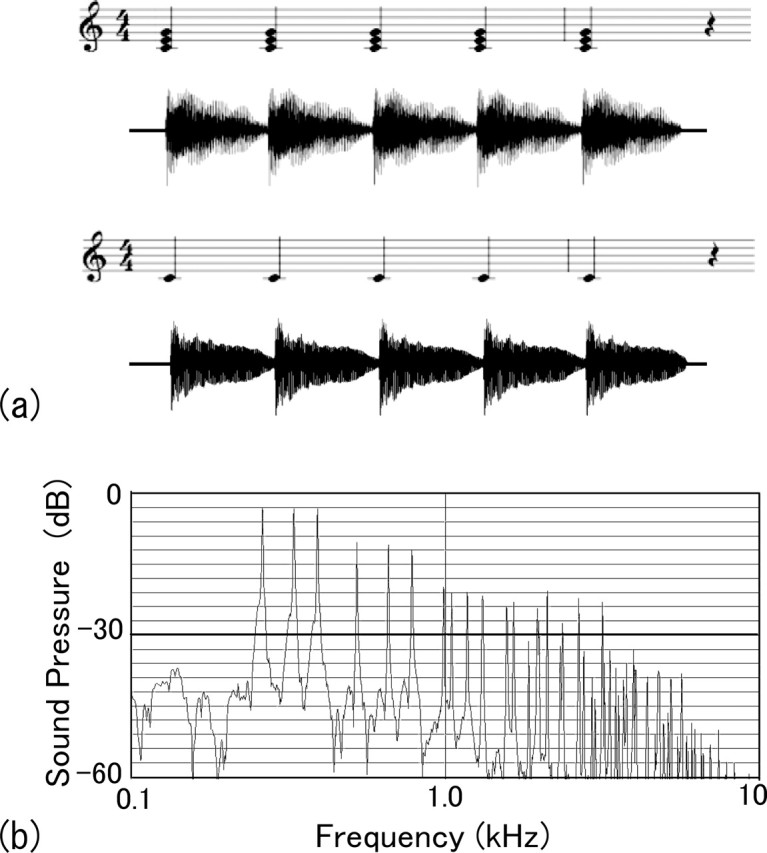
a, An example of score and sound intensity signals of serial chords (top) and tones (bottom) and frequency spectrum of a major chord (C4-E4-G4) (b), which comprises pitch frequencies and higher harmonics.
MEG measurements were made using a whole-head superconducting quantum interference device magnetometer [Neuromag system (Helsinki, Finland) Vectorview] that detects a radial component of the magnetic field over the skull at 102 locations, covering the whole head, and yields 204-channel gradient signals (ΔBz/Δx, ΔBz/Δ) in two orthogonal directions on the surface over the skull. Recordings were conducted for tones and chords in separate sessions. The subjects were instructed to count the number of oddballs during the recording, which was interrupted every 10 min, and the subjects reported the number of the oddballs they counted. A single session lasted for ∼30 min. The recorded MEG responses were averaged for >300 tone/chord sequences of different pitches, and the mean of the signal in a 500 ms period before the first tone/chord served as the baseline. Responses to oddball sequences and those exceeding 4 pT in amplitude were excluded from the averaging. Resulting MEG responses were bandpass-filtered to 1–20 Hz.
To represent the waveform of P1m, N1m, and P2m responses, we selected 26 adjacent channels (13 sensing locations) centered over the auditory cortex showing large P2m responses in each hemisphere (see Fig. 2). This was based on the observations that the P2m response was most stably observed among the three response components for tone/chord sequences and that ∼13-location signals showing a dipolar field distribution represented major responses when their magnitudes were examined in the largest-to-smallest order. Those MEG data were root mean-squared (RMS) to yield the RMS amplitude of the magnetic field B [i.e., BRMS = (ΣBn2/26)1/2].
Figure 2.

Superposed responses of 26 selected channels elicited by a sequence of five chords in the right hemisphere of one EP subject. Arrow maps indicate the strength of the field and the direction perpendicular to the field-gradient, which implies the direction of current sources.
The amplitudes of MEG responses are strongly influenced by the distance of sensors to the skull in the magnetoencephalography system, and variations of the head position across subjects may introduce intersubject variations of the response amplitude. Dipole moments directly reflect neural activity and are expected to be quantitative measures of P1m, N1m, and P2m components. We obtained the dipole moment based on the signal space and projection method (Hämäläinen, 1995) in which MEG fields were projected on the dipole fields that were given by single dipoles of P1m, N1m, and P2m. Thus, a common signal subspace is assumed to represent both the signals measured by an array of detectors and the underlying brain sources (Tesche et al., 1995). The dipole fields were calculated for the configuration of detectors and the subject’s head using the grand mean location and direction of the equivalent current dipole (ECD), where the ECDs of each response component were localized by the procedure described later using 60-channel MEG fields. Then, a time series of the dipole moment Q(t) was obtained from the equation Q(t) = Q0Bm(t)B0T/B0 B0T, where Q0 is the moment of the grand mean ECD, and Bm(t) and B0 are the vectors (transposed they are BmT and B0T) composed of the subset of measured and dipole fields, respectively. The amplitudes of P1m, N1m, and P2m components were determined as the peak values of Q(t). To test the statistical significance of the peak latency and the projected moment, repeated-measures ANOVA was performed. When post hoc Scheffé’s test was conducted, a value of p < 0.05 was considered to be significant.
MEG data were divided into the right and left hemispheres, and ECDs were localized as the neural source of MEG response for the peak components of P1m, N1m, and P2m. Test localizations of ECDs using 26-, 40-, 60-, and 108-channel data in a single hemisphere were conducted, and the 60-channel localization was accepted as the procedure yielding stable results with high goodness-of-fit (G-value) and low confidence volume (CV). ECDs having >80% (mostly 90%) G-value and <2000 (mostly 1000) mm3 CV were selected among the calculated ECDs. Three-dimensional locations of the ECDs were obtained in MEG coordinates, which had been determined using the landmarks on the skull at the nasion and the right and left preauricular points. The x-, y-and z-axes were defined along medial–lateral, anterior–posterior, and superior–inferior directions, respectively. To determine anatomical locations of those ECDs, Heschl’s gyrus (HG) was first identified in axial and coronal MR images of each subject. The center of the medial two-thirds area of HG in the axial image was marked as a reference point, representing the primary auditory cortex (PAC) (Hackett et al., 2001; Rademacher et al., 2001; Wallance et al., 2002). Then, MEG coordinates of ECDs were transformed to coordinates with respect to the PAC and averaged across subjects.
Results
Amplitude and latency of MEG responses
Figure 2 shows an example of MEG responses of 26 selected channels elicited by a sequence of five chords. The latency is given as the time elapsed from the onset of the first stimulus, where vertical lines indicate the onset times of the five stimuli. Clear peaks of P1m, N1m, and P2m were observed in the responses to the first stimulus at latencies of ∼63, 110, and 190 ms, respectively. The three peak components were reduced in amplitude for the second to fifth stimuli in sequence, in different manners depending on the peak components. Arrow maps on the top indicate the strength and perpendicular direction of the field-gradient, where the selected channels are highlighted. The distribution of arrows indicates dipolar fields, which may arise from dipole sources. Figure 3 shows grand-mean MEG responses in the left and right hemispheres for different stimulus conditions of chord (a) and tone (b). These responses were obtained from the RMS fields of selected channels, as functions of the latency of sequential stimuli, and by averaging them over subjects. Waveforms of the responses in different conditions in Figure 3 exhibit a common feature of the smallest P1m and largest N1m peaks for the first stimulus, but the P2m peaks were larger than the N1m peaks for some conditions for the second to fifth stimuli. The heights of P1m, N1m, and P2m peaks in the second to fifth stimuli responses seem to be constant, independently of the stimulus order.
Figure 3.

Grand mean responses of the RMS amplitude of 26 selected channels in two hemispheres for different stimulus conditions of chord (a) and tone (b). Results obtained in EP (gray line) and NE (black line) groups are compared. Divisions of the time axis indicate onset times of the first to fifth sequential stimuli.
The latencies and amplitudes of P1m, N1m, and P2m peaks were obtained in the RMS field of each subject. Four-way ANOVA and post hoc Scheffé’s tests were conducted for the peak latencies with the factors of stimulus (STM: chord, tone), group (GRP: EP, NE), hemisphere (HS: left, right) and stimulus order (ORD: first to fifth). A main effect of group was found for N1m (F(1, 18) = 21.8; p < 0.0002), indicating that the EP group had shorter latency than that of the NE group. The stimulus had a common effect of shorter latency for tone than chord for P1m, N1m, and P2m. This effect was found in the right hemisphere for P1m (STM×HS: F(1,18) = 4.85; p < 0.043) and P2m (F(1, 18) = 6.33; p < 0.022) and in the first, second, fourth, and fifth stimulus orders for N1m (STM×ORD: F(4, 72) = 5.39; p < 0.0007). Table 1 summarizes the grand mean and SE of the peak latency of P1m, N1m, and P2m responses elicited by the first stimulus. The above main effect of group in N1m and the effect of stimulus with some interactions can be seen in P1m, N1m, and P2m.
Table 1.
Grand mean (and SE) of the peak latency (in ms) of P1m, N1m, and P2m responses elicited by the first stimulus
| GRP–STM | P1m |
N1m |
P2m |
|||
|---|---|---|---|---|---|---|
| Right hemisphere | ||||||
| NE–chord | 59.3 | (2.8) | 111.4 | (1.9) | 202.1 | (6.5) |
| NE–tone | 53.6 | (2.6) | 103.2 | (1.9) | 185.8 | (2.7) |
| EP–chord | 58.7 | (2.9) | 103.6 | (2.0) | 195.8 | (5.4) |
| EP–tone | 51.2 | (2.7) | 96.9 | (1.3) | 182.8 | (5.4) |
| Left hemisphere | ||||||
| NE–chord | 65.3 | (3.7) | 122.1 | (2.9) | 205.1 | (10.5) |
| NE–tone | 58.9 | (2.9) | 105.8 | (3.7) | 195.8 | (4.9) |
| EP–chord | 60.6 | (2.1) | 104.2 | (1.8) | 194.5 | (7.5) |
| EP–tone | 54.9 | (1.4) | 98.6 | (1.0) | 185.1 | (6.5) |
Results are shown separately for the right and left hemispheres, divided by the conditions of group (GRP; EP/NE) and stimulus (STM; chord/tone).
Dipole moments
As can be seen in Figure 3 and was found by ANOVA on the peak amplitude of RMS fields, responses to the first stimulus were larger than those to the second to fifth stimuli (F(1,18) = 47.9 for P1m, 103 for N1m, and 42.7 for P2m; p < 0.0001). Furthermore, there were no amplitude differences among the responses to the second to fifth stimuli. We therefore averaged the data of the projected dipole moments across the second to fifth stimuli responses. Figure 4 shows the grand mean amplitudes across subjects of the projected dipole moment for the first stimulus response and the average of the second to fifth stimuli responses. The results are compared for different conditions of group and stimulus. The dipole moments of N1m and P2m components showed similar variations by the conditions of group and stimulus, whereas the behavior of the P1m component was distinct. We conducted three-way ANOVA and Scheffé’s post hoc tests on the projected moments with the factors of group, stimulus, and hemisphere. Table 2 summarizes significant differences of P1m, N1m, and P2m moments found between NE and EP groups and between chord and tone stimuli. When the difference was found with a condition of hemisphere and/or stimulus, that condition is indicated in square brackets. The source of statistical test indicates the factor of main effect or the factors of interaction analyzed by ANOVA. In the first stimulus response, the main effects of group and its interactions indicated that the moment of P1m was larger in the NE group than in the EP group in the left hemisphere and that the moment was larger in the EP group than in the NE group for P2m and for N1m in a condition of tone stimulus and left hemisphere. The main effects of the stimulus and its interactions indicated that the P1m moment was larger for chord than tone and that the moment was larger for tone than chord in the left hemisphere for P2m and in the left hemisphere of the EP group and right hemisphere of the NE group for N1m.
Figure 4.
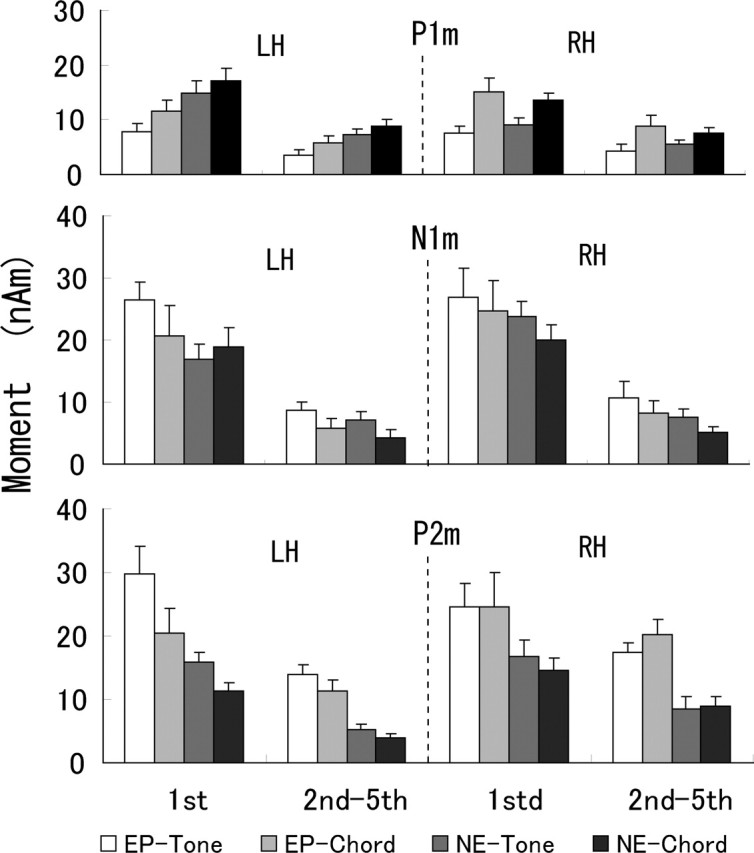
Grand mean amplitudes of dipole moments of P1m, N1m, and P2m components. Results are shown for the first-stimulus response and the average of the second to fifth stimuli responses in different conditions of group and stimulus. Error bars indicate SE.
Table 2.
Summarized results of ANOVA on the projected moments of P1m, N1m, and P2m responses
| P1m | N1m | P2m | |
|---|---|---|---|
| First stimulus response | |||
| Difference | NE > EP [LH] | EP > NE [TN/LH] | EP > NE |
| (F(1,18); p) | (5.42; <0.04) | (11.0; <0.004) | (5.72; <0.03) |
| Source | GRP×HS | GRP×STM×HS | GRP |
| Difference | CD > TN | TN > CDa | TN > CD [LH] |
| (F(1,18); p) | (50.0; <0.0001) | (5.34; <0.04) | (21.0; <0.0002) |
| Source | STM | STM | STM×HS |
| Second to fifth stimuli responses | |||
| Difference | EP ∼ NE | EP ∼ NE | EP > NE |
| (F(1,18); p) | (1.32; ns) | (1.28; ns) | (28.9; <0.0001) |
| Source | GRP | GRP | GRP |
| Difference | CD > TN | TN > CD | TN > CD [LH], CD > TN [RH] |
| (F(1,18); p) | (22.2; <0002) | (46.1; <0.0001) | (32.5; <0.0001) |
| Source | STM | STM | STM ×HS |
Significant differences found between NE and EP groups and between chord (CD) and tone (TN) stimuli are shown with F- and p-values. When the difference was found in a condition of hemisphere and/or stimulus, that condition is indicated in square brackets. The source of statistical test is indicated by the factor(s) of group (GRP), STM, and HS investigated in ANOVA. LH, Left hemisphere; RH, right hemisphere; ns, not significant.
aIn conditions of LH/EP and RH/NE, where an interaction of GRP×STM×HS was also present.
The main effect of group in the second to fifth stimuli responses was only significant for P2m, indicating that the EP group had larger moments than did the NE group. Effects of stimulus were different among P1m, N1m, and P2m components, indicating that P1m and N1m moments were larger for chord and tone, respectively, whereas P2m moment was larger for chord and tone in the right and left hemispheres, respectively. Summarizing the findings of the effects of group on dipole moment by ANOVA, the EP group had enlarged moments of P2m from those in the NE group both in the first stimulus and second to fifth stimuli responses, whereas the N1m moment was enlarged in the EP group with restricted condition of stimulus and hemisphere. The P1m moment was not enlarged in the EP group from the NE group.
To evaluate how the responses to second to fifth stimuli are reduced in magnitude from the first stimulus response, the average of the moments of the second to fifth stimuli responses was normalized by the moment of the first stimulus response. The results, summarized in Figure 5, implied distinct change in the normalized moment of P2m by the factors of group and stimulus. Statistical tests of three-way ANOVA and post hoc Scheffé’s test revealed main effects of group, stimuli, and hemisphere on P2m, indicating that the normalized moments were larger in the EP group than in the NE group (F(1,18) = 5.02; p < 0.04), larger for chord than tone (F(1,18) = 4.72; p < 0.05), and larger in the right hemisphere than in the left hemisphere (F(1,18) = 6.25; p < 0.03). Main effects of stimulus and hemisphere found in N1m indicated that the normalized moments were larger for tone than chord (F(1,18) = 4.83; p < 0.05) and larger in the left than right hemisphere (F(1,18) = 4.50; p < 0.05). There were no main effects and interactions in P1m.
Figure 5.

Grand mean of normalized dipole moments for P1m, N1m, and P2m components in different conditions, where the dipole moments of second to fifth stimuli responses normalized to the moment of the first stimulus response were averaged across stimuli and subjects. Error bars indicate SE.
Locations of ECDs
The locations of ECDs were obtained as x (medial–lateral), y (anterior–posterior), and z (superior–inferior) coordinates for the P1m, N1m, and P2m peak components of the first stimulus response in five to eight subjects in each combination of conditions of group, stimulus, and hemisphere. The coordinates of ECDs were further obtained for the P2m of the second to fifth stimuli responses in the EP group, which had relatively high amplitude. Those coordinates were averaged across stimulus orders in each subject. The mean locations of ECDs across subjects of different peaks were confined to a small volume of ∼10 mm lengths in x, y, and z coordinates, although intersubject variations existed. Figure 6, a and b, shows the grand mean ECD locations plotted on an x–y (axial) plane separately for EP and NE groups. The origin of x = y = 0 is the center of the PAC in HG, which was determined in individual MR images. The ECDs for the chord and tone stimuli were very close to each other, regardless of the peak components. P2m and N1m ECDs seemed to be located at anterior and lateral sites, respectively.
Figure 6.
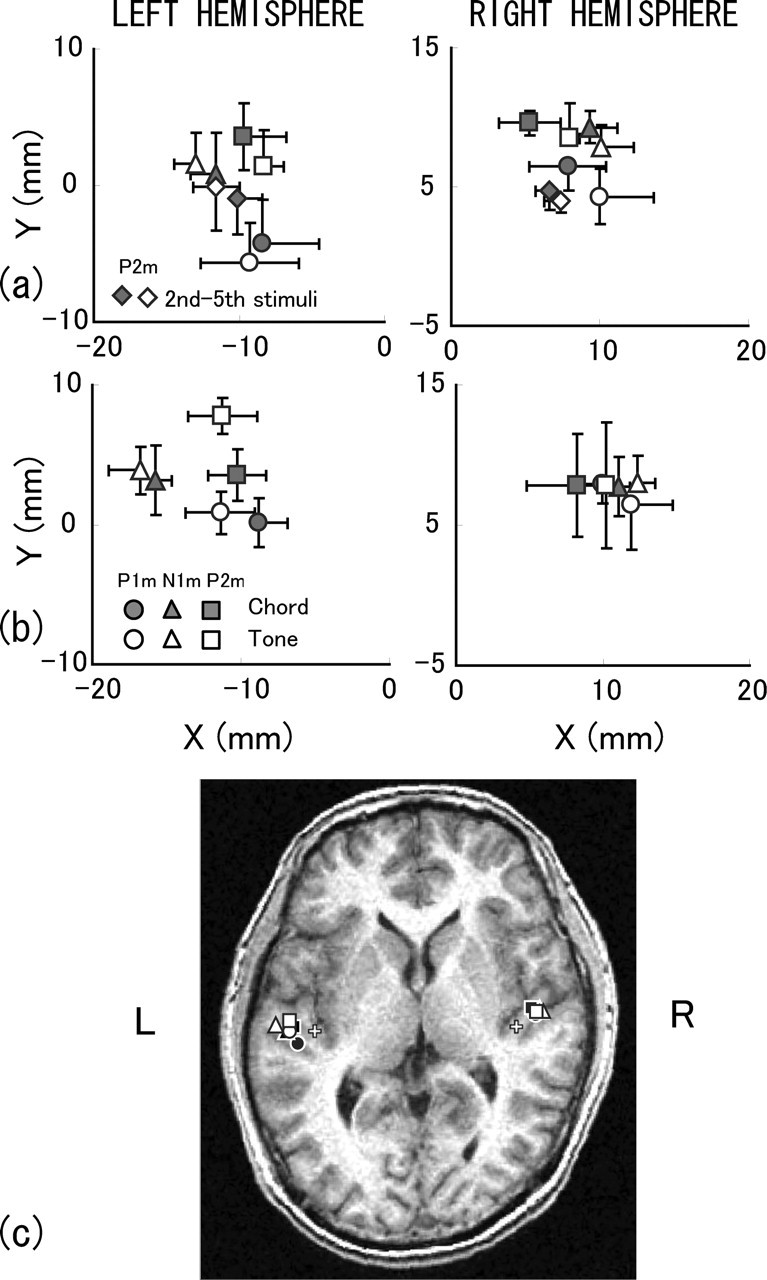
Grand mean location of ECDs of the first-stimulus response obtained in the EP (a) and NE (b) groups. ECDs of the second to fifth stimuli responses are also shown for the P2m component in the EP group. Error bars indicate the range of SEs, which are omitted in some cases for clarity. The x- and y-axes are along the medial–lateral and anterior–superior directions, respectively. c, Grand mean location of ECDs superposed on an axial MR image of one subject. White crosses indicate the center of PAC at a medial portion of HG, which served as a reference point of anatomical structure.
Figure 6c shows the grand mean location of ECDs superposed on an axial MR image of one subject with a reference of the PAC in HG, the skull size of the subject being intermediate among the subjects. All of the ECDs were found within or near the border of HG. P2m and P1m ECDs were located around the anterior and posterior borders, respectively. N1m ECDs were lateral to P1m and P2m ECDs.
We averaged the coordinates of the chord and tone ECDs and conducted a t test (two-tailed) to examine any difference in the x, y, or z values among P1m, N1m, and P2m components. Table 3 summarizes the results of the t test, revealing significant (p < 0.05) and marginal (p < 0.10) differences. Consistent difference was found in x and y coordinates across conditions of group and hemisphere, indicating that the N1m ECDs had larger x coordinates than did P1m ECDs (N1m > P1m) or P2m ECDs (N1m > P2m). This means that the ECD of N1m response was located lateral to the ECD of P1m or P2m response. The observed separation between the ECDs was 4.5–7.2 mm. Another difference indicated that the P2m ECDs had larger y coordinates than did the P1m ECDs (P2m > P1m) or N1m ECDs (P2m > N1m), which means that the ECD of P2m response was located anterior to the ECD of P1m or N1m response. The observed separation between the ECDs was 2.7–5.6 mm. The bottom row of Table 3 shows the results for the second to fifth stimuli responses of P2m in the EP group. There was a marginal difference in the y coordinates of the P2m ECDs between the first stimulus response and the second to fifth stimuli responses, indicating that the ECDs for the second to fifth stimuli were posterior to the ECDs for the first stimulus. The separation between them was 4.6 mm.
Table 3.
Summarized results of the t test (two-tailed) of the coordinates of ECDs that revealed significant (p < 0.05, underlined) and marginal (p < 0.1) differences among P1m, N1m, and P2m responses in different conditions.
| Difference | Condition | t(n); p |
|---|---|---|
| x (N1m > P1m) | EP–LH | 3.51(5);0.017 |
| x (N1m > P1m) | NE–LH | 5.70(7);0.0007 |
| x (N1m > P2m) | EP–LH | 2.04(7);0.08 |
| x (N1m > P2m) | EP–RH | 5.63(6);0.0013 |
| x (N1m > P2m) | NE–LH | 2.12(8);0.067 |
| y (P2m > P1m) | EP–LH | 4.03(4);0.016 |
| y (P2m > P1m) | NE–LH | 3.08(6);0.022 |
| y (P2m > N1m) | NE–LH | 2.20(8);0.059 |
| y (1st > 2nd–5th) | EP–RH | 2.22(7);0.062 |
Statistical results of t(n)- and p values are also shown, where n is the freedom.
Discussion
Reorganization of auditory cortical neurons after acoustic training in animals is represented by augmented sensitivity, expanded presentation area, shift of tuning frequencies and contrast-enhanced stimulus dependence (Recanzone et al., 1993; Edeline and Weinberger 1993; Weinberger, 1993; Blake et al., 2002; Beitel et al., 2003). Such neural plasticity may be supported by synaptic remodeling and/or axonal sprouting (Darian-Smith and Gilbert, 1994; Buonomano and Merzenich, 1998; Edeline, 1999). Middle-to-long latency AEP components are known to reflect the maturation of the central auditory system in humans (Kraus et al., 1993; Ponton et al. 2000) through axonal growth in the layers of the auditory cortex (Moore and Guan, 2001; Eggermont and Ponton 2003). The magnitude of N1 and P2 responses of AEP in humans becomes maximal at 10–12 years and continues to grow well into adolescence (Ponton et al., 2000). The magnetic response of N1m matures at 10–15 years, whereas P2m is visible at 11–15 years and its maturation is slower (Paetau et al., 1995). The EP subjects in this study had commenced music lessons at the mean age of 4.6 ± 1.1 years and continued to practice until the MEG recordings at 21.5 ± 1.7 years. Given the reorganization of auditory neurons by training in animals and the slow development of long-latency responses in humans, modification of magnetic responses of N1m and especially P2m, which has slower maturation in the long-term trained EP subjects, can be expected.
The augmentation of P2m response in the EP group was clear when defined by the increment of the dipole moment in the EP group from that in the NE group, ranging from 50 to 90% and 100 to 170% for the first stimulus response and second to fifth stimuli responses, respectively (Fig. 4). This observation of modification of P2m amplitude is in agreement with the results of a previous AEP study showing an enhancement of the P2 component in skilled musicians having long-term practice of instruments (Shahin et al., 2003). The amplitude of P2 is also enhanced after auditory training in nonmusicians (Tremblay et al., 2001; Atienza et al., 2002; Bosnyak et al., 2004) and after cochlear implantation in patients (Purdy et al., 2001). Thus, we conclude that the cortical activity underlying P2m is amenable to be modulated by long-term musical experience. There might be additional effects of environmental and genotype influences (Monaghan et al., 1998) on the modulation of P2m because familial conditions of EP and NE subjects were not controlled. Early commencement of music lessons of the EP subjects might be accompanied by abundant exposure to music in their environment, or the EP subjects might have genetic influence on brain structures (Thompson et al., 2001). Overall, the findings in this study suggest that extensive musical training modifies auditory cortical activity, resulting in enhancement of P2m response in musicians.
The increment of the dipole moment of N1m in the EP group from that in the NE group amounted to 10–50% in the response to the first stimulus. The enlargement was stable across conditions (Fig. 4) although statistically significant in the left hemisphere for piano tone and not chord stimulus. Such an observation of N1m of the first stimulus response qualitatively agrees with results of previous MEG studies showing enlargement of the N1m moment in skilled musicians (Pantev et al., 1998) and timbre specificity in musicians (Pantev et al., 2001), and N1m enhancement in nonmusicians after extensive discrimination training (Menning et al., 2000). However, those studies did not show whether the P2m response was enlarged or not. Clear observation of the modification of P2m response in the present study may be related to the stimuli of piano tones/chords of rich frequency components and their sequential stimulation.
The dipole moment of P1m was not enlarged in the EP group, in clear contrast to N1m and P2m. The AEP response of P1 appears to be reduced by acoustic training in adults (Bosnyak et al., 2004). The peak of P1 response is discernible at the ages of 3–4 years (Pang and Taylor, 2000) and well developed at 7–11 years compared with N1 and P2 peaks (Kraus et al., 1993). The observation of no modification of P1m in musically experienced subjects in this study is compatible with the fast development of P1, if the activity of P1/P1m is saturated at early ages. A recent MR imaging and MEG study on pitch perception has indicated larger P1m moment in professional musicians than that in nonmusicians (Schneider et al., 2005). This change in P1m with musical experience differs from the observation in this study. The reason of the difference is not clear but might be related to the stimulation rate of sounds or the task during MEG recording.
The auditory stimuli used in the previous AEP studies concerning the P2 response include tone complexes, modulated tones, and instrument tones. An appreciable wave of magnetic P2m response is elicited, adjacent to the largest N1m peak, by vowel and consonant–vowel speech sounds (Kuriki et al., 1995) and by piano tones in melody (Kuriki et al., 2004). These stimuli used in the previous studies may be characterized by multiple frequencies in composite sounds, higher harmonics in musical tones, and formant structure in speech sounds, suggesting that the spectral complexity of stimulus sounds may be critical for the activation of P2/P2m responses. Such behaviors of P2m responses are in contrast to the activities of N1/N1m responses, which have high sensitivity to a narrow-band frequency spectrum (Liégeois-Chauvel et al., 2001; Soeta et al., 2005).
Repetition of identical stimuli reduces the amplitude of evoked responses by physiological refractoriness. Characteristics of N1-P2 responses to tone sequences are consistent with the refractory effect, which shows a rapid decrease of the response and stable amplitude in the first few stimuli (Ritter et al., 1968; Budd et al., 1998). We performed a straightforward simulation of the refractory effects on populational neurons, assuming that they are repeatedly stimulated, recovered in an exponential manner of 1- exp(−t/τ), with a fixed recovery period (τ), and reactivated after recovery. The results showed that the number of newly activated neurons, after the highest activation by the first stimulus, was constant from the second stimulus at a reduced proportion. This is exactly in agreement with the observation of P1m, N1m, and P2m peaks in the response to sequential stimuli (Fig. 3), in which the amplitude of second to fifth stimuli responses did not depend on the stimulus order.
Given that the magnitude of the second to fifth stimuli responses is determined by the recovery or refractory period, the relative response of the second to fifth stimuli to that of the first stimulus is expected to be smaller for responses of longer latency. This expectation was verified by the normalized moments of P1m and N1m (Fig. 5), but the normalized moment of P2m was larger than that of N1m, being larger for chord than tone. These results, showing weak suppression of P2m response, can be explained by the notion that P2m activity is specialized to the processing of multifrequency sounds to have short refractory periods, whereas N1m activity is tuned to a narrow frequency band. The enhancement of P2m activity from tone to chord parallels the results of a recent EEG/MEG study on the effect of spectral complexity of sounds on P2/P2m amplitude (Shahin et al., 2005). Finally, the enhanced normalized moment of P2m in the EP group from that in the NE group suggests that the refractory period of P2m activity may be shortened by intensive musical training, which may subserve stable activity of auditory cortical neurons for concurrent inputs of musical sounds.
A single dipole localized from the MEG response represents the center of activated populational neurons that may have a certain extent in the cortical surface. The relative locations of P1m, N1m, and P2m ECDs obtained in this study are compatible with the results of previous AEP and MEG studies showing P1/P1m sources within or close to the PAC (Liégeois-Chauvel et al., 1991, 1994; Huotilainen et al., 1998; Godey et al., 2001; Yvert et al., 2001), anteriority of the P2m source to that of N1m (Hari et al., 1987; Lütkenhöner and Steinstrater, 1998; Papanicolaou et al., 1990), the site of the P2m source anterior to HG (Godey et al., 2001), and the N1m source at the lateral part of HG (Liégeois-Chauvel et al., 1991, 1994; Godey et al., 2001). These anterior and lateral regions of HG may correspond to the belt fields in macaques, which are connected to the PAC and have strong connections between subfields (Kaas and Hackett, 1998; Hackett et al., 2001). Such abundant lateral connections and their synaptic changes may be the basis of the plastic modifications of P2m activity by musical training. The close connectivity also suggests involvement of P2m activity in not only spectral processing but temporal processing, because the auditory area including the PAC subserves frequency and pitch analysis (Pantev et al., 1995; Langner et al., 1997; Griffiths et al., 1998) and exhibits neuroplastic modulation of tonal and pitch representations (Recanzone et al., 1993; Kilgard and Merzenich, 1998). Taking into account the fact that piano tones and their chords have temporal periodicities in waveform, the sensitivity of P2m response to multifrequency sounds might result from temporal processing. It remains to be elucidated which aspect is related to the functional significance of P2m activity.
We thank Keisuke Ohta and Sachiko Koyama for their help and discussion about ECD localization. We are also indebted to Ryosuke Takamatsu for assistance with data analysis.
References
- Atienza M, Cantero JL, Dominguez-Marin E (2002). The time course of neural changes underlying auditory perceptual learning. Learn Mem 9:138–150. [DOI] [PMC free article] [PubMed] [Google Scholar]
- Beitel RE, Schreiner CE, Cheung SW, Wang X, Merzenich MM (2003). Reward-dependent plasticity in the primary auditory cortex of adult monkeys trained to discriminate temporally modulated signals. Proc Natl Acad Sci USA 100:11070–11075. [DOI] [PMC free article] [PubMed] [Google Scholar]
- Blake DT, Strata F, Churchland AK, Merzenich MM (2002). Neural correlates of instrumental learning in primary auditory cortex. Proc Natl Acad Sci USA 99:10114–10119. [DOI] [PMC free article] [PubMed] [Google Scholar]
- Bosnyak DJ, Eaton RA, Roberts LE (2004). Distributed auditory cortical representations are modified when non-musicians are trained at pitch discrimination with 40 Hz amplitude modulated tones. Cereb Cortex 14:1088–1099. [DOI] [PubMed] [Google Scholar]
- Budd TW, Barry RJ, Gordon E, Rennie C, Michie PT (1998). Decrement of the N1 auditory event-related potential with stimulus repetition: habituation vs. refractoriness. Int J Psychophysiol 31:51–68. [DOI] [PubMed] [Google Scholar]
- Buonomano DV, Merzenich MM (1998). Cortical plasticity: from synapses to maps. Annu Rev Neurosci 21:149–186. [DOI] [PubMed] [Google Scholar]
- Darian-Smith C, Gilbert CD (1994). Axonal sprouting accompanies functional reorganization in adult cat striate cortex. Nature 368:737–740. [DOI] [PubMed] [Google Scholar]
- Edeline JM (1999). Learning-induced physiological plasticity in the thalamo-cortical sensory systems: a critical evaluation of receptive field plasticity, map changes and their potential mechanisms. Prog Neurobiol 57:165–224. [DOI] [PubMed] [Google Scholar]
- Edeline JM, Weinberger NM (1993). Receptive field plasticity in the auditory cortex during frequency discrimination training: selective retuning independent of task difficulty. Behav Neurosci 107:82–103. [DOI] [PubMed] [Google Scholar]
- Eggermont JJ, Ponton CW (2003). Auditory-evoked potential studies of cortical maturation in normal hearing and implanted children: correlations with changes in structure and speech perception. Acta Otolaryngol 123:249–252. [DOI] [PubMed] [Google Scholar]
- Godey B, Schwartz D, de Graaf JB, Chauvel P, Liegeois-Chauvel C (2001). Neuromagnetic source localization of auditory evoked fields and intracerebral evoked potentials: a comparison of data in the same patients. Clin Neurophysiol 112:1850–1859. [DOI] [PubMed] [Google Scholar]
- Griffiths TD, Büchel C, Frackowiak RSJ, Patterson RD (1998). Analysis of temporal structure in sound by the human brain. Nat Neurosci 1:422–427. [DOI] [PubMed] [Google Scholar]
- Hackett TA, Preuss TM, Kaas JH (2001). Architechtonic identification of the core region in auditory cortex of macaques, chimpanzees, and humans. J Comp Neurol 441:197–222. [DOI] [PubMed] [Google Scholar]
- Hämäläinen MS (1995). Functional localization based on measurements with a whole-head magnetometer system. Brain Topogr 7:283–289. [DOI] [PubMed] [Google Scholar]
- Hari R, Pelizzone M, Makela JP, Hallstrom J, Leinonen L, Lounasmaa OV (1987). Neuromagnetic responses of the human auditory cortex to on- and offsets of noise bursts. Audiology 26:31–43. [DOI] [PubMed] [Google Scholar]
- Huotilainen M, Winkler I, Alho K, Escera C, Virtanen J, Ilmoniemi RJ, Jaaskelainen IP, Pekkonen E, Naatanen R (1998). Combined mapping of human auditory EEG and MEG responses. Electroencephalogr Clin Neurophysiol 108:370–379. [DOI] [PubMed] [Google Scholar]
- Janata P (1995). ERP measures assay the degree of expectancy violation on harmonic context in music. J Cogn Neurosci 7:153–164. [DOI] [PubMed] [Google Scholar]
- Kaas JH, Hackett TA (1998). Subdivisions of auditory cortex and levels of processing in primates. Audiol Neurootol 3:73–85. [DOI] [PubMed] [Google Scholar]
- Kanda S, Hirata Y, Kuriki S (2004). Enhanced P2m response to musical tones in musicians. Proceedings of the 14th International Conference on BiomagnetismBoston pp. 509–510.
- Kilgard MP, Merzenich MM (1998). Plasticity of temporal information processing in the primary auditory cortex. Nat Neurosci 1:727–731. [DOI] [PMC free article] [PubMed] [Google Scholar]
- Koelsch S, Gunter T, Friederici AD, Schroger E (2000). Brain indices of music processing: “nonmusicians” are musical. J Cogn Neurosci 12:520–541. [DOI] [PubMed] [Google Scholar]
- Kraus N, McGee T, Carrell T, Sharma A, Micco A, Nicol T (1993). Speech-evoked cortical potentials in children. J Am Acad Audiol 4:238–248. [PubMed] [Google Scholar]
- Kuriki S, Okita Y, Hirata Y (1995). Source analysis of magnetic field responses from the human auditory cortex by short speech sounds. Exp Brain Res 104:144–152. [DOI] [PubMed] [Google Scholar]
- Kuriki S, Isahai N, Ohtsuka A (2004). Spatiotemporal characteristics of the neural activities processing consonant/dissonant tones in melody. Exp Brain Res 162:46–55. [DOI] [PubMed] [Google Scholar]
- Langner G, Sams M, Heil P, Schulze H (1997). Frequency and periodicity are represented in orthogonal maps in the human auditory cortex: evidence from magnetoencephalography. J Comp Physiol [A] 181:665–676. [DOI] [PubMed] [Google Scholar]
- Liégeois-Chauvel C, Musolino A, Chauvel P (1991). Localization of primary auditory cortex in man. Brain 114:139–153. [PubMed] [Google Scholar]
- Liégeois-Chauvel C, Musolino A, Badier J-M, Marquis P, Chauvel P (1994). Evoked potentials recorded from the auditory cortex in man, Evaluation and topography of the middle latency components. Electroencephalogr Clin Neurophysiol 92:204–212. [DOI] [PubMed] [Google Scholar]
- Liégeois-Chauvel C, Giraud K, Badier J-M, Marquis P, Chauvel P (2001). Intracerebral evoked potentials in pitch perception reveal a functional asymmetry of the human auditory cortex. Ann New York Acad Sci 930:117–132. [DOI] [PubMed] [Google Scholar]
- Lütkenhöner B, Steinstrater O (1998). High-precision neuromagnetic study of the functional organization of the human auditory cortex. Audiol Neurootol 3:191–213. [DOI] [PubMed] [Google Scholar]
- Menning H, Roberts LE, Pantecv C (2000). Plastic changes in the auditory cortex induced by intensive frequency discrimination training. NeuroReport 11:817–822. [DOI] [PubMed] [Google Scholar]
- Monaghan P, Metcalfe NB, Ruxton GD (1998). Does practice shape the brain? Nature 394:434. [DOI] [PubMed] [Google Scholar]
- Moore JK, Guan YL (2001). Cytoarchitectural and axonal maturation in human auditory cortex. J Assoc Res Otolaryngol 2:297–311. [DOI] [PMC free article] [PubMed] [Google Scholar]
- Paetau R, Ahonen A, Salonen O, Sams M (1995). Auditory evoked magnetic fields to tones and pseudowords in healthy children and adults. J Clin Neurophysiol 12:177–185. [DOI] [PubMed] [Google Scholar]
- Pang EW, Taylor MJ (2000). Tracking the development of the N1 from age 3 to adulthood: an examination of speech and non-speech stimuli. Clin Neurophysiol 111:388–397. [DOI] [PubMed] [Google Scholar]
- Pantev C, Bertrand O, Eulitz C, Verkindt C, Hampson S, Schuierer G, Elbert T (1995). Specific tonotopic organizations of different areas of the human auditory cortex revealed by simultaneous magnetic and electric recordings. Electroencephalogr Clin Neurophysiol 94:26–41. [DOI] [PubMed] [Google Scholar]
- Pantev C, Oostenveld R, Engelien A, Ross B, Roberts LE, Hoke M (1998). Increased auditory cortical representation in musicians. Nature 392:811–814. [DOI] [PubMed] [Google Scholar]
- Pantev C, Wollbrink A, Roberts LE, Engelien A, Lütkenhöner B (1999). Short-term plasticity of the human auditory cortex. Brain Res 18:192–199. [DOI] [PubMed] [Google Scholar]
- Pantev C, Roberts LE, Schulz M, Engelien A, Ross B (2001). Timbre-specific enhancement of auditory cortical representations in musicians. NeuroReport 12:169–174. [DOI] [PubMed] [Google Scholar]
- Papanicolaou AC, Baumann S, Rogers RL, Saydjari C, Amparo EG, Eisenberg HM (1990). Localization of auditory response sources using magnetoencephalography and magnetic resonance imaging. Arch Neurol 47:33–37. [DOI] [PubMed] [Google Scholar]
- Ponton CW, Eggermont JJ, Kwong B, Don M (2000). Maturation of human central auditory system activity: evidence from multi-channel evoked potentials. Clin Neurophysiol 111:220–236. [DOI] [PubMed] [Google Scholar]
- Purdy SC, Kelly AS, Thorne PR (2001). Auditory evoked potentials as measures of plasticity in humans. Audiol Neurootol 6:211–215. [DOI] [PubMed] [Google Scholar]
- Rademacher J, Morosan P, Schormann T, Schleicher A, Werner C, Freound H-J, Zilles K (2001). Probabilistic mapping and volume measurement of human primary auditory cortex. NeuroImage 13:669–683. [DOI] [PubMed] [Google Scholar]
- Recanzone GH, Schreiner CE, Merzenich MM (1993). Plasticity in the frequency representation of primary auditory cortex following discrimination training in adult owl monkeys. J Neurosci 13:87–103. [DOI] [PMC free article] [PubMed] [Google Scholar]
- Ritter W, Vaughan HG Jr, Costa LD (1968). Orienting and habituation to auditory stimuli: a study of short term changes in average evoked responses. Electroencephalogr Clin Neurophysiol 25:550–556. [DOI] [PubMed] [Google Scholar]
- Schneider P, Sluming V, Roberts N, Scherg M, Goebel R, Specht HJ, Dosch HG, Bleeck S, Stippich C, Rupp A (2005). Structural and functional asymmetry of lateral Heschl’s gyrus reflects pitch perception preference. Nat Neurosci 2005 8:1241–1247. [DOI] [PubMed] [Google Scholar]
- Shahin A, Bosnyak DJ, Trainor LJ, Roberts LE (2003). Enhancement of neuroplastic P2 and N1c auditory evoked potentials in musicians. J Neurosci 23:5545–5552. [DOI] [PMC free article] [PubMed] [Google Scholar]
- Shahin A, Roberts LE, Pantev C, Trainor LJ, Ross B (2005). Modulation of P2 auditory-evoked responses by the spectral complexity of musical sounds. NeuroReport 16:1781–1785. [DOI] [PubMed] [Google Scholar]
- Soeta Y, Nakagawa S, Tonoike M (2005). Auditory evoked magnetic fields in relation to bandwidth variations of bandpass noise. Hear Res 202:47–54. [DOI] [PubMed] [Google Scholar]
- Tesche CD, Uusitalo MA, Ilmoniemi RJ, Huotilainen M, Kajola M, Salonen O (1995). Signal-space projections of MEG data characterize both distributed and well-localized neuronal sources. Electroencephalogr Clin Neurophysiol 95:189–200. [DOI] [PubMed] [Google Scholar]
- Thompson PM, Cannon TD, Narr KL, van Erp T, Poutanen VP, Huttunen M, Lonnqvist J, Standertskjold-Nordenstam CG, Kaprio J, Khaledy M, Dail R, Zoumalan CI, Toga AW (2001). Genetic influences on brain structure. Nat Neurosci 4:1253–1258. [DOI] [PubMed] [Google Scholar]
- Tremblay K, Kraus N, McGee T, Ponton C, Otis B (2001). Central auditory plasticity: changes in the N1–P2 complex after speech-sound training. Ear Hear 22:79–90. [DOI] [PubMed] [Google Scholar]
- Wallance MN, Johnston PW, Palmer AR (2002). Histochemical identification of cortical areas in the auditory region of the human brain. Exp Brain Res 143:499–508. [DOI] [PubMed] [Google Scholar]
- Weinberger NM (1993). Learning-induced changes of auditory receptive fields. Curr Opin Neurobiol 3:570–577. [DOI] [PubMed] [Google Scholar]
- Yvert B, Crouzeix A, Bertrand O, Seither-Preisler A, Pantev C (2001). Multiple supratemporal sources of magnetic and electric auditory evoked middle latency components in humans. Cereb Cortex 11:411–423. [DOI] [PubMed] [Google Scholar]