Abstract
The present study addresses the questions of how topographically organized neuronal populations are connected, and whether there is anatomical evidence for color-selective wiring in retinal pathways for red–green color vision. The connectivity of OFF midget bipolar and OFF midget ganglion cells was studied in the peripheral retina of dichromatic (“red–green color blind”) and trichromatic (“color normal”) marmosets (Callithrix jacchus). Midget bipolar cells were identified immunohistochemically. Midget ganglion cells were retrogradely labeled from the lateral geniculate nucleus and photofilled. Comparable results were obtained from all retinas studied. Between 3 and 16 bipolar terminals converge onto each ganglion cell. Nearly all bipolar terminals investigated show regions of colocalization (areas of presumed synaptic contacts) with ganglion cell dendrites. This contact area makes up ∼14% of the axon surface area for a typical midget bipolar cell. The output from individual midget bipolar axons is often shared between midget ganglion cells so that, on average, <70% of the axon terminal area of a midget bipolar cell shows overlap with the dendritic field of a given midget ganglion cell. We conclude that there is no morphological evidence of red–green color selectivity in the connections between midget bipolar and midget ganglion cell mosaics. Furthermore, the results suggest that convergence is based on local interactions between axons and dendrites rather than cell-by-cell recognition between members of each mosaic.
Keywords: color vision, parvocellular pathway, color selectivity, midget bipolar cells, midget ganglion cells, New World monkey
Introduction
This study concerns the precision of connections between topographically organized neuronal populations in the visual system. In primates, the midget-parvocellular (PC) system is considered to carry neural signals for high-acuity vision, as well as to contribute to the red–green axis of color vision (for review, see Wässle and Boycott, 1991). The PC pathway begins with connections from cone photoreceptors to midget bipolar cells. Midget bipolar cells make synaptic contact with midget ganglion cells, which project to the parvocellular layers of the lateral geniculate nucleus, and PC relay cells project to the primary visual cortex (for review, see Casagrande and Xu, 2003). The PC system is one of the best-studied “natural pathways” in mammalian sensory systems (Rodieck and Brening, 1983). However, the organization of connections at each stage of such pathways is poorly understood, because it is difficult to identify simultaneously both presynaptic and postsynaptic neuronal populations. The main goal of this study is to address this question.
It is known that in the central retina, each midget bipolar cell receives input from a single medium- (M) or long-wavelength sensitive (L) cone, and contacts a single midget ganglion cell (Kolb and DeKorver, 1991; Calkins et al., 1994). This one-to-one organization may allow the spectral signal from each foveal M or L cone to be transmitted to higher brain regions (Perry et al., 1984; for review, see Wässle and Boycott, 1991).
In the midperipheral retina, midget ganglion cells receive convergent input from several midget bipolar cells (Dacey, 1993; Milam et al., 1993; Wässle et al., 1994) but it is not known whether peripheral PC cells can recognize input from individual bipolar terminals within the dendritic field. The responses of many PC cells in the midperipheral retina show spectral selectivity (De Monasterio and Gouras, 1975; Derrington et al., 1984; Dacey and Lee, 1994; Lee et al., 1998; Martin et al., 2001; Reid and Shapley, 2002; Solomon et al., 2005) (but see Diller et al., 2004). Thus, it has been proposed that in the midperipheral retina, dominant input from one cone type to the center of the receptive field is preserved by selective contacts between midget bipolar and midget ganglion cells (Lennie, 2000; Martin et al., 2001; Dacey and Packer, 2003).
In the peripheral retina of (trichromatic) Old World primates, the irregularly shaped dendritic fields of midget ganglion cells have been suggested to be the correlate for cone-specific connectivity (Wässle and Boycott, 1991; Dacey, 1993). However, similarly shaped fields have been seen in the retina of dichromatic Cebus monkeys (Yamada et al., 1996). In both dichromatic and trichromatic marmosets, the dendritic field perimeter of midget ganglion cells is smooth but mildly elliptical (Ghosh et al., 1996; Szmajda et al., 2005). A direct analysis of the connectivity of the two cell types in any of these primate species, however, is still lacking.
Here, we compare the connections between OFF midget bipolar and OFF midget ganglion cells in the midperipheral retina of dichromatic (two cone types, “red–green color blind”) and trichromatic (three cone types, “color normal”) marmosets.
Materials and Methods
Animals
Seven eyes were obtained from seven (four male, three female) adult marmosets (Callithrix jacchus). Marmosets show a sex-linked polymorphism of M/L cone photopigment expression. All male and about one third of all female marmosets show dichromatic color vision, whereas the other females are trichromats (for review, see Jacobs, 1998). The color-vision genotype of the female marmosets was determined by PCR amplification of cone opsin-encoding genes, and confirmed electrophysiologically by functional identification of cone inputs to single neurons in the lateral geniculate nucleus (Solomon et al., 2002; Blessing et al., 2004). All female marmosets were trichromats. All procedures conformed to the provisions of the Australian National Health and Medical Research Council code of practice for the care and use of animals.
Retrograde labeling of retinal ganglion cells in marmosets
Dye injection into the lateral geniculate nucleus.
Dye injections were performed as described previously (Szmajda et al., 2005; Jusuf et al., 2006). Briefly, animals were anesthetized with isofluorane (Forthane; Abbott, Sydney, Australia; ICI, 1–2%) and intramuscular ketamine (30 mg/kg) and xylazine hydrochloride (Rompun; Bayer Animal Health Australia, Pymble, New South Wales, Australia; 2–4 μg/kg). Anesthesia was maintained with intravenous infusion of sufentanil citrate (Sufenta-Forte; Janssen-Cilag, Beerse, Belgium; 4–8 μg/kg). The animal was prepared for electrophysiological recordings from the lateral geniculate nucleus (LGN) using standard methods (Blessing et al., 2004). The LGN was located using a multiunit recording electrode. The recording electrode was then replaced at the same stereotaxic position by a borosilicate glass micropipette filled with 5% dextran, tetramethylrhodamine, and biotin, 3000 molecular weight (Micro-ruby; Invitrogen, Mount Waverly, Victoria, Australia) in a 0.9% NaCl solution. Iontophoretic dye injection was made for a total time of 30 min to 120 min. The tracer was allowed to transport for 55–92 h. Electrophysiological single-cell recordings made from the contralateral LGN were performed during this time. At the end of electrophysiological experiments, the animals were overdosed with sodium pentobarbitone (80–150 mg/kg, i.v.; Nembutal; Rhone Merieux ProVet, Pinkenba, Queensland, Australia).
Photofilling of retrogradely labeled cells.
Retrogradely labeled ganglion cells were photofilled as described in detail previously (Dacey et al., 2003; Szmajda et al., 2005). Briefly, the eyes were enucleated, the cornea, lens, and vitreous were removed and the posterior eyecup was immersed in carboxygenated Ames medium (Sigma, St. Louis, MO). The retina was dissected and mounted onto a Millipore (Bedford, MA) filter (AABP02500, 0.8 μm pore size). The pieces were placed into a superfusion chamber (Warner Instruments, Hamden, CT), mounted on a fixed-stage Zeiss (Oberkochen, Germany) Axioskop 2 microscope, and superfused with carboxygenated Ames medium. Cells were photofilled by illumination with a dual-band Lucifer yellow/rhodamine filter (Chroma filter set 51016) through a 40× water immersion objective. The retinas were subsequently fixed with 4% paraformaldehyde in 0.1 m phosphate buffer (PB), pH 7.4, for 2 h at 4°C. Retinas were then rinsed with 0.1 m PB and immersed in 30% (w/v) sucrose in 0.1 m PB overnight.
Immunohistochemistry
A mouse monoclonal antibody specific for the carbohydrate epitope CD15 (kindly provided by Prof. Mai, University of Düsseldorf, Düsseldorf, Germany) (Andressen and Mai, 1997) was used at a dilution of 1:6 to label flat midget bipolar (FMB) cells (Chan et al., 2001).
Retinas were processed free floating at room temperature unless indicated otherwise. To increase antibody penetration, some retinas were freeze-cracked in liquid nitrogen before processing for immunocytochemistry. Tissue was rinsed in 0.1 m PB for 10 min, and preincubated in 0.5% Triton X-100 or in PBS, pH7.4, containing 5% bovine serum albumin (BSA) and 0.5% Triton X-100 for 60 min. Subsequently, retinas were incubated in the primary antibody diluted in PBS containing 1% BSA, 0.5% Triton X-100, and 0.05% sodium azide at 4°C for 6–16 d. In general, longer incubation times resulted in better staining. Tissue was rinsed in PBS and incubated overnight in a goat anti-mouse secondary antibody, coupled to Alexa 488 (Invitrogen) diluted 1:500 in PBS containing 1% BSA and 0.5% Triton X-100. Control tissue was processed the same way but the primary antibody was omitted. No specific staining was detected in these controls. Preparations were coverslipped in Mowiol (Hoechst, Sydney, Australia) containing 10% 1,4-diazobicyclo-[2.2.2]-octane (Harlow and Lane, 1988).
Light microscopy
Immunofluorescent cells were viewed with a Zeiss Axioplan microscope. Stacks of images (between 22 and 77 optical sections) were taken at a step size of 0.2 μm with a digital camera (Axiocam; Zeiss) using a Plan-Apochromat 63× oil-immersion objective. Images were processed using Axiovision deconvolution software (Zeiss) and the brightness and contrast of the images were adjusted using Axiovision software or Adobe (San Jose, CA) Photoshop (version 7 or CS).
Analysis
In this study, “central retina” refers to eccentricities up to 10° visual angle including ganglion cells up to 1.25 mm from the fovea, “midperipheral retina” refers to 10-40° visual angle, including ganglion cells from 1.25–5 mm, and “far peripheral retina” refers to eccentricities >40° visual angle (i.e., >5 mm eccentricity) (Troilo et al., 1993; Wilder et al., 1996).
Midget ganglion cells and midget bipolar cells were reconstructed by tracing their processes in the inner plexiform layer from a stack of images onto two separate acetate sheets attached to the liquid crystal display monitor. The dendritic field was defined by tracing a polygon around the outermost tips of the dendrites.
Three measures were used to quantify the relationship between the dendritic fields of ganglion cells and the axon terminal mosaic of bipolar cells. First, the tracings of the dendritic field and the axon terminals were overlaid and the proportion of overlap with the dendritic field was determined for each bipolar axon. Thus, the convergence of bipolar onto midget ganglion cells was determined. The proportion of overlap was also used to analyze the spatial relationship between the mosaic of midget bipolar and midget ganglion cells. For some cells, the number of cones converging onto individual midget ganglion cells was determined by counting the cone inner segments (viewed with differential interference contrast Nomarski optics) that were located within the dendritic field.
Second, the spatial alignment of ganglion cell dendrites with midget bipolar axons was quantified by measuring the two-dimensional (2D) projected surface area of all dendrites and axon terminals and determining the proportion of overlap. In controls, the image of the axon terminal mosaic was rotated symmetrically (“flipped”) on the x-axis and then reanalyzed.
Third, the areas of colocalization (presumed contact) between midget ganglion cell dendrites and midget bipolar axons were identified by scanning through the focal planes of the z-stack. The 2D projected areas of contact were determined for each bipolar axon terminal. Measurements were made using custom software written in Matlab version 5 (Mathworks, Natick, MA).
Results
Random wiring versus selective wiring
Two different models, the “random-wiring” and the “selective-wiring” hypotheses have been suggested to explain, anatomically, the presence of red–green opponent cells in the peripheral retina (for review, see Lennie, 2000; Dacey and Packer, 2003) (but see Rodieck, 1991; Calkins and Sterling, 1999). The random-wiring hypothesis suggests that a midget ganglion cell receives input from all M- and L-cone contacting midget bipolar cells in their dendritic field, nonselectively (Fig. 1, top row). Because M and L cones are arranged randomly (Mollon and Bowmaker, 1992; Roorda et al., 2001; Hofer et al., 2005), the clumping of cones will result in some ganglion cells receiving input from a single class of cones. In the selective-wiring hypothesis, either only M- or only L-cone contacting midget bipolar cells provide input to a midget ganglion cell (Fig. 1, bottom row). In both cases, the connectivity between the two types of cells could be tight (Fig. 1, left column) or loose (right column). In a tightly connected system, each midget bipolar cell provides its output to only one midget ganglion cell. For example, the connectivity between midget bipolar and midget ganglion cells in the fovea would be defined as a tightly connected system. In a loosely connected system, a bipolar cell does not discriminate between the ganglion cell dendrites within the area of its axon terminal. Thus, tight connectivity would result in lower cone-to-ganglion cell convergence than loose connectivity. In the peripheral retina, tight connectivity and/or selective connections would, thus, counteract the increase in spectral mixing from M and L cones. To date, no anatomical data are available to support or reject any of these hypotheses.
Figure 1.
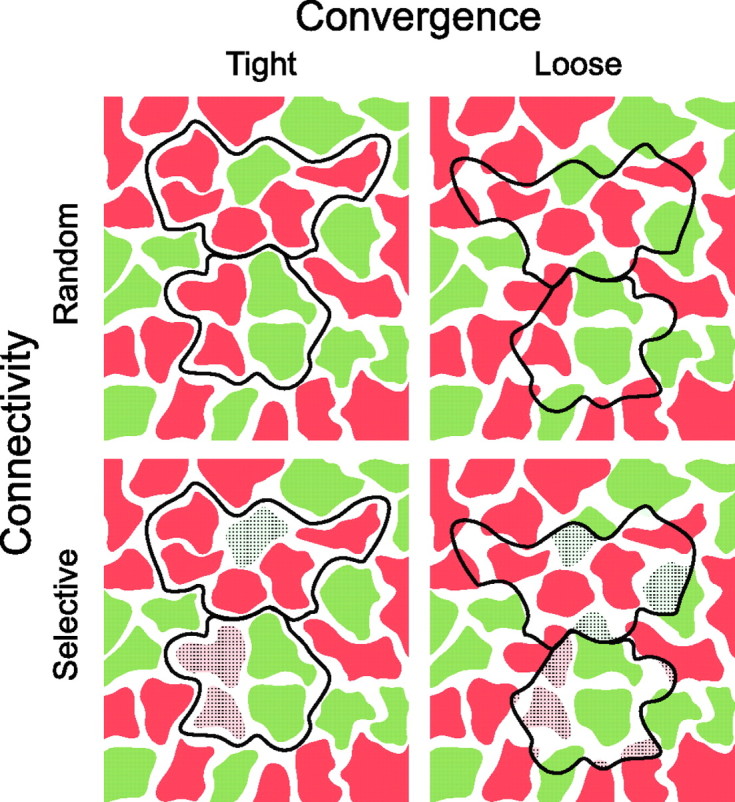
Hypothetical connections between the dendritic fields of two midget ganglion cells (black outlines) and midget bipolar axon terminals. The horizontal view is shown. Midget bipolar cells receiving dominant input from M cones are shown in green and midget bipolar cells receiving dominant input from L cones are shown in red. The pale colors and the hatching indicate regions that lack synaptic connections.
Here, we investigate which of the four possible patterns of connectivity applies for OFF midget bipolar and OFF midget ganglion cells in the peripheral marmoset retina. We compare the connectivity in dichromatic animals, which possess only one cone type (M or L) in addition to the short-wavelength sensitive (S) cones, with that in trichromatic animals (three cone types). If the connectivity of midget bipolar cells with midget ganglion cells is determined by the cone type providing input, then the wiring in dichromatic retinas will differ from that in trichromatic retinas. This is because all of the bipolar terminals in dichromats receive functional input from the same (M or L) cone type, so any basis for color-selective wiring would be absent.
Midget ganglion cells
Midget ganglion cells from midperipheral and far peripheral retinas (eccentricities of 1.7–9.0 mm) were studied. Figure 2, A–D, shows micrographs of retrogradely labeled OFF midget ganglion cells from midperipheral retinas of dichromatic (A, B) and trichromatic marmosets (C, D). In Figure 2, E and F, two ON midget ganglion cells are shown. The size and shape of the dendritic trees of the ganglion cells in these images are comparable. The morphology of retrogradely labeled midget ganglion cells shown here agrees with previous descriptions (Ghosh et al., 1996; Szmajda et al., 2005). Midget ganglion cells have a single thick primary dendrite and the soma is usually located near the edge of the dendritic tree. Midget ganglion cells have a densely branching dendritic tree with a mildly elliptical dendritic field perimeter. Occasionally, single dendrites extend beyond the main dendritic tree (Fig. 2D, white arrows). Such dendrites were found in midget ganglion cells of both phenotypes. Consistent with previous studies (Dacey, 1993; Yamada et al., 1996; Szmajda et al., 2005), the dendritic trees of neighboring midget ganglion cells show little or no overlap (see Fig. 4C).
Figure 2.
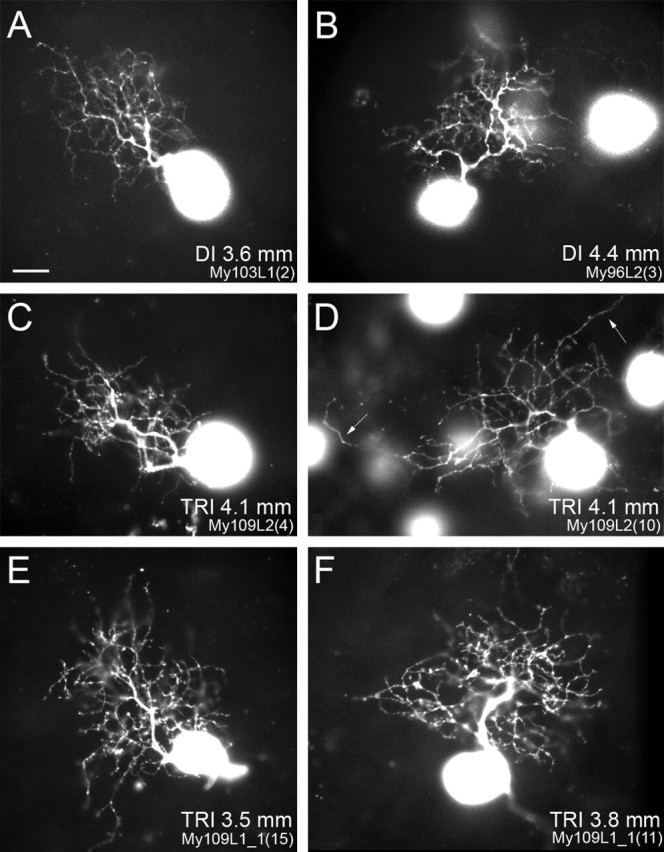
Photomicrographs of retrogradely labeled and photofilled midget ganglion cells in whole-mount marmoset retina. The eccentricity is indicated for each cell. The somata of other ganglion cells can also be seen. A, B, OFF midget ganglion cells in a dichromat (DI). C, D, OFF midget ganglion cells in a trichromat (TRI). Midget ganglion cell somata are located toward the edge of the densely branching dendritic tree. Occasionally, midget ganglion cells in dichromat and trichromat have one or two dendrites, which extend beyond the bulk of the dendritic tree (D, white arrows). E, F, ON midget ganglion cells in a trichromat. Scale bar, 10 μm.
Figure 4.
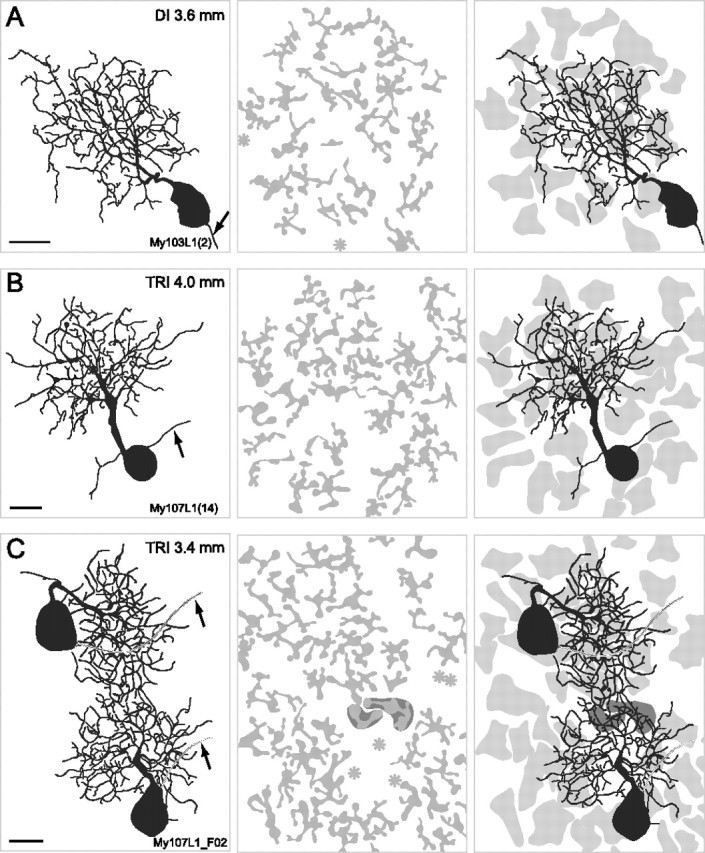
Drawings of reconstructed OFF-midget ganglion cells and the corresponding FMB axon terminals in dichromatic (DI) and trichromatic (TRI) animals. The left column shows the midget ganglion cells. The middle column shows the FMB axon terminals. The right column shows the ganglion cells together with the outlines of the axon terminals (light gray). Eccentricities are indicated in the top right corner. Arrows point to the axon of the ganglion cell, asterisks indicate the location of midget bipolar axons where the axon terminal was too weakly labeled to be traced. The two neighboring ganglion cells in C share two bipolar axon terminals (dark gray outline) (see also Fig. 10 B–D). Scale bars, 10 μm.
Midget bipolar cells
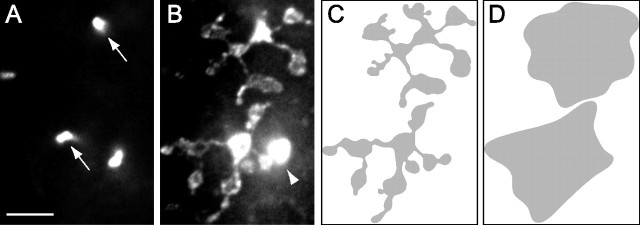
Two types of midget bipolar cells can be distinguished in primate retinas. The OFF (or flat) midget bipolar cells make flat synapses with cones and contact OFF midget ganglion cells. The ON (or invaginating) midget bipolar cells make invaginating synapses with cones and contact ON midget ganglion cells (Kolb and DeKorver, 1991; Calkins et al., 1994). In marmoset retinas, FMB cells can be labeled with an antibody to CD15 (Chan et al., 2001). In the present study, this antibody was used to analyze the relationship between FMB cells and OFF midget ganglion cells. Figure 3, A–D, shows the axon terminals of two CD15-labeled FMB cells in a whole-mounted retina of a dichromat. Figure 3, A and B, shows micrographs, of the axons and axon terminals, respectively. Figure 3C is a drawing of the FMB axon terminals, reconstructed from the image z-stack. In Figure 3D, the outlines of the FMB axon terminals are drawn. The outlines do not overlap and, thus, FMB axon terminals form a territorial mosaic, consistent with findings in previous studies (Milam et al., 1993; Wässle et al., 1994; Chan et al., 2001; Lee et al., 2005). It can be seen in Figure 3B that the axon terminals of individual cells are located very close to each other, making it difficult to distinguish between individual cells in single optical sections. However, in our analysis, each axon terminal was traced through the entire z-stack up to the axon (Fig. 3A,B). Thus, we ensured that the number of FMB terminals matched the number of FMB axons. Furthermore, each individual branch was traced to its origin. Thus, we are confident that each FMB axon terminal was recognized correctly.
Figure 3.
FMB axon terminal mosaic at 4 mm eccentricity. Horizontal view is shown. A, Photomicrograph of four CD15 labeled axons. The arrows point to the axons of the two FMB cells shown in B. B, Photomicrograph of CD15 labeled FMB axon terminals. A single image of a deconvolved stack of images is shown. The arrowhead points to the axon of an ON diffuse bipolar cell (type DB6) (Chan et al., 2001) that stratifies close to the ganglion cell layer. C, Schematic drawing of the FMB axon terminals shown in B. This drawing includes all axonal processes of the FMB cells as reconstructed through the z-stack. D, Drawing of outlines of the FMB axon terminals shown in B and C. Scale bar: (in A) A–D, 10 μm.
In the following, we address the question of whether there is specific alignment between the mosaic formed by the bipolar axons and the mosaic of the ganglion cell dendrites, as well as the question of whether the axons of all bipolar cells in the ganglion cell field are equally likely to make contact with the ganglion cell.
Convergence in the midget pathway
We first compared the convergence from midget bipolar (n = 453) to midget ganglion cells (n = 38) in dichromat and trichromatic marmosets. In addition, there were 21 FMB cells for which the axon terminals were not sufficiently labeled to be reconstructed. Such terminals are marked with an asterisk in Figures 4 and 10. These cells are not included in the analysis. Figure 4 shows examples of retrogradely labeled midget ganglion cells (left column) and the corresponding FMB axon terminals (middle column). The outlines of the FMB axon terminals together with the ganglion cells are shown in the right column. Fourteen FMB axon terminals overlap either partially or completely with the midget ganglion cells shown in Figure 4, A and B, and at the top of Figure 4C; thirteen FMB axon terminals converge onto the cell shown on the bottom of Figure 4C.
Figure 10.
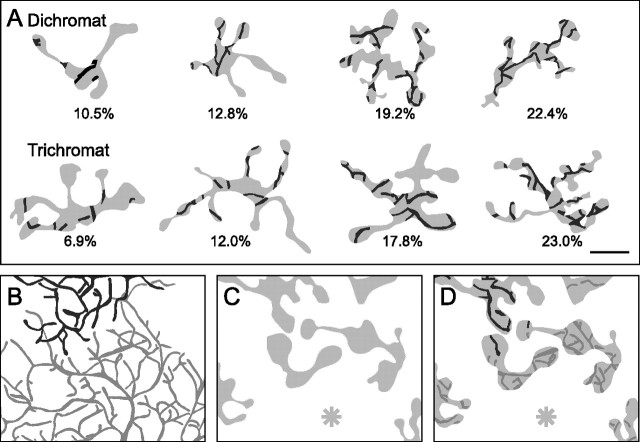
Drawings of FMB axon terminals and the areas of contact with midget ganglion cell dendrites in dichromatic and trichromatic animals. A, Axon terminals of FMB cells are shown in gray; the areas where midget ganglion dendrites and midget bipolar cells are colocalized (presumed contact area) are shown in black. The proportion of axon terminal area in contact is given below each terminal. Only axon terminals that are completely contained within the dendritic field of a ganglion cell are shown. B, The dendrites of two neighboring ganglion cells (see also Fig. 4C) are shown in black and gray, respectively. C, Axon terminals of the FMB cells in the dendritic field. The asterisk shows the location of an axon where the axon terminal was too weak to be traced. D, The areas of contact between FMB axons (light gray) and midget ganglion cells are shown in either black or dark gray. The two FMB terminals in the middle provide input to both midget ganglion cells. The FMB cell on the left has 9.7% area in contact with the dendrites from the top midget ganglion cell and 20.5% in contact with the other cell. The FMB cell on the right has 5.7% contact with the top cell and 23.5% contact with the other cell. Scale bar: (in A) A–D, 5 μm.
The convergence was measured in this way for 29 ganglion cells and 370 FMB cells in dichromats and trichromats at similar eccentricities (2.6–5.1 mm). The average number of FMB axons per midget ganglion cell was similar in dichromats (13.8 ± 3.9; n = 11) and trichromats (12.8 ± 3.6 SD; n = 18; p = 0.32; t test).
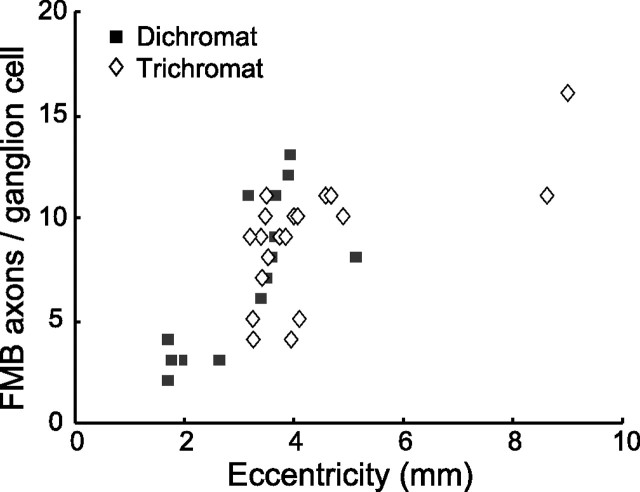
When only those FMB axon terminals that overlap >50% with the dendritic tree of a labeled ganglion cell were taken into account, we arrived at slightly lower values (Fig. 5, Table 1). The FMB cells with >50% overlap are presumed to form the majority of their output synapses onto this ganglion cell. For the 29 cells from 2.6–5.1 mm eccentricity, the average number of FMB axons per midget ganglion cells was 9.0 ± 2.8 SD in dichromats and 8.3 ± 2.3 SD in trichromats. These values are comparable (p = 0.042; n = 18; t test). The seven more central cells show a lower (3.1 ± 0.7) and the two more peripheral cells show a higher (13.5 ± 3.5) average convergence. This mild increase in convergence with increasing eccentricity is consistent with the changes in spatial density and size of the two cell types described in previous studies of marmoset retina (Ghosh et al., 1996; Goodchild et al., 1996; Chan et al., 2001; Szmajda et al., 2005).
Figure 5.
Graph showing the number of FMB axon terminals per ganglion cell in dichromats (black squares) and trichromats (white diamonds) at different eccentricities. Only FMB cells with >50% of their axon terminal overlapping with the dendritic tree of the midget ganglion cell are included.
Table 1.
Convergence and colocalization pattern of FMB axon terminals and midget ganglion cell dendrites
| Phenotype (animal number) | Eccentricity (mm) | No. of MGCs | No. of FMB cells | Convergence [average no. of FMB cells/MGCs ± SD (range)] | Average FMB axon terminal area colocalized with MGC[% ± SD (range)] |
|---|---|---|---|---|---|
| Dichromat(My 108) | 1.7–2.0 | 7 | 22 | 3.1 ± 0.7 (2–4) | 22.0 ± 5.8 (8.6–31.9) |
| Dichromat(My 96, 97, 103) | 2.6–5.1 | 11 | 100 | 9.0 ± 2.8 (3–13) | 14.6 ± 6.7 (2.3–30.2) |
| Trichromat(My 107, 109) | 3.2–4.9 | 18 | 152 | 8.3 ± 2.3 (4–11) | 13.3 ± 8.0 (0.6–36.1) |
| Trichromat(My 104) | 8.6–9.0 | 2 | 26 | 13.5 ± 3.5 (11–16) | 12.4 ± 6.9 (1.2–23.4) |
| Total | 38 | 300 |
Only FMB axons that overlap >50% with the dendritic field of the midget ganglion cell are included. MGC, Midget ganglion cell; No., number.
The convergence from cones to midget ganglion cells was determined for four midget ganglion cells from ∼4 mm eccentricity by counting the number of cones in the dendritic field (see Materials and Methods). These midget ganglion cells receive input from an average of 45.8 ± 9.3 SD cones. If one subtracts the S cones that form <10% of the cones (Martin and Grünert, 1999) and in marmoset do not contact FMB cells (Lee et al., 2005), one arrives at an average of 3.2 cones per midget bipolar cell in the midperipheral retina.
In summary, these results demonstrate that in midperipheral retinas of both dichromatic and trichromatic animals, the number of FMB axons converging onto a midget ganglion cell is comparable. They also suggest that in both phenotypes, the axon terminals of FMB cells show a loose rather than a tight pattern of convergence (see below).
The mosaics formed by midget bipolar and midget ganglion cells show loose convergence.
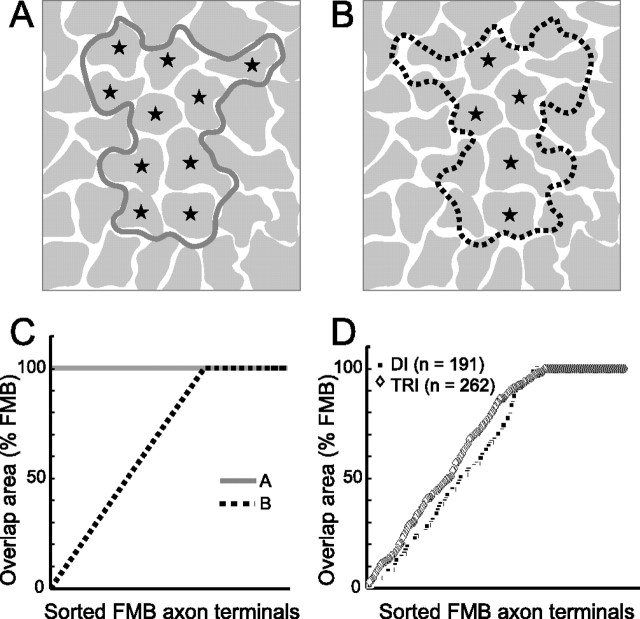
The spatial relationship between the mosaics formed by midget bipolar and midget ganglion cells was determined by analyzing the degree of overlap between the FMB axon terminals and the dendritic field. As illustrated in Figure 6, A and B, two possible patterns of alignment are considered (see also Fig. 1). In Figure 6A, the border of the ganglion cell dendritic field conforms to the borders of individual axon terminals in the FMB terminal mosaic (tight convergence). Accordingly, the axon terminals show an “all-or-none” pattern of overlap with the ganglion cell dendritic field, consistent with the pattern seen in the fovea. In contrast, the border of the ganglion cell dendritic field shown in Figure 6B is randomly placed with respect to the FMB axon terminals (loose convergence). Five of the FMB terminals are completely contained within the dendritic field (100% overlap, marked with stars), the others show various degrees of overlap. Figure 6C shows the distribution of overlap for the two possible patterns. If ganglion cells are specifically aligned (tight convergence), as sketched in Figure 6A, then all the axons will show 100% overlap with the ganglion cell dendritic field (solid line). In contrast, a pattern of loose convergence between the mosaics, as sketched in Figure 6B, predicts a gradual increase in the proportion of overlap (dotted line).
Figure 6.
Schematic diagrams showing possible alignments between the dendritic field of a midget ganglion cell and FMB axon terminal. A, The dendritic field (solid gray outline) is aligned with the overlying FMB axon terminal mosaic (gray, tight convergence). The stars indicate axon terminals that show 100% overlap with the dendritic field. B, The dendritic field (dotted black outline, mirror image of A) is placed randomly on the FMB axon mosaic (loose convergence). Conventions are as described in A. C, Graph showing the proportion of overlap for the FMB axons located within the dendritic field. FMB axons are sorted in ascending percentage of overlap. The example from A is shown as a solid gray line. The example from B is shown as black dotted line. D, Graph showing the proportion of overlap for 453 FMB axon terminals measured in this study. Black squares, Dichromats; white diamonds, trichromats.
The empirical data for 453 FMB terminals are shown in Figure 6D. Both dichromats (mean 63.8 ± 35.7% SD) and trichromats (mean 69.5 ± 32.7% SD) show a variable degree of overlap ranging from 0.2 to 100%, which is not significantly different between the two phenotypes (p = 0.08, t test). These results demonstrate that the mosaic of the FMB axon terminals in both phenotypes shows loose convergence, being largely independent of the orientation and shape of the ganglion cell dendritic tree. These results also suggest that some midget bipolar cells provide input to more than one midget ganglion cell (see below).
Are the dendrites of midget ganglion cells spatially aligned with FMB axon terminals?
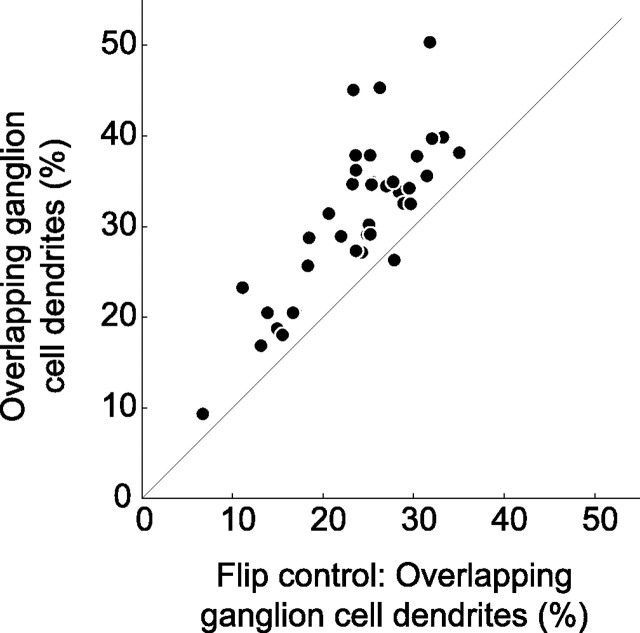
We next asked whether individual branches of the ganglion cell dendrites are aligned with the axonal branches of individual FMB cells. We measured the degree of overlap between the dendritic and the axonal branches. Figure 7A shows a midget ganglion cell together with the overlying FMB axon terminals. In this example, 31.5% of the dendrites overlap with the axon branches of FMB cells. When the image of the FMB mosaic is flipped around the x-axis, the percentage of overlap is only 20.7%. This kind of analysis was performed for all ganglion cells (n = 38). The result is shown in Figure 8. For nearly all cells, the degree of overlap between dendrites and axonal branches (average 31.1 ± 8.6%) is significantly higher than in the flip control (average 23.7 ± 6.6%; p < 0.001, paired Wilcoxon). The average values for dichromats (33.0 ± 5.7% SD) and trichromats (29.4 ± 10.1% SD) are comparable (p = 0.20, t test).
Figure 7.
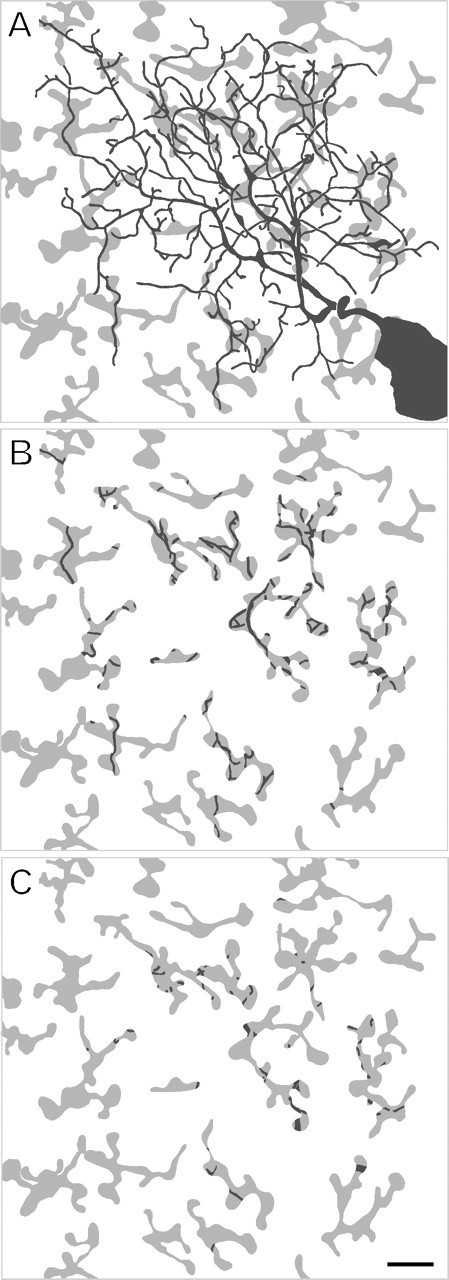
Relationship between midget ganglion cell dendrites (black) and FMB axon terminals (gray). A, The entire dendritic tree of a midget ganglion cell (same cell as in Figs. 1A, 4A) is shown together with the mosaic of FMB axon terminals. B, The dendrites that colocalize with FMB axon terminals are shown. C, The dendrites that overlap but do not colocalize with the FMB terminals are shown. Scale bar, 10 μm.
Figure 8.
Proportion of midget ganglion cell dendrites that overlap with flat midget bipolar axon terminals. The correct superposition of axon terminals and ganglion cell dendrites is compared with the flip control. The proportion of overlap is significantly lower in the flip control (p < 0.001).
The fact that most ganglion cell dendrites do not overlap with FMB axons suggests that peripheral midget ganglion cells receive a relatively low number of bipolar synapses. This has been found for a peripheral ON midget bipolar cell in the macaque retina (Kolb and Marshak, 2003). In these regions, midget ganglion cells might receive the majority of their input from amacrine cells (Lin et al., 2000; Macri et al., 2000).
Figure 7B shows the same FMB axon terminals as in Figure 7A, together with those dendrites that are colocalized (presumed contacts; see below). Figure 7C shows the FMB terminals together with the dendrites that overlap but are not colocalized. The majority of axons that overlap with the dendritic field are colocalized and, thus, probably make synaptic contact.
The proportion of FMB axonal branch area overlapping with midget ganglion cell dendrites was also measured. The average overlap is 21.5 ± 5.3% SD in dichromats and 20.7 ± 5.6% SD in trichromats. These values are comparable (p = 0.65, t test) and are significantly higher than the flip control (p < 0.001, paired Wilcoxon). In another control, the drawings of the overlying FMB axon terminals were superimposed onto the dendritic tree of an ON midget ganglion cell and the average proportion of overlap was determined. We found that the degree of overlap between the ON midget ganglion cell and the FMB axon terminals was 29.8% before and 27.0% after the flip. The proportion of overlap for the FMB axon terminals was 14.3% (before flip) and 15.2% (after flip). This degree of overlap gives an example of what is to be expected by a random superimposition.
Thus, in contrast to the loose pattern of convergence exhibited at the neuron mosaic level, in both phenotypes, the FMB axonal branches and the midget ganglion cell dendrites show significantly more spatial association than in a random superposition. These data suggest that connections between the bipolar and ganglion mosaics are determined by recognition between neuronal processes rather than by cell-to-cell recognition between members of each mosaic.
Contacts between midget bipolar axons and midget ganglion cell dendrites
The regions where bipolar axons and their postsynaptic processes are colocalized give a reliable indicator of the sites of synaptic connections between the two cell types (Jacoby et al., 2000; Ghosh et al., 2001; Lin and Masland, 2005; Jusuf et al., 2006). This enables us to look for signs of selective wiring in trichromatic retinas by asking whether some bipolar axons avoid contact with ganglion cell dendrites. In the following, we refer to these colocalized areas as “contact areas.”
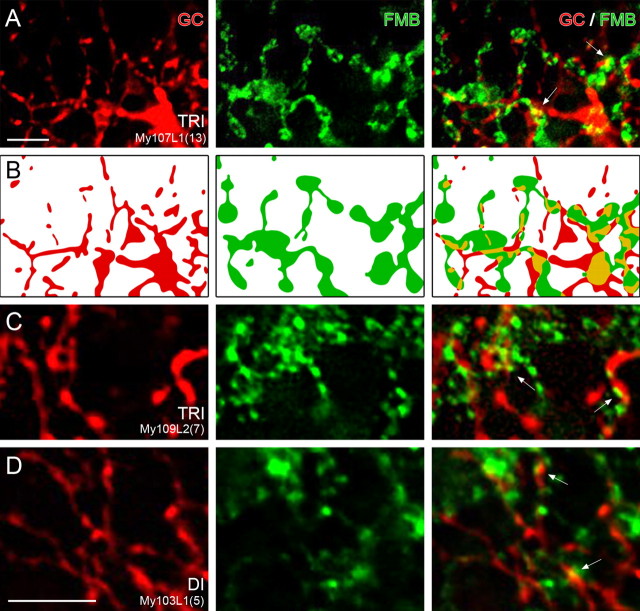
Figure 9 shows examples of such contact areas. The left column shows the midget ganglion cell dendrites; the middle column shows the FMB axon terminals at the same level of focus. The right column shows the superimposition of the two channels. All FMB axon terminals show areas of colocalization with labeled ganglion cell dendrites. In six cases, two neighboring midget ganglion cells were found (Fig. 4C). In all of these cases, at least one FMB axon terminal contacts both ganglion cells (Fig. 10B–D).
Figure 9.
Contact areas between OFF midget ganglion cells (GCs) and FMB axon terminals. Whole mount view of single images of a deconvolved stack of images are shown. A, Micrographs of retrogradely labeled OFF-midget ganglion cells together with CD15-labeled FMB axons in trichromatic (TRI) marmoset. The left column shows the ganglion cell dendrites (red), the middle column shows two FMB axon terminals (green), and the right column shows the superposition of the two channels. The arrows point to regions of colocalization. B, Schematic drawing of the labeled processes in focus in A. The colocalized areas are drawn in yellow. C, D, High-resolution images of midget ganglion cell dendrites (red) and FMB axon terminals (green) in dichromatic (DI) and trichromatic (TRI) marmosets at the same level of focus. The superposition of the two images is shown in the right column. The areas of contact are indicated by arrows. Scale bars: A (for A, B), D (for C, D), 5 μm.
A small minority (42 of 453) of FMB axons was not seen to contact labeled dendrites. These axons were usually located at the very edge of the dendritic field (n = 39) and, thus, probably provide input to other midget ganglion cells. For three FMB axons that were completely contained within the dendritic field, possible contacts were obscured by the ganglion cell body. Together, these results indicate that midget ganglion cells receive nonselective input from all FMB cells in their dendritic field.
To quantify the degree of contact between the two cell types, the contact areas were measured. For each FMB axon terminal that showed 100% overlap with the dendritic field of a ganglion cell, the contact area with this cell was expressed as percentage of the total FMB axon terminal area. Examples are shown in Figure 10A. For FMB axon terminals that showed >50% but <100% overlap, the contact area was expressed as the percentage of that part of the FMB axon terminal that overlaps with the dendritic field. We used this approach to establish whether all FMB axons within the dendritic field of a ganglion cell show a similar pattern of contact.
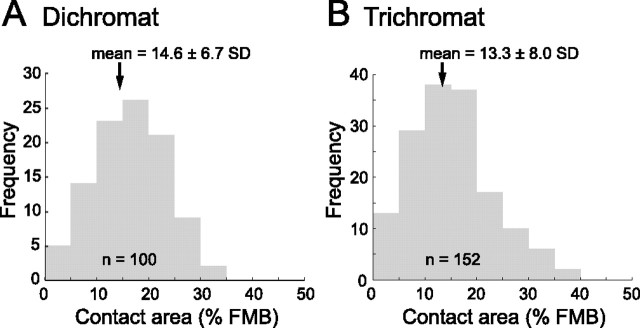
The quantitative data are shown in Table 1. The average contact area for the FMB cells between 2.6 and 5.1 mm eccentricity is 14.6 ± 6.7% in dichromats and 13.3 ± 8.0% in trichromats. These values are comparable (p = 0.18, t test). The more peripheral cells (n = 26) have similar (12.7 ± 6.9%) contact areas, but the more central cells (n = 22) have higher values (22.0 ± 5.8%). Figure 11 shows the distribution of the contact areas in dichromats and trichromats for the cells from 2.6 to 5.1 mm eccentricity. In both phenotypes, the distributions are unimodal [p > 0.8, Hartigan dip test (Mechler and Ringach, 2002)].
Figure 11.
Frequency histograms showing the proportion of FMB axons colocalized with ganglion cell dendrites in dichromats and trichromats. Only FMB cells with >50% of their axon terminals within the dendritic field are included. The mean and SD for each distribution is indicated by an arrow. n, Total number of FMB cells analyzed.
We conclude that at the level of analysis performed here, there is no anatomical evidence for selective connections of midget ganglion cells with midget bipolar axons.
An estimate of the synaptic input to peripheral midget ganglion cells
Central (<1.25 mm eccentricity) FMB axons in the marmoset retina form ∼30 synapses onto midget ganglion cells (Jusuf et al., 2006). We calculated the number of contact areas between FMB axons and midget ganglion cell dendrites (putative synaptic sites) for the 252 FMB axons from 2.6 to 5.1 mm eccentricity. In dichromats, the number of contact areas per FMB cell is, on average, 5.5 ± 3.6 SD, and in trichromats it is 6.4 ± 4.4 SD. These values are comparable (p = 0.08, t test) but lower than those obtained with synaptic markers in central cells. Consistently, the contact areas are rather large and could easily contain multiple synaptic clusters. For the midget ganglion cells at the same eccentricity, the average number of contact areas is 58.6 ± 25.3 SD (dichromats) and 61.3 ± 19.7 SD (trichromats) per cell, and these values are also comparable (p = 0.76, t test). Although the number of contact areas is most likely lower than the number of synapses, it nevertheless gives an estimate of the minimal number of synapses between midget bipolar and midget ganglion cells.
Discussion
We studied the second-order (bipolar) and third-order (ganglion) neurons in the midget-PC division of the primate subcortical visual pathway. We show that the network is characterized by loose convergence between these neuronal populations, and that the pattern of connections is not related to red–green color vision. Thus, the functional role of the midget-parvocellular system outside the fovea does not depend on recognition between the individual members of neuronal mosaics at the retinal level.
Convergence in the midget pathway
Our results show that in midperipheral marmoset retina, on average, between 8 and 13 FMB cells converge onto an individual midget ganglion cell. These numbers are in broad agreement with estimates of convergence in peripheral retinas of humans, macaques, and marmosets in previous studies (Dacey, 1993; Wässle et al., 1994; Chan et al., 2001). However, this study also shows that in marmoset retina, midperipheral FMB cells contact an average of 3 M/L cones. This is in agreement with previous studies of marmosets (Goodchild et al., 1996; Chan et al., 2001) but in contrast to Old World primates, where the 1:1 connectivity between cones and midget bipolar cells is largely maintained throughout the midperipheral retina, and accordingly the cone/FMB ratio remains relatively constant at eccentricities <40 degrees of visual angle (Martin and Grünert, 1992; Milam et al., 1993; Wässle et al., 1994; Kolb and Marshak, 2003). The difference may be related to the higher cone density in marmosets (Troilo et al., 1993; Goodchild et al., 1996). Functionally, it may not make much difference whether a peripheral midget ganglion cell receives input from bipolar cells that contact single cones or from bipolar cells that contact three cones, as in both cases the input to these bipolar cells will be dominated by one (M or L) cone type. Furthermore, in all primate species studied so far, there is a gradual increase in FMB axon terminal size and increasing convergence with increasing eccentricity (Milam et al., 1993; Wässle et al., 1994; Chan et al., 2001). In summary, it is likely that the principles of connectivity we show here will also apply to the retinas of Old World monkeys and humans, but we cannot rule out the possibility that there are species differences.
Selective wiring in the primate retina?
In the central retina, midget ganglion cells generally show a tight one-to-one convergence with single-cone-contacting midget bipolar cells (Kolb and DeKorver, 1991; Calkins et al., 1994). Thus, by default, the receptive field left of midget ganglion cells receives the spectral signal of one cone type. It has been suggested that the midget bipolar cells in the central macaque retina show further color selectivity, such that M-cone-contacting midget bipolar cells make different numbers of synapses with midget ganglion cells than L-cone-contacting midget bipolar cells (Calkins et al., 1994). However, we showed recently that the number of synapses made by FMB cells is comparable in dichromat and trichromatic animals (Jusuf et al., 2006), so the differences found by Calkins et al. (1994) may not be necessarily related to trichromatic color vision.
Here, we found that the mosaic of FMB axon terminals in the peripheral retina is spatially independent of the midget ganglion cell mosaic. Furthermore, nearly all FMB axon terminals show colocalization with ganglion cell dendrites, suggesting that all FMB cells in the dendritic field of a given midget ganglion cell make synaptic contacts with this cell. Thus, OFF midget ganglion cells in peripheral retina do not show a tight connectivity with OFF midget bipolar cells, as do central cells. This result suggests that tight convergence is not a general property of the midget-parvocellular pathway. Consistently, Kolb and Marshak (2003) found that some ON midget ganglion cells in the foveal slope received input from more than one midget bipolar cell.
Furthermore, no differences were seen here with respect to the connectivity of midget bipolar and midget ganglion cells between dichromatic and trichromatic marmosets (Figs. 5, 6D, 11). Thus, our study provides no anatomical evidence for color-selective contacts in the OFF midget pathway in the marmoset retina.
A number of electrophysiological studies in the macaque retina and the macaque and marmoset lateral geniculate nucleus (Yeh et al., 1995; Lee et al., 1998; White et al., 1998; Martin et al., 2001; Reid and Shapley, 2002; Kilavik et al., 2003; Blessing et al., 2004; Solomon et al., 2005), and some psychophysical findings (Abramov et al., 1991; Vakrou et al., 2005), are consistent with preservation of cone-specific signals in midperipheral ganglion cells. Other electrophysiological and psychophysical studies are consistent with spectral mixing (De Monasterio and Gouras, 1975; Derrington et al., 1984; De Valois and De Valois, 1993; Mullen and Kingdom, 1996; Diller et al., 2004; Mullen et al., 2005).
Although we show here directly that the connectivity of midget ganglion cells is indistinguishable in dichromatic and trichromatic animals of the same species, it is nevertheless possible that subtle changes in the weight of synaptic inputs enhance the functional segregation of M- and L-cone mechanisms in the receptive field.
It would be interesting to know whether the pattern of loose and random connectivity shown here for the OFF midget pathway also applies for the ON midget pathway. We think that the ON midget pathway probably shows a similar connectivity for the following reasons. First, both ON and OFF midget ganglion cells at comparable eccentricities show similar morphologies (Watanabe and Rodieck, 1989; Dacey and Petersen, 1992; Dacey, 1993; Ghosh et al., 1996). The larger dendritic field size of ON midget ganglion cells reported in some studies suggests that ON cells receive input from more cones than OFF cells (Dacey and Petersen, 1992; Ghosh et al., 1996; Kolb and Marshak, 2003). However, this additional convergence would only tend to increase the spectral mixing in the input to the ON ganglion cells. Second, apart from the level of stratification, no differences have been reported with respect to the connectivity of central OFF and ON midget bipolar cells in the inner plexiform layer (Kolb and DeKorver, 1991; Calkins et al., 1994). Finally, all data published so far show clear signs of red–green opponency in both ON and OFF PC pathway cells in the central and midperipheral retina (Dacey and Lee, 1999; Dacey and Packer, 2003).
Principles of connectivity in sensory pathways
In the present study, we labeled both the presynaptic mosaic of bipolar cells as well as their postsynaptic targets. The data, thus, may give some insight into the principles governing the pattern of convergence at consecutive levels of mammalian sensory pathways. We show that, although the borders of the midget ganglion cell dendritic field do not respect the borders of individual FMB terminals, the association between the processes of the two cell types is greater than expected in a random distribution. This result suggests that the major synaptic output of peripheral FMB cells is onto OFF midget ganglion cells. Consistently, Jacoby et al. (2000) provided evidence that peripheral FMB cells and OFF parasol cells do not show significant colocalizations. The connectivity between midget bipolar and midget ganglion cell mosaics, thus, appears to be governed by local factors at the level of individual dendrites rather than specific coupling between individual cells. Available data for connections between the diffuse bipolar cell type DB3 and parasol ganglion cells are also consistent with this idea (Jacoby et al., 2000). Jacoby et al. (2000) reported that of the DB3 cells contacting two parasol cells studied, the vast majority (43 of 48 and 53 of 55) are completely within the parasol cell field. However, this apparent tight convergence would be offset by the dendritic overlap exhibited by neighboring parasol cells.
During development, activity-based competition enables the laminar segregation of ON and OFF cells in the mammalian retina (for review, see Chalupa and Günhan, 2004), and local dendritic interactions may regulate the spacing in ganglion cell mosaics (Lohmann and Wong, 2001) (but see also Lin et al., 2004). The basic mechanisms that govern the precision of connections between distinct populations remain poorly understood. Allegiance to radial clonal identity (Reese et al., 1995) as well as cadherin-mediated cell recognition processes (Drenhaus et al., 2003; Prakash et al., 2005) are likely to play a role in the retina and other brain systems (Sharma and Johnson, 2000; Cramer et al., 2004; for review see Bamji, 2005). Accordingly, in both the visual and olfactory systems of Drosophila, cadherin-mediated developmental sorting serves to identify synaptic target populations, but not individual cells within the population (Hummel and Zipursky, 2004; Prakash et al., 2005). In summary, the pattern of connections we see in the peripheral primate retina appears consistent with the pattern of local recognition described for mammalian sensory systems studied so far.
Footnotes
This work was supported by National Health and Medical Research Council Grants 299800 and 25362, a Lions Vision Research Fellowship to U.G., and an Australian Postgraduate Award from the Australian Government to P.R.J. We thank Peter Buzas and Brett Szmajda for help with the photofilling experiments and Ana Lara and Dean Matin for technical assistance.
References
- Abramov I, Gordon J, Chan H (1991). Color appearance in the peripheral retina: effects of stimulus size. J Opt Soc Am A Opt Image Sci Vis 8:404–414. [DOI] [PubMed] [Google Scholar]
- Andressen C, Mai JK (1997). Localization of the CD15 carbohydrate epitope in the vertebrate retina. Vis Neurosci 14:253–262. [DOI] [PubMed] [Google Scholar]
- Bamji SX (2005). Cadherins: actin with the cytoskeleton to form synapses. Neuron 47:175–178. [DOI] [PubMed] [Google Scholar]
- Blessing EM, Solomon SG, Hashemi-Nezhad M, Morris BJ, Martin PR (2004). Chromatic and spatial properties of parvocellular cells in the lateral geniculate nucleus of the marmoset (Callithrix jacchus). J Physiol (Lond) 557:229–245. [DOI] [PMC free article] [PubMed] [Google Scholar]
- Calkins DJ, Sterling P (1999). Evidence that circuits for spatial and color vision segregate at the first retinal synapse. Neuron 24:313–321. [DOI] [PubMed] [Google Scholar]
- Calkins DJ, Schein SJ, Tsukamoto Y, Sterling P (1994). M and L cones in macaque fovea connect to midget ganglion cells by different numbers of excitatory synapses. Nature 371:70–72. [DOI] [PubMed] [Google Scholar]
- Casagrande VA, Xu X (2003). Parallel visual pathways: a comparative perspective. In: The visual neurosciences (Chalupa LM, Werner JS, eds) pp. 494–506. Cambridge, MA: MIT.
- Chalupa LM, Günhan E (2004). Development of On and Off retinal pathways and retinogeniculate projections. Prog Retin Eye Res 23:31–51. [DOI] [PubMed] [Google Scholar]
- Chan TL, Martin PR, Clunas N, Grünert U (2001). Bipolar cell diversity in the primate retina: morphologic and immunocytochemical analysis of a New World monkey, the marmoset Callithrix jacchus J Comp Neurol 437:219–239. [DOI] [PubMed] [Google Scholar]
- Cramer KS, Bermingham-McDonogh O, Krull CE, Rubel EW (2004). EphA4 signaling promotes axon segregation in the developing auditory system. Dev Biol 269:26–35. [DOI] [PubMed] [Google Scholar]
- Dacey D, Packer OS (2003). Colour coding in the primate retina: diverse cell types and cone-specific circuitry. Curr Opin Neurobiol 13:421–427. [DOI] [PubMed] [Google Scholar]
- Dacey DM (1993). The mosaic of midget ganglion cells in the human retina. J Neurosci 13:5334–5355. [DOI] [PMC free article] [PubMed] [Google Scholar]
- Dacey DM, Lee BB (1994). The “blue-on” opponent pathway in primate retina originates from a distinct bistratified ganglion cell type. Nature 367:731–735. [DOI] [PubMed] [Google Scholar]
- Dacey DM, Lee BB (1999). Functional architecture of cone signal pathways in the primate retina. In: Color vision: from genes to perception (Gegenfurtner KR, Sharpe LT, eds) pp. 181–202. Cambridge, UK: Cambridge UP.
- Dacey DM, Petersen MR (1992). Dendritic field size and morphology of midget and parasol ganglion cells of the human retina. Proc Natl Acad Sci USA 89:9666–9670. [DOI] [PMC free article] [PubMed] [Google Scholar]
- Dacey DM, Peterson BB, Robinson FR, Gamlin PD (2003). Fireworks in the primate retina: in vitro photodynamics reveals diverse LGN-projecting ganglion cell types. Neuron 37:15–27. [DOI] [PubMed] [Google Scholar]
- De Monasterio FM, Gouras P (1975). Functional properties of ganglion cells of the rhesus monkey retina. J Physiol (Lond) 251:167–195. [DOI] [PMC free article] [PubMed] [Google Scholar]
- De Valois RL, De Valois KK (1993). A multi-stage color model. Vision Res 33:1053–1065. [DOI] [PubMed] [Google Scholar]
- Derrington AM, Krauskopf J, Lennie P (1984). Chromatic mechanisms in lateral geniculate nucleus of macaque. J Physiol (Lond) 357:241–265. [DOI] [PMC free article] [PubMed] [Google Scholar]
- Diller L, Packer OS, Verweij J, McMahon MJ, Williams DR, Dacey DM (2004). L and M cone contributions to the midget and parasol ganglion cell receptive fields of macaque monkey retina. J Neurosci 24:1079–1088. [DOI] [PMC free article] [PubMed] [Google Scholar]
- Drenhaus U, Morino P, Veh RW (2003). On the development of the stratification of the inner plexiform layer in the chick retina. J Comp Neurol 460:1–12. [DOI] [PubMed] [Google Scholar]
- Ghosh KK, Goodchild AK, Sefton AE, Martin PR (1996). Morphology of retinal ganglion cells in a New World monkey, the marmoset Callithrix jacchus J Comp Neurol 366:76–92. [DOI] [PubMed] [Google Scholar]
- Ghosh KK, Haverkamp S, Wässle H (2001). Glutamate receptors in the rod pathway of the mammalian retina. J Neurosci 21:8636–8647. [DOI] [PMC free article] [PubMed] [Google Scholar]
- Goodchild AK, Ghosh KK, Martin PR (1996). Comparison of photoreceptor spatial density and ganglion cell morphology in the retina of human, macaque monkey, cat, and the marmoset Callithrix jacchus J Comp Neurol 366:55–75. [DOI] [PubMed] [Google Scholar]
- Antibodies. A laboratory manual Harlow E, Lane D (1988). Cold Spring Harbor, NY: Cold Spring Harbor Laboratory.
- Hofer H, Carroll J, Neitz J, Neitz M, Williams DR (2005). Organization of the human trichromatic cone mosaic. J Neurosci 25:9669–9679. [DOI] [PMC free article] [PubMed] [Google Scholar]
- Hummel T, Zipursky SL (2004). Afferent induction of olfactory glomeruli requires N-cadherin. Neuron 42:77–88. [DOI] [PubMed] [Google Scholar]
- Jacobs GH (1998). Photopigments and seeing: lessons from natural experiments. The proctor lecture. Invest Ophthalmol Vis Sci 39:2205–2216. [PubMed] [Google Scholar]
- Jacoby RA, Wiechmann AF, Amara SG, Leighton BH, Marshak DW (2000). Diffuse bipolar cells provide input to OFF parasol ganglion cells in the macaque retina. J Comp Neurol 416:6–18. [DOI] [PMC free article] [PubMed] [Google Scholar]
- Jusuf PR, Martin PR, Grünert U (2006). Synaptic connectivity in the midget-parvocellular pathway of primate central retina. J Comp Neurol 494:260–274. [DOI] [PubMed] [Google Scholar]
- Kilavik BE, Silveira LC, Kremers J (2003). Centre and surround responses of marmoset lateral geniculate neurones at different temporal frequencies. J Physiol (Lond) 546:903–919. [DOI] [PMC free article] [PubMed] [Google Scholar]
- Kolb H, DeKorver L (1991). Midget ganglion cells of the parafovea of the human retina: a study by electron microscopy and serial section reconstructions. J Comp Neurol 303:617–636. [DOI] [PubMed] [Google Scholar]
- Kolb H, Marshak DW (2003). The midget pathways of the primate retina. Doc Ophthalmol 106:67–81. [DOI] [PubMed] [Google Scholar]
- Lee BB, Kremers J, Yeh T (1998). Receptive fields of primate retinal ganglion cells studied with a novel technique. Vis Neurosci 15:161–175. [DOI] [PubMed] [Google Scholar]
- Lee SCS, Telkes I, Grünert U (2005). S-cones do not contribute to the OFF-midget pathway in the retina of the marmoset, Callithrix jacchus Eur J Neurosci 22:437–447. [DOI] [PubMed] [Google Scholar]
- Lennie P (2000). Color vision: putting it together. Curr Biol 10:R589–R591. [DOI] [PubMed] [Google Scholar]
- Lin B, Masland RH (2005). Synaptic contacts between an identified type of ON cone bipolar cell and ganglion cells in the mouse retina. Eur J Neurosci 21:1257–1270. [DOI] [PubMed] [Google Scholar]
- Lin B, Martin PR, Solomon SG, Grünert U (2000). Distribution of glycine receptor subunits on primate retinal ganglion cells: a quantitative analysis. Eur J Neurosci 12:4155–4170. [PubMed] [Google Scholar]
- Lin B, Wang SW, Masland RH (2004). Retinal ganglion cell type, size, and spacing can be specified independent of homotypic dendritic contacts. Neuron 43:475–485. [DOI] [PubMed] [Google Scholar]
- Lohmann C, Wong RO (2001). Cell-type specific dendritic contacts between retinal ganglion cells during development. J Neurobiol 48:150–162. [PubMed] [Google Scholar]
- Macri J, Martin PR, Grünert U (2000). Distribution of the α1 subunit of the GABAA receptor on midget and parasol ganglion cells in the retina of the common marmoset Callithrix jacchus Vis Neurosci 17:437–448. [DOI] [PubMed] [Google Scholar]
- Martin PR, Grünert U (1992). Spatial density and immunoreactivity of bipolar cells in the macaque monkey retina. J Comp Neurol 323:269–287. [DOI] [PubMed] [Google Scholar]
- Martin PR, Grünert U (1999). Analysis of the short wavelength sensitive (“blue”) cone mosaic in the primate retina: a comparison of New World and Old World monkeys. J Comp Neurol 406:1–14. [DOI] [PubMed] [Google Scholar]
- Martin PR, Lee BB, White AJR, Solomon SG, Rüttiger L (2001). Chromatic sensitivity of ganglion cells in the peripheral retina. Nature 410:933–936. [DOI] [PubMed] [Google Scholar]
- Mechler F, Ringach DL (2002). On the classification of simple and complex cells. Vision Res 42:1017–1033. [DOI] [PubMed] [Google Scholar]
- Milam AH, Dacey DM, Dizhoor AM (1993). Recoverin immunoreactivity in mammalian cone bipolar cells. Vis Neurosci 10:1–12. [DOI] [PubMed] [Google Scholar]
- Mollon JD, Bowmaker JK (1992). The spatial arrangement of cones in the primate fovea. Nature 360:677–678. [DOI] [PubMed] [Google Scholar]
- Mullen KT, Kingdom FAA (1996). Losses in peripheral colour sensitivity predicted from “hit and miss” post-receptoral cone connections. Vision Res 36:1995–2000. [DOI] [PubMed] [Google Scholar]
- Mullen KT, Sakurai M, Chu W (2005). Does L/M cone opponency disappear in human periphery. Perception 34:951–959. [DOI] [PubMed] [Google Scholar]
- Perry VH, Oehler R, Cowey A (1984). Retinal ganglion cells that project to the dorsal lateral geniculate nucleus in the macaque monkey. Neuroscience 12:1101–1123. [DOI] [PubMed] [Google Scholar]
- Prakash S, Caldwell JC, Eberl DF, Clandinin TR (2005). Drosophila N-cadherin mediates an attractive interaction between photoreceptor axons and their targets. Nat Neurosci 8:443–450. [DOI] [PMC free article] [PubMed] [Google Scholar]
- Reese BE, Harvey AR, Tan SS (1995). Radial and tangential dispersion patterns in the mouse retina are cell-class specific. Proc Natl Acad Sci USA 92:2494–2498. [DOI] [PMC free article] [PubMed] [Google Scholar]
- Reid RC, Shapley RM (2002). Space and time maps of cone photoreceptor signals in macaque lateral geniculate nucleus. J Neurosci 22:6158–6175. [DOI] [PMC free article] [PubMed] [Google Scholar]
- Rodieck RW (1991). From pigments to perception: advances in understanding visual processes. In: Which cells code for color (Valberg A, Lee BB, eds) pp. 83–93. New York: Plenum.
- Rodieck RW, Brening RK (1983). Retinal ganglion cells: properties, types, genera, pathways and trans-species comparisons. Brain Behav Evol 23:121–164. [DOI] [PubMed] [Google Scholar]
- Roorda A, Metha AB, Lennie P, Williams DR (2001). Packing arrangement of the three cone classes in primate retina. Vision Res 41:1291–1306. [DOI] [PubMed] [Google Scholar]
- Sharma RK, Johnson DA (2000). Molecular signals for development of neuronal circuitry in the retina. Neurochem Res 25:1257–1263. [DOI] [PubMed] [Google Scholar]
- Solomon SG, White AJR, Martin PR (2002). Extraclassical receptive field properties of parvocellular, magnocellular and koniocellular cells in the primate lateral geniculate nucleus. J Neurosci 22:338–349. [DOI] [PMC free article] [PubMed] [Google Scholar]
- Solomon SG, Lee BB, White AJ, Rüttiger L, Martin PR (2005). Chromatic organization of ganglion cell receptive fields in the peripheral retina. J Neurosci 25:4527–4539. [DOI] [PMC free article] [PubMed] [Google Scholar]
- Szmajda BA, Grünert U, Martin PR (2005). Mosaic properties of midget and parasol ganglion cells in the marmoset retina. Vis Neurosci 22:395–404. [DOI] [PubMed] [Google Scholar]
- Troilo D, Howland HC, Judge SJ (1993). Visual optics and retinal cone topography in the common marmoset (Callithrix jacchus). Vision Res 33:1301–1310. [DOI] [PubMed] [Google Scholar]
- Vakrou C, Whitaker D, McGraw PV, McKeefry DJ (2005). Functional evidence for cone-specific connectivity in the human retina. J Physiol (Lond) 566:93–102. [DOI] [PMC free article] [PubMed] [Google Scholar]
- Wässle H, Boycott BB (1991). Functional architecture of the mammalian retina. Physiol Rev 71:447–480. [DOI] [PubMed] [Google Scholar]
- Wässle H, Grünert U, Martin PR, Boycott BB (1994). Immunocytochemical characterization and spatial distribution of midget bipolar cells in the macaque monkey retina. Vision Res 34:561–579. [DOI] [PubMed] [Google Scholar]
- Watanabe M, Rodieck RW (1989). Parasol and midget ganglion cells of the primate retina. J Comp Neurol 289:434–454. [DOI] [PubMed] [Google Scholar]
- White AJR, Wilder HD, Goodchild AK, Sefton AJ, Martin PR (1998). Segregation of receptive field properties in the lateral geniculate nucleus of a New-World monkey, the marmoset Callithrix jacchus J Neurophysiol 80:2063–2076. [DOI] [PubMed] [Google Scholar]
- Wilder HD, Grünert U, Lee BB, Martin PR (1996). Topography of ganglion cells and photoreceptors in the retina of a New World monkey: the marmoset Callithrix jacchus Vis Neurosci 13:335–352. [DOI] [PubMed] [Google Scholar]
- Yamada ES, Silveira LCL, Perry VH (1996). Morphology, dendritic field size, somal size, density, and coverage of M and P retinal ganglion cells of dichromatic Cebus monkeys. Vis Neurosci 13:1011–1029. [DOI] [PubMed] [Google Scholar]
- Yeh T, Lee BB, Kremers J, Cowing JA, Hunt DM, Martin PR, Troy J (1995). Visual responses in the lateral geniculate nucleus of dichromatic and trichromatic marmosets (Callithrix jacchus). J Neurosci 15:7892–7904. [DOI] [PMC free article] [PubMed] [Google Scholar]


