

Abstract
Synapse specificity is a basic feature of synaptic plasticity, but it remains unclear how synapse-specific signaling is achieved if postsynaptic membrane proteins can diffuse laterally between synapses. We monitored movements of AMPA receptors (AMPARs) on the surface of mature neurons to investigate the role of lateral diffusion in constitutive AMPAR trafficking and to assess the influence of membrane architecture on the surface distribution of synaptic proteins. Our data show that lateral diffusion is responsible for the continual exchange of a substantial pool of AMPARs at the spine surface. Furthermore, we found that a general characteristic of membrane proteins is that their movement into and out of spines is slow compared with that in nonspiny membrane. This shows that lateral diffusion is dependent on spine morphology and is restricted at the spine neck. These results demonstrate the importance of lateral diffusion in trafficking of AMPAR protein population and provide new insight into how spine structure can maintain synapse specificity by compartmentalizing lateral diffusion and therefore increasing the residence time of membrane proteins near individual synapses.
Keywords: trafficking, pHluorin, AMPA receptor, photobleaching, synapse specificity, lateral diffusion
Introduction
Most glutamatergic synapses in the mature CNS are found on postsynaptic dendritic spines (Gray, 1959). Therefore, spines are a central feature of excitatory neurotransmission, and their function has been intensely investigated (Tashiro and Yuste, 2003). Spines can act as distinct subcellular compartments attributable to restriction of cytosolic diffusion at the spine neck (Svoboda et al., 1996). For example, diffusional resistance can sufficiently limit the spread of Ca2+ ions that enter the spine head after stimulation to restrict the Ca2+ elevation to the cytosol within that spine. It has been inferred that this cytosolic compartmentalization may underlie the synapse specificity of neuronal processes such as the initiation of synaptic plasticity (Yuste et al., 2000; Nimchinsky et al., 2002). However, many of the likely downstream effectors of synaptic plasticity are transmembrane receptors (e.g., glutamate receptors) and membrane-associated proteins [e.g., postsynaptic density 95 (PSD95)] that are not located in the cytoplasm (Collingridge et al., 2004). Single-particle tracking (SPT) experiments have shown that many membrane proteins that are vital to neuronal function can be highly mobile within the plane of the plasma membrane (Choquet and Triller, 2003). However, the role of this movement in determining receptor distribution is only beginning to emerge (Adesnik et al., 2005), and it remains to be determined how synapse-specific signaling and plasticity are maintained when proteins can move around the surface of the neuron in this way.
We investigated the exchange of AMPA receptors (AMPARs) in the membrane of dendritic spines to define the role of lateral diffusion in AMPAR trafficking and to investigate its dependence on spine morphology. It is known that single AMPARs can diffuse within the plasma membrane of developing neurons and individual receptors have a tendency to slow down at postsynaptic structures (Borgdorff and Choquet, 2002), but the role of lateral diffusion in trafficking of AMPAR populations to and from postsynaptic spines is unclear. Using fluorescence photobleaching experiments to track populations of surface receptors in mature neurons, we now establish how such movement impacts the overall distribution of AMPARs that is fundamentally important for synaptic transmission and plasticity. We show that lateral diffusion is responsible for the constitutive turnover of a substantial proportion of AMPARs on spines. To investigate a possible role for spine morphology in regulating lateral diffusion, we compared this with continual movement of AMPARs on membrane outside spines. We found that lateral exchange in spines is severely restricted in terms of both the numbers of receptors and in speed. Using membrane-targeted green fluorescent protein (GFP), we demonstrate that this restriction is a general property of dendritic spines. This indicates that dendritic spines can influence membrane protein distribution by physically limiting lateral diffusion. Furthermore, this finding suggests a specific mechanism by which dendritic spine shape may contribute to maintenance of synaptic specificity despite the extensive lateral movement of membrane proteins.
Materials and Methods
Cell culture, molecular biology, and protein expression.
Hippocampal cultures were prepared from embryonic (E18) rats as previously (Ashby et al., 2004b). Cells were plated at high density on glass coverslips and grown in culture for 16–23 d before experiments to obtain neurons with many synapses. For protein expression, cultures were transduced 24–36 h before experiments with Sindbis virus carrying the relevant transgene. SEP–GluR2 was constructed by fusing superecliptic pHluorin (Sankaranarayanan et al., 2000) to the N terminus of rat GluR2 cDNA as described for previously published constructs (Shi et al., 2001; Ashby et al., 2004b). This enhanced mutant of pH-sensitive GFP displays the same pH-dependence as original ecliptic pHluorin but has higher overall fluorescence (Sankaranarayanan et al., 2000). Membrane-targeting of palmitoylated GFP (memGFP) was achieved by fusing enhanced GFP (eGFP) with the palmitoylation peptide motif of GAP-43 (Moriyoshi et al., 1996).
Live cell confocal imaging and photobleaching.
For experiments, neurons were placed on the heated stage (set at 37°C) of an inverted microscope (Axiovert 200M; Zeiss, Oberkochen, Germany) and were continually perfused at ∼2 ml/min with solutions also at 37°C. The standard solution was HEPES-buffered saline containing the following (in mm): 140 NaCl, 5 KCl, 25 HEPES, 10 glucose, 1.5 MgCl2, and 2 CaCl2, pH 7.4. For low pH solution, HEPES was replaced with equimolar MES and pH was adjusted to 6.0. Confocal sensitivity was adjusted to produce the maximum dynamic range of detection while maintaining the low fluorescence during acid wash. Fluorescence was excited using 63× water-immersion objective (numerical aperture, 1.2) by 488 nm laser light, and emission was detected through a 505 nm long-pass filter (or 505–550 nm bandpass filter when imaged simultaneously with Alexa 594; Zeiss LSM510 META confocal system). Imaging of Alexa594-labeled anti-GFP antibody fluorescence used 543 nm excitation and a long-pass 600 nm emission filter. Time series were collected as either repetitively scanned single confocal slices (for rapid photobleaching such as memGFP) or as image stacks [for superecliptic pHluorin (SEP)–glutamate receptor subtype 2 (GluR2) spine photobleaching]. Image stacks were compressed into two dimensions using a maximum projection algorithm and filtered using a 3 × 3 low-pass kernel. Any images that exhibited substantial movements in the x, y, or z planes during the experiments were discarded. Photobleaching was achieved by on-demand activation (controlled by acousto-optical tunable filter) of maximal laser power targeted to predefined circular regions of interest that were always of similar size. Photobleaching lasted ∼1–4 s, depending on experimental differences, and the following image was collected within 5 s of the end of photobleaching. Surface fractions of SEP–GluR2 were calculated independently of assumptions about internal vesicular pH, using the method of Mitchell and Ryan (2004), which compares fluorescence changes in response to both low pH and intracellular alkalinization. Importantly, every SEP–GluR2 experiment included a brief low pH wash at the beginning to ensure that all of the fluorescence from the cellular region under inspection came from AMPARs on the surface of the neuron.
Analysis of fluorescence recovery after photobleaching and fluorescence loss in photobleaching.
Fluorescence data were collected after acquisition from regions of interest chosen to match the area subjected to photobleaching. In the case of diffuse/flat areas of membrane, the analysis region was drawn around the fluorescence known to come from the plasma membrane (as shown by low pH wash). For these areas, both cell body and dendritic shaft regions were pooled because there was no difference between them. Data were first individually normalized using a single-exponential fit to account for slow photobleaching of the whole image during the time series acquisition. This photobleaching was estimated by analyzing a region far from the targeted area and was never more than 10% of the total fluorescence. Each fluorescence recovery after photobleaching (FRAP) dataset was then expressed as a percentage of resting fluorescence (average of two to four images immediately before photobleaching) over time and fitted with the following equation that models Brownian diffusion in a membrane after photobleaching and incorporates the possibility of an immobile population (Feder et al., 1996):
 |
F0 is the fluorescence immediately after bleaching, R is the mobile fraction, F0 is the fluorescence immediately before bleaching, and t1/2 is the half-time of the recovery curve. R was constrained in these fits to between 0 and 1.0 and fitted our FRAP curves with great accuracy (SigmaPlot; r2 > 0.95). From these fits, the R and t1/2 values were extracted for each experiment. The t1/2 can be used as a comparative measure of the rate of diffusion if the regions being compared have the same or closely similar shape. In fact, this is the best way to compare mushroom and stubby spines because we only bleached the head of the spine, which we measured as having undetectable differences in area. This approach is not valid for comparing spines with flat, nonspiny membrane regions because the shapes of the membranes within the bleach area are so different. Therefore, we calculated diffusion coefficients by adapting the classical equation for diffusion during FRAP (Axelrod et al., 1976):
 |
D is the diffusion coefficient, A is a measure of the area of membrane in the bleach region, and C is a constant value of 2 or 4 depending on whether the diffusion is on one or two dimensions. For spine heads, A is the two-dimensional area of the spine head measured after confocal stacks are projected into a single plane. Nonspiny membrane can effectively be reduced to a one-dimensional line, with A being the diameter of the bleach region. Our diffusion coefficient calculations can only be regarded as estimates because it would require detailed modeling of each membrane structure, which is beyond the scope of confocal microscopy, to obtain truly accurate diffusion coefficients from FRAP experiments. However, it should be noted that the relationship between our t1/2 measurements and the size of the bleach regions do generally follow the expected correlations (Reits and Neefjes, 2001) (data not shown). Furthermore, the D calculations produced by this method are in broad agreement in each type of membrane with those measured for individual AMPARs in SPT experiments (Tardin et al., 2003).
Cross-linking and immunostaining of SEP–GluR2.
To achieve cross-linking of surface-expressed SEP–GluR2, we applied excess (1:100) Alexa 594-labeled anti-GFP polyvalent antibody (Invitrogen, Carlsbad, CA) to live neurons for 2 min. Cells were then washed twice (for 5 min) to remove unbound antibody and transferred immediately to the microscope for imaging. Antibody binding sites are saturated by this incubation because no additional staining is observed if fresh antibody is immediately reapplied (n = 5). To determine whether this antibody incubation blocked constitutive exocytosis of SEP–GluR2, neurons were preincubated briefly with 1:100 unlabeled “cold” anti-GFP antibody for 2 min (unlabeled antibody also completely inhibits FRAP; n = 3). Subsequently, cells were incubated for 15 min at either 4°C (control) or 37°C to allow constitutive exocytosis to occur. Any exocytosed AMPARs were then identified using Alexa 594-labeled anti-GFP antibody (1:1000, 2 min incubation). Only newly exocytosed AMPARs are detected by the labeled antibody.
Results
Superecliptic pHluorin–GluR2 reveals the distribution of AMPARs on the surface of live neurons
The GluR2 AMPAR subunit was tagged at the N terminus with superecliptic pHluorin to visualize AMPARs specifically on the surface of neurons with high resolution (Ashby et al., 2004b; Kopec et al., 2006). This pH-sensitive variant of enhanced GFP exhibits bright fluorescence when exposed to the exterior of the cell but has relatively little fluorescence while in internal acidified trafficking organelles (Sankaranarayanan et al., 2000; Ashby et al., 2004a). We first verified that SEP–GluR2 fluorescence acts as a selective marker for surface-expressed AMPARs. Live cell confocal microscopy showed a predominantly plasma membrane distribution of SEP–GluR2 fluorescence at the cell body and proximal dendrites of hippocampal neurons (Fig. 1A, image 1) (Ashby et al., 2004b) with some additional low-level fluorescence from inside the cell. To confirm that the bright fluorescence was indeed from AMPARs on the cell surface, we briefly washed cells in buffer with reduced pH (6.0) and recorded the changes in fluorescence. The fluorescence of any SEP–GluR2 exposed on the surface of the cell will be almost instantly eclipsed at this pH. During the wash, the bright fluorescence at the edge of the cell was completely lost, whereas the dim intracellular fluorescence was unaffected (Fig. 1A, image 2). The eclipsed fluorescence rapidly returned in pH 7.4 buffer (Fig. 1A, image 3). This shows that the bright fluorescence can be attributed specifically to plasma membrane receptors. The fluorescence from internal AMPARs implies that either there are many more internal receptors than on the surface and/or that the vesicular internal organelles are not sufficiently acidified to quench all of the fluorescence. To test whether internal SEP–GluR2 is trafficked in acidified vesicles, we applied NH4Cl to collapse all cellular pH gradients. NH4Cl caused a large increase in fluorescence from intracellular areas, confirming that the intracellular SEP–GluR2 is acidified under resting conditions (this distribution is equivalent to that seen for GluR2 tagged with “normal” eGFP) (Fig. 1A, image 4). Removal of NH4Cl allows reacidification of internal vesicular organelles and the consequent reduction in fluorescence (Fig. 1A, image 5). We attribute the intracellular fluorescence mainly to SEP–GluR2 in the endoplasmic reticulum, which is less acidic than other secretory organelles and is prominent in the cell body. As further confirmation that SEP–GluR2 brightness correlated with surface expression, we used an Alexa 594-labeled anti-GFP antibody to identify the distribution of surface SEP in live neurons. The red antibody fluorescence was restricted to the edge of the cell body, and, in dendritic areas, there was clear colocalization of the antibody with areas of bright SEP–GluR2 fluorescence at the heads of dendritic spines (Fig. 1B).
Figure 1.

SEP–GluR2 fluorescence allows specific observation of AMPARs on the surface of neurons. A, Single confocal images of SEP–GluR2 fluorescence in the cell body and proximal dendrites of a cultured hippocampal neuron. At rest (image 1), there is bright fluorescence from the edges of the cell, dim fluorescence inside the cell body, and little in the nucleus. Low pH wash reversibly expunges the surface fluorescence (image 2), and NH4Cl reveals the total fluorescence (image 4) by alkalinizing the cell interior. B, Images of SEP–GluR2 (green) and surface anti-GFP antibody (red) distribution. High-magnification images (from dashed area in top left image) show the similar distributions of fluorescence in spiny dendrites. C, The left panel contains reconstructed confocal image stacks of a spiny hippocampal dendrite showing total SEP–GluR2 fluorescence and that from surface (subtracted) and internal (during pH 6.0 wash) AMPARs. In the overlay image, yellow (red/green colocalization) indicates surface, and pink (red/blue colocalization) indicates internal fluorescent AMPARs. The right panel shows fluorescence profile across selected spines and dendritic shaft. Note that SEP–GluR2 fluorescence in spine heads comes almost exclusively from surface AMPARs. Fluorescence distribution was checked in this way in every experiment. D, Representative trace showing changes in SEP–GluR2 fluorescence in spines and shafts during application of pH 6.0 or NH4Cl-containing buffer. Note that spine fluorescence is much more dependent on changes in extracellular pH, whereas shaft fluorescence is more sensitive to intracellular alkalinization. E, Histogram showing the proportion of SEP–GluR2 on the neuronal cell surface in spine heads and dendritic shafts (mean ± SEM; n = 10). In spines, a much larger proportion of the total SEP–GluR2 is on the surface. Scale bars: A, 10 μm; B, C, 5 μm.
To image AMPARs specifically on the surface of spines, it was essential to establish that SEP–GluR2 acts as a specific surface marker on these structures. Low pH wash is the most rapid and effective way to verify cell-surface distribution of SEP–GluR2 but relies on the fact that internal pH (and hence fluorescence) is not perturbed during the wash. We tested this by expressing free SEP protein in neurons and using its fluorescence as a reporter of cytosolic pH changes during an acidic wash (supplemental Fig. S1, available at www.jneurosci.org as supplemental material). Because intracellular pH regulation is influenced by the extracellular environment, it was unsurprising that prolonged exposure to low pH caused a slow acidification of the cytoplasm, as shown by the decline in free SEP fluorescence (n = 10) (supplemental Fig. S1, available at www.jneurosci.org as supplemental material). We minimized any effects of this in our SEP–GluR2 experiments by limiting low pH wash to a short period in which internal acidification was minimal (20 s) (supplemental Fig. S1, available at www.jneurosci.org as supplemental material). Furthermore, the effect of acid wash on free SEP, which is in the cytoplasm, is likely to be more rapid than on intracellular SEP–GluR2, which is inside the lumen of vesicular organelles. Importantly, we found no significant differences in pH regulation between spine heads and neighboring dendritic shafts (supplemental Fig. 1, inset, available at www.jneurosci.org as supplemental material). This validates the use of a rapid low pH wash to identify surface SEP–GluR2.
Sequential imaging of confocal stacks was used to visualize SEP–GluR2 in dendritic regions. As expected for GluR2-containing AMPARs that are constitutively trafficked to synapses (Shi et al., 2001), there was substantial bright fluorescence in the heads of spines under resting conditions (Fig. 1C, top panel). To verify that all fluorescence from spine heads came from surface-expressed AMPARs, cells were subjected to a wash with low pH buffer (Ashby et al., 2004b). This caused the rapid loss of nearly all fluorescence from the heads of spines (91.2 ± 0.2%) and loss of the majority of fluorescence from dendritic shaft areas (61.3 ± 0.7%) (Fig. 1C–E) (supplemental movie S2, available at www.jneurosci.org as supplemental material), confirming that SEP–GluR2 fluorescence specifically reports the distribution of surface-expressed AMPARs on spines. The proportion of surface receptors can be accurately calculated by comparing the fluorescence decrease in low extracellular pH with the fluorescence increase caused by intracellular alkalinization. We therefore completed a series of experiments in which cells were exposed to a brief low pH wash and then, after recovery, to NH4Cl in normal pH buffer (7.4) (Fig. 1D). Using the method of Mitchell and Ryan (2004), which makes no assumptions about the pH of internal vesicles, we calculated the surface fraction of SEP–GluR2 in spines and in neighboring regions of the dendritic shaft. We found that most of SEP–GluR2 AMPARs in spine heads are on the cell surface (89.2 ± 3.2%) (Fig. 1E). This is clearly demonstrated by the fact that low pH wash immediately quenches the fluorescence from the spine head, whereas alkalinizing the cell interior has no effect on the spine fluorescence. These data correlate well with the fact that relatively few AMPAR-containing vesicles have been found in immuno-EM studies of spines (Petralia et al., 2003). In the dendritic shaft, there is a much smaller surface fraction (39.6 ± 3.6%), and the resting fluorescence comes from these surface AMPARs and also some internal, mildly acidified receptors. Although these observations were similar for all cells tested, there is natural spine-to-spine variation in the receptor distribution. Therefore, to ensure that all of the fluorescence changes detected were attributable solely to AMPARs on the surface of spines, we performed a low pH wash at the beginning of every individual SEP–GluR2 experiment, adjusting the confocal sensitivity as appropriate (n = 58). Thus, we established that SEP–GluR2 is a high-resolution tool that allows rapid, dynamic imaging of AMPARs in the membrane of mature spines.
Movement of AMPARs at the neuronal cell surface monitored by photobleaching of pHluorin–GluR2
We used targeted FRAP of SEP–GluR2 fluorescence to assess the residence times of surface AMPARs in single spine heads. After rapid photobleaching of a single spine, there was a slow recovery of fluorescence as bleached AMPARs exchanged with unbleached AMPARs at the cell surface (Fig. 2A) (supplemental movie S3, available at www.jneurosci.org as supplemental material). This recovery is attributable to movement of AMPARs because it is blocked by mild fixation of the cell (n = 3) (supplemental Fig. S4, available at www.jneurosci.org as supplemental material). FRAP rises to a plateau within 10–15 min (Fig. 2B), indicating that a substantial proportion of AMPARs on the surface of the spine head are continually exchanged, consistent with previous reports that AMPARs constitutively cycle in and out of synapses (Noel et al., 1999). Our FRAP analysis relies on the existence of an equilibrium of AMPARs during the experiment, and so, as the cells are unstimulated, the movement of SEP–GluR2 into the bleached area must be balanced by movement of bleached SEP–GluR2 out.
Figure 2.

FRAP of SEP–GluR2 shows that AMPARs continually move in and out of the dendritic spine plasma membrane by lateral diffusion rather than constitutive exocytosis. A, Glow-scale images from experimental time course showing that photobleached AMPARs on the surface of spine heads (in white circle) are constitutively exchanged for fluorescent AMPARs. Scale bar, 3 μm. B, Normalized FRAP curve from spine head showing partial recovery of fluorescence after photobleaching over the course of 13 min as bleached AMPARs are exchanged with unbleached AMPARs. The data are fitted with a Brownian diffusion model of recovery (red line). C, Representative time course of representative experiment showing that FRAP (and thus AMPAR exchange) is blocked by preincubation by red-labeled anti-GFP antibody that cross-links surface receptors and thus limits lateral diffusion. D, Histogram showing mean ± SEM mobile fraction of SEP–GluR2 in spine heads under normal conditions, after cross-linking anti-GFP antibody treatment, and after fixation. Cross-linking of surface AMPARs reduces recovery to the same level as cell fixation. E, Constitutive exocytosis of SEP–GluR2-containing AMPARs after preincubation with anti-GFP antibody. Fluorescence images show cells expressing SEP–GluR2 (green) that have been preincubated with unlabeled anti-GFP antibody. Red fluorescence is from surface Alexa 594-labeled anti-GFP antibody (red) after a 15 min period at either 4°C or 37°C. F, Mean ± SEM surface anti-GFP fluorescence normalized to control (4°C). ∗p = 0.0004.
A potential concern with FRAP experiments is that photodamage of the tissue may occur as a result of the exposure to high laser power. To exclude this possibility, we performed experiments in which a single area was targeted for multiple bleach events (n = 10) (supplemental Figure S5A, available at www.jneurosci.org as supplemental material). A progressive decrease in the amount of recovery would be indicative of photodamage. We found that recovery was relatively consistent for multiple bleach events in individual regions (supplemental Fig. S5B, available at www.jneurosci.org as supplemental material) and that, overall, there was no difference in fluorescence recovery after two or three bleaches compared with the first (p = 0.62 and 0.70) (supplemental Fig. S5C, available at www.jneurosci.org as supplemental material). These results demonstrate that there was no detectable photodamage.
Lateral diffusion underlies constitutive exchange of AMPARs
Although there is substantial evidence that membrane trafficking plays a role in AMPAR turnover, their lateral diffusion in and near to synaptic membrane has also been observed (Tardin et al., 2003). We therefore tested whether the continual exchange that we saw in our FRAP experiments was attributable to lateral diffusion of AMPARs. To do this, we used an Alexa 594-labeled anti-GFP antibody to cross-link surface-expressed SEP-tagged AMPARs in living neurons. Antibody cross-linking is known to cluster native surface-expressed AMPARs (Mammen et al., 1997), and we reasoned that excess antibody should result in formation of large SEP–GluR2 complexes that hinder their lateral diffusion on the plasma membrane. We transiently applied anti-GFP antibody to live neurons and monitored both SEP–GluR2 (green) and antibody (red) fluorescence. The distribution of the antibody closely matched the bright areas of SEP–GluR2 fluorescence, confirming the surface location of these AMPARs (Figs. 1B, 2C, image). Simultaneous photobleaching of both fluorophores showed that preincubation of the antibody prevented the exchange of bleached AMPARs on spines (n = 4) (Fig. 2C). As a measure of recovery, we quantified the proportion of mobile SEP–GluR2 fluorescence (mobile fraction) and found that using the cross-linking antibody reduced the average recovery to the same low level as fixation of the cell (Fig. 2D).
Previous studies have shown that blockade of exocytosis causes a reduction in surface-expressed AMPARs, and it is thought that membrane trafficking events mediate constitutive AMPAR turnover (Luscher et al., 1999). Therefore, we also considered constitutive exocytosis of unbleached SEP–GluR2 onto the bleached surface membrane of the spine head as a possible mechanism underlying FRAP. If exocytosis directly onto the spine head was responsible for the recovery, then it should be blocked by the excess anti-GFP antibody treatment that blocks FRAP. We tested this using pulse-chase surface labeling of SEP–GluR2. Having transiently incubated SEP–GluR2-expressing cells with excess unlabeled anti-GFP antibody, we incubated cells for 15 min at 37°C (and 4°C as control) to allow any constitutive exocytosis to occur. Any newly exocytosed SEP–GluR2 was then visualized using Alexa 594-labeled anti-GFP antibody (Fig. 2E). There was significantly increased immunostaining of surface SEP–GluR2 after the 37°C incubation, showing that constitutive exocytosis of AMPARs still occurred after preincubation with excess anti-GFP antibody (n = 5) (Fig. 2F). In these experiments, we were not able to quantify exocytosis of SEP–GluR2 in the absence of the first antibody application because that incubation is required for visualization of the newly inserted receptors (Pickard et al., 2001). Therefore, we cannot exclude some effect of this first antibody incubation on the subsequent rate of exocytosis. However, the rate of exocytosis here is comparable with that measured using a thrombin cleavage assay with recombinant GluR2 AMPAR subunit expressed in the same type of cultured hippocampal neurons (Passafaro et al., 2001). Furthermore, because FRAP is blocked under these preincubation conditions and exocytosis is still apparent, membrane trafficking is unlikely to underlie the observed redistribution of AMPARs during FRAP. We therefore conclude that the exchange of AMPARs into and out of the spine head occurs by lateral diffusion in the plasma membrane. This relatively rapid equilibration of AMPARs by lateral diffusion and the very small pool of AMPARs inside the spine head is consistent with the suggestion that major sites of endocytosis and exocytosis are outside the matrix of submembrane anchoring, scaffolding, and signaling proteins present in the postsynaptic region (Passafaro et al., 2001; Blanpied et al., 2002; Petralia et al., 2003; Racz et al., 2004).
Lateral diffusion is compartmentalized at spines
We next investigated whether lateral movement of receptors into and out of spines is restricted, mirroring the compartmentalization of cytoplasmic molecules (Svoboda et al., 1996). We compared the time course of FRAP in spine heads with areas of flat (nonspiny) membrane that showed no apparent clustering of tagged AMPARs. Although these regions often displayed some clearly intracellular fluorescence, much brighter fluorescence decorated the plasma membrane. The fact that this was attributable to surface-expressed AMPARs was verified by a wash with low pH buffer (Fig. 3A). After photobleaching, there was a progressive recovery of fluorescence along the membrane from the edges of the bleached region toward the center (n = 22) (Fig. 3B) (supplemental movie S6, available at www.jneurosci.org as supplemental material). As with FRAP in the spine head, this recovery was completely blocked by the addition of cross-linking anti-GFP antibody, confirming that it is attributable to lateral diffusion (n = 5). Because we found no differences between them, we pooled nonspiny membrane FRAP experiments from regions of the cell body and from the dendritic shaft. FRAP measured along nonspiny membrane had a time course with similar shape to that in spine heads (Fig. 3C). However, the rate and extent of AMPAR lateral exchange was markedly different in the two regions of membrane. These differences are shown by comparing the pooled, averaged FRAP curves from mushroom spines and from nonspiny membrane (Fig. 3D).
Figure 3.
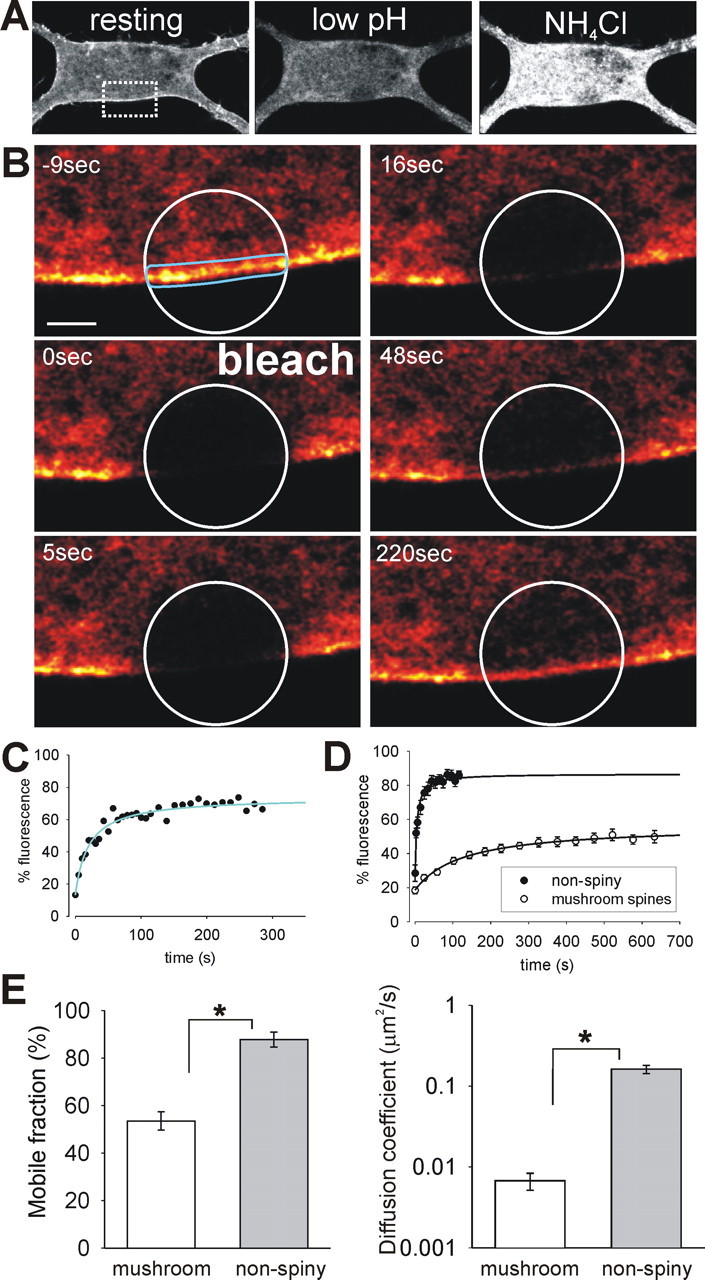
Lateral movement of AMPARs in and out of spines is much slower than movement along nonspiny membrane. A, SEP–GluR2 fluorescence image shows single confocal image of region of cell to be bleached. The bright edge of the cell is sensitive to low pH wash and so comes from AMPARs in the plasma membrane. Alkalinizing the cell with NH4Cl reveals the full fluorescence of internal AMPARs. B, SEP–GluR2 fluorescence (glow scale) FRAP images from nonspiny membrane region shown in dashed box on image in A. Bleaching of SEP–GluR2 fluorescence (in white circle) is followed by rapid recovery of fluorescence along the membrane from the edges of bleach region toward the center. Scale bar, 1 μm. C, Graph shows normalized FRAP curve from membrane region (fitted with diffusion model; blue line). D, Pooled and averaged (mean ± SEM) FRAP curves from mushroom spines and nonspiny regions of membrane. The extent and rate of recovery is greatly reduced in spine heads. E, Averaged mobile fractions and diffusion coefficients for spine and nonspiny membranes. The proportion of mobile AMPARs is larger and the speed of diffusion of mobile AMPARs is much faster in nonspiny areas (mean ± SEM; ∗p < 0.0001).
To quantitatively assess each experiment, FRAP data were fitted with a Brownian diffusion model to obtain values for the mobile fraction and the t1/2 of recovery (Feder et al., 1996) (see Materials and Methods; r2 > 0.95). The mobile fraction is the proportion of the AMPARs in the bleached region that are exchanged during the experiment. The t1/2 is a measurement of the rate of exchange of bleached molecules and reflects only those molecules that are part of the mobile fraction (i.e., those that are not immobilized). Whereas, on average, 83.6% of SEP–GluR2-containing AMPARs were mobile in nonspiny membrane, only 53.5% of AMPARs move into and out of spine heads over the time course of our experiments (Fig. 3E; Table 1, Mobile fraction). This indicates that a much larger proportion of AMPARs are retained within the spine head membrane compared with nonspiny regions. This is likely attributable to the presence of interacting proteins in postsynaptic density that anchor AMPARs receptors at the synapse (Sheng, 2001). It is possible (and likely) that the immobile AMPARs will eventually become free to move, but we could not detect this movement in our FRAP experiments because the immobile SEP–GluR2 remained in the spine head for at least 1 h after photobleaching. The mean t1/2 of the FRAP in spine heads was 222.7 s (Table 1). From this, we can estimate that the mobile population of spine AMPARs is almost completely exchanged in ∼15–20 min. In contrast, FRAP in areas of flat, nonspiny membrane was much faster. The size of bleaching region was chosen to cover the head of a spine, and, to avoid differences in bleach times and characteristics, regions of similar size were used to bleach nonspiny membrane areas (Table 1). Although the bleach regions were the same size, the membrane shape is clearly different between spines and flat membrane, and this precludes simple comparison of t1/2 values from the two areas. To accurately assess the rate of movement of AMPARs, we therefore calculated the diffusion coefficient (D) using a model of diffusion that incorporate measurements of the membrane surface area that is bleached (see Materials and Methods). Although the accuracy of the area measurements is limited with confocal microscopy, the calculated D values were in the range expected for lateral diffusion of transmembrane proteins and broadly correlate with SPT measurements of AMPAR movements (Borgdorff and Choquet, 2002; Tardin et al., 2003). As expected from the FRAP curves, we found that the mean D in nonspiny membrane was 19.8 times faster than that in spines (Fig. 3E; Table 1), indicating that mobile AMPARs diffuse much faster in nonspiny membrane than in the spine membrane. This effectively means that AMPARs tend to dwell longer in a region of spine membrane than when outside the spine and demonstrates that the spine membrane constitutes a distinct diffusional compartment.
Table 1.
Averaged characteristics of FRAP curves for SEP–GluR2 and for memGFP in nonspiny and spiny (mushroom and stubby) membranes
| Mobile fraction (%) | t1/2 (s) | Diffusion coefficient (μm2/s) | n | |
|---|---|---|---|---|
| SEP–GluR2 | ||||
| Flat nonspiny | 83.6 ± 4.1 | 11.4 ± 2.8 | 0.1329 ± 0.0281 | 6 |
| Mushroom | 53.5 ± 3.9 | 222.7 ± 25.3 | 0.0067 ± 0.0016 | 22 |
| Stubby | 46.9 ± 3.8 | 100.7 ± 29.5 | 0.0162 ± 0.0070 | 8 |
| memGFP | ||||
| Flat nonspiny | 86.5 ± 3.4 | 2.6 ± 0.6 | 0.6350 ± 0.0701 | 8 |
| Mushroom | 92.0 ± 2.2 | 7.7 ± 1.5 | 0.1558 ± 0.0296 | 29 |
| Stubby | 85.2 ± 2.7 | 5.3 ± 1.0 | 0.1746 ± 0.0226 | 12 |
Data show means ± SEM for mobile fraction, half-time of recovery, and estimated diffusion coefficient (calculated as described in Materials and Methods).
Diffusion of AMPARs in and out of spines is limited by the neck
Compartmentalization of the spine cytosol depends an increased resistance to diffusion at the narrow neck region (Svoboda et al., 1996), but it is unclear whether the neck would also act as a barrier to diffusion of membrane proteins. To address this, we continuously bleached just the top of individual spine heads and monitored fluorescence loss in photobleaching (FLIP) from adjacent regions within the spine (Fig. 4A). During bleaching (Fig. 4A, red box), fluorescence in nonbleached regions decreased as they exchange SEP–GluR2 with the bleached area. The loss of fluorescence in unbleached areas shows that SEP–GluR2 could diffuse throughout all areas of the spine surface but the rate of FLIP differed in different regions. Specifically, there was a slower loss of fluorescence from the neck region compared with the spine head (Fig. 4A, compare green with light blue regions, shown by arrow). This suggests that SEP–GluR2 diffusion within the neck is slow compared with diffusion in membranes at the spine head. Regions near the base of the neck and the shaft exhibited indistinguishable FLIP rates, highlighting the relatively rapid rate of equilibration outside the spine (Fig. 4A, purple and orange regions).
Figure 4.
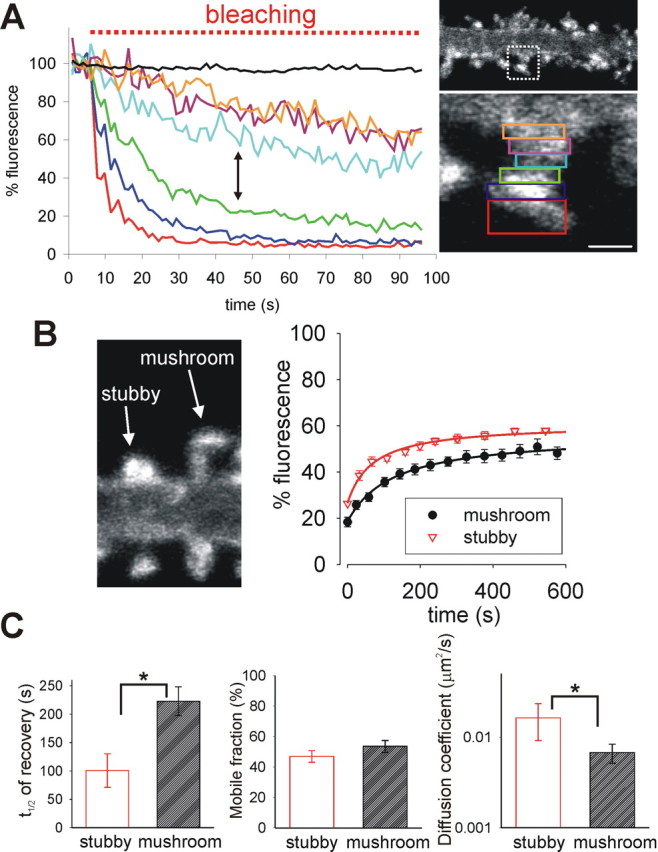
There is a barrier to AMPAR lateral movement located at the spine neck. A, Continuous photobleaching at the top of the spine head (red region) leads to loss of fluorescence in nearby regions (regions shown in accompanying image; the black line is fluorescence in neighboring spine) as SEP–GluR2 moves around the membrane of the spine. The loss of fluorescence is relatively slow in regions at or near the neck, suggesting that movement in this region is reduced. Scale bar, 1 μm. B, Image shows typical examples of SEP–GluR2 fluorescence from stubby and mushroom spines. Chart shows pooled and averaged FRAP curves from stubby and mushroom spine heads. C, Histograms showing the means ± SEM of t1/2, mobile fraction, and diffusion coefficients from stubby and mushroom spine heads. Mobile fractions are similar (p = 0.37) but the time needed for recovery is reduced in spines that do not have necks, and this is reflected in a faster rate of diffusion (∗p < 0.05).
If the neck does represent a barrier to lateral diffusion in the membrane, we would expect to observe a difference between spines that have necks (known as “mushroom” spines) and those with a head but no neck (“stubby” spines). We analyzed recovery from photobleaching of SEP–GluR2 in the heads of these two spine types. Pooled and averaged FRAP data from the two types of spines indicated different kinetics, with fluorescence recovering faster in stubby spines (Fig. 4B). Recovery in each spine was then analyzed individually as above using diffusion curve fits. There was no difference in the mobile fraction in the two types of spine, indicating that they have a similar proportion of anchored receptors (Fig. 4C). Because there was no overall difference in the area of the heads of stubby and mushroom spines (supplemental Fig. S7, area of spine head in an image stack projected into a single plane, available at www.jneurosci.org as supplemental material), the most accurate comparison of diffusion rate is the t1/2 of recovery. We found that the t1/2 in mushroom spine heads was slower than that in stubby spines, directly showing the retardation of diffusion caused by the spine neck (Fig. 4C; Table 1). This was also reflected in the diffusion coefficient, which showed that diffusion into and out of mushroom spines was 2.4 times slower than in spines with no necks (Fig. 4C).
The restriction in movement caused by the spine neck did not fully account for the slow diffusion rate in spines. Because the diffusion rate in stubby spines was still slower than that in nonspiny membrane (Table 1), there are at least two processes underlying the restriction of AMPAR diffusion in and out of the spine head. One process, seen in all spines, correlates to previous observations that individual AMPARs often exhibit slower lateral diffusion near to shaft/developing synapses attributable to AMPAR-specific mechanisms (Borgdorff and Choquet, 2002; Tardin et al., 2003). The second process occurs as a result of restricted diffusion imposed by a barrier at the neck of mature, mushroom spines.
The spine neck acts as a general membrane compartmentalization device
To establish whether the compartmentalization is specific for AMPARs, we performed FRAP analysis of memGFP (Moriyoshi et al., 1996), a protein that is targeted to the inner leaflet of the plasma membrane but does not interact with intracellular anchoring proteins. A similar marker has been used previously to correlate membrane diffusion with spine motility (Richards et al., 2004). As expected for a membrane lipid, FRAP of memGFP was much more rapid and complete in spine heads than SEP–GluR2, with maximal recovery taking 15–40 s (Fig. 5A,B). To assess the general effect of the spine neck on the rate of lateral diffusion, we compared FRAP of memGFP in mushroom and stubby spines (Fig. 5B). Approximately 90% of memGFP fluorescence was mobile in our FRAP experiments, and we measured no significant differences in mobile fraction between mushroom and stubby spines (Fig. 5C; Table 1). However, despite the very different nature of the membrane association and the speed of recovery, we again measured a shorter t1/2 of recovery in stubby spines compared with mushroom spines (Fig. 5C; Table 1). This indicates that the spine neck also imposes a diffusion barrier on memGFP. In fact, memGFP FRAP was slowed by a similar proportion in spines with necks as was SEP–GluR2-containing AMPARs. These data confirm that membrane morphology of the spine neck forms a general diffusion barrier that acts to compartmentalize transmembrane and membrane-associated molecules.
Figure 5.

Diffusion in the plasma membrane of spines is nonspecifically compartmentalized. A, Fluorescence images (glow scale) of memGFP during a typical FRAP experiment. There is rapid recovery of fluorescence after photobleaching in the spine head (white circle). Scale bar, 1 μm. B, Pooled and averaged FRAP curves for memGFP in stubby (black) and mushroom (red) spines. Images show representative spines from the two groups. Note the more rapid recovery in stubby spine plasma membrane. C, Averaged mobile fractions in the two regions are the same, but the mean t1/2 of recovery is longer in mushroom spines (mean ± SEM).
Discussion
We used photobleaching of fluorescently tagged AMPARs to assess the role of lateral diffusion in the distribution of AMPARs on the cell surface of live hippocampal neurons. A significant proportion of AMPARs continually diffuse into and out of mature dendritic spines, consistent with lateral diffusion being an important component of synaptic AMPAR transport (Passafaro et al., 2001; Blanpied et al., 2002; Borgdorff and Choquet, 2002; Ashby et al., 2004b). Lateral diffusion underlies the constitutive exchange of 50% of spine AMPARs in a few minutes (Fig. 2; Table 1). In nonspiny membrane, the vast majority of surface AMPARs are mobile, and these receptors very rapidly explore the membrane (Fig. 3; Table 1). This highlights the efficiency of lateral diffusion as a transport mechanism over distances of a few micrometers.
SEP–GluR2 for labeling AMPARs on the cell surface
Dynamic measurements of proteins at the cell surface must be made to study lateral diffusion (Triller and Choquet, 2005). SPT of individual AMPARs on the surface of neurons showed that they can diffuse in and around synapses (Borgdorff and Choquet, 2002; Tardin et al., 2003). This highlighted the potential importance of lateral diffusion, but its role in the bulk trafficking of AMPARs remained unclear. A recent study, which used a caged AMPAR antagonist, highlighted the relative inefficiency of vesicular trafficking compared with lateral diffusion in driving the exchange of AMPARs at synapses (Adesnik et al., 2005). Previously, we used pHluorin-tagged AMPARs to monitor plasma membrane trafficking events using time-lapse fluorescence imaging (Ashby et al., 2004b). This approach gives fast temporal resolution and spatial information at the level of individual synapses (Ashby et al., 2004a; Kopec et al., 2006). Here, we coupled fluorescence imaging with photobleaching of SEP–GluR2 to dynamically monitor the movements of AMPARs on the plasma membrane. Because we recombinantly expressed SEP–GluR2, it is possible that the properties of the predominantly homomeric, tagged AMPARs may vary from those of endogenous AMPARs. However, a major fraction of AMPARs are heteromers of GluR2 and GluR3 (Wenthold et al., 1996), which are likely similar to SEP–GluR2 AMPARs. In line with our results, GluR2/3-containing AMPARs are known to be constitutively trafficked to synapses. However, because a fraction of endogenous AMPARs are GluR1/2 heteromers, our AMPAR-specific data cannot be directly extrapolated to all AMPARs. Given the differences in trafficking and distribution of GluR1 and GluR2, it would be interesting to examine potential variations in their lateral diffusion. SEP–GluR2 fluorescence distribution does mirror the synaptic targeting of endogenous GluR2, because it is enriched approximately fivefold on the surface of spines compared with dendritic shafts (Fig. 1D). Qualitatively, this enrichment seems to be slightly less with SEP–GluR2 than with antibody staining of endogenous surface GluR2, but this likely reflects the greater signal-to-noise ratio of antibody-labeling techniques, changes in morphology during cell fixation, and, potentially, the artificial clustering of AMPARs caused by application of antibody to live cells (Mammen et al., 1997). Interestingly, there is little SEP–GluR2 in the interior of spine heads (Fig. 1D,E), which mirrors immunoelectron microscopy data on the distribution of endogenous AMPARs (Petralia et al., 2003). Most importantly, although it is difficult to directly compare SPT and FRAP experiments, our calculations of SEP–GluR2 diffusion rates are similar to averages of those measured for individual endogenous AMPARs (Tardin et al., 2003).
Lateral diffusion and vesicular trafficking of AMPARs
Vesicular trafficking is essential for delivery and retrieval of neurotransmitter receptors to synapses (Luscher et al., 1999; Ehlers, 2000; Washbourne et al., 2002; Collingridge et al., 2004; Martin and Henley, 2004). Indeed, membrane trafficking of AMPARs is required for long-term potentiation and long-term depression (Lledo et al., 1998; Luscher et al., 1999; Malinow and Malenka, 2002; Park et al., 2004). However, there is increasing evidence that the sites of membrane trafficking may be outside synapses (Passafaro et al., 2001; Blanpied et al., 2002; Petralia et al., 2003; Ashby et al., 2004b). This begs the question of how proteins get from these sites to the postsynaptic areas of membrane. Our new approach, sampling a population of surface-expressed receptors, demonstrates that a significant mobile pool of AMPARs do continually move in and out of mature spines by lateral diffusion.
The rate of exchange by lateral diffusion is clearly faster than direct delivery by exocytosis can achieve. This is illustrated by the fact that, when lateral diffusion is blocked by cross-linking surface AMPARs, constitutive exocytosis does not contribute any detectable recovery from photobleaching over the time course of a normal FRAP experiment. This is consistent with data suggesting that, in dendrites, delivery from inside the cell to the surface is relatively slow compared with lateral diffusion (Adesnik et al., 2005). It is likely that, after AMPAR delivery to the cell surface, there is relatively rapid mixing of mobile receptors because more than half of the mobile AMPARs in the membrane of the spine head are exchanged within 3 min and those outside the spine are exchanged even more quickly (Fig. 3; Table 1). Such rapid mixing of surface AMPARs suggests that synaptic targeting mechanisms may involve regulation of their lateral diffusion rather than targeting of vesicular trafficking. Indeed, neuronal activation is known to alter the diffusion speed of individual AMPARs (Groc et al., 2004). Interestingly, the rate and extent of constitutive lateral exchange at spines resembles that of constitutive turnover predicted by peptides that block the N-ethylmaleimide-sensitive factor (NSF)–GluR2 interaction (Nishimune et al., 1998; Noel et al., 1999; Lee et al., 2002), and it was recently suggested that NSF may free GluR2 from extrasynaptic membrane anchors to allow lateral diffusion into synaptic areas (Gardner et al., 2005).
Compartmentalization of lateral diffusion at dendritic spines
Much of the processing power of neuronal systems relies on the synapse specificity of signaling and synaptic plasticity. Modification and recruitment or loss of proteins at specific synapses underlies changes in synaptic strength (Lee et al., 2000; Shi et al., 2001). Although initiation of synaptic plasticity is restricted to individual synapses by compartmentalization of cytoplasmic calcium by dendritic spines (Svoboda et al., 1996), many of the upstream effectors and downstream targets are membrane proteins. Our results give the first indication that diffusion of synaptic proteins in the plasma membrane is also compartmentalized in spines. Approximately half of the AMPARs in the spine membrane are remarkably stable. These receptors are effectively retained within the spine for as long as we could measure (>1 h in some cases). It would not be surprising if these AMPARs were stably associated with the PSD, and it has been shown that ∼50% of individual AMPARs in the PSD are completely immobilized (although these SPT measurements could only be made over a much shorter time) (Tardin et al., 2003). The remaining receptors are exchanged for receptors from outside the spine during our experiments, and it seems that at least two processes can regulate diffusion of these mobile AMPARs.
The first process is AMPAR specific and is likely to involve interactions with other postsynaptic proteins near to or at the PSD (Borgdorff and Choquet, 2002). In our experiments, the spine head membrane is likely to include areas associated with the postsynaptic density, perisynaptic areas, and, possibly, other membrane microdomains (Hering et al., 2003; Richards et al., 2004). FRAP measures the averaged motions of AMPARs in all of these regions over an extended period of time. There are a huge number of potential diffusion paths, changes in diffusion speed, and possible transient and more permanent interactions that might influence AMPAR diffusion rate. Our experiments measure the overall effect of these on the distribution of the AMPAR population and show that, on average, an AMPAR inside a spine head will diffuse more slowly than when outside the spine.
The second process is a general compartmentalization mechanism for membrane proteins that depends on a diffusion barrier at the neck of the spine. Because membrane-targeted GFP, which has no specific interactors, is subject to this compartmentalization (Fig. 5), it is likely that any transmembrane or membrane-associated proteins (e.g., PSD95 and glutamate receptor-interacting protein) will be restricted in this way. These findings describe how membrane proteins that undergo biochemical modulation as a result of spine-specific stimulation (e.g., phosphorylation) could be retained within that spine. Furthermore, because these characteristics describe a general compartmentalization mechanism for mushroom spines, they could serve to retain a molecular memory of synapse/spine-specific activation after the termination of the initial signal.
Lateral diffusion is limited at the spine neck (Fig. 3), but the nature of the barrier is not clear. It is likely to be some physical parameter such as molecular crowding in the neck membrane or impedance caused by the cytoskeleton. A recent study showed that the cytoplasmic diffusion barrier imposed by the neck can be regulated by neuronal activity (Bloodgood and Sabatini, 2005). Although cytoplasmic diffusion is much faster than diffusion in membranes, there are intriguing parallels. Spine morphology undergoes both developmental- and activity-dependent changes (Matsuzaki et al., 2004; Nagerl et al., 2004; Zhou et al., 2004), and this may influence the compartmentalization of lateral diffusion and thereby have far-reaching implications for synaptic function and modification.
Footnotes
M. C. Ashby's present address: National Institutes of Health, National Institute of Neurological Disorders and Stroke, 35 Convent Drive, Building 35/Room 3C1008, Bethesda, MD 20892.
We are grateful to the Medical Research Council, the Wellcome Trust, and the European Union (GRIPANNT-Proposal #005320) for financial support. We thank Drs. Andreas Jeromin and Dan Johnston for the cDNA encoding memGFP in pSinRep5(nsP2Ser). We also thank Graham Collingridge and George Banting for comments during the project and John Isaac, Tristan Bouschet, Jack Mellor, Stéphane Martin, Jon Hanley, and Fred Jaskolski for critically reading this manuscript.
References
- Adesnik H, Nicoll RA, England PM (2005). Photoinactivation of native AMPA receptors reveals their real-time trafficking. Neuron 48:977–985. [DOI] [PubMed] [Google Scholar]
- Ashby MC, Ibaraki K, Henley JM (2004a). It's green outside: tracking cell surface proteins with pH-sensitive GFP. Trends Neurosci 27:257–261. [DOI] [PubMed] [Google Scholar]
- Ashby MC, De La Rue SA, Ralph GS, Uney J, Collingridge GL, Henley JM (2004b). Removal of AMPA receptors (AMPARs) from synapses is preceded by transient endocytosis of extrasynaptic AMPARs. J Neurosci 24:5172–5176. [DOI] [PMC free article] [PubMed] [Google Scholar]
- Axelrod D, Koppel DE, Schlessinger J, Elson E, Webb WW (1976). Mobility measurement by analysis of fluorescence photobleaching recovery kinetics. Biophys J 16:1055–1069. [DOI] [PMC free article] [PubMed] [Google Scholar]
- Blanpied TA, Scott DB, Ehlers MD (2002). Dynamics and regulation of clathrin coats at specialized endocytic zones of dendrites and spines. Neuron 36:435–449. [DOI] [PubMed] [Google Scholar]
- Bloodgood BL, Sabatini BL (2005). Neuronal activity regulates diffusion across the neck of dendritic spines. Science 310:866–869. [DOI] [PubMed] [Google Scholar]
- Borgdorff AJ, Choquet D (2002). Regulation of AMPA receptor lateral movements. Nature 417:649–653. [DOI] [PubMed] [Google Scholar]
- Choquet D, Triller A (2003). The role of receptor diffusion in the organization of the postsynaptic membrane. Nat Rev Neurosci 4:251–265. [DOI] [PubMed] [Google Scholar]
- Collingridge GL, Isaac JT, Wang YT (2004). Receptor trafficking and synaptic plasticity. Nat Rev Neurosci 5:952–962. [DOI] [PubMed] [Google Scholar]
- Ehlers MD (2000). Reinsertion or degradation of AMPA receptors determined by activity-dependent endocytic sorting. Neuron 28:511–525. [DOI] [PubMed] [Google Scholar]
- Feder TJ, Brust-Mascher I, Slattery JP, Baird B, Webb WW (1996). Constrained diffusion or immobile fraction on cell surfaces: a new interpretation. Biophys J 70:2767–2773. [DOI] [PMC free article] [PubMed] [Google Scholar]
- Gardner SM, Takamiya K, Xia J, Suh JG, Johnson R, Yu S, Huganir RL (2005). Calcium-permeable AMPA receptor plasticity is mediated by subunit-specific interactions with PICK1 and NSF. Neuron 45:903–915. [DOI] [PubMed] [Google Scholar]
- Gray EG (1959). Electron microscopy of synaptic contacts on dendrite spines of the cerebral cortex. Nature 183:1592–1593. [DOI] [PubMed] [Google Scholar]
- Groc L, Heine M, Cognet L, Brickley K, Stephenson FA, Lounis B, Choquet D (2004). Differential activity-dependent regulation of the lateral mobilities of AMPA and NMDA receptors. Nat Neurosci 7:695–696. [DOI] [PubMed] [Google Scholar]
- Hering H, Lin CC, Sheng M (2003). Lipid rafts in the maintenance of synapses, dendritic spines, and surface AMPA receptor stability. J Neurosci 23:3262–3271. [DOI] [PMC free article] [PubMed] [Google Scholar]
- Kopec CD, Li B, Wei W, Boehm J, Malinow R (2006). Glutamate receptor exocytosis and spine enlargement during chemically induced long-term potentiation. J Neurosci 26:2000–2009. [DOI] [PMC free article] [PubMed] [Google Scholar]
- Lee HK, Barbarosie M, Kameyama K, Bear MF, Huganir RL (2000). Regulation of distinct AMPA receptor phosphorylation sites during bidirectional synaptic plasticity. Nature 405:955–959. [DOI] [PubMed] [Google Scholar]
- Lee SH, Liu L, Wang YT, Sheng M (2002). Clathrin adaptor AP2 and NSF interact with overlapping sites of GluR2 and play distinct roles in AMPA receptor trafficking and hippocampal LTD. Neuron 36:661–674. [DOI] [PubMed] [Google Scholar]
- Lledo PM, Zhang X, Sudhof TC, Malenka RC, Nicoll RA (1998). Postsynaptic membrane fusion and long-term potentiation. Science 279:399–403. [DOI] [PubMed] [Google Scholar]
- Luscher C, Xia H, Beattie EC, Carroll RC, von Zastrow M, Malenka RC, Nicoll RA (1999). Role of AMPA receptor cycling in synaptic transmission and plasticity. Neuron 24:649–658. [DOI] [PubMed] [Google Scholar]
- Malinow R, Malenka RC (2002). AMPA receptor trafficking and synaptic plasticity. Annu Rev Neurosci 25:103–126. [DOI] [PubMed] [Google Scholar]
- Mammen AL, Huganir RL, O'Brien RJ (1997). Redistribution and stabilization of cell surface glutamate receptors during synapse formation. J Neurosci 17:7351–7358. [DOI] [PMC free article] [PubMed] [Google Scholar]
- Martin S, Henley JM (2004). Activity-dependent endocytic sorting of kainate receptors to recycling or degradation pathways. EMBO J 23:4749–4759. [DOI] [PMC free article] [PubMed] [Google Scholar]
- Matsuzaki M, Honkura N, Ellis-Davies GC, Kasai H (2004). Structural basis of long-term potentiation in single dendritic spines. Nature 429:761–766. [DOI] [PMC free article] [PubMed] [Google Scholar]
- Mitchell SJ, Ryan TA (2004). Syntaxin-1A is excluded from recycling synaptic vesicles at nerve terminals. J Neurosci 24:4884–4888. [DOI] [PMC free article] [PubMed] [Google Scholar]
- Moriyoshi K, Richards LJ, Akazawa C, O'Leary DD, Nakanishi S (1996). Labeling neural cells using adenoviral gene transfer of membrane-targeted GFP. Neuron 16:255–260. [DOI] [PubMed] [Google Scholar]
- Nagerl UV, Eberhorn N, Cambridge SB, Bonhoeffer T (2004). Bidirectional activity-dependent morphological plasticity in hippocampal neurons. Neuron 44:759–767. [DOI] [PubMed] [Google Scholar]
- Nimchinsky EA, Sabatini BL, Svoboda K (2002). Structure and function of dendritic spines. Annu Rev Physiol 64:313–353. [DOI] [PubMed] [Google Scholar]
- Nishimune A, Isaac JT, Molnar E, Noel J, Nash SR, Tagaya M, Collingridge GL, Nakanishi S, Henley JM (1998). NSF binding to GluR2 regulates synaptic transmission. Neuron 21:87–97. [DOI] [PubMed] [Google Scholar]
- Noel J, Ralph GS, Pickard L, Williams J, Molnar E, Uney JB, Collingridge GL, Henley JM (1999). Surface expression of AMPA receptors in hippocampal neurons is regulated by an NSF-dependent mechanism. Neuron 23:365–376. [DOI] [PubMed] [Google Scholar]
- Park M, Penick EC, Edwards JG, Kauer JA, Ehlers MD (2004). Recycling endosomes supply AMPA receptors for LTP. Science 305:1972–1975. [DOI] [PubMed] [Google Scholar]
- Passafaro M, Piech V, Sheng M (2001). Subunit-specific temporal and spatial patterns of AMPA receptor exocytosis in hippocampal neurons. Nat Neurosci 4:917–926. [DOI] [PubMed] [Google Scholar]
- Petralia RS, Wang YX, Wenthold RJ (2003). Internalization at glutamatergic synapses during development. Eur J Neurosci 18:3207–3217. [DOI] [PubMed] [Google Scholar]
- Pickard L, Noel J, Duckworth JK, Fitzjohn SM, Henley JM, Collingridge GL, Molnar E (2001). Transient synaptic activation of NMDA receptors leads to the insertion of native AMPA receptors at hippocampal neuronal plasma membranes. Neuropharmacology 41:700–713. [DOI] [PubMed] [Google Scholar]
- Racz B, Blanpied TA, Ehlers MD, Weinberg RJ (2004). Lateral organization of endocytic machinery in dendritic spines. Nat Neurosci 7:917–918. [DOI] [PubMed] [Google Scholar]
- Reits EA, Neefjes JJ (2001). From fixed to FRAP: measuring protein mobility and activity in living cells. Nat Cell Biol 3:E145–E147. [DOI] [PubMed] [Google Scholar]
- Richards DA, De Paola V, Caroni P, Gahwiler BH, McKinney RA (2004). AMPA-receptor activation regulates the diffusion of a membrane marker in parallel with dendritic spine motility in the mouse hippocampus. J Physiol (Lond) 558:503–512. [DOI] [PMC free article] [PubMed] [Google Scholar]
- Sankaranarayanan S, De Angelis D, Rothman JE, Ryan TA (2000). The use of pHluorins for optical measurements of presynaptic activity. Biophys J 79:2199–2208. [DOI] [PMC free article] [PubMed] [Google Scholar]
- Sheng M (2001). Molecular organization of the postsynaptic specialization. Proc Natl Acad Sci USA 98:7058–7061. [DOI] [PMC free article] [PubMed] [Google Scholar]
- Shi S, Hayashi Y, Esteban JA, Malinow R (2001). Subunit-specific rules governing AMPA receptor trafficking to synapses in hippocampal pyramidal neurons. Cell 105:331–343. [DOI] [PubMed] [Google Scholar]
- Svoboda K, Tank DW, Denk W (1996). Direct measurement of coupling between dendritic spines and shafts. Science 272:716–719. [DOI] [PubMed] [Google Scholar]
- Tardin C, Cognet L, Bats C, Lounis B, Choquet D (2003). Direct imaging of lateral movements of AMPA receptors inside synapses. EMBO J 22:4656–4665. [DOI] [PMC free article] [PubMed] [Google Scholar]
- Tashiro A, Yuste R (2003). Structure and molecular organization of dendritic spines. Histol Histopathol 18:617–634. [DOI] [PubMed] [Google Scholar]
- Triller A, Choquet D (2005). Surface trafficking of receptors between synaptic and extrasynaptic membranes: and yet they do move!. Trends Neurosci 28:133–139. [DOI] [PubMed] [Google Scholar]
- Washbourne P, Bennett JE, McAllister AK (2002). Rapid recruitment of NMDA receptor transport packets to nascent synapses. Nat Neurosci 5:751–759. [DOI] [PubMed] [Google Scholar]
- Wenthold RJ, Petralia RS, Blahos J II, Niedzielski AS (1996). Evidence for multiple AMPA receptor complexes in hippocampal CA1/CA2 neurons. J Neurosci 16:1982–1989. [DOI] [PMC free article] [PubMed] [Google Scholar]
- Yuste R, Majewska A, Holthoff K (2000). From form to function: calcium compartmentalization in dendritic spines. Nat Neurosci 3:653–659. [DOI] [PubMed] [Google Scholar]
- Zhou Q, Homma KJ, Poo MM (2004). Shrinkage of dendritic spines associated with long-term depression of hippocampal synapses. Neuron 44:749–757. [DOI] [PubMed] [Google Scholar]