

Abstract
Understanding the transcriptional response to neuronal injury after trauma is a necessary prelude to formulation of therapeutic strategies. We used Serial Analysis of Gene Expression (SAGE) to identify 50,000 sequence tags representing 18,000 expressed genes in the cortex 2 h after traumatic brain injury (TBI). A similar tag library was obtained from sham-operated cortex. The SAGE data were validated on biological replicates using quantitative real-time-PCR on multiple samples at 2, 6, 12, and 24 h after TBI. This analysis revealed that the vast majority of genes showed a downward trend in their pattern of expression over 24 h. This was confirmed for a subset of genes using in situ hybridization and immunocytochemistry on brain sections. Of the overexpressed genes in the trauma library, Nedd4-WW (neural precursor cell expressed, developmentally downregulated) domain-binding protein 5 (N4WBP5) (also known as Ndfip1) is strongly expressed in surviving neurons around the site of injury. Overexpression of N4WBP5 in cultured cortical neurons increased the number of surviving neurons after gene transfection and growth factor starvation compared with control transfections. These results identify N4WBP5 as a neuroprotective protein and, based on its known interaction with the ubiquitin ligase Nedd4, would suggest protein ubiquitination as a possible survival strategy in neuronal injury.
Keywords: traumatic brain injury, cerebral cortex, SAGE, ubiquitination, differential gene expression, apoptosis
Introduction
After traumatic brain injury (TBI), cortical neurons undergo wholesale cellular changes involving inflammation, immune response, release of free radicals, ischemia, apoptosis, and necrotic cell death, among others (Faden, 2002). The transcriptional drivers behind these processes are being keenly elucidated, assisted by gene profiling studies that enable a large number of genes to be studied simultaneously. Typically, these studies are conducted using postmortem tissue obtained 4–24 h after TBI and involve probing mRNA against cDNA arrays or gene chips (Rao et al., 1999; Kobori et al., 2002; Natale et al., 2003; Rall et al., 2003; Yoshiya et al., 2003; Keyvani et al., 2004; Di Giovanni et al., 2005). Together, these studies have confirmed that the trauma response is characterized by altered transcription of genes related to inflammation, apoptosis, neurotransmitter release, cell-cycle activation, gliosis, reactive oxygen metabolism, ionic homeostasis, and neurodegeneration. Of particular interest are genes conferring neuroprotection because the ultimate aim of these studies is to identify candidate molecular pathways as novel targets for therapeutic intervention.
The purpose of the present study is to identify transcriptional changes in the early immediate phase (2 h) after TBI of the cerebral cortex and to characterize genes that confer neuroprotection. This is based on the rationale that the window of opportunity for therapeutic intervention after TBI is linked to the acute period after TBI, and understanding gene expression changes during this critical period may assist in devising strategies to prevent neuronal loss and promote neuronal survival (McIntosh et al., 1998; Faden, 2002). To this purpose, we used Serial Analysis of Gene Expression (SAGE) sequencing that allows simultaneous detection of the expression levels of the entire genome without a priori knowledge of gene sequences (Velculescu et al., 1995). SAGE takes advantage of the fact that a small sequence tag taken from a defined position within the transcript is sufficient to identify the gene [from known cDNA or expressed sequence tagged (EST) sequences], and up to 40 tags can be concatenated and sampled in a single sequencing reaction. SAGE tag frequency is directly proportional to the originating mRNA copy number and is therefore a reliable measure of transcript abundance (Velculescu et al., 1995).
We demonstrate that at least 18,000 gene identities can be retrieved from either sham-control or TBI libraries. Independent validation of mRNA levels using real-time PCR was performed on a subset of differentially expressed genes. The majority of tested genes showed depressed trends of mRNA expression over time (2–24 h period); however, a small number of genes showed the opposite trend of increasing expression during the 24 h period. Of these, we identified Nedd4-WW (neural precursor cell expressed, developmentally down-regulated) domain-binding protein 5 (N4WBP5) (also known as Ndfip1) to be overexpressed specifically in surviving neurons next to the trauma lesion. In survival assays conducted in vitro, overexpression of N4WBP5 in cultured cortical neurons conferred neuroprotection after growth factor deprivation. Based on the suggested function of N4WBP5 as an adaptor protein for Nedd4-mediated ubiquitination, we suggest that increased N4WBP5 expression promotes neuronal survival by ubiquitination of damaged proteins.
Materials and Methods
Experimental brain injury.
Cortical trauma was induced using an experimental model for closed head injury as described previously (Chen et al., 1996). In brief, 12-week-old male C57BL/6 mice were ether anesthetized, and their skulls were exposed by a longitudinal incision of the scalp. Trauma was initiated to a localized region in the left cerebral hemisphere 2 mm lateral to the midline in the midcoronal plane. An electric weight-drop device was fitted with a metal rod of 333 g falling from 2 cm above the cortical surface. The tip of the rod was coated with a silicone tip of 3 mm diameter to prevent penetrating skull fractures. After the procedure, the scalp incision was closed, and the animals were allowed to recover. Sham-operated animals were anesthetized, and their scalps were exposed, followed by closure.
Long SAGE libraries.
After TBI or sham treatment, animals were killed with ether overdose at 2 h. Brains were removed, and left cortical hemispheres were dissected from the underlying structures. Total RNA was isolated from pooled left cortices (n = 6, each group) using Trizol (Invitrogen, Carlsbad, CA). Long SAGE libraries were constructed according to SAGE protocol version B (I-SAGE Long Kit; Invitrogen) (Saha et al., 2002). SAGE tags were extracted using specially developed in-house software that uses statistical modeling to minimize bias in tag counts arising from sequencing errors (Beissbarth et al., 2004). Duplicate ditags, linker sequences, and ribosomal RNA tags were removed.
Statistical analysis of SAGE data.
Fisher's exact test was used to identify differentially expressed genes between trauma and sham-treated cortical libraries. Given the counts for a certain tag and the sum of all tags present in the libraries, Fisher's exact test computed the p value that these counts could have been observed by chance if the tag was equally represented in the libraries under comparison. The Benjamini and Hochberg correction was used to control the false-discovery rate associated with a large-scale multiple-testing environment (Benjamini and Hochberg, 1995). Tags with a corrected p value <0.10 were considered to be significant and were differentially expressed between libraries.
Quantitative real-time PCR.
Genes that were statistically identified by Fisher's exact test to be differentially expressed were independently verified using quantitative real-time (qRT)-PCR (Boon et al., 2004). The relative abundance of mRNA levels at various time points after TBI (2, 6, 12, and 24 h) and sham-control (2 h) were examined using cortical tissues isolated from the area of impact and adjacent sensorimotor region. Eighteen genes were processed on the ABI 7700 sequence-detection system and 94 genes were processed using low-density arrays (Applied Biosystems, Foster City, CA). Primers for the ABI 7700 detection system were designed using Primer Express (Applied Biosystems). Total RNA was isolated from the left cortex at 2 h after sham treatment (n = 5) or 2 h (n = 5), 6 h (n = 3), 12 h (n = 3), or 24 h (n = 3) after TBI using the RNeasy kit (Qiagen, Hilden, Germany). One microgram of total RNA was DNase treated, and 0.3 μg was reverse-transcribed to cDNA using Taqman Reverse Transcription Reagents (Applied Biosystems). qRT-PCR using SYBR green chemistry (Applied Biosystems) was performed on the ABI 7700 sequence detection system. Endogenous 18S ribosomal RNA was used as an internal reference. For low-density arrays, a custom-made Micro Fluidic Card Configuration 7 (containing 94 genes and two endogenous controls, 18S and glyceraldehyde-3-phosphate dehydrogenase) was used to quantify mRNA levels following the protocol of the manufacturer (Applied Biosystems). For the 2 h time point, real-time PCR was also performed using total RNA that was used to construct the SAGE libraries. The cycle number at which the fluorescence emission exceeds the fixed threshold was defined as threshold cycle (CT). CT value was the CT value of the gene of interest subtracted by CT value for 18S. CT value was obtained by subtracting of the mean value of CT obtained from 2 h sham tissues, which served as calibrator from the CT of traumatic tissues. The equation of 2−CT was used to obtain the fold change in mRNA of the gene of interest in TBI relative to sham. Statistic analysis was performed with the one-way ANOVA test.
In situ hybridization and immunohistochemistry.
After real-time PCR analysis, a number of genes were selected for spatial detection of mRNA levels by in situ hybridization and/or immunohistochemistry after TBI or sham treatment. cDNA image clones were transcribed with T3, T7, or SP6 polymerase (Promega, Madison, WI), and riboprobes were labeled with digoxigenin-11–d-UTP (Roche Diagnostics, Penzberg, Germany). Coronal sections (10 μm) were obtained from fresh frozen brains (6 h after TBI or sham treatment), fixed with 4% paraformaldehyde in phosphate buffer (PB) (0.1 m) for 10 min, and acetylated for 10 min before prehybridization for 2 h in hybridization buffer (50% formamide, 5× SSC, 5× Denhardt's solution, 250 μg/ml tRNA, and 500 μg/ml herring sperm DNA) at room temperature. Hybridization (1 μg/ml buffer) was performed overnight at 55°C. Excess probe was removed with 2× SSC at 72°C for 2 h followed by incubation overnight in anti-digoxigenin–alkaline phosphatase (1:1500; Roche Diagnostics, Penzberg, Germany). Alkaline phosphatase activity was revealed by nitroblue tetrazolium chloride (1 mg/ml; Roche Diagnostic) and 5-bromo-4-chloro-3-inodolyl phosphate (0.2 mg/ml; Roche Diagnostic).
Immunohistochemistry was performed on coronal sections (10 μm) obtained from fresh frozen brains collected at 2, 6, 12, or 24 h after TBI or sham treatment. After fixation with 4% paraformaldehyde in 0.1 m PB, sections were blocked in 10% normal horse serum in 0.1 m PB with 0.3% Triton X-100, and then incubated overnight in primary antibodies. All primary antibodies were diluted in 0.1 m PB. Primary antibodies included the following: rabbit polyclonal antibodies raised to Sez-6 (seizure-related gene 6) protein (1:500) (our unpublished observation); a purified rabbit polyclonal antibody raised to N4WBP5– glutathione S-transferase fusion protein (1:100) (Harvey et al., 2002); a purified rabbit polyclonal antibody raised to Nedd4 (1:2000); a mouse monoclonal antibody to Nedd4 (1:100; PharMingen, San Jose, CA); a mouse monoclonal antibody to neuronal-specific nuclear protein (NeuN) (1:200; Chemicon, Temecula, CA); and a mouse monoclonal antibody to the Golgi marker GM130 (1:100; BD Transduction Laboratories, San Diego, CA). To detect apoptotic cells, terminal deoxynucleotidyl transferase-mediated biotinylated UTP nick end labeling (TUNEL) staining was performed according to the instruction of the manufacturer (Roche Diagnostic). Secondary antibodies were Alexa Fluor 594-conjugated goat anti-rabbit IgG (1:500; Invitrogen) and FITC-conjugated donkey anti-mouse IgG (1:500; Jackson ImmunoResearch, West Grove, PA; 1:500).
In vitro cell transfection and growth factor deprivation of neurons.
C57BL/6/J pregnant mice were killed by cervical dislocation. Mouse embryos at embryonic day 13.5 were removed by cesarean section, and the brain was dissected. Strips of cortical tissue were dissected and placed in 0.1% trypsin in PBS for 30 min at 37°C. The cells were further dissociated by passing the suspension up and down a pipette before suspension in DMEM (Invitrogen) supplemented with 10% fetal calf serum. The cells were plated on a poly-d-lysine (Sigma, St. Louis, MO) and laminin (Invitrogen) coated coverslips in a 24-well plate with 200,000 cells in 400 μl of medium per well and cultured with 5% CO2 at 37°C overnight before the medium was replaced by Neurobasal medium (Invitrogen) supplemented with 0.5 mm l-glutamine, 1× B27 supplement (Invitrogen), 50 U/ml penicillin, and 50 μg/ml streptomycin. After 3 d culture, the cells were washed with Neurobasal medium without antibiotics and transfected with one of the following plasmids: pcDNA–Flag–E12, pcDNA3–N4WBP5–Flag, pEF–N-Flag–Bcl-2, or pEF–CrmA (cytokine response modifier A)–N-Flag using Lipofectamine 2000 according to the instructions of the manufacturer (Invitrogen). In brief, 0.8 μg of cDNA and 2 μl of Lipofectamine 2000 were separately diluted in 50 μl of Opti-MEM I reduced serum medium and incubated for 5 min before being mixed together and incubated for another 20 min. The complex was then added to each well and incubated for 6 h at 37°C with 5% CO2. To deprive neurons of growth factors, the medium was replaced with Neurobasal medium lacking supplements and cultured for 18 h before being fixed in 4% paraformaldehyde in 0.1 m PBS for 2 h. Control cultures received the normal growth supplements. Transfected cells were visualized by immunostaining for the fusion Flag reporter using a mouse anti-Flag antibody (1:1000; Sigma, Sydney, Australia). Double staining with TUNEL was performed to score the percentage of apoptotic cells expressing the Flag reporter. To reveal the ratio of TUNEL-positive cells to all cells in culture, bisbenzamide (1 μg/ml) was used to reveal cell nuclei. Three separate sets of experiments for each condition was performed, the neurons were tallied by an investigator blinded to the experimental conditions, and the final results were pooled together for statistical analysis.
Results
Mapping of gene identities and technical replication of SAGE results by qRT-PCR
A total of 50,760 (sham-control) and 52,476 (TBI) long SAGE tags were obtained from each pool of mRNA obtained 2 h after treatment. These tags correlated to ∼18,000 different genes. Comparison of the two libraries with the Fisher's exact test resulted in 545 differentially expressed tags (p < 0.1). Of these, 104 tags (19%) did not match to any annotated sequence, 20 (4%) matched only to genomic sequence, and 420 (77%) matched to an EST, mRNA, or gene sequence. This resulted in 409 unique genes (because multiple tags can match to a single gene). Of the 545 tags, 332 showed reduced number of tags in the TBI library (compared with sham-operated), suggesting that one immediate consequence of trauma is repressed transcription. This observation was reinforced by qRT-PCR experiments to assess mRNA levels of traumatized and control cortical tissue. Table 1 displays the results for 36 genes using the same mRNA samples that were used for constructing the SAGE libraries (Accession indicates the GenBank accession number). The majority of these genes (n = 21) showed a fold-change value of <1 (trauma/control mRNA amplification), confirming that the majority of genes assessed displayed repressed transcription in the 2 h period after TBI.
Table 1.
Real-time PCR validation of SAGE data
| SAGE tag identity | Sham (no. of tags) | TBI (no. of tags) | Fisher's (p value) | Accession | Details | Low-density arrays (fold-change trauma/control) |
|---|---|---|---|---|---|---|
| tcctcttcccccctctg | 22 | 5 | 7.24E-04 | NM_008019 | FK506 binding protein 1a (Fkbp1a) | 0.92 |
| tatgaattaataaatcc | 24 | 57 | 7.44E-04 | NM_144915 | RIKEN cDNA E330036119 gene (E330036I19Rik) | 0.81 |
| tatattaaatccctcct | 110 | 174 | 8.43E-04 | |||
| ctgtaatgatatttatc | 15 | 25 | 2.05E-01 | |||
| ctcagtattgggacact | 5 | 10 | 3.04E-01 | NM_011428 | Synaptosomal-associated protein 25 (Snap25) | 0.99 |
| gatagataattcaaagc | 29 | 62 | 1.52E-03 | ATP synthase, H+ transporting, mitochondrial F1 complex, α subunit, isoform 1 (Atp5a1) | ||
| tgatttctgtacatcag | 2 | 4 | 6.88E-01 | NM_007505 | 0.95 | |
| Williams-Beuren syndrome chromosome region 1 homolog (human) (Wbscr1) | ||||||
| cattgcgtggttgtaat | 18 | 4 | 2.11E-03 | NM_033561 | 1.07 | |
| gcagttgtccatcagcc | 13 | 35 | 3.44E-03 | NM_021710 | Adaptor-related protein complex AP-4, σ 1 (Ap4s1) | 0.67 |
| gatggcacttaaaataa | 7 | 0 | 6.43E-03 | NM_172699 | Forkhead box J3 (Foxj3) | 0.78 |
| tttattaaatgaatgag | 10 | 27 | 8.44E-03 | NM_019986 | Hyaluronic acid binding protein 4 (Habp4) | 1.01 |
| ttgagggggggaggggg | 17 | 38 | 9.85E-03 | NM_023429 | OCIA domain containing 1 (Ociad1) | 0.99 |
| ggatatgtggtgtgtat | 25 | 10 | 1.01E-02 | |||
| ggcaatagagcgcattc | 3 | 2 | 6.79E-01 | NM_007913 | Early growth response 1 (Egr1) | 0.6 |
| Solute carrier family 22 (organic cation transporter), member 17 (Slc22a17) | ||||||
| ccaaccgtctaggagag | 13 | 32 | 1.04E-02 | NM_021551 | 0.75 | |
| ATP synthase, H+ transporting, mitochondrial F1F0 complex, subunit e (Atp5k) | ||||||
| gcatacggcgccaagcg | 20 | 7 | 1.10E-02 | NM_007507 | 0.38 | |
| tgtgtagccagaaaggt | 4 | 16 | 1.24E-02 | NM_009955 | Dihydropyrimidinase-like 2 (Dpysl2) | 0.93 |
| ggcatcatcgttgttgg | 6 | 0 | 1.32E-02 | NM_024200 | Mitofusin 1 (Mfn1) | 0.72 |
| NADH dehydrogenase (ubiquinone) 1 β subcomplex 8 (Ndufb8) | ||||||
| ttctgggtagggcacgt | 6 | 0 | 1.32E-02 | NM_026061 | 0.66 | |
| Potassium voltage-gated channel, shaker-related subfamily, β member 1 (Kcnab1) | ||||||
| cagccagtgtatcagcc | 16 | 5 | 1.47E-02 | NM_010597 | 1.96 | |
| Protease (prosome, macropain) 26S subunit, ATPase 5 (Psmc5) | ||||||
| tccatcaagaagctatg | 6 | 19 | 1.55E-02 | NM_008950 | 0.99 | |
| tagaaccatcttgcagg | 0 | 7 | 1.59E-02 | NM_025912 | RIKEN cDNA 2010011120 gene (2010011120Rik) | 1.48 |
| cagcgggagctggggcc | 10 | 25 | 1.81E-02 | NM_016801 | Syntaxin 1A (brain) (Stx1a) | 0.87 |
| gcactgctgttcccttc | 8 | 1 | 1.85E-02 | NM_010438 | Hexokinase 1 (Hk1) | 0.9 |
| gggttcagctctgcatc | 4 | 15 | 2.00E-02 | NM_019705 | Expressed sequence AL033326 (AL033326) | 0.69 |
| ggacttgccagggaccc | 7 | 20 | 2.03E-02 | NM_175427 | RIKEN cDNA C630035N08 gene (C630035N08Rik) | 0.72 |
| agatttataaaatttga | 5 | 0 | 2.72E-02 | NM_010251 | GABAA receptor, subunit α 4 (Gabra4) | 0.86 |
| Proteasome (prosome, macropain) 26S subunit, non-ATPase, 14 (Psmd14) | ||||||
| tggatgtgcttatgact | 5 | 0 | 2.72E-02 | NM_021526 | 0.59 | |
| tgtcctgtttcagcaaa | 5 | 0 | 2.72E-02 | NM_009120 | SAR1a gene homolog 1 (S. cerevisiae) (Sara1) | 0.82 |
| ccaggagagggcagcta | 5 | 0 | 2.72E-02 | NM_021286 | Seizure related gene 6 (Sez6) | 0.67 |
| ccttgtacataacttgt | 5 | 0 | 2.72E-02 | NM_011386 | SKI-like (Skil) | 0.87 |
| Eukaryotic translation initiation factor 3, subunit 2 (β) (Eif3s2) | ||||||
| gatgtgaccacaacctc | 5 | 0 | 2.72E-02 | NM_018799 | 0.69 | |
| gaaagttggcccaaacc | 13 | 29 | 2.94E-02 | NM_007470 | Apolipoprotein D (Apod) | 0.9 |
| Protein phosphatase 2 (formerly 2A), regulatory subunit B (PR 52), γ isoform (Ppp2r2c) | ||||||
| gccctagtttccagact | 16 | 6 | 3.12E-02 | NM_172994 | 0.84 | |
| ggctaaggccggcttct | 12 | 4 | 4.42E-02 | NM_080640 | Brain and acute leukemia, cytoplasmic (Baalc) | 0.6 |
| taagtagcaaacagggc | 28 | 46 | 8.02E-02 | |||
| agttgcttcttaaattc | 1 | 5 | 2.20E-01 | |||
| cagttataaaaatcagc | 26 | 26 | 8.90E-01 | NM_008410 | Integral membrane protein 2B (Itm2b) | 1.06 |
| gggagcaagccactaag | 9 | 3 | 8.48E-02 | NM_025345 | RIKEN cDNA 0610037P05 | 1.29 |
| ctgcagcttctgtgtta | 3 | 0 | 1.15E-01 | NM_030205 | Coronin 7 (Coro7) | 0.83 |
| tatcccacgcctgctgg | 0 | 4 | 1.26E-01 | NM_016740 | S100 calcium binding protein A11 (calizzarin) (S100a11) | 1.52 |
| cccattcgggcaaggaa | 7 | 4 | 3.76E-01 | NM_011309 | S100 calcium binding protein A1 (S100a1) | 0.6 |
Biological replication of SAGE results over a 24 h time course
To confirm differential expression using multiple biological replicates (n = 3 or n = 5) and to detect time-related expression trends (at 2, 6, 12, and 24 h after trauma), qRT-PCR was performed on cortical tissues after TBI at various time points using the 2 h sham control as a baseline (Table 2; Gene ID indicates GenBank accession number). Only 27 genes showed a statistically significant trend (p < 0.05, one way ANOVA test); of these, 23 genes showed decreasing mRNA levels with time, whereas only four genes showed increasing mRNA levels during the 24 h period after TBI (Table 2, shaded rows). It is noteworthy that, whereas falling mRNA levels for the 23 genes seldom exceed twofold reduction, climbing mRNA levels for the four genes [S100a11 (S100 calcium binding protein A11), N4WBP5, RIM-BP2 (RIMS binding protein 2), and SenP3 (SUMO/sentrin specific protease 3)] reached up to threefold increase over the sham-control baseline (Table 2, shaded rows). The downward trend is detectable by 2 h and continued downward in all cases examined with one exception (early growth response 1) in which there appeared to be an upward spike above baseline level in the 24 h time point. In contrast, upward-trending genes tend to first climb at the 6 h time point and remain high for the rest of the 24 h period (Table 2, shaded rows). Together, these observations suggest that most genes in the sample undergo transcriptional repression within the first 2 h after TBI and this persists for at least 24 h, but, for those genes that are upregulated, the increase in transcription is most notable at the 6 h time point.
Table 2.
Time-course assessment of mRNA levels using qRT-PCR of multiple biological replicates (p < 0.05)

Table 2.
Continues
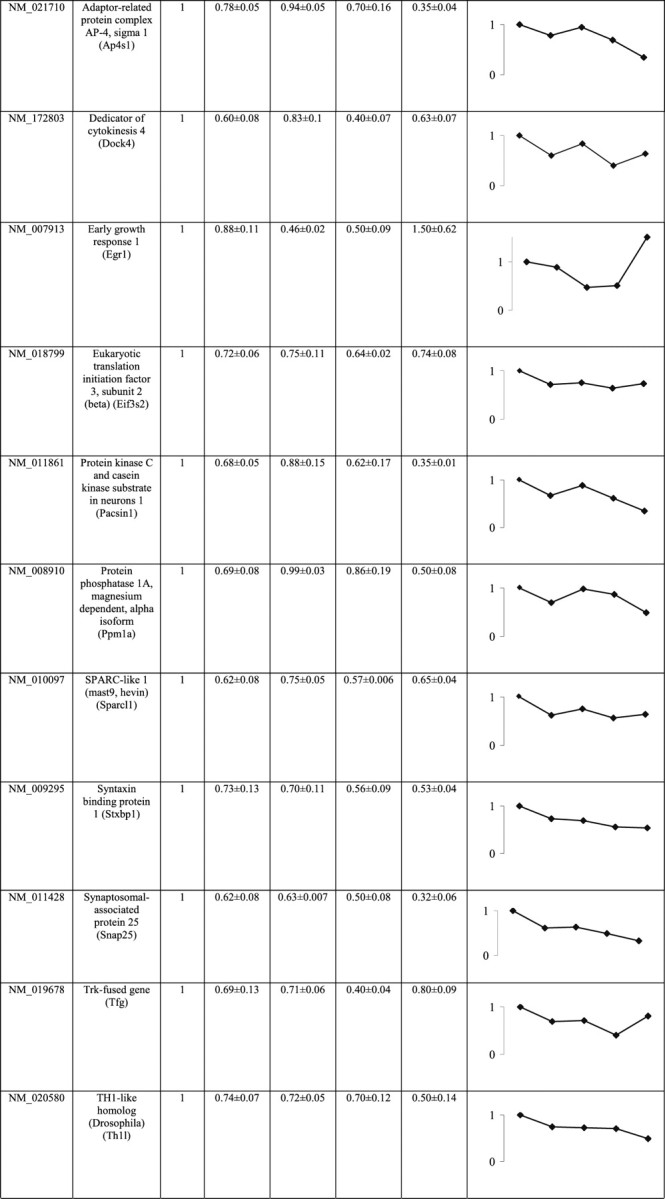
Table 2.
Continued

One-way ANOVA was used.
Spatial localization of differentially expressed genes after TBI
Guided by probe availability, a number of differentially expressed genes were selected for in situ hybridization and immunocytochemistry studies; these include Stx1A (syntaxin 1A), Tde2 (tumor-differentially expressed 2), calcium/calmodulin-dependent kinase inhibitor protein α, Sez-6, and N4WBP5. Sense and antisense riboprobes were used on cortical sections 6 h after TBI and sham-control experiments. In all cases examined, there was reduced mRNA staining in the trauma hemisphere compared with the control hemisphere (results not shown). However, increased mRNA staining was seen in neurons around the lesion site, and these neurons exhibit condensed morphologies (indicative of apoptosis) (results not shown). The exception was provided by N4WBP5, in which staining was increased in neurons that appear to be healthy. To test this, double staining was performed using antibodies to N4WBP5 in conjunction with TUNEL staining to mark cells undergoing DNA fragmentation. As a control, TUNEL staining was also examined in neurons expressing Sez-6 in the contralateral and trauma cortices. In the case of Sez-6, the protein is generally expressed in cortical neurons especially in layers 5 and 6 (Fig. 1A) (Herbst and Nicklin, 1997). Double staining with TUNEL shows high levels of Sez-6 immunoreactivity, but no TUNEL staining was detectable (Fig. 1B). In the trauma hemisphere, the general level of this protein in cortical neurons was reduced except for a small number of neurons in the vicinity of the lesion that showed increased Sez-6 expression (Fig. 1C). Higher-power views show that these deep layer neurons have abundant levels of Sez-6 in the soma and apical dendrite and are positively stained using TUNEL (Fig. 1D,D′). The overlay shows that all Sez-6 neurons in the field of view are also stained with TUNEL (Fig. 1D″). These neurons possess small and rounded cellular morphologies consistent with cytoplasmic condensation and nuclear shrinkage, hallmarks of apoptotic neurons in TBI (Conti et al., 1998).
Figure 1.

Sez-6 expression is increased in apoptotic neurons near the trauma lesion 6 h after TBI. A, In the contralateral cortex, Sez-6 immunoreactivity is normally detected in pyramidal neurons with strong staining intensities in layer 5 and 6 neurons. B, A higher-power view of boxed area in A shows strong Sez-6 immunoreactivity in the absence of TUNEL staining. C, Double staining in the lesioned hemisphere for TUNEL (green) and Sez-6 protein (red). TUNEL staining is detectable in neurons situated in a penumbra region extending for up to 600 μm away from the edge of the lesion. Many neurons in these regions are strongly stained with Sez-6. D, Higher-power view of boxed area in C showing strong Sez-6 staining (arrows) in neurons near the lesion. Note staining in soma and apical processes. D′, Staining for TUNEL in the same boxed area in C indicates extensive DNA damage in neurons close to the lesion. D″, Superimposed views reveal double staining for TUNEL and Sez-6 of the boxed area in C. Sez-6 expression in neurons is invariably associated with TUNEL staining. Scale bars: A, C, 100 μm; B, D, 10 μm.
N4WBP5 is upregulated after TBI
In the hemisphere contralateral to the injury, N4WBP5 is normally expressed at low levels in neuronal cytoplasm (confirmed by double staining with NeuN) (Fig. 2A,A′). In the ipsilateral hemisphere containing the trauma lesion, N4WBP5 protein expression is dramatically increased in neurons surrounding the lesion site (Fig. 2C,D,D′,D″). Double staining for NeuN confirms their neuronal identities (Fig. 2B,B′, arrows). Importantly, none of these neurons in which N4WBP5 is upregulated are positive for TUNEL staining (Fig. 2C,D,D′,D″, arrows), suggesting two possibilities. At the 2 h time point after TBI, very few neurons are overexpressed for N4WBP5 (Fig. 2F). Either these N4WBP5 neurons are damaged but yet to undergo apoptosis at the 2 h time point, or the overexpression of N4WBP5 at this early stage is correlated with neuronal survival. To address this issue, double staining for N4WBP5 and TUNEL was conducted at different time points after TBI. The results showed that staining for N4WBP5 and TUNEL is mutually exclusive at 6, 12, and 24 h after TBI (Fig. 2E–I), ruling out the possibility that staining for N4WBP5 at the 2 h time point is indicative of subsequent neuronal death. Indeed, this mutual exclusion for TUNEL staining was robust for all time points examined (Fig. 2E–I). The number of TUNEL neurons around the lesion (as a ratio of cell nuclei stained with bisbenzamide) increased from a small number at the 2 h time point, rising to a maximum at 12 h and decreasing at 24 h after TBI (Fig. 2J). This trend was mirrored by the ratio of N4WBP5-stained neurons to TUNEL neurons around the lesion (one-way ANOVA, p < 0.005), at the 6, 12, and 24 h time points. This trend also mirrors the fold change in mRNA levels for N4WBP5 detected by qRT-PCR (Fig. 2J). Collectively, these results point to a strong correlation between increased N4WBP5 expression and neuronal survival during the 24 h period after TBI. Alternatively, N4WBP5 at 24 h may mark neurons that were previously TUNEL positive but N4WBP5 negative (at 2 or 6 h) but somehow have recovered from DNA fragmentation and no longer stained for TUNEL as the neuron recovers.
Figure 2.

N4WBP5 expression is upregulated in surviving neurons situated close to the lesion. A, A′, In the contralateral cortex, N4WBP5 in unaffected neurons is coexpressed with NeuN (arrows). B, B′, In the lesioned cortex at 6 h, N4WBP5 overexpression is seen in neurons stained with NeuN (arrows). C, At 6 h after TBI, TUNEL-positive neurons (green) are found close to the lesion for up to 600 μm away from the edge. Neurons stained with N4WBP5 are found both proximal and distal to the lesion. D–D″, Higher-power views of boxed area in C showing increased staining for N4WBP5 in neurons (arrows) proximal to the lesion. These same neurons (arrows) do not stain for TUNEL (D′). A superimposed view (D″) shows that N4WBP5 (arrows) is seldom found in neurons that are TUNEL-positive. E–I, Time course assessment of N4WBP5 staining at 2, 6, 12, and 24 h after TBI. E, In the sham control at 2 h, no TUNEL-positive neurons are detected, whereas N4WBP5 is present at low levels (inset shows higher-power view of a neuron indicated by an arrow). F, At 2 h after TBI, neurons near the lesion show staining for TUNEL, whereas only a few neurons are stained with N4WBP5. G, At 6 h after TBI, an increased number of neurons are stained with N4WBP5. H, At 12 h after TBI, a maximal number of neurons are stained for N4WBP5. I, At 24 h after TBI, there is a reduction in the number of N4WBP5-overexpressing neurons relative to the number of TUNEL-positive neurons. J, Quantification of neurons overexpressing N4WBP5 in relation to neurons stained for TUNEL. Left axis shows that the number of neurons overexpressing N4WBP5, relative to TUNEL-positive cells, is on an upward trend until the 12 h time point, after which it is decreased. A similar trend is observed for the number of TUNEL-positive neurons relative to cells stained by bisbenzamide. The right axis shows that fold change in N4WBP5 mRNA levels trends upward until the 12 h time point, after which it is decreased. Scale bars: A, C, 100 μm; B, D, 10 μm; E–I, 50 μm.
Previous studies have identified N4WBP5 as an adaptor protein for Nedd4, an E3 ubiquitin-protein ligase (Jolliffe et al., 2000; Harvey et al., 2002). Nedd4 functions to mediate poly-ubiquitination of substrate proteins leading to their degradation within the 26S proteasome (Harvey et al., 2002). To investigate an N4WBP5/Nedd4 relationship in TBI, we attempted to localize the cellular compartment of overexpressed N4WBP5 protein near the lesion and correlate this to Nedd4. In the undamaged contralateral hemisphere, N4WBP5 staining in neurons is low level and punctate; this staining pattern is coextensive with the Golgi marker GM130, suggesting the N4WBP5 is localized to the Golgi apparatus (Fig. 3A,A′,A″). In neurons surrounding the lesion, N4WBP5 staining is dramatically increased and appears in a ring-like pattern around the nucleus (Fig. 3B). This staining is superimposed by GM130, suggesting that increased N4WBP5 expression is localized to the Golgi (Fig. 3B,B′,B″). Occasionally, a neuron with overexpressed N4WBP5 is negative for GM130 staining (Fig. 3, insets). A similar picture was observed for Nedd4 staining. In the contralateral hemisphere, Nedd4 is expressed at low levels in adult cortical neurons (Fig. 3C), as reported previously (Kumar et al., 1992). Double staining with GM130 suggest occasional overlap (Fig. 3C′,C″). In contrast, traumatized neurons in the lesioned hemisphere exhibit Nedd4 upregulation (Fig. 3D) around the lesion. Staining with GM130 suggests increased Nedd4 staining in the Golgi compartment in ring-like configurations around the nucleus (Fig. 3D′,D″, arrows). Thus, it would appear that both N4WBP5 and its binding partner Nedd4 are upregulated in the same cortical neurons after injury. This was confirmed by double staining for both N4WBP5 and Nedd4 in lesioned cortical neurons in which both proteins appear to be upregulated (Fig. 4A,A′). Biochemical verification was sought with four separate cortical samples from either sham and trauma animals 12 h after trauma. The Western blots indicate increased levels of N4WBP5 protein in the trauma cortex at the expected size of 26 kDa (Fig. 4B) that is statistically significant across four samples using β-actin bands as a standard (p < 0.05) (Fig. 4C). Western blots were also obtained for Nedd4, with the greatest increase observed for bands at the high molecular mass (Fig. 4D). Statistical comparison, using β-actin bands as loading controls, suggest borderline significance in trauma samples (p < 0.1) (Fig. 4E). Collectively, these studies suggest coregulation of N4WBP5 and Nedd4, a pair of proteins known to be involved in ubiquitination, as a possible strategy for neuronal survival after TBI.
Figure 3.

N4WBP5 protein is found in the Golgi apparatus and is coexpressed with Nedd4, an E3 ubiquitin ligase. A–A″, In the contralateral hemisphere, N4WBP5 is normally detected as punctate staining in cortical neurons. Double staining for the Golgi marker GM130 (A′) reveals that N4WBP5 is expressed in the Golgi apparatus (A″). B–B″, In the lesioned hemisphere, N4WBP5 staining is increased in ring-like configuration, consistent with the staining pattern for GM130 (B′). Occasionally, a neuron staining for N4WBP5 (inset, arrow) is negative for GM130. C–C″, In the contralateral hemisphere, Nedd4 is expressed at low levels in the adult cortex and does not colocalize with GM130 (C″). D–D″, In lesioned hemisphere, Nedd4 expression is upregulated in neurons in a ring-like pattern in register with GM130 immunoreactivity (D″). Scale bar: A–D, 10 μm.
Figure 4.

N4WBP5 and Nedd4 are both upregulated after trauma. A, A′, Both N4WBP5 and Nedd4 are overexpressed in the same cortical neurons (arrows) after trauma. B, C, Western blotting of control and trauma samples (n = 4 for each condition) indicates an increase in band intensity for N4WBP5 at the expected size of 26 kDa. Compared with loading control (β-actin), there is a statistically significant increase in N4WBP5 levels in the 12 h trauma samples (p < 0.05). D, E, Western blots for Nedd4 in sham and trauma samples indicate increased band intensities in the trauma samples (n = 4), although the increase as measured by the 110 kDa band was statistically not significant.
N4WBP5 overexpression promotes neuronal survival after growth factor deprivation (starvation)
To test whether or not the overexpression of N4WBP5 promotes the survival of stressed neurons, cortical neurons in culture were transfected with a series of plasmids containing the Flag reporter plus either N4WBP5 or two other genes that are known to encode for neuroprotective proteins. These include CrmA, a cowpox virus encoding for a protease inhibitor capable of inhibiting neuronal apoptosis after growth factor withdrawal (Gagliardini et al., 1994), and Bcl-2 (B-cell CLL/lymphoma 2), a mitochondrial protein whose expression is capable of preventing or delaying apoptosis in neurons after trophic factor deprivation (Garcia et al., 1992; Allsopp et al., 1993). As a control plasmid, the Flag reporter was fused to the helix–loop–helix transcription factor E12, a gene that is not known for its protective function but for dimerization with other helix–loop–helix genes before DNA binding (Heng and Tan, 2003). Because of differences in transfection efficiencies, the total number of Flag-expressing cells differed from plasmid to plasmid and from experiment to experiment (Fig. 5D). In control experiments with the E12–Flag reporter, growth factor starvation caused an increase in the percentage of TUNEL-positive cells that are also expressing E12–Flag compared with unstarved cells expressing E12–Flag (Fig. 5D). In contrast, overexpression of neuroprotective genes reduced the number of TUNEL-positive cells (stained both red and green) as a percentage of transfected cells revealed by Flag fusion protein (red), whether before or after starvation (Fig. 5D). The level of protection by each of the test genes was variable, with Bcl-2 the most protective compared with E12 (paired t test, p < 0.0001). N4WBP5 was also protective compared with E12 (p < 0.001), and the level of protection appeared to be similar to CrmA (Fig. 5D). The total number of transfected neurons was pooled from three separate experiments, and counting was performed by an investigator blinded to the conditions.
Figure 5.

Overexpression of N4WBP5 in cultured cortical neurons promotes neuronal survival after gene transfection and growth factor deprivation. A, Overexpression of CrmA by Flag reporter (red) is seen in healthy neurons, whereas apoptotic neurons are revealed by staining with TUNEL (green). B, Increased expression of Bcl-2 is revealed by the Flag reporter (red) in healthy neurons, whereas many apoptotic neurons are revealed by the TUNEL stain (green). C, Overexpression of N4WBP5 revealed by the fusion Flag reporter (red) is associated with neuronal survival, whereas adjacent apoptotic neurons are positively stained with TUNEL (green). D, N4WBP5 confers neuroprotection after gene transfection and growth factor starvation in neurons compared with neurons transfected with the control E12 transcription factor (p < 0.001, paired t test comparing N4WBP5 with E12). Two other known neuroprotective genes also showed decreased percentages of TUNEL-positive cells in the transfected population compared with E12, with Bcl-2 the most protective (p < 0.0001 comparing Bcl-2 with E12) and CrmA at a similar level of protection as N4WBP5 (p < 0.05 comparing CrmA with E12). Three separate sets of experiments were performed for each condition, and the total number of transfected neurons were pooled together by an investigator blinded to each condition. Scale bar: A–C, 10 μm.
Discussion
We used SAGE to report that there are at least 18,000 expressed genes in the cortex at 2 h after TBI. In the CNS, SAGE analysis (at the penetration level of 50,000 tags per library) efficiently detects mRNA species present at medium to high abundance (>50 copies of mRNA per cell) (Blackshaw et al., 2001; Evans et al., 2002) with the implication that low-abundance mRNAs (less than five copies per cell) that code for transcription factors, ion channels, synaptic proteins, and neurotransmitter receptors are under-represented in these libraries. Technical and biological verification using real-time PCR confirmed the validity of SAGE data but revealed additional features for the subset of differentially expressed genes (identified by Fisher's exact test, p < 0.1). First, of the 27 genes that gave an amplification product, the majority (23 of 27) showed depressed mRNA levels in the TBI samples. Second, depressed transcription for each of these genes continued to trend downward over a 24 h period, gauged by samples obtained at 2, 6, 12, and 24 h after TBI. By studying trends over time, such analyses provide compelling evidence that TBI is strongly associated with transcriptional repression for at least 24 h. Similar observations using other gene profiling techniques have reported a 2:1 ratio of downregulated versus upregulated genes in rat TBI (Yoshiya et al., 2003), although others have reported opposite results (Rao et al., 2003; Keyvani et al., 2004).
Spatial analysis by in situ hybridization for a subset of genes confirms generalized mRNA reduction in neurons of the traumatized hemisphere except for cells lying close to the lesion in which dying cells appear to show increased expression. It might be argued that a reduction in levels of gene expression observed over time merely reflects increasing cell loss (from necrotic or apoptotic death) over a 24 h period or even mRNA degradation in the samples for SAGE or real-time PCR. This is unlikely because other genes in the set showed up to threefold increase in expression by real-time PCR. Of these, both SenP3 and N4WBP5 are involved in the modification of target proteins, although via very different pathways. SenP3 is a protease for the processing of SUMO (small ubiquitin-related modifier), a protein that conjugates target proteins in a ubiquitin-like manner in cellular pathways involved in the cell cycle, apoptosis, and responses to stress (Yeh et al., 2000; Reverter and Lima, 2005). The precise function of N4WBP5 remains to be elucidated, but it is a Golgi-associated protein that binds to the WW domains of Nedd4, an ubiquitin ligase, and is believed to be an adaptor protein for sorting and trafficking of proteins for ubiquitination (Harvey et al., 2002). In the nervous system, protein ubiquitination is a potent mechanism not only for targeting unwanted proteins for destruction but for spatial and temporal control of protein activity (DiAntonio and Hicke, 2004).
The overexpression of N4WBP5 in surviving neurons in vivo and its ability to neuroprotect stressed neurons in vitro are significant and novel findings. By what mechanisms can N4WBP5 be neuroprotective? Although these are at present unknown, lessons from its yeast homolog bypass superoxide dismutase deficiency-2 (Bsd2) suggests at least two possible mechanisms for protection against cell death. First, Bsd2 is able to detect misfolded and damaged proteins in the endoplasmic reticulum and tag them with ubiquitin [with ubiquitin ligase Rsp5 (repeat sequence probe 5), the yeast homolog of Nedd4] for destruction in the Golgi (Hettema et al., 2004). Second, in a situation in which excessive ionic influx is potentially poisonous, Bsd2 is able to bind ion transporters for ubiquitination (and degradation) by Rsp5 (Liu and Culotta, 1999). These mechanisms suggest that N4WBP5 acts as an adaptor protein to allow Nedd4 to access target proteins that do not contain Nedd4 binding motifs. In the current context, the interaction of N4WBP5 and its partner Nedd4 is likely to be involved in substrate regulation of proteins targeted for ubiquitination and proteasome degradation after TBI. In the uninjured hemisphere, basal levels of N4WBP5 in the Golgi is punctate in appearance, whereas its interacting partner Nedd4 appears to be cytoplasmic. In the trauma hemisphere, both proteins are upregulated and immunostaining is coextensive in ring-like patterns around the nucleus. This is suggestive of Nedd4 recruitment from the cytoplasm into the Golgi apparatus (confirmed by GM130 staining). This change in Nedd4 cellular compartmentalization is consistent with the notion that, together, these proteins provide a major destruction pathway to clear harmful misfolded proteins in surviving neurons. In addition, they could serve to counter the accumulation of proapoptotic proteins, including Apaf-1 (apoptotic protease activating factor 1) and caspases 2, 3, 7, 8, and 12, all of which are known to be highly regulated in TBI (O'Dell et al., 2000; Beer et al., 2001; Yakovlev et al., 2001; Larner et al., 2004, 2005). Finally, ubiquitination is known to be pivotal for regulating a whole range of synaptic processes, including development, pruning, plasticity, and protein turnover in synaptic membranes (DiAntonio and Hicke, 2004). Hence, disruption of synapses after TBI may also be a catalyst for increased N4WBP5/Nedd4 expression.
Occasionally, both N4WBP5 and TUNEL are coexpressed in the same neurons after trauma. However, N4WBP5 expression in these neurons were low in level and punctate in appearance (as opposed to ring-like patterns). This observation would suggest that, once a neuron acquires a ring-like pattern of N4WBP5 overexpression, it is unlikely to become TUNEL positive at subsequent time points; otherwise, intermediate time points would display neurons double stained with both TUNEL and N4WBP5 (in ring-like pattern). One scenario is that upregulation of N4WBP5 provides an effective and cell-autonomous strategy for neuronal survival. By the same token, it is unlikely that any of the TUNEL-positive neurons seen at 2 h would later lose their TUNEL staining and become healthy again by acquiring ring-like staining for N4WBP5. This line of reasoning would suggest that the key to neuronal survival may be initiation of N4WBP5 overexpression, before the onset of DNA fragmentation from apoptosis. So what determines whether a neuron overexpresses N4WBP5 after injury? Because N4WBP5 neurons are evenly scattered in the penumbra region, there is no correlation with the distance from the edge of the lesion. The temporal profile of expression suggests that the largest number of N4WBP5 overexpressing neurons are found at 12 h after trauma; this coincides with the time point when the largest ratio (to bisbenzamide-stained cells) of TUNEL-positive neurons are observed near the lesion. By implication, this finding suggests that, between 2 and 12 h, many neurons in the penumbra region are in a nondeterminative state, and these neurons are confronted with a choice between survival or death. Practically, this may serve to be a window of opportunity for therapeutic intervention using N4WBP5 overexpression to enhance neuronal survival. This rationale is supported by the observation that overexpression of N4WBP5 in cultured cortical neurons confers increased neuroprotection after stress induced by growth factor starvation. When benchmarked against CrmA and Bcl-2, two known neuroprotective proteins, N4WBP5 showed a similar level of protection as CrmA. Given that the molecular pathways for all three proteins involved in neuroprotection are dissimilar, this comparison is not strictly valid but nonetheless provides an indication that N4WBP5 offers neuroprotection that is at least at par to the current benchmarks.
Footnotes
This work was supported by a program grant and medical genomics grant from the National Health and Medical Research Council, a Kenneth Myer Foundation Grant, and the Victorian Trauma Foundation. T.B. received a fellowship from the Deutsche Forschungsgemeinschaft and a National Health and Medical Research Council Transitional Institute Grant. H.S.S. received a Nossal Leadership Fellowship. Most DNA sequencing of SAGE libraries was performed by the Australian Genome Research Facility, which was established through the Commonwealth-funded Major National Research Facilities program.
References
- Allsopp TE, Wyatt S, Paterson HF, Davies AM (1993). The proto-oncogene bcl-2 can selectively rescue neurotrophic factor-dependent neurons from apoptosis. Cell 73:295–307. [DOI] [PubMed] [Google Scholar]
- Beer R, Franz G, Krajewski S, Pike BR, Hayes RL, Reed JC, Wang KK, Klimmer C, Schmutzhard E, Poewe W, Kampfl A (2001). Temporal and spatial profile of caspase 8 expression and proteolysis after experimental traumatic brain injury. J Neurochem 78:862–873. [DOI] [PubMed] [Google Scholar]
- Beissbarth T, Hyde L, Smyth GK, Job C, Boon WM, Tan SS, Scott HS, Speed TP (2004). Statistical modeling of sequencing errors in SAGE libraries. Bioinformatics 20:[Suppl 1], I31–I39. [DOI] [PubMed] [Google Scholar]
- Benjamini Y, Hochberg Y (1995). Controlling the false discovery rate: a proactival and powerful approach to multiple testing. J R Statist Soc Ser B 57:289–300. [Google Scholar]
- Blackshaw S, Fraioli RE, Furukawa T, Cepko CL (2001). Comprehensive analysis of photoreceptor gene expression and the identification of candidate retinal disease genes. Cell 107:579–589. [DOI] [PubMed] [Google Scholar]
- Boon WM, Beissbarth T, Hyde L, Smyth G, Gunnersen J, Denton DA, Scott H, Tan SS (2004). A comparative analysis of transcribed genes in the mouse hypothalamus and neocortex reveals chromosomal clustering. Proc Natl Acad Sci USA 101:14972–14977. [DOI] [PMC free article] [PubMed] [Google Scholar]
- Chen Y, Constantini S, Trembovler V, Weinstock M, Shohami E (1996). An experimental model of closed head injury in mice: pathophysiology, histopathology, and cognitive deficits. J Neurotrauma 13:557–568. [DOI] [PubMed] [Google Scholar]
- Conti AC, Raghupathi R, Trojanowski JQ, McIntosh TK (1998). Experimental brain injury induces regionally distinct apoptosis during the acute and delayed post-traumatic period. J Neurosci 18:5663–5672. [DOI] [PMC free article] [PubMed] [Google Scholar]
- Di Giovanni S, Movsesyan V, Ahmed F, Cernak I, Schinelli S, Stoica B, Faden AI (2005). Cell cycle inhibition provides neuroprotection and reduces glial proliferation and scar formation after traumatic brain injury. Proc Natl Acad Sci USA 102:8333–8338. [DOI] [PMC free article] [PubMed] [Google Scholar]
- DiAntonio A, Hicke L (2004). Ubiquitin-dependent regulation of the synapse. Annu Rev Neurosci 27:223–246. [DOI] [PubMed] [Google Scholar]
- Evans SJ, Datson NA, Kabbaj M, Thompson RC, Vreugdenhil E, De Kloet ER, Watson SJ, Akil H (2002). Evaluation of Affymetrix Gene Chip sensitivity in rat hippocampal tissue using SAGE analysis. Serial analysis of gene expression. Eur J Neurosci 16:409–413. [DOI] [PubMed] [Google Scholar]
- Faden AI (2002). Neuroprotection and traumatic brain injury: theoretical option or realistic proposition. Curr Opin Neurol 15:707–712. [DOI] [PubMed] [Google Scholar]
- Gagliardini V, Fernandez PA, Lee RK, Drexler HC, Rotello RJ, Fishman MC, Yuan J (1994). Prevention of vertebrate neuronal death by the crmA gene. Science 263:826–828. [DOI] [PubMed] [Google Scholar]
- Garcia I, Martinou I, Tsujimoto Y, Martinou JC (1992). Prevention of programmed cell death of sympathetic neurons by the bcl-2 proto-oncogene. Science 258:302–304. [DOI] [PubMed] [Google Scholar]
- Harvey KF, Shearwin-Whyatt LM, Fotia A, Parton RG, Kumar S (2002). N4WBP5, a potential target for ubiquitination by the Nedd4 family of proteins, is a novel Golgi-associated protein. J Biol Chem 277:9307–9317. [DOI] [PubMed] [Google Scholar]
- Heng JIK, Tan S-S (2003). The role of class 1 HLH genes in neural development—have they been overlooked? BioEssays 25:709–716. [DOI] [PubMed] [Google Scholar]
- Herbst R, Nicklin MJ (1997). SEZ-6: promoter selectivity, genomic structure and localized expression in the brain. Brain Res Mol Brain Res 44:309–322. [DOI] [PubMed] [Google Scholar]
- Hettema EH, Valdez-Taubas J, Pelham HR (2004). Bsd2 binds the ubiquitin ligase Rsp5 and mediates the ubiquitination of transmembrane proteins. EMBO J 23:1279–1288. [DOI] [PMC free article] [PubMed] [Google Scholar]
- Jolliffe CN, Harvey KF, Haines BP, Parasivam G, Kumar S (2000). Free in PMC Identification of multiple proteins expressed in murine embryos as binding partners for the WW domains of the ubiquitin-protein ligase Nedd4. Biochem J 351:557–565. [PMC free article] [PubMed] [Google Scholar]
- Keyvani K, Sachser N, Witte OW, Paulus W (2004). Gene expression profiling in the intact and injured brain following environmental enrichment. J Neuropathol Exp Neurol 63:598–609. [DOI] [PubMed] [Google Scholar]
- Kobori N, Clifton GL, Dash P (2002). Altered expression of novel genes in the cerebral cortex after experimental brain injury. Brain Res Mol Brain Res 104:148–158. [DOI] [PubMed] [Google Scholar]
- Kumar S, Tomooka Y, Noda M (1992). Identification of a set of genes with developmentally down-regulated expression in the mouse brain. Biochem Biophys Res Commun 185:1155–1161. [DOI] [PubMed] [Google Scholar]
- Larner SF, Hayes RL, McKinsey DM, Pike BR, Wang KK (2004). Increased expression and processing of caspase-12 after traumatic brain injury in rats. J Neurochem 88:78–90. [DOI] [PubMed] [Google Scholar]
- Larner SF, McKinsey DM, Hayes RL, Wang KK (2005). Caspase 7: increased expression and activation after traumatic brain injury in rats. J Neurochem 94:97–108. [DOI] [PubMed] [Google Scholar]
- Liu XF, Culotta VC (1999). Mutational analysis of Sacchromyces cerevisiae Smf1p, a member of the Nramp family of metal transporters. J Mol Biol 289:885–891. [DOI] [PubMed] [Google Scholar]
- McIntosh TK, Juhler M, Wieloch T (1998). Novel pharmacologic strategies in the treatment of experimental traumatic brain injury. J Neurotrauma 15:731–769. [DOI] [PubMed] [Google Scholar]
- Natale JE, Ahmed F, Cernak I, Stoica B, Faden AI (2003). Gene expression profile changes are commonly modulated across models and species after traumatic brain injury. J Neurotrauma 20:907–927. [DOI] [PubMed] [Google Scholar]
- O'Dell DM, Raghupathi R, Crino PB, Eberwine JH, McIntosh TK (2000). Traumatic brain injury alters the molecular fingerprint of TUNEL-positive cortical neurons in vivo: a single-cell analysis. J Neurosci 20:4821–4828. [DOI] [PMC free article] [PubMed] [Google Scholar]
- Rall JM, Matzilevich DA, Dash PK (2003). Comparative analysis of mRNA levels in the frontal cortex and the hippocampus in the basal state and in response to experimental brain injury. Neuropathol Appl Neurobiol 29:118–131. [DOI] [PubMed] [Google Scholar]
- Rao VL, Dogan A, Bowen KK, Dempsey RJ (1999). Traumatic injury to rat brain upregulates neuronal nitric oxide synthase expression and l-[3H]nitroarginine binding. J Neurotrauma 16:865–877. [DOI] [PubMed] [Google Scholar]
- Rao VL, Dhodda VK, Song G, Bowen KK, Dempsey RJ (2003). Traumatic brain injury-induced acute gene expression changes in rat cerebral cortex identified by GeneChip analysis. J Neurosci Res 71:208–219. [DOI] [PubMed] [Google Scholar]
- Reverter D, Lima CD (2005). Insights into E3 ligase activity revealed by a SUMO-RanGAP1-Ubc9-Nup358 complex. Nature 435:687–692. [DOI] [PMC free article] [PubMed] [Google Scholar]
- Saha S, Sparks AB, Rago C, Akmaev V, Wang CJ, Vogelstein B, Kinzler KW, Velculescu VE (2002). Using the transcriptome to annotate the genome. Nat Biotechnol 20:508–512. [DOI] [PubMed] [Google Scholar]
- Velculescu VE, Zhang L, Vogelstein B, Kinzler KW (1995). Serial analysis of gene expression. Science 270:484–487. [DOI] [PubMed] [Google Scholar]
- Yakovlev AG, Ota K, Wang G, Movsesyan V, Bao WL, Yoshihara K, Faden AI (2001). Differential expression of apoptotic protease-activating factor-1 and caspase-3 genes and susceptibility to apoptosis during brain development and after traumatic brain injury. J Neurosci 21:7439–7446. [DOI] [PMC free article] [PubMed] [Google Scholar]
- Yeh ET, Gong L, Kamitani T (2000). Ubiquitin-like proteins: new wines in new bottles. Gene 248:1–14. [DOI] [PubMed] [Google Scholar]
- Yoshiya K, Tanaka H, Kasai K, Irisawa T, Shiozaki T, Sugimoto H (2003). Profile of gene expression in the subventricular zone after traumatic brain injury. J Neurotrauma 20:1147–1162. [DOI] [PubMed] [Google Scholar]