

Abstract
Regeneration of receptor cells and subsequent functional recovery after damage in the auditory and vestibular systems of many vertebrates is well known. Spontaneous regeneration of mammalian hair cells does not occur. However, recent approaches provide hope for similar restoration of hearing and balance in humans after loss. Newly regenerated hair cells receive afferent terminal contacts, yet nothing is known about how reinnervation progresses or whether regenerated afferents finally develop normal termination fields. We hypothesized that neural regeneration in the vestibular otolith system would recapitulate the topographic phenotype of afferent innervation so characteristic of normal development. We used an ototoxic agent to produce complete vestibular receptor cell loss and epithelial denervation, and then quantitatively examined afferent regeneration at discrete periods up to 1 year in otolith maculas. Here, we report that bouton, dimorph, and calyx afferents all regenerate slowly at different time epochs, through a progressive temporal sequence. Furthermore, our data suggest that both the hair cells and their innervating afferents transdifferentiate from an early form into more advanced forms during regeneration. Finally, we show that regeneration remarkably recapitulates the topographic organization of afferent macular innervation, comparable with that developed through normative morphogenesis. However, we also show that regenerated terminal morphologies were significantly less complex than normal fibers. Whether these structural fiber changes lead to alterations in afferent responsiveness is unknown. If true, adaptive plasticity in the central neural processing of motion information would be necessitated, because it is known that many vestibular-related behaviors fully recover during regeneration.
Keywords: regeneration, vestibular, receptor, motion detection, spatial orientation, afferent
Introduction
Compensatory behaviors, such as oculomotor responses and postural adjustments, as well as higher level processing functions such as spatial orientation and path integration, all depend on a functioning vestibular system. Trauma, disease, or toxicity can produce damage to the vestibular receptor system, with immediate functional disabilities resulting. For example, ototoxic antibiotics produce vestibular sensory cell death and receptor denervation (Berg, 1951; Wersäll and Hawkins, 1962; Lindeman, 1969a,b), followed by severe dysfunction (Wersäll and Hawkins, 1962; Carey et al., 1996, 2002; Goode et al., 1999; Hirvonen et al., 2005). It is now firmly established that cochlear and vestibular sensory hair cells spontaneously regenerate after damage in fish, amphibians, and birds (Corwin and Cotanche, 1988; Weisleder and Rubel, 1992, 1993; Baird et al., 1993), and these regenerated hair cells are contacted by new afferent and efferent terminals (Ryals and Westbrook, 1994; Masetto and Correia, 1997b; Hennig and Cotanche, 1998). In addition, functional recovery of vestibular hair cells (Masetto and Correia, 1997a), afferent sensitivity to motion (Li and Correia, 1998; Boyle et al., 2002), and vestibular behavioral responses (Jones and Nelson, 1992; Carey et al., 1996; Goode et al., 1999; Dickman and Lim, 2004) all correlate with regenerative development in birds. However, little is known about how reinnervation progresses and whether regenerated afferents ultimately develop normal termination fields.
Essential questions regarding the regeneration process remain to be addressed. For example, how are vestibular response recoveries in regenerated animals produced? There are two fundamentally different possibilities. First, morphological substrates underlying the regenerated primary afferent responses could return to a structural form that is comparable with that of normal animals. If so, then the central neuronal mechanisms controlling vestibular reflexes, like the vestibulo-ocular (VOR) and vestibulocollic (VCR) responses, would already be developed. Behavioral responses would return proportionally as the afferent reinnervation of the neuroepithelium proceeds. However, the second possibility is that regenerated hair cell and afferent innervations are morphologically atypical, which could alter their spatial and dynamic response properties. If true, then central adaptive plasticity must occur to accommodate functional behavioral recovery (Anastasio, 1992; Lisberger et al., 1994). The return to normal function would be reestablished through a completely novel set of afferent innervations and responses, coupled with quite different signal processing mechanisms in the vestibular nuclei and CNS.
In the current study, we hypothesized that neural regeneration would recapitulate the normal topographic phenotype of hair cell distribution and afferent innervation after recovery in adult pigeons (Si et al., 2003; Zakir et al., 2003). We used an ototoxic agent to produce complete vestibular hair cell loss and total denervation (Kopke et al., 1996; Dye et al., 1999; Frank et al., 1999), and then examined receptor regeneration for up to 1 year of recovery. Hair cell distributions and quantitative comparisons of afferent innervation patterns were performed. Here, we report that much of the unique macular topography does regenerate similar to that observed with normative morphogenesis. However, we also show that regenerated afferent morphologies for individual fibers differ significantly from that of the mature normal phenotype.
Materials and Methods
Animals.
All experiments were conducted in adult pigeons (Columbia livia) that ranged in age from 1 to 1.5 years at the beginning of the experiment. The experimental protocols were approved by the Institutional Animal Care and Usage Committee at Washington University and conformed to guidelines established by the National Institutes of Health regarding animal use.
Streptomycin delivery.
To produce a complete lesion of all vestibular hair cells and denervation of the receptor epithelia, intralabyrinthine streptomycin was administered bilaterally. Each bird was anesthetized using isoflurane gas (3% in O2) via endotracheal intubation. An incision was made over the mastoid bone behind the external auditory orifice, and the skin was retracted. A rectangular shaped bone flap of mastoid cortex was resected, exposing the underlying bony labyrinth. A small opening (0.35 mm diameter) into the vestibule promontory was made, immediately posterior to the oval window. A single 2 mg dose of streptomycin (1 μl total volume in a frozen pellet) was carefully placed through the opening and into the perilymphatic space. The opening was sealed with a muscle plug, and then reinforced with gel foam and bone wax. The mastoid bone flap was replaced, and the wound was sutured closed. The procedure was then repeated on the opposite side. Buprinorphine (0.08 mg/kg, i.m.) was given to alleviate postoperative pain, and the animal was returned to its home cage. Each bird was monitored for behavioral symptoms of vestibular lesion and for weight loss. Most animals were hand fed three times daily to prevent dehydration and starvation for ∼1–2 weeks until spontaneous feeding resumed.
Neural tracer application.
All animals were allowed to recover for a period extending between 1 week to 12 months after streptomycin delivery. Groups of four animals each were examined at 1, 2, 4, 6, 8, 12, 24, 36, and 52 weeks post-streptomycin treatment (PST). Ten days before the end of the specific recovery period for each bird, biotin dextran amine (BDA) was injected into the vestibular nuclei and allowed to retrogradely transport along vestibular afferents (Si et al., 2003; Zakir et al., 2003). For the 1-week-regeneration animals, the BDA injection occurred 3 d before the streptomycin application. For the injection, a small opening was first made in the parietal bone, and a glass micropipette filled with BDA (10% in saline) was lowered into the brain using predetermined coordinates for the vestibular nuclei (Dickman and Fang, 1996). BDA was iontophoretically passed into the brain with positive current (8 μA for 15 min). After cessation of injection current, the electrode was allowed to remain in position for a few minutes, and a small negative backing current (0.02 μA) was applied. The electrode was then removed, gel foam was placed over the brain surface, and the skin was sutured closed. A single dose of buprenorphine (0.08 mg/kg, i.m.) was administered for postoperative pain, and the animal was returned to its home cage.
Histology.
After 10 d of post-BDA injection survival, the birds were reanesthetized with pentobarbital sodium (20 mg/kg, i.v.), and the bony labyrinths were exposed. The horizontal and posterior canals were opened, and intralabyrinthine perfusion was performed using 3% glutaraldehyde, 2% paraformaldehyde, and 1% acrolein in 0.1 m sodium cacodylate buffer. The animal was then transcardially perfused with sodium nitrite (1%) in saline (250 ml), followed by 750 ml of 2% glutaraldehyde/1% paraformaldehyde fixative. The whole head was placed in the same aldehyde solution for 24 h. The membranous labyrinth was then excised and dissected free into end organs (three canals, utricle, saccule, and lagena). The otoconial membrane and otoconia were removed using a fluid buffer stream. The saccular and utricular maculas were processed for BDA using a modified diaminobenzidine (DAB) procedure (Brandt and Apkarian, 1992). The reacted maculas were first photographed in whole mount using a Nikon (Melville, NY) light microscope. Next, the maculas were embedded into plastic (Durcupan) and serially sectioned (10 μm thickness) using a rotary microtome. Sections were mounted on glass slides and counterstained (Richardson et al., 1960).
To assess the amount of apoptosis occurring in both normal and regeneration maculas, DNA undergoing fragmentation were visualized in several animals using fluorescein-tagged terminal deoxynucleotidyl transferase to label the free 3′-OH ends of cleaved DNA [terminal deoxynucleotidyl transferase-mediated biotinylated UTP nick end labeling (TUNEL) method; In Situ Cell Death Detection kit; Roche, Basel, Switzerland]. The labyrinths were perfused with 4% paraformaldehyde and rinsed, and then the maculas were dissected free. Whole-mount tissues were reacted for TUNEL using DAB as the chromogen (Kil et al., 1997).
Scanning electron microscopy preparation.
In several animals for each of the different PST time points, the saccular and utricular maculas were prepared for examination by scanning electron microscopy. After removing otoconia and otolith membranes, the tissue was rinsed in distilled water, and dehydrated using a series of graded acetones (10 min each in 70, 90, and 95% acetone) followed by two washings of 15 min in 100% acetone. The tissue was then incubated twice in 100% tetramethylsilane (TMS) for 15 min. Finally, the tissue was dried (60°C for 30 min), allowing the TMS to sublimate (Reville and Cotter, 1991). The dried maculas were mounted on aluminum studs and gold coated.
Afferent innervation.
Individual vestibular afferents innervating the utricular and saccular maculas were quantified as to location and terminal innervation pattern from sectioned tissue using video microscopy and an image analysis three-dimensional (3D) reconstruction program (Neurolucida; MicroBrightField, Williston, VT). Several parameters for each section were measured including the section width, the relative location and width of the striola region, and the morphological reversal points. For each pigeon saccular and utricular macula, a planar map of the epithelial surface was plotted using the measured values.
Afferent fibers that were darkly stained and sufficiently isolated for accurate reconstruction were traced to establish the complete morphological structure of the terminal innervation in the macular epithelium. Afferents with light staining (ghost fibers) or those that severely overlapped other afferents were not traced. The regional location of each reconstructed afferent relative to the epithelial borders and the reversal line was obtained. All 3D reconstructions were done using 60× magnification. A number of morphological parameters for each of the reconstructed afferents were quantified, including the following: (1) fiber diameter: average diameter of the first 5 μm of fiber length immediately before penetration into the receptor epithelium (see Fig. 1a); (2) terminal fiber length: summation of all branching segments; (3) terminal branches: number of branch segments per fiber; (4) branch order: number of branch levels past the initial fiber segment (branch order 1); (5) fiber volume: summation of all branch segment volumes for entire fiber length; (6) growth cones: number of growth cones per fiber. Growth cones were generally large conical or elliptical structures, except for digitiform processes that often appeared as elongated finger projections with either swellings or pointed endings (see Results); (7) bouton terminals: number of en passant and boutons terminaux per fiber. The distinction between growth cones and terminal boutons was somewhat arbitrary but was based on observations from terminals existing in normally developed mature birds (Si et al., 2003; Zakir et al., 2003). In those studies, we observed that most bouton terminals were characterized by spherical, rounded, or occasional elliptical structures that were typically <2 μm in diameter. Because no analyses at the transmission electron microscopic level were performed, synaptic contacts indicative of terminal boutons could not be certified in the present analyses. When a decision regarding a terminal structure was ambiguous, we conservatively opted to classify the terminal as a bouton; (8) calyceal terminals: number of calyceal terminals per fiber; (9) calyx hair cells: total number of type I hair cells contained in calyceal terminals per fiber; (10) innervation area: calculated by first rotating the reconstructed fiber image in 3D space until an apical view was obtained. Next, the perimeter of the image was drawn using a contoured polygon planimeter (Neurolucida) in the plane of the macular surface. The area of the polygon was then used as innervation area in square micrometers; (11) innervation density: calculated by dividing the total terminals (number of type I hair cells plus number of bouton terminals) by the innervation area.
Figure 1.

Calyx, dimorph, and bouton afferents in normal pigeons. Photomicrographs and anatomical reconstructions are illustrated for three BDA-labeled afferents. Saccular calyx (a–c), utricular dimorph (d–f), and utricular bouton (g–i) afferents with transverse section micrographs (a, d, g) and reconstructions for the transverse (b, e, h) and surface (c, f, i) views, respectively. In a, the medium black line indicates length of fiber below the sensory epithelium penetration point that was used to calculate the average fiber diameter In the surface reconstructions, calyceal contours were drawn at focal plane intervals of 1 μm (thin black lines), and innervation areas were measured using a digital planimeter around the terminal pattern (blue lines). In h, the numbers indicate the branch order of fiber segments. Scale bar, 10 μm.
Statistical analyses.
All afferents were first divided into three main groups based on morphological innervation patterns, including calyx, dimorph, and bouton afferent classes. Comparisons between afferents in normal and regenerated otolith maculas were made for each of the three main groups using ANOVAs with commercial software (Statistica; Statsoft, Tulsa, OK). All post hoc comparisons were made using the Sheffé follow-up test. Proportional relationships were investigated using Pearson product-moment correlations.
Results
Innervation of the vestibular maculas in normal birds
In two recent works from our laboratory, the regional distribution and terminal morphology of vestibular afferents innervating the utricular and saccular maculas of adult normal pigeons were examined (Si et al., 2003; Zakir et al., 2003). The data obtained from these studies were used in the current investigation for comparisons against the innervation patterns of regenerated fibers. In both studies, the developmental age of the birds was approximately the same, spanning 1.5–3 years posthatch development. Salient to the present findings, a brief review of the afferent terminal morphologies innervating the pigeon otolith maculas is provided. As shown in Figure 1, birds have three classes of terminal innervation patterns for vestibular afferents, as in all amniote vertebrates (Ramon y Cajal, 1909; Lorente de Nó, 1926; Fernandez et al., 1988, 1990, 1995; Schessel et al., 1991; Brichta and Peterson, 1994; Si et al., 2003; Zakir et al., 2003). Calyx units innervate type I hair cells with a calyceal terminal that encloses one or several hair cells, with small terminal fields (Fig. 1a–c). Dimorph afferents contain calyceal and bouton terminals to innervate both type I and type II hair cells with more numerous cellular contacts and larger terminal fields (Fig. 1d–f). Bouton afferents exclusively innervate type II hair cells with bouton terminals, over large terminal fields (Fig. 1g–i). More than 340 afferents in both maculas were anatomically reconstructed in normal adult pigeons, allowing quantitative comparisons of terminal innervation pattern to be made across the entire receptor epithelium (Fig. 1b,c,e,f,h,i). The regional distribution of these afferent types differs across the macular surface. In the utricle, type I cells, calyx and dimorph afferents were exclusively located in a distinct striolar region that was eccentrically located in the lateral macula. Type II cells were located throughout the macula. However, these cells were mostly concentrated in a medial extrastriolar region that occupied ∼60% of the utricular surface and was innervated exclusively by bouton afferents. In the saccule, type I cells, as well as calyx and dimorph afferents were more homogeneously distributed, with bouton afferents being concentrated in the peripheral margins. Unique to bird utricular and lagenar striolar regions, there is a band of six to eight exclusive type II cells (type II band) that flanks the polarization reversal line (Jørgensen and Andersen, 1973; Si et al., 2003). However, there is no type II band in the saccule, with type I cells dominating the regions on either side of the reversal line.
Ototoxic lesion
The severity of the initial lesion attributable to the streptomycin treatment was examined in four animals using both scanning electron microscopy (right ear) and light microscopy (left ear). Ten days before the streptomycin application, BDA was iontophoresed into the right vestibular nuclei for retrograde transport of the tracer so that degenerating afferents could be visualized. As shown in Figure 2, the macular hair cell density differed depending on epithelial location, but was observed to be 36 cells/1000 μm2 in the utricular striolar region (Fig. 2a). Similar values were observed in a previous study (Dye et al., 1999). However, at 4 d PST, the macular epithelium was completely devoid of hair cells. No stereocilia were present across the entire macula surface, with only support cells observed (Fig. 2b). In addition, histologic observations showed only a single layer of support cells at the base of the epithelium, with no (or very rare) hair cell somas present in the hair cell layer (Fig. 2c). Mitotic division was observed in, or immediately adjacent to, the support cell layer in which presumed regenerating daughter cells (Fig. 2c, arrowhead) were differentiating into new hair cells (Weisleder et al., 1995). It should be noted that, given our level of observation, it is also possible that these few observed cells were not regenerating, but instead were either dying or damaged hair cells. Finally, no BDA-labeled afferent fibers were present in the sensory epithelia at 4 d PST. However, remnants of degenerating fibers were sometimes observed beneath the epithelia in the stroma (Fig. 2c, long arrow). Based on these observations, we believe that for all practical purposes, the maculas were devoid of receptor cells and their innervating afferent fibers at 4 d PST. Thus, all of the subsequent recovery of hair cells and afferent terminal morphologies were interpreted as originating from regenerating cells and nerve fibers.
Figure 2.
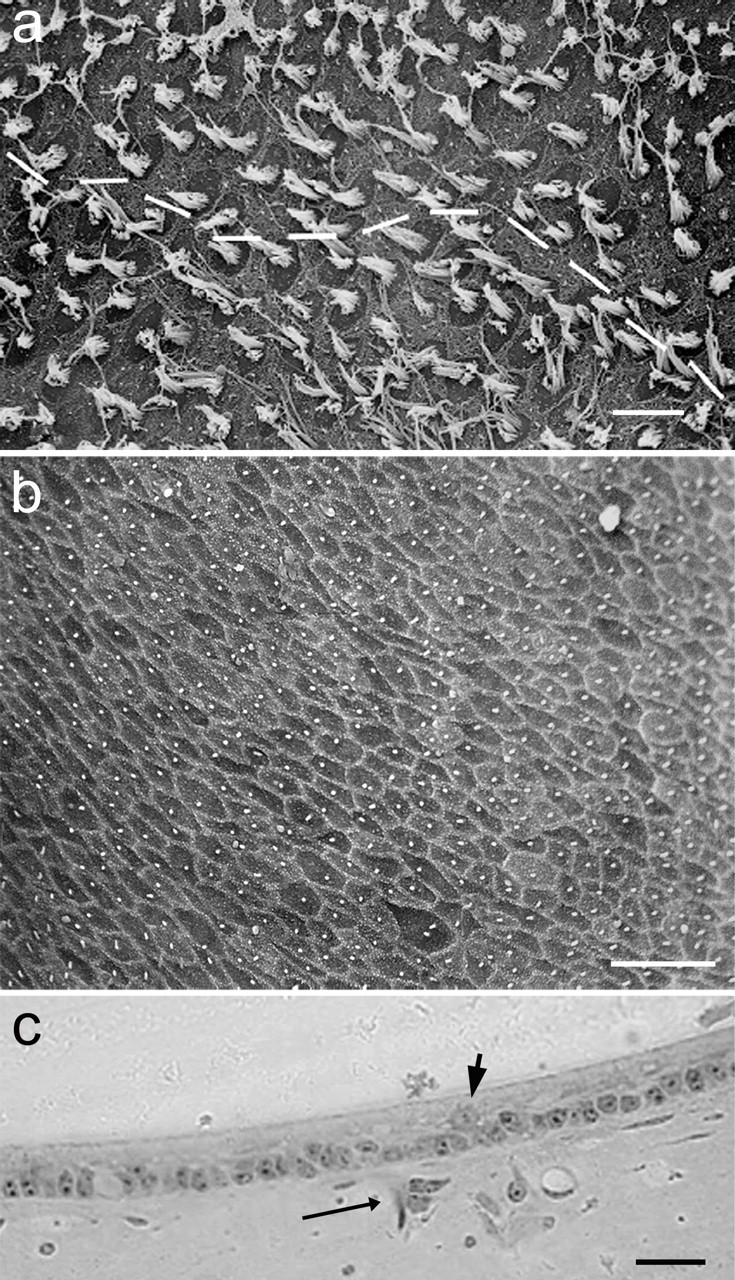
Receptor cell loss and afferent denervation attributable to ototoxic lesion. a, Scanning electron microscopic image of a normal utricular macula with high hair cell density in the striola region. Morphological polarization reversal is indicated by the dashed line. b, Scanning electron microscopic image of an utricular macula surface in the striola region at 4 d PST. No stereocilia are present, only the pentagonal arrangements of support cells are visible. c, LM photomicrograph of the medial periphery region of an utricular macula at 4 d PST. No hair cells are present, and only support cells persist in the sensory epithelium. A lone differentiating daughter cell (or damaged/dying hair cell; arrowhead) and a remnant of a BDA-labeled degenerating afferent (long arrow) are visible. Scale bars, 10 μm.
Regeneration of afferent innervation
After the ototoxic lesion, we observed that calyx, dimorph, and bouton afferents all regenerate; however, there was a temporal differentiation for their return. This temporal sequence of afferent repopulation in the maculas led to the qualitative discrimination of three regenerative stages, each of which was characterized by specific morphological features in both fiber structure and hair cell distribution. Although qualitative type and stereotypic topographic organization of regenerated afferents were similar to those of normally developed birds, clear quantitative differences in the terminal morphologies of complete regenerated afferents were found compared with those established through normative development. These differences consisted of significantly smaller, less complex innervation patterns for the regenerated fiber population, even after many months of regenerative recovery.
Stage 1 regeneration
During the first 4 weeks after the ototoxic lesion, BDA-labeled fibers were observed to regenerate throughout the saccular and utricular maculas. Three-dimensional anatomical reconstructions were performed for 89 regenerating utricular afferents at 1 week (33 fibers), 2 weeks (25 fibers), and 4 weeks (31 fibers) PST. As could be expected, immature fibers were first observed, and these gradually developed more elaborate branching patterns and terminal fields. However, during the first month PST, only growth cones, en passant and boutons terminaux were ever observed as terminal structures. No calyceal terminals were present in any fibers of either the saccular or utricular maculas. In addition, only hair cells with a type II morphologic phenotype were observed to develop in the epithelium, even in the striolar region in which type I hair cells typically predominate in normal adult maculas. Classically, discrimination between type I and type II vestibular hair cells in normal adult tissue has been based on morphology (Wersäll, 1956; Lysakowski and Goldberg, 1997; Rüsch et al., 1998), innervations (Kevetter et al., 1994; Lysakowski and Goldberg, 1997), and channel properties (Correia and Lang, 1990; Eatock et al., 1994; Rennie and Correia, 1994; Ricci et al., 1996; Rüsch et al., 1998). Mature type II hair cells are innervated by bouton terminals and type I hair cells are enclosed by a calyceal terminal. However, during development or regeneration before neural innervation is complete, discrimination between hair cell type is often difficult without high resolution analyses such as transmission electron microscopy (Rüsch et al., 1998). However, in the present study, we conservatively identified mature regenerated hair cells [evident stereocilia bundles; differential interference contrast (DIC) optics] according to morphologic phenotype as follows: type II hair cells were characterized by tubular elongated cell bodies, basal located nuclei, and a lack of a constricted neck region. Type I hair cells were characterized by their amphora shape, more apical located nuclei, a constricted neck, and, when present, a calyceal terminal.
As shown in Figure 3, at 1 week PST, regenerating fibers were first observed to be growing toward and entering the sensory epithelium. Many BDA-labeled afferents with terminal growth cones were initially observed only in the stroma beneath the sensory epithelium, whereas others were beginning to penetrate through the basement membrane. No anatomical reconstruction was performed until a fiber had entered into the sensory epithelium. As shown in Figure 3, the regenerating BDA-labeled fibers typically consisted of a single segment with a large terminal growth cone. Although initial segment fibers entering the epithelium were observed throughout stage 1 regeneration, the majority of fibers examined during the first 2 weeks PST had these simple defining features (Fig. 3a,b,d,f). After entering the sensory epithelium, the majority of afferents did not immediately begin to subdivide into branches. Instead, most fibers turned to course along the base of the epithelium just above the support cell layer. In fact, the growth trajectories of afferents appeared to target developing hair cells (Fig. 3c,f,j,p). In the first few weeks PST, the epithelium was sparsely populated by hair cells, so long fiber processes often resulted in an apparent effort to reach the only available site of innervation (Fig. 3a,f,p,v). Often, large prominent swellings in the initial segment at different points along the fiber were observed, as illustrated from the surface view image in Figure 3a. As fibers matured, ramifying branches could often be observed to emanate from prominences (Fig. 3e,j,k,n–t). During the first week of regeneration, most of the innervation patterns observed were very simple with only a single segment. However, some fibers had short branching processes (Fig. 3e,g,h), although all of the branches ended in growth cones and did not display characteristics of normal bouton terminals (Si et al., 2003; Zakir et al., 2003). Growth cones were characterized by large conical or rounded structures (Fig. 3a–f,j,q,r,v), elliptical structures (Fig. 3c,e,g,h,j–n,r–t), digitiform appendages (Fig. 3g,l,n–p,r–v), or, more rarely, filamentous filopodia at the end of the fiber (Retzius, 1884; Ramon y Cajal, 1908; Fink and Morest, 1977; Tosney and Landmesser, 1985; Caudy and Bentley, 1986; Skaliora et al., 2000).
Figure 3.

Photomicrographs and anatomical reconstructions of stage 1 regenerating afferents. a–h, Afferents innervating the maculas at 1 week PST were primarily composed of a simple initial fiber segment, prominent swellings, and a large terminal growth cone (a, surface view of saccular afferent; b, cross section of utricular afferent; d, f, reconstructions). Simple branched segments were also noted for some fibers, all ending in terminal growth cones (c, e, g, h). i–o, Photomicrographs and reconstructions for 2 week PST regenerated afferents. i, Scanning electron microscopic image of the apical surface of the central striola region in 2 week PST utricular macula. Morphological polarizations of stereocilia bundles were appropriately polarized toward the developing reversal line (as determined by epithelial location). j–o, Simple branched afferent structures with terminal growth cone processes directed toward extant hair cells were observed for most afferents. A few more complex branching patterns were also observed (n, o), and some segments contained bouton terminals (red circles). p–v, Afferents at 4 weeks PST exhibited more numerous short branched segments, most with growth cones. Some fiber segments contain boutons terminaux (p). In the saccular maculas, large rounded terminal growth cones were observed, many with branching segments emanating from prominent swellings (q). Reconstructions show that at 4 weeks PST, many fibers had multiple branches. A mixture of growth cones and bouton terminals was observed. Asterisks denote penetration point into the sensory epithelium. Scale bars, 10 μm.
Because the afferents had denervated from the epithelium as a result of toxicity, we wondered whether the neurons had completely died, or whether the fiber had simply lost the terminal morphology and retracted to a position in or below the stroma. It appeared likely that only the terminal innervations of the afferents had degenerated because of the rapid regrowth into the sensory epithelium. In support of that view, the ganglion cells and the fibers coursing through the VIIIth nerve immediately beneath the stroma were examined at 1 week PST. As shown in Figure 4, there was no immediate evidence of ganglion cell declination, with a number of cells readily transporting BDA into their peripheral processes (Fig. 4a). In addition, fiber counts from two 1 week PST utricular branches lying immediately beneath the macula (Fig. 4b) showed no significant difference (t = 0.44; df = 3; p = 0.68) in the total number of fibers per branch (mean ± SD, 910.5 ± 283) compared with that observed in normal adult pigeons (mean ± SD, 971.4 ± 241) (Si et al., 2003; Zakir et al., 2003). As shown in Figure 4c, the fiber diameters were also compared, with a significant shift toward larger diameters in the 1 week PST regenerating nerve (χ2 = 60.9; df = 8; p < 0.001). This suggests either that the denervation of the peripheral terminal structures produced an enlarged fiber segment or that, during regenerative growth, fibers initially increase in size.
Figure 4.

Macular afferent number and fiber size after denervation of the epithelium (1 week PST). a, Vestibular ganglion with BDA-filled (black) and nonfilled neurons. b, Cross section of one utricular nerve branch immediately beneath the macula. BDA-filled (black) and nonpositive fiber lumens (blue) were measured. c, Histogram comparison of fiber diameters for normal (open; n = 2351) and 1 week PST fibers (hatched; n = 1831). Scale bars, 10 μm.
At 2 weeks PST, some of the hair cells in the epithelium were beginning to mature, with complete and morphologically polarized stereocilia bundles (Fig. 3i). The planar polarities of regenerating hair cells across the maculas were not disordered, but were topographically oriented relative to the reversal line (Jørgensen and Andersen, 1973; Si et al., 2003; Zakir et al., 2003). This finding is important, because it is the differing polarizations of otolith receptor cells that gives rise to afferent directional coding for linear motion (Loe et al., 1973; Fernandez and Goldberg, 1976; Si et al., 1997). Furthermore, the stereocilia morphological polarization occurred early as hair cells regenerated and appeared to be independent of afferent innervation, as was previously noted for chick cochlea hair cells and efferent innervation (Hennig and Cotanche, 1998). Many other hair cells were observed to be in different states of maturation. The mean receptor cell density across the macular surface was only 10 hair cells/1000 μm2, as evidenced by the presence of stereocilia bundles on the surface (Dye et al., 1999). Similar to most afferents at 1 week PST, many entering fibers into the epithelium contained a single process that traveled some distance (25–75 μm) past their penetration point. However, other fibers that entered the epithelium near receptor cell somas tended to exhibit large branching processes near the penetration point, with multiple smaller higher-order branches being developed (Fig. 3j,n,o). Most fibers contained only growth cones on their branches. At 2 weeks PST, only a few afferents exhibited a mixture of growth cones and terminal boutons (Fig. 3o).
Regenerating afferents at the fourth week PST displayed a wide variety of structural characteristics. A number of initial segment fibers could still be observed penetrating into the epithelium, although most of these had shorter single processes with growth cones than those seen at earlier postlesion times. Because the hair cell density continued to increase, more innervation targets were available. One notable feature of afferents at this point included branches in a number of fibers that formed loops from the apical to middle layers of the epithelium. Such terminal formations were not noted in afferents developed through normative maturation (Si et al., 2003; Zakir et al., 2003). As shown in Figure 3, simple afferents contained few short branching processes with large growth cones (Fig. 3r). More complex fibers exhibited a number of branches, some terminating growth cones and others ending with terminal boutons (Fig. 3s–u). It was also observed that a much smaller proportion of the innervating afferents had long processes coursing through tens of micrometers in the epithelium (Fig. 3p,v), compared with those present at 1 or 2 weeks PST. In fact, most of the afferents tended to have shorter initial segments (branch order, 1), with multiple branches closer to the penetration zone (Fig. 3q–u).
Quantitative evaluations of the innervation patterns for all stage 1 reconstructed afferents were performed and plotted for comparison as illustrated in Figure 5. As noted above, no calyceal terminals were ever observed during stage 1 regeneration; thus only bouton afferents existed in the receptor epithelium. The fiber diameters for each class of regenerating afferents were similar for all postlesion time points examined. The mean diameter for 1 week PST fibers of 2.4 (SD, ±0.8) was not significantly different from either the 2 week (2.3 ± 0.6) or 4 week (2.7 ± 0.7) PST afferent means. In contrast, all measures of the afferent terminal structure complexity increased as regeneration progressed. The overall length of the fiber, the number of branching segments, the branch order, the number of growth cones, and the area of epithelial innervation all increased through the 4 weeks of stage 1 regeneration (Fig. 5).
Figure 5.

Mean values for regenerating afferent structural characteristics as a function of recovery time (PST). The innervation area (Area; in square micrometers) and total fiber length (Length; in micrometers) values were reduced by a factor of 10 for illustration purposes. Other structural features illustrated include the number of branching segments (Branches), branch order (Br. Order), number of terminal growth cones (Cones), number of boutons per fiber (Boutons), number of type I hair cells/calyceal terminal (Calyx HC), and the fiber diameter (Diameter; in micrometers). Afferents were grouped according to innervation type, including bouton (left), dimorph (middle), and calyx (right) fibers.
At this point, we were curious as to whether residual concentrations of streptomycin in the labyrinth could be slowing the regeneration process or inhibiting the development of type I hair cells and calyceal terminals. Both utricular and saccular maculas from normal animals and from different PST regeneration birds were examined for the presence of apoptotic receptor cells using the TUNEL method, as shown in Figure 6. Because of the small sample size, TUNEL-labeled cells were quantified only in the utricular maculas at 24 h (Fig. 6a) (N = 2), 3 weeks (Fig. 6b) (N = 4), and 10 weeks (N = 2) PST, as well as in normally developed (Fig. 6c) (N = 2) birds. Figure 6d illustrates that the level of apoptotic cells in the 3 week PST maculas was not different from that observed in either 10 week or normal birds (F(1,5) = 0.36; p = 0.73) but was an order of magnitude lower than that observed at 24 h PST (F(1,6) = 9.7; p < 0.01). Similar levels of apoptosis were previously noted for the maculas of 24 h ototoxic lesioned and normal young chicks (Kil et al., 1997). Thus, in our study, the level of receptor apoptosis had apparently stabilized to normal levels by at least 3 weeks PST and was not inhibiting macular regeneration thereafter.
Figure 6.

Levels of apoptotic cells observed at different times during regeneration. TUNEL of DNA-fragmented cells are shown in the saccular striolar region at 24 h PST (a), utricular central extrastriola region at 3 weeks PST (b), and utricular striola–extrastriola border region in a normal pigeon (c). All images are dorsal views of whole-mount epithelia. In c, DIC optics allow visualization of calyceal terminal formations and the location of type II band. Scale bar, 25 μm. d, Plot of mean (±SD) number of TUNEL-labeled cells in the entire macula as a function of regeneration time.
Stage 2 regeneration
During the second stage of regenerative recovery, extending from 6 to 12 weeks PST, several significant changes in afferent innervation were observed. Figure 7shows that, by 6 weeks PST, many receptor cells were mature, as exhibited by fully developed stereocilia bundles that were morphologically polarized. The polarity orientations were organized relative to the developing reversal line (Fig. 7a, dotted line) that traveled through the striola and along the peripheral margin, similar to that observed in normal birds (Si et al., 2003; Zakir et al., 2003). Other cells were observed at different stages of regenerative growth (Fig. 7a, immature stereocilia), and the hair cell density had only reached values near 30% of that for normal maculas (Dye et al., 1999). In terms of innervation, the growth trajectory shifted from one of mainly new initial fibers entering into the epithelium to that of both new fibers and increased complexity of terminal fields on existing fibers. In addition, regenerating calyceal terminals and identifiable type I hair cells were observed for the first time at 6 weeks PST, as illustrated in Figure 7. Many partial calyceal terminals were also observed. These structures consisted of forming encapsulations that proceeded from the base to the apical portion of type I hair cell (Fig. 7b,f). Some fibers contained both partial and complete (as evidenced by constricted neck regions at the apical cell surface) calyceal terminals (Fig. 7c,e) that contained few hair cells (Fig. 5). All of the calyceal terminals observed at 6 weeks PST were emanating from dimorph afferents, with no calyx afferents present in the sensory epithelium. All dimorphs were located in the striolar region and most had simple innervation patterns, with only a few short-length branching segments that terminated with either growth cones or bouton terminals. Thus, the mean values for innervation area, fiber length, number of branches, and branch order for the 6 week PST dimorphs were the lowest of those observed during regenerative growth (Fig. 5). Bouton afferents varied considerably in complexity, many with multiple branching segments (Fig. 7d,g–i). Similar to the fibers observed during stage 1 regeneration, long initial segments on some afferents were noted. However, with the density of receptor cells increasing, many bouton units exhibited a more normal branching pattern, with a short initial segment that penetrated the basement membrane, and then immediate arborization with multiple branches (Fig. 7d,g,i). Most bouton afferents exhibited a mixture of terminal boutons and growth cones. On more mature segments, multiple en passant terminals were observed near receptor cells.
Figure 7.

Photomicrographs and anatomical reconstructions of stage 2 regenerating afferents: 6 weeks PST (a–i) and 12 weeks PST (j–r). a, Scanning electron microscopy of striola region near the polarization reversal line (dotted). Both mature and developing stereocilia bundles were present, with a clear demarcation of polarity for each hair cell. b, Developing dimorph afferent with two prototypic calyceal terminals in the striolar region. c, Developing dimorph afferent with a calyceal terminal that has a complete encompassing structure around one hair cell and a partial formation around a second. d, Bouton afferent in the medial extrastriola with multiple branch segments, terminal boutons, and several growth cones. e, f, Type I hair cells and calyceal terminals were first observed only on dimorph afferents at 6 weeks PST. Bouton afferents exhibited increased structural complexity, many with both terminal boutons (red) and growth cones (g–i). Few afferents had long initial segments (f, h); more exhibited branching arborizations near the point of epithelial penetration (g, i). j, Medial striolar region at 12 weeks PST, with reversal line (arrow), broad type II band, and developing calyceal terminal of calyx afferent. k, Calyx afferent contains five type I hair cells, with complete formation around some receptor cells, but developing formation around others. l, Dimorph afferent with complete calyceal terminal, numerous branch segments, and terminal boutons. m, Bouton afferent with multiple branch segments immediately beyond penetration point, with terminal boutons and growth cones. n, o, Calyceal terminals were present for the first time in calyx afferents at 12 weeks PST, but these fibers were few in number and most were immature. The majority of calyceal terminals were contained in dimorph afferents, which appeared more structurally complex (p). Bouton afferents increased in complexity with dense arborizations and numerous terminals (q, r). A mixture of growth cones and bouton terminals was observed. Asterisks denote penetration point in receptor epithelium. Scale bar, 10 μm.
In the latter part of stage 2 regeneration, the density of receptor cells continued to increase such that the epithelium was approaching a more normal appearance, as shown in Figure 7j. The polarization reversal line was easily demarcated throughout the striola region, with only a few initial fibers observed to be entering the macula. Most of these were located in the striolar region, which was becoming more defined. In addition, calyx afferents were observed for the first time at 12 weeks PST (Fig. 7j,k,n,o). Calyx afferents were confined to the striolar region, but were not very numerous and were heterogeneously spread throughout the area. At this time in regenerative growth, the majority of the calyx units had immature partial calyceal terminals, with structures still forming around innervated hair cells (Fig. 7k,o). Of the calyx fibers observed, all had simple innervation patterns (Figs. 5, 7n,o), with few hair cells per terminal and small innervation areas. Both the dimorph and bouton afferents continued to increase in structural complexity, compared with that seen at 6 weeks PST (Fig. 5). The innervation fields for both types of afferents contained multiple branching segments with more densely populated bouton terminals (Fig. 7l,m,p–r). Although growth cones were present on a number of fibers (Fig. 7m), their presence was declining compared with earlier regeneration periods, with means of three and eight cones per fiber for the dimorph and bouton afferents, respectively (Fig. 5).
Stage 3 regeneration
The final stage of regeneration included the period extending between 24 weeks and 1 year PST, in which the defining characteristics encompassed the end of regenerative growth. For example, after 6 months regeneration, the hair cell density had returned to normal values of ∼40 cells/1000 μm2 (depending on macular location). Figure 8a shows a patch of regenerating saccular epithelium in the central striolar region with densely packed hair cells. The stereocilia bundles are complete with well formed polarizations. Both the utricular and saccular receptor epithelia were populated with type I and type II receptor cells, distributed in a manner that was similar to that of normal maculas. As shown in Figure 8b, white bar, the utricular striola region had developed the characteristic type II band (8–10 type II hair cells) within which the polarization reversal line occurs (Si et al., 2003). On either side of the type II band lay the lateral and medial striolar regions, in which calyceal terminals innervated type I hair cells (Fig. 8b, I symbols). There was no type II band formed in the saccular macula, similar to normal birds. In terms of afferent innervation, at 24 weeks PST, no new developing afferents were observed to enter the receptor epithelia and no growth cones on existing afferents were observed. All branch segments ended with either calyceal or bouton terminals. Calyceal terminals were complete, with constricted neck regions enveloping the apical portions of the type I hair cells. Qualitatively, stage 3 regenerated maculas appeared similar in organization and structure to that observed after normal development. Overall, much of the topographic organization to hair cell distribution, planar cell polarity, and type of afferent location (i.e., calyx, dimorph, and bouton fibers; see below) was essentially reproduced in regenerated maculas equivalent to that observed through normative development. For these reasons, we concluded that the regeneration was essentially complete at 24 weeks PST. Even so, we continued to collect data from regeneration birds at 36 and 52 weeks PST, in the event that some afferent terminal recovery continued. Because no differences in innervation were apparent in the regenerated maculas after 24 weeks PST, all of the data for 24, 36, and 52 week PST animals were combined for comparisons against the afferent innervation observed in the normal phenotype.
Figure 8.

Photomicrographs and anatomical reconstructions for stage 3 regenerated macular afferents at 24–36 weeks PST. a, Scanning electron microscopy of central striolar region in 24 week PST saccular macula. b, DIC photomicrograph of central striolar region in 24 week PST utricular macula. Eight type II cells in the type II band (white bar) flank the polarization reversal line (arrow). On either side of the band lie the medial (left) and lateral (right) striolar regions, with a dense concentration of type I hair cells (I) contained in calyceal terminals. c–u, Reconstructions for utricular (c–k) and saccular (n–u) afferents for stage 3 regeneration. Calyx afferents (c–f, n–q) arranged in increasing order of complexity. Calyx afferents were found primarily in the central regions. i, j, r–t, Dimorph afferents arranged in increasing order of complexity, with the distribution of the fibers in the regenerated maculas being more dispersed compared with normal development (see supplemental material, available at www.jneurosci.org). k–m, u–x, Reconstructions for seven regenerated bouton afferents arranged in increasing order of complexity. Insets, Composite surface maps of stage 3 regeneration utricular (left) and saccular (right) maculas. Distributions of reconstructed calyx (diamonds), dimorph (squares), and bouton (circles) afferents are shown. Scale bars, 10 μm.
Although qualitatively similar in appearance at the whole-organ level, close inspection of the afferent innervation patterns for individual fibers suggested that significant differences between the complete terminal fields of regenerated afferents and those developed normally existed. To determine whether that were true, anatomical reconstructions for 96 calyx, 87 dimorph, and 69 bouton afferents from stage 3 regenerated utricular and saccular maculas were performed. These regenerated afferents represented the final outcome of regenerative maturation. Thus, they were compared against the afferent innervations examined in normal birds that had approximately the same total development age (1.5–3 years). As shown in Figure 8 and supplemental Figure S1 (available at www.jneurosci.org as supplemental material), all three types of afferents were regionally distributed in the regenerated maculas similar to those of normal birds. The striolar regions of both maculas contained exclusively calyx and dimorph afferents, except for the bouton afferents that were located in the type II band of the utricular macula. Bouton afferents, other than those innervating the type II band, were confined to the extrastriolar regions in both maculas. However, there were a few notable exceptions. In the regenerated utricular macula, several dimorph afferents with calyceal terminals were located in the medial extrastriola zone. In the regenerated saccular macula, it appeared that the overall number of bouton afferents was reduced, particularly in the posterior regions (supplemental Fig. S1, available at www.jneurosci.org as supplemental material). Here, a higher concentration of dimorph and calyx afferents had populated this region compared with normal birds. In effect, the striola region had lengthened almost to the posterior edge of the regenerated saccular macula.
The size, structure, and complexity of the afferent innervation patterns varied widely. Figure 8 illustrates the relative diversity in calyx, dimorph, and bouton innervations, from simple to the more complex for all regenerated afferents. Supplemental Table S1 (available at www.jneurosci.org as supplemental material) shows the range and mean values for each of the quantified morphological properties for stage 3 regeneration utricular and saccular afferents. Most regenerated calyx afferents had an initial segment that was unbranched and gave rise to a single calyceal terminal. However, a small proportion of calyx fibers (11%) branched either in or beneath the epithelium to form two calyceal terminals (Fig. 8e,q). For all reconstructed calyx afferents in regeneration maculas (utricle, n = 47; saccule, n = 49), the calyceal terminals varied between simple structures, which innervated only one hair cell (Fig. 8c,n), to the more complex calyces, which contained up to 17 hair cells (Fig. 8f). In normal birds, calyx afferents had between 1 and 15 hair cells per calyceal terminal (Si et al., 2003; Zakir et al., 2003). There was no correlation between terminal complexity and location within the striola for either regeneration or normal birds. Simple dimorph afferents had small calyceal terminals that contained a single hair cell and one or two branch segments that contained a few terminal boutons. This was true for dimorphs in the regeneration (Fig. 8g,h,r,s) and normal (Si et al., 2003; Zakir et al., 2003) maculas. The most complex dimorph afferents exhibited multiple branches with calyceal terminals and boutons (Fig. 8i,j,t). From the reconstructions, it appeared that dimorph afferents in regeneration maculas had less complex calyceal structures, fewer branch segments, and fewer bouton terminals than those developed normally (compare Fig. 8g–j,r–t with supplemental Fig. S2e–g,o–r, available at www.jneurosci.org as supplemental material). It also appeared that a similar difference in overall structural complexity between fibers innervating the regeneration and normal maculas existed for the bouton afferents. Although bouton afferents varied from small (Fig. 8k,u) to large (Fig. 8m,w,x), the arborization complexity, number of branches, and quantity of bouton terminals again appeared less for fibers innervating the stage 3 regeneration maculas compared with the normal maculas (supplemental Fig. S2, available at www.jneurosci.org as supplemental material).
Quantitative comparisons between regeneration afferents and those developed normally confirmed the qualitative observations. Figure 9 shows the distribution of all reconstructed afferents across the utricular and macular epithelia, with a comparison of total innervation area, one of the morphological parameters measured. Apparent in the distribution was the diversity among individual fibers for all three fiber groups. It was also apparent from the distribution that, for both regeneration and normal fibers, the innervation area was the least for calyx afferents (e.g., utricular regenerated, 295 ± 189 μm2) and the largest for bouton (e.g., utricular regenerated, 758 ± 399 μm2) afferents (supplemental Table S1, available at www.jneurosci.org as supplemental material). Across the entire fiber population and each class of fibers, innervation terminal fields for regenerated afferents were smaller than those of normal afferents (Fig. 9), for units innervating both utricular and saccular maculas (e.g., utricle boutons, F(1,123) = 4.97; p < 0.05). Similar distribution comparisons were performed for all nine measured morphological parameters. It was observed that the trends for each parameter were mostly consistent in both maculas, when considering comparisons between regeneration and normal afferents.
Figure 9.

Three-dimensional plots of innervation area for all reconstructed afferents in the regeneration (left) and normal (right) utricular (top) and saccular (bottom) maculas. Calyx (green squares), dimorph (red triangles), and bouton (blue circles) afferents are plotted as a function of location in the receptor epithelium. Composite maps of left maculas (black outline), with reversal line (dashed) are shown. Anterior–posterior and dorsal–ventral distances are in micrometers.
Because the trends were consistent for both utricular and saccular afferents, it was decided to pool the morphological data for both organs for statistical comparisons between regeneration and normally developed afferents. Figure 10 shows the pooled mean comparisons for calyx, dimorph, and bouton afferents for both utricular and saccular afferents. Regeneration calyx fibers had significantly lower fiber volumes, fewer calyceal terminals, fewer type I hair cells per fiber, and lower innervation densities than afferents innervating normally developed maculas (Fig. 10, asterisks, statistical values in Table 1). Only a marginal difference was observed for the fiber diameters (F(1,228) = 3.2; p < 0.07), and no difference in the number of branches, total fiber length, or innervation area was noted (Table 1). As also shown in Figure 10 (asterisks), both dimorph and bouton afferents had significantly lower fiber diameters, fewer branch segments, lower volume, and smaller innervation areas than normally developed afferents (Table 1). The number of bouton terminals per afferent (dimorph and bouton) for treated and normal animals was not different. However, the mean innervation density for both dimorph and bouton afferents was actually significantly higher in the regenerated epithelia, whereas the calyx density was smaller (Fig. 10, Table 1). For calyx afferents, there were fewer hair cells per fiber in regenerated afferents, yet the innervation areas were not that different from normal fibers, which produced a lower terminal density (Table 1). In contrast, regenerated dimorph and bouton afferents had equivalent numbers of bouton terminals per fiber, yet smaller branching arborizations and innervation areas, thus significantly higher densities than normally developed afferents (Table 1). Thus, these findings suggest regenerated fibers innervate fewer hair cells in the maculas, but have more bouton terminal contacts per receptor hair cell compared with normal maculas.
Figure 10.
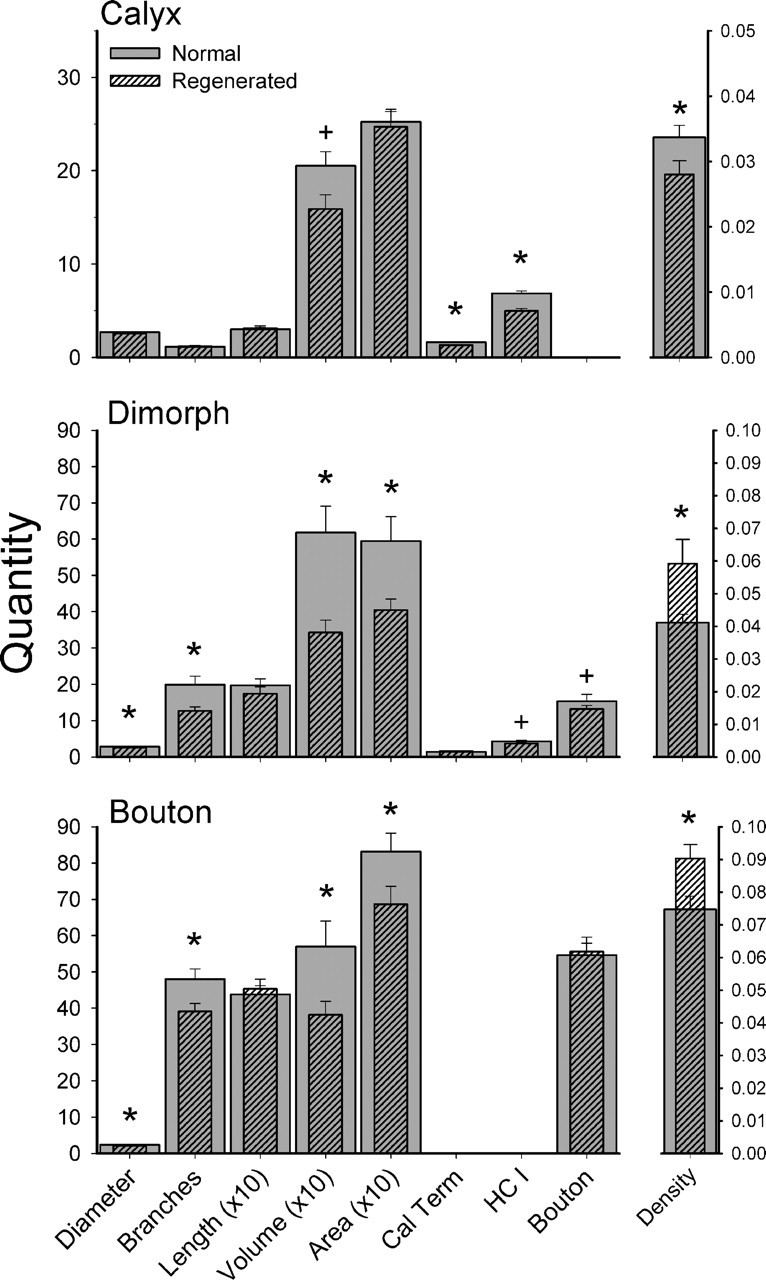
Comparison of regeneration and normal afferent innervation morphological parameters. Mean values are shown for each parameter for normal (gray) and regeneration (hatched) afferents, pooled for both utricular and saccular maculas. Diameter, Average fiber diameter (in micrometers); Branches, number of branch segments per fiber; Length, sum of all branch segments (in micrometers); Volume, sum of all fiber branch segment volumes (in cubic micrometers); Area, innervation area of receptor epithelium (in square micrometers); Cal Term, number of calyceal terminals per fiber; HC I, number of type hair cells per fiber; Bouton, number of bouton terminals per fiber; Density, terminals/innervation area (number per square micrometer). For clarity, quantities for fiber length, innervation area, and volume are plotted as a factor of 10 reduction. All quantities are plotted relative to the left ordinate, except density, which was scaled on the right ordinate. Error bars indicate SE. *p < 0.05 level; +0.05 < p < 0.7 level.
Table 1.
Statistical comparisons for pooled regenerated versus normal afferents
| Calyx [mean (SD)] |
Main effect | Dimorph [mean (SD)] |
Main effect | Bouton [mean (SD)] |
Main effect | ||||
|---|---|---|---|---|---|---|---|---|---|
| Normal | Regenerated | Normal | Regenerated | Normal | Regenerated | ||||
| Diameter | 2.7 (0.8) | 2.6 (0.8) | F(1,228) = 3.2; p < 0.07 | 2.9 (0.8) | 2.6 (0.8) | F(1,193) = 4.6; p < 0.05 | 2.4 (0.7) | 2.1 (0.7) | F(1,169) = 4.8; p < 0.05 |
| Branches | 1.14 (0.5) | 1.21 (0.6) | NS | 19.9 (21.9) | 12.7 (9.6) | F(1,193) = 8.0; p < 0.05 | 2.4 (0.8) | 2.1 (0.7) | F(1,169) = 4.8; p < 0.01 |
| Length | 30.1 (22.5) | 31.2 (24.9) | NS | 197 (171.5) | 174 (174.2) | NS | 48.0 (28.2) | 39.1 (17.9) | F(1,169) = 5.4; p < 0.05 |
| Volume | 201 (175.3) | 159 (149.4) | F(1,228) = 3.6; p < 0.06 | 618 (692.9) | 343 (320.7) | F(1,193) = 11.4; p < 0.01 | 438 (214.9) | 454 (223.9) | NS |
| Area | 250 (156.2) | 247 (159.7) | NS | 595 (644.4) | 405 (282.5) | F(1,193) = 6.4; p < 0.05 | 570 (713.3) | 381 (312.5) | F(1,169) = 4.2; p < 0.05 |
| Calyceal/fiber | 1.63 (0.7) | 1.29 (0.5) | F(1,228) = 14.5; p < 0.01 | 1.44 (0.6) | 1.48 (0.9) | NS | 832 (508.1) | 686 (413.5) | F(1,169) = 3.9; p < 0.05 |
| HC I/fiber | 6.9 (2.9) | 5.0 (2.5) | F(1,228) = 26.5; p < 0.01 | 4.3 (2.7) | 3.7 (1.9) | F(1,193) = 3.2; p < 0.07 | |||
| Boutons | 15.3 (18.2) | 13.2 (9.5) | NS | 54.6 (33.4) | 55.6 (33.5) | NS | |||
| Density | 0.034 (0.02) | 0.028 (0.02) | F(1,228) = 4.2; p < 0.05 | 0.041 (0.03) | 0.059 (0.07) | F(1,193) = 6.4; p < 0.05 | 0.075 (0.01) | 0.090 (0.01) | F(1,169) = 6.6; p < 0.01 |
Discussion
Our findings present the first comprehensive treatment of vestibular afferent regeneration in any species. We found that regenerated receptor cell distributions, planar polarities, and location of the reversal line were all morphologically normal. We also found that calyx, dimorph, and bouton afferents all regenerate and were similarly distributed to topographic norms, but do so much slower than previously thought. We observed a staged temporal sequence of afferent regeneration, in which bouton fibers recover first, followed by dimorph, and then calyx afferents. When complete, we observed that the topographic organization of regenerated otolith maculas mostly reproduces the normal morphogenetic phenotype. However, we also found that the completed innervation patterns for individual regenerated afferents differed significantly from those in normal pigeons. The question is then raised as to how these final morphologic differences might affect neural processing of motion information.
Several previous studies have suggested that vestibular regeneration in birds occurs rapidly. Vestibular evoked potentials (Jones and Nelson, 1992), VOR gains (Carey et al., 1996; Boyle et al., 2002; Matsui et al., 2003), and VCR responses (Goode et al., 1999) have all been reported to recover within 2 months or less after damage. However, vestibular semicircular canal afferent responses recover more slowly, with an exponential time course (Li and Correia, 1998; Boyle et al., 2002). In these investigations, systemic ototoxic injections were used, which resulted in incomplete hair cell loss (40–60% was common), and many afferents were left intact. Thus, functional recovery was likely not attributable to regeneration alone, but was coupled with residual function of nondamaged receptors, and repair of sublethally damaged hair cells and afferents (Baird et al., 2000). In the present study, regenerative development was examined per se, by first producing complete vestibular hair cell loss and total denervation of the otolith maculas (Dye et el., 1999; Frank et al., 1999). We then found that regeneration progressed through three successive stages and was completed after 6 months of recovery.
How does the time course of macular regeneration correlate with the recovery of vestibular function? Previously, we used identical lesion methods to examine hair cell repopulation and recovery of posture, head stability, and spatial orientation during regeneration (Dye et al., 1999; Dickman and Lim, 2004). Several interesting parallels between our current morphological findings and vestibular-dependent behavioral recovery are worth mention. Initial toxicity produced complete receptor cell loss and denervation, which always resulted in pronounced static and locomotor ataxia. At 4 d PST, severe postural instability ensued with frequent stumbling and staggering, as well as a total loss of spatial orientation. Birds were incapable of navigating a simple maze for reinforcement. In addition, all birds exhibited a lack of head control, with rapid head tremors or shakes, and a complete inability to maintain the head stable in space. In the first week of stage 1 regeneration, simply structured afferent fibers appeared that targeted the sparsely located developing hair cells, as if directed by signaling cues (Matsunaga et al., 2000; Fritzsch et al., 2004). Over the first PST month, regenerating afferents developed simple branching patterns with small innervation fields. Most branches terminated in growth cones, but gradually were replaced with terminal boutons. Stage 1 regeneration was characterized by the exclusive development of bouton afferents and hair cells exhibiting a type II morphologic phenotype. Macular hair cell densities increased exponentially during regeneration, with 20–25% normal density by 14 d and 30–35% normal density by 4 weeks PST. Extrastriolar regions that exclusively contain type II hair cells recovered more quickly than striolar regions in which type I hair cells predominate in normal adult birds (Jørgensen and Andersen, 1973; Dye et al., 1999; Si et al., 2003). These findings correlated with the initial head, postural, and orientation dysfunctions that persisted over the first several weeks of regenerative recovery. Gradual improvement in postural stability returned with an increase in steady gait and a declination of circling behavior by 3–4 weeks PST. Because only bouton afferents had regenerated at this point, these fibers must convey the required information to central circuits for the establishment of vestibulo-spinal stabilization of posture. However, some staggering and head tremor remained throughout stage 1 regeneration (Dickman and Lim, 2004). In fact, the most dramatic recoveries in both morphology and behavior were observed during stage 2 regeneration. Here, the return of calyceal terminals, first on dimorph and much later on calyx afferents, was observed, as well as the appearance of the mature type I hair cell morphologic phenotype. At 6 weeks PST, hair cell densities were ∼50% that of normal, except in the striolar regions, which remained slightly lower. As bouton afferents exhibited larger, more complex terminal fields, and calyceal terminals were beginning to regenerate, a coincident reduction in rapid head tremors was noted. As head stability increased, a return in directed gaze behavior occurred. By 7 weeks PST, regenerating birds could stand, walk, and perform normal head movements including gaze saccades and head bobbing. In the final phase of behavioral recovery, the animal’s ability to spatially navigate for trained reward returned to normal ability. Interestingly, these behaviors recovered fully long before the final phase of morphologic regeneration was complete. This suggests that neural plasticity in the central processing of motion information may use additional extravestibular visual or proprioceptive cues to help stabilize posture and gaze during regeneration (Lacour and Xerri, 1980; Precht et al., 1981; Newlands and Perachio, 1990).
In the present study, we concluded that morphological regeneration became complete by 6 months PST and mostly reproduced the normal topographic phenotype (stage 3). However, we also found that the innervation patterns of regenerated calyx, bouton, and dimorph afferents were significantly different from normal fibers. Regenerated fibers were 20–35% reduced in size (thinner and less branched) and innervated fewer hair cells over a smaller area (30% reduction). The number of terminal boutons per fiber was equivalent to normally developed afferents, indicating that the regenerated terminal concentration on individual hair cells actually increased by 30%. Regenerated calyx afferents were also thinner, and calyceal terminals for both calyx and dimorph fibers contained fewer type I hair cells than those of normally developed maculas. How these morphologic changes affect afferent neural motion processing remains unknown; however, we predict that smaller terminal fields that innervate fewer receptor hair cells will result in a narrower dynamic range of motion sensitivity and broader spatial tuning properties.
It has been suggested that regenerating type II hair cells transdifferentiate into type I hair cells (Favre and Sans, 1979; Weisleder et al., 1995). Several lines of evidence support that view. First, type II hair cells precede type I cells by several weeks and regenerate in regions in which type I cells will develop in the future (Weisleder and Rubel, 1993; Weisleder et al., 1995; Masetto and Correia, 1997a). Second, no increase in apoptosis occurred when calyceal terminals were regenerating, as would be expected if type II cells were dying to be replaced. Third, Masetto and Correia (1997a,b) reported that, although regenerated type II hair cells recovered their normal ionic currents by 10 weeks postlesion, type I hair cells lacked their signature potassium conductance and actually exhibited properties more similar to type II hair cells (Correia et al., 2001). Alternatively, Rüsch et al. (1998) suggested that transdifferentiation of cell type may not be so prevalent. In developing mice, these authors noted that the two cell types may have different lineages and both could develop before becoming innervated. Definitive resolution of the issue awaits development of more specific cell markers and/or analyses with high-resolution imaging.
Our findings also suggest that afferents may regenerate through transdifferentiation. First, we found that bouton afferents initially innervate the striolar regions, and then gradually get replaced by dimorph afferents. Second, partial calyces appeared to form on regenerating fibers that already contained branches with bouton terminals. Third, calyx afferents regenerated last, with their calyceal terminals being larger and containing more hair cells than their neighboring dimorph afferents. Thus, we propose that bouton afferents in the striolar regions develop a calyceal terminal to become dimorphs, as a result of an as-yet-unknown cue. Similar transdifferentiation of simple regenerated dimorphs then occurs, with loss of their few bouton branch segments and enlargement of their calyceal terminal. Similar to our findings for vestibular afferents, a progression from early bouton terminals to the more mature cup-like terminals on regenerating chick cochlear efferents has also been described (Duckert and Rubel, 1993; Ofsie et al., 1997; Hennig and Cotanche, 1998).
Spontaneous regeneration of mammalian hair cells does not occur. However, recent developments in mammalian regeneration provide renewed hope for restoring hearing and balance after loss (Shou et al., 2003; Izumikawa et al., 2005; Sage et al., 2005). Our data show that the specialized topographic organization of the otolith maculas recovers during regeneration. However, afferent reinnervation progresses slowly and, when complete, produces terminal morphologies that differ significantly from the mature normal phenotype. Thus, adaptive plasticity in the neural processing of motion information in regenerated systems should be expected during functional recovery and deserves additional investigation.
Footnotes
This work was supported by National Institutes of Health–National Institute on Deafness and Other Communication Disorders Grant DC003286 and National Aeronautics and Space Administration Grant NNA04CC52G. We thank David Huss for his expert assistance, Asim Haque for his many contributions, and Hao Liu for participating in some of the neural tracing experiments.
References
- Anastasio TJ (1992). Simulating vestibular compensation using recurrent back-propagation. Biol Cybern 66:389–397. [DOI] [PubMed] [Google Scholar]
- Baird RA, Torres MA, Schuff NR (1993). Hair cell regeneration in the bullfrog vestibular otolith organs following aminoglycoside toxicity. Hear Res 65:164–174. [DOI] [PubMed] [Google Scholar]
- Baird RA, Burton MD, Fashena DS, Naeger RA (2000). Hair cell recovery in mitotically blocked cultures of the bullfrog saccule. Proc Natl Acad Sci USA 97:11722–11729. [DOI] [PMC free article] [PubMed] [Google Scholar]
- Berg K (1951). Toxic effect of streptomycin on vestibular and cochlear apparatus experimental study on cats. Acta Otolaryngol Suppl 97:1–77. [PubMed] [Google Scholar]
- Boyle R, Highstein SM, Carey JP, Xu J (2002). Functional recovery of anterior semicircular canal afferents following hair cell regeneration in birds. J Assoc Res Otol 3:149–166. [DOI] [PMC free article] [PubMed] [Google Scholar]
- Brandt HM, Apkarian AB (1992). Biotin-dextran: a sensitive anterograde tracer for neuroanatomic studies in rat and monkey. J Neurosci Methods 45:35–40. [DOI] [PubMed] [Google Scholar]
- Brichta AM, Peterson EH (1994). Functional architecture of vestibular primary afferents from the posterior semicircular canal of a turtle, Pseudemys (Trachemys) scripta elegans. J Comp Neurol 344:481–507. [DOI] [PubMed] [Google Scholar]
- Carey JP, Fuchs AF, Rubel EW (1996). Hair cell regeneration and recovery of the vestibulo-ocular reflex in the avian vestibular system. J Neurophysiol 76:3301–3312. [DOI] [PubMed] [Google Scholar]
- Carey JP, Minor LB, Peng GCY, Della Santina CC, Cremer PD, Haslwanter T (2002). Changes in the three-dimensional angular vestibulo-ocular reflex following intratympanic gentamicin for Ménière’s disease. J Assoc Res Otolaryngol 3:430–443. [DOI] [PMC free article] [PubMed] [Google Scholar]
- Caudy M, Bentley D (1986). Pioneer growth cone morphologies reveal proximal increases in substrate affinity within leg segments of grasshopper embryos. J Neurosci 6:364–379. [DOI] [PMC free article] [PubMed] [Google Scholar]
- Correia MJ, Lang DG (1990). An electrophysiological comparison of solitary type I and type II vestibular hair cells. Neurosci Lett 116:106–111. [DOI] [PubMed] [Google Scholar]
- Correia MJ, Rennie KJ, Koo P (2001). Return of potassium ion channels in regenerated hair cells. Ann NY Acad Sci 942:228–240. [DOI] [PubMed] [Google Scholar]
- Corwin JT, Cotanche DA (1988). Regeneration of sensory hair cells after acoustic trauma. Science 240:1772–1774. [DOI] [PubMed] [Google Scholar]
- Dickman JD, Fang Q (1996). Differential central projections of vestibular afferents in pigeons. J Comp Neurol 367:110–131. [DOI] [PubMed] [Google Scholar]
- Dickman JD, Lim I (2004). Posture, head stability, and orientation during vestibular regeneration in pigeons. J Assoc Res Otolaryngol 5:323–336. [DOI] [PMC free article] [PubMed] [Google Scholar]
- Duckert LG, Rubel EW (1993). Morphological correlates of functional recovery in the chicken inner ear after gentamicin treatment. J Comp Neurol 331:75–96. [DOI] [PubMed] [Google Scholar]
- Dye BJ, Frank TC, Newlands SD, Dickman JD (1999). Distribution and time course of hair cell regeneration in the pigeon utricle. Hear Res 133:17–26. [DOI] [PubMed] [Google Scholar]
- Eatock RA, Chen WY, Saeki M (1994). Potassium currents in mammalian vestibular hair cells. Sens Syst 8:21–28. [Google Scholar]
- Favre D, Sans A (1979). Morphological changes in afferent vestibular hair cell synapses during the postnatal development of the cat. J Neurocytol 8:765–775. [DOI] [PubMed] [Google Scholar]
- Fernandez C, Goldberg JM (1976). Physiology of peripheral neurons innervating otolith organ in the squirrel monkey. I. Response to static tilts and to long-duration centrifugal force. J Neurophysiol 39:970–984. [DOI] [PubMed] [Google Scholar]
- Fernandez C, Baird RA, Goldberg JM (1988). The vestibular nerve of the chinchilla. I. Peripheral innervation patterns in the horizontal and superior semicircular canals. J Neurophysiol 60:167–181. [DOI] [PubMed] [Google Scholar]
- Fernandez C, Goldberg JM, Baird RA (1990). The vestibular nerve of the chinchilla. III. Peripheral innervation patterns in the utricular macula. J Neurophysiol 63:767–780. [DOI] [PubMed] [Google Scholar]
- Fernandez C, Lysakowski A, Goldberg JM (1995). Hair-cell counts and afferent innervation patterns in the cristae ampullares of the squirrel monkey with a comparison to the chinchilla. J Neurophysiol 73:1253–1269. [DOI] [PubMed] [Google Scholar]
- Fink DJ, Morest DK (1977). Formation of synaptic endings by colossal fibers in the vestibular epithelium of the chick embryo. Neuroscience 2:229–252. [DOI] [PubMed] [Google Scholar]
- Frank TC, Dye BJ, Newlands SD, Dickman JD (1999). Streptomycin ototoxicity and hair cell regeneration in the pigeon utricle. Laryngoscope 109:356–361. [DOI] [PubMed] [Google Scholar]
- Fritzsch B, Tessarollo L, Coppola E, Reichardt L (2004). Neurotrophins in the ear: their roles in sensory neuron survival and fiber guidance. Prog Brain Res 146:265–278. [DOI] [PubMed] [Google Scholar]
- Goode CT, Carey JP, Fuchs AF, Rubel EW (1999). Recovery of the vestibulocollic reflex after aminoglycoside ototoxicity in domestic chickens. J Neurophysiol 81:1025–1035. [DOI] [PubMed] [Google Scholar]
- Hennig AK, Cotanche DA (1998). Regeneration of cochlear efferent nerve terminals after gentamycin damage. J Neurosci 18:3282–3296. [DOI] [PMC free article] [PubMed] [Google Scholar]
- Hirvonen TP, Minor LB, Hullar TE, Carey JP (2005). Effects of intratympanic gentamicin on vestibular afferents and hair cells in the chinchilla. J Neurophysiol 93:643–655. [DOI] [PubMed] [Google Scholar]
- Izumikawa M, Minoda R, Kawamoto K, Abrashkin KA, Swiderski DL, Dolan DF, Brough DE, Raphael Y (2005). Auditory hair cell replacement and hearing improvement by Atoh1 gene therapy in deaf mammals. Nat Med 11:271–276. [DOI] [PubMed] [Google Scholar]
- Jones TA, Nelson RC (1992). Recovery of vestibular function following hair cell destruction by streptomycin. Hear Res 62:181–186. [DOI] [PubMed] [Google Scholar]
- Jørgensen JM, Andersen T (1973). On the structure of the avian maculae. Acta Zool 54:121–130. [Google Scholar]
- Kevetter GA, Correia MJ, Martinez PR (1994). Morphometric studies of type I and type II hair cells in the gerbil’s posterior semicircular canal crista. J Vestibular Res 4:429–436. [PubMed] [Google Scholar]
- Kil J, Warchol MW, Corwin JT (1997). Cell death, cell proliferation, and estimates of hair cell life spans in the vestibular organs of chicks. Hear Res 114:117–126. [DOI] [PubMed] [Google Scholar]
- Kopke RD, Jackson RL, Li G, Rasmussen MD, Hoffer ME, Frenz DA, Costello M, Schultheiss P, Van de Water TR (2001). Growth factor treatment enhances vestibular hair cell renewal and results in improved vestibular function. Proc Natl Acad Sci USA 98:5886–5891. [DOI] [PMC free article] [PubMed] [Google Scholar]
- Lacour M, Xerri C (1980). Compensation of postural reactions to fall in the vestibular neurectomized monkey. Role of the visual motion cues. Exp Brain Res 40:103–110. [DOI] [PubMed] [Google Scholar]
- Li W, Correia MJ (1998). Recovery of semicircular canal primary afferent activity in the pigeon after streptomycin ototoxicity. J Neurophysiol 80:3297–3311. [DOI] [PubMed] [Google Scholar]
- Lindeman HH (1969a). Studies on the morphology of the sensory regions of the vestibular apparatus. Ergeb Anat Entwicklungsgesch 42:1–113. [PubMed] [Google Scholar]
- Lindeman HH (1969b). Regional differences in sensitivity of the vestibular sensory epithelia to ototoxic antibiotics. Acta Otol 67:177–189. [DOI] [PubMed] [Google Scholar]
- Lisberger SG, Pavelko TA, Broussard DM (1994). Neural basis for motor learning in the vestibuloocular reflex of primates. I. Changes in the responses of brain stem neurons. J Neurophysiol 72:928–973. [DOI] [PubMed] [Google Scholar]
- Loe PR, Tomko DL, Werner G (1973). The neural signal of angular head position in primary afferent vestibular nerve axons. J Physiol (Lond) 230:29–50. [DOI] [PMC free article] [PubMed] [Google Scholar]
- Lorente de Nó R (1926). Etudes sur l’anatomie et la physiologie due labyrinthe de l’oreille et du VIII nerf. Deuxieme partie. Quelques donnees au sujet de l’anatomie des organes senoriels du labyrinthe. Trab Lab Invest Biol Univ Madrid 24:53–153. [Google Scholar]
- Lysakowski A, Goldberg JM (1997). A regional ultrastructural analysis of the cellular and synaptic architecture in the chinchilla cristae ampullares. J Comp Neurol 389:419–443. [DOI] [PMC free article] [PubMed] [Google Scholar]
- Masetto S, Correia MJ (1997a). Ionic currents in regenerating avian vestibular hair cells. Int J Dev Neurosci 15:387–399. [DOI] [PubMed] [Google Scholar]
- Masetto S, Correia MJ (1997b). Electrophysiological properties of vestibular sensory and supporting cells in the labyrinth slice before and during regeneration. J Neurophysiol 78:1913–1927. [DOI] [PubMed] [Google Scholar]
- Matsui JI, Haque A, Huss D, Messana EP, Alosi JA, Roberson DW, Cotanche DA, Dickman JD, Warchol ME (2003). Caspace inhibitors promote hair cell survival and vestibular function following aminoglycoside treatment in vivo J Neurosci 23:6111–6122. [DOI] [PMC free article] [PubMed] [Google Scholar]
- Matsunaga T, Greene MI, Davis JG (2000). Distinct expression patterns of Eph receptors and ephrins relate to the structural organization of the adult rat peripheral vestibular system. Eur J Neurosci 12:1599–1616. [DOI] [PubMed] [Google Scholar]
- Newlands SD, Perachio AA (1990). Compensation of horizontal canal related activity in the medial vestibular nucleus following unilateral ablation in the decelerate gerbil. Exp Brain Res 82:359–372. [DOI] [PubMed] [Google Scholar]
- Ofsie MS, Hennig AK, Messana EP, Cotanche DA (1997). Sound damage and gentamicin treatment produce different patterns of damage to the efferent innervation of the chick cochlea. Hear Res 113:207–223. [DOI] [PubMed] [Google Scholar]
- Precht W, Maioli C, Dieringer N, Cochran S (1981). Mechanisms of compensation of the vestibulo-ocular reflex after vestibular neurotomy. In: Lesion induced neuronal plasticity in sensorimotor systems (Flohr H, Precht W, eds) pp. 222–230. Berlin: Springer.
- Ramon y Cajal S (1908). In: Histology of the nervous system of man and vertebrates New York: Oxford UP.
- Ramon y Cajal S (1909). In: Histologie du systeme nerveaux de l’homme et des vertebres Vol I.:Paris: Maloine. [Google Scholar]
- Rennie KJ, Correia MJ (1994). Potassium currents in mammalian and avian isolated type I semicircular canal hair cells. J Neurophysiol 71:1–13. [DOI] [PubMed] [Google Scholar]
- Retzius G (1884). Das gehörorgan der wirbelthiere. II. Das gehörorgan der reptilien, der vögel, und der säugethiere Stockholm: Samson and Wallon.
- Reville W, Cotter M (1991). An evaluation of the usefulness of air-drying biological samples from tetramethylsilane in preparation for scanning electron microscopy. J Electron Microsc (Tokyo) 40:198–202. [PubMed] [Google Scholar]
- Ricci AJ, Rennie KJ, Cochran SL, Kevetter GA, Correia MJ (1997). Vestibular type I and type II hair cells. 1: morphometric identification in the pigeon and gerbil. J Vestibular Res 7:393–406. [PubMed] [Google Scholar]
- Richardson KC, Jarett L, Finke EH (1960). Embedding in epoxy resins for ultrathin sectioning in electron microscopy. Stain Technol 35:313. [DOI] [PubMed] [Google Scholar]
- Rüsch A, Lysakowski A, Eatock RA (1998). Postnatal development of type I and type II hair cells in the mouse utricle: acquisition of voltage-gated conductances and differentiated morphology. J Neurosci 18:7487–7501. [DOI] [PMC free article] [PubMed] [Google Scholar]
- Ryals BM, Westbrook EW (1994). TEM analysis of neural terminals on autoradiographically identified regenerated hair cells. Hear Res 72:81–88. [DOI] [PubMed] [Google Scholar]
- Sage C, Huang M, Karimi K, Gutierrez G, Vollrath MA, Zhang D, García-Añoveros J, Hinds PW, Corwin JT, Corey DP, Chen Z (2005). Proliferation of functional hair cells in vivo in the absence of the retinoblastoma protein. Science 307:1114–1118. [DOI] [PubMed] [Google Scholar]
- Schessel DA, Ginzberg R, Highstein SM (1991). Morphophysiology of synaptic transmission between type I hair cells and vestibular primary afferents. An intracellular study employing horseradish peroxidase in the lizard, Calotes versicolor. Brain Res 544:1–16. [DOI] [PubMed] [Google Scholar]
- Shou J, Zheng JL, Gao WQ (2003). Robust generation of new hair cells in the mature mammalian inner ear by adenoviral expression of Hath1. Mol Cell Neurosci 23:169–79. [DOI] [PubMed] [Google Scholar]
- Si X, Angelaki DE, Dickman JD (1997). Response properties of pigeon otolith afferents to linear acceleration. Exp Brain Res 117:242–250. [DOI] [PubMed] [Google Scholar]
- Si X, Zakir M, Dickman JD (2003). Afferent innervation of the utricular macula in pigeons. J Neurophysiol 89:1660–1677. [DOI] [PubMed] [Google Scholar]
- Skaliora I, Adams R, Blakemore C (2000). Morphology and growth patterns of developing thalamocortical axons. J Neurosci 20:3650–3662. [DOI] [PMC free article] [PubMed] [Google Scholar]
- Tosney KW, Landmesser LT (1985). Growth cone morphology and trajectory in the lumbosacral region of the chick embryo. J Neurosci 5:2345–2358. [DOI] [PMC free article] [PubMed] [Google Scholar]
- Warchol ME, Lambert PR, Goldstein BJ, Forge A, Corwin JT (1993). Regenerative proliferation in inner ear sensory epithelia from adult guinea pigs and humans. Science 259:1619–1622. [DOI] [PubMed] [Google Scholar]
- Weisleder P, Rubel EW (1992). Hair cell regeneration in the avian vestibular epithelium. Exp Neurol 115:2–6. [DOI] [PubMed] [Google Scholar]
- Weisleder P, Rubel EW (1993). Hair cell regeneration after streptomycin toxicity in the avian vestibular epithelium. J Comp Neurol 331:97–110. [DOI] [PubMed] [Google Scholar]
- Weisleder P, Tsue TT, Rubel EW (1995). Hair cell replacement in avian vestibular epithelium: supporting cell to type I hair cell. Hear Res 82:125–133. [DOI] [PubMed] [Google Scholar]
- Wersäll J (1956). Studies of the structure and innervation of the sensory epithelium of the crista ampullaris in the guinea pig. Acta Otolaryngol Suppl 126:1–85. [PubMed] [Google Scholar]
- Wersäll J, Hawkins JE Jr (1962). The vestibular sensory epithelia in the cat labyrinth and their reactions in chronic streptomycin intoxication. Acta Otol 54:1–23. [DOI] [PubMed] [Google Scholar]
- Zakir M, Huss D, Dickman JD (2003). Afferent innervation patterns of the saccule in pigeons. J Neurophysiol 89:534–550. [DOI] [PubMed] [Google Scholar]