

Abstract
The median preoptic nucleus (MnPN) and the ventral lateral preoptic area (vlPOA) of the hypothalamus express sleep-related Fos immunoreactivity, and a subset of Fos-immunoreactive neurons (IRNs) in these nuclei contain glutamic acid decarboxylase (GAD), a marker of GABAergic cells. We recently showed that the numbers of Fos-positive (Fos+) and Fos+ GAD-IRNs in both the MnPN and the vlPOA are positively correlated with the total amount of preceding sleep. The present study was designed to clarify whether or not activation of sleep-related neurons in the rat MnPN and vlPOA is associated with rapid eye movement (REM) sleep regulation. Expression of c-fos in MnPN and vlPOA neurons was examined under conditions of spontaneous sleep, REM sleep restriction, and REM sleep recovery after REM sleep restriction. Across all conditions, the number of Fos-IRNs was highest in REM-sleep-restricted rats displaying the highest levels of REM sleep homeostatic pressure/drive, i.e., those rats exhibiting the most frequent attempts to enter REM sleep. This finding provides the first evidence that activation of subsets of MnPN and vlPOA neurons is more strongly related to REM sleep pressure than to REM sleep amount.
Keywords: sleep homeostasis, REM sleep, sleep deprivation, ventrolateral preoptic area, GABA, median preoptic nucleus
Introduction
Recent studies demonstrate that the median preoptic nucleus (MnPN) and the ventral lateral preoptic area (vlPOA) of the hypothalamus are involved in sleep–waking regulation. Both nuclei contain sleep-active neurons (Sherin et al., 1996, 1998; Szymusiak et al., 1998; Gong et al., 2000; Suntsova et al., 2002), and a subset of these neurons express glutamic acid decarboxylase (GAD), a marker of GABAergic cells (Sherin et al., 1998; Gaus et al., 2002; Gong et al., 2004). The number of Fos-positive (Fos+) and Fos+ GAD-immunoreactive neurons (IRNs) in both the MnPN and the vlPOA are positively correlated with the amount of preceding sleep (Sherin et al., 1996; Gong et al., 2000, 2004). However, it is unclear whether sleep-induced c-Fos immunoreactivity (IR) in MnPN and vlPOA cells is related to rapid eye movement (REM) or non-REM sleep.
Anatomical evidence suggests that the MnPN and the vlPOA may play a role in REM sleep control. Both regions project to monoaminergic and orexinergic neurons (Gritti et al., 1994; Zardetto-Smith and Johnson, 1995; Sherin et al., 1998; Steininger et al., 2001; Thompson and Swanson, 2003) that exhibit suppression of discharge during REM sleep (McGinty and Harper, 1976; Aston-Jones and Bloom, 1981; Heym et al., 1982; Sakai, 1986, 1988). Some evidence suggests that the quiescence of these cells during REM sleep is attributable to GABA-mediated inhibition (Nitz and Siegel, 1997a,b; Gervasoni et al., 2000). Therefore, activation of MnPN and vlPOA GABAergic cells could be involved in the inhibition of arousal systems (Saper et al., 2001; McGinty et al., 2004) and promote REM sleep.
The hypothesized role of the MnPN and the vlPOA in REM sleep regulation is consistent with electrophysiological findings: during spontaneous sleep in rats, a subset of MnPN and vlPOA neurons discharge faster during REM sleep compared with non-REM sleep or waking (Szymusiak et al., 1998; Suntsova et al., 2002).
The main goal of the present study was to determine whether activation of neurons in the rat MnPN and vlPOA, measured by c-Fos IR, is associated with REM sleep regulation. Experiments were designed to compare groups of rats expressing different amounts of REM sleep and differing degrees of REM sleep homeostatic pressure/drive; c-Fos IR was examined in the conditions of spontaneous sleep, REM sleep restriction, and recovery sleep after REM restriction.
Materials and Methods
All experiments were approved by the Animal Care and Use Committee at Veterans Affairs Greater Los Angeles and were conducted according to the guidelines of the National Research Council.
Animals and experimental environment
Thirty-eight male Sprague Dawley rats, weighing 280–320 g at the beginning of the experiments, were acclimated to a 12 h light/dark cycle (lights on at 8:00 A.M.). The rats were housed individually in environmental chambers. Food and water were available ad libitum, and the ambient temperature was maintained at 23 ± 0.5°C.
Surgical procedures and recording
Under ketamine/xylazine anesthesia (80 and 10 mg/kg, i.p., respectively), rats were surgically implanted with chronic cortical electroencephalogram (EEG) and dorsal neck electromyogram (EMG) electrodes for assessment of sleep–wakefulness states. Briefly, stainless steel screw electrodes were implanted in the skull for EEG recordings, and flexible, insulated stainless steel wires were threaded into neck muscles for EMG recordings. Leads from the electrodes were soldered to a small Amphenol connector, and the complete assembly was anchored to the skull with dental acrylic.
Animals were allowed a 7–9 d recovery period after surgery. For five consecutive days before the experimental day, the rats were connected to a recording cable that was lightly suspended above them by a counter-weighted beam. They remained connected to the cable for 5–6 h (started at 8:00 A.M.) each day. The recording cable joined the miniature connector on the animal’s head to a polysomnographic recording device (Embla; Medcare Flaga Medical Devices, Reykjavik, Iceland). The EEG and EMG recordings were digitally displayed and stored on a computer using Somnologica software (Somnologica Studio; Medcare Flaga Medical Devices). During experiments, EEG and EMG signals were recorded continuously.
Experimental groups
In experiment 1, rats (n = 10) were allowed 2 h spontaneous sleep–waking behavior beginning at 9:00 A.M. In experiment 2, rats (n = 14) were REM sleep restricted for a 2 h period beginning at 9:00 A.M. To interrupt REM sleep episodes, rats were subjected to gentle arousing stimuli (tapping on the cage and/or slight movement of the cage) within 20–25 s of the appearance of first signs of the non-REM to REM sleep transition. The REM transition was defined by the appearance of high-amplitude spindles and theta activity intermixed with EEG slow-wave activity, with diminishing EMG tonus. Rats were allowed to complete the REM transition period (8–10 s in duration) and a 12–15 s period of actual REM sleep before being awakened. In experiment 3, rats (n = 14) were REM sleep restricted from 9:00 A.M. to 11:00 A.M. and then permitted recovery sleep for either 1 h (n = 5) or 2 h (n = 5). Immediately after the end of all recordings, rats were given a lethal dose of anesthetic followed by perfusion (see below).
Immunohistochemistry
Under deep pentobarbital anesthesia (100 mg/kg), animals were transcardially perfused with 0.12 m Millonig’s phosphate buffer (MPB) for 5 min, followed by 500 ml of 4% paraformaldehyde (PFA) in 0.12 m MPB. After perfusion, the bodies of the perfused animals were kept at 4°C for 1 h. The brains were then removed, postfixed in the same PFA solution for 1 h, washed in 0.12 m MPB, and transferred successively to 10, 20, and 30% sucrose at 4°C until they sank. Brain tissue was processed for double immunostaining for Fos, the protein product of the immediate-early gene c-fos (Morgan and Curran, 1986; Dragunow and Faull, 1989), and GAD. Coronal sections, 30 μm, were cut through the MnPN and the vlPOA on a freezing microtome. The sections were processed for Fos protein staining first. Sections were incubated overnight in a rabbit anti-c-Fos primary antiserum (AB-5, 1:15,000; Oncogene Science, Uniondale, NY) on a shaking table, at 4°C. Sections were processed with biotinylated goat anti-rabbit IgG (1:800; Vector Laboratories, Burlingame, CA) for 1.5 h at room temperature, followed by reaction with avidin–biotin complex (Vector Elite kit, 1:200; Vector Laboratories). Sections were developed with nickel–diaminobenzidine tetrahydrochloride (DAB), which produced a black reaction product in cell nuclei. There was no nuclear staining in the absence of primary antiserum. To stain for GAD, we used mouse anti-GAD67 monoclonal antibody (MAB5406, lot 24100380; Chemicon, Temecula, CA). This antibody (raised against recombinant GAD67 protein) is specific for GAD67 and shows no reactivity to GAD65 by Western blot (the technical information of the manufacturer). The antibody has been used successfully for Western blot and immunohistochemistry on rat and mouse tissue (the technical information of the manufacturer). The sections were incubated into the primary antibody (1:300) at 4°C over 48 h, processed with biotinylated anti-mouse IgG (BA-2001, 1:500; Vector Laboratories), and developed with DAB to produce a brown reaction product (Fig. 1). Omission of the GAD primary antibody resulted in the absence of specific staining. We always performed matched immunological processing of tissue simultaneously on pairs of brains from the different experimental groups.
Figure 1.

Examples of Fos single-labeled (filled arrowhead), GAD single-labeled (open arrow), and Fos+ GAD double-labeled (filled arrow) neurons in the MnPN. The Fos protein is stained black and confined to the nucleus. The GAD-IRNs are stained brown, and the staining is evident throughout the soma and the proximal dendrites.
After the staining, the sections were mounted on gelatinized slides, dehydrated through graded alcohol, and coverslipped with Depex.
Data analysis
Sleep analysis.
Sleep–wakefulness states of the rats were determined by an experienced scorer on the basis of the predominate state within each 10 s epoch. The scorer was blind to experimental condition and group identity of the animal. Wakefulness was defined by the presence of low-amplitude and high-frequency EEG activity combined with elevated neck muscle tone. Non-REM sleep consisted of a high-amplitude slow-wave EEG together with low-EMG tone relative to wakefulness. Epochs of transitions from non-REM to REM sleep, which were defined by the appearance of high-amplitude spindles and theta activity intermixed with EEG slow-wave activity, were scored as non-REM sleep. REM sleep was identified by the presence of a moderate-amplitude EEG with dominant theta frequency activity coupled with complete muscle atonia in the EMG, except for occasional brief twitches. REM sleep episodes were divided into brief/aborted (<20 s in duration) and full-length/stable (>20 s in duration) episodes. Numbers of onset and mean durations were calculated for both brief and full-length REM sleep episodes (see Tables 1, 3).
Table 1.
Percentage of time spent in non-REM sleep and REM sleep and mean numbers and mean durations of full-length and aborted REM sleep bouts for spontaneously sleeping rats (n = 10)
| Behavioral stages | Rats with low % REM sleep (n = 4) | Rats with high % REM sleep (n = 6) |
|---|---|---|
| Non-REM sleep (%) | 63.5 ± 1.2 | 63.9 ± 1.2 |
| REM sleep (%) | 13.4 ± 1.1 | 19.4 ± 0.6* |
| Mean numbers of full-length REM bouts | 7.5 ± 0.64 | 11.5 ± 0.6* |
| Mean durations of full-length REM bouts (min) | 1.7 ± 0.1 | 1.85 ± 0.13 |
| Mean numbers of aborted REM episodes | 10.4 ± 0.71 | 8.1 ± 0.53 |
| Mean durations of aborted REM episodes (s) | 19.2 ± 0.6 | 14.9 ± 2.89 |
Percentages of non-REM sleep and REM sleep were calculated for a 2 h recording period before the rats were killed and were examined across the groups of spontaneously sleeping rats by unpaired t test. Percentage of non-REM sleep was not significantly different, but the percentage of REM sleep was significantly different between the two groups of rats (t(8)5.2; *p < 0.001). Rats exhibiting high percentage of REM sleep had significantly higher numbers of full-length REM bouts compared with the other group (t(8) = 5.4; *p < 0.001), whereas mean durations of REM bouts did not differ between the groups.
Table 3.
Percentage of time spent in non-REM sleep and REM sleep and mean numbers and mean durations of full-length and aborted REM sleep bouts for rats that were allowed 1 or 2 h recovery sleep after 2 h REM sleep restriction (n = 10)
| Behavioral stages | 1 h recovery rats (n = 5) | 2 h recovery rats (n = 5) |
|
|---|---|---|---|
| The first 1 h period | The second 1 h period | ||
| Non-REM sleep (%) | 60.1 ± 1.4 | 61.3 ± 1.5 | 62.1 ± 1.2 |
| REM sleep (%) | 26.1 ± 0.8 | 25.7 ± 1.1 | 19.1 ± 0.6* |
| Mean numbers of full-length REM bouts | 8.1 ± 0.9 | 7.8 ± 0.74 | 5.6 ± 0.5* |
| Mean durations of full-length REM bouts (min) | 1.78 ± 0.11 | 1.751.81 ± 0.1 | 1.81 ± 0.09 |
| Mean numbers of aborted REM episodes | 6.5 ± 0.7 | 6.1 ± 0.8 | 4.2 ± 0.5 |
| Mean durations of aborted REM episodes (s) | 11.3 ± 3.01 | 14.9 ± 1.9 | 18.9 ± 2.7 |
In 1 h recovery rats, percentage of non-REM sleep and percentage of REM sleep were calculated for a 1 h recording period before the rats were killed. In 2 h recovery animals, percentage of non-REM sleep and percentage of REM sleep were calculated for both the first and the second hours of the 2 h recording period before the rats were killed. Differences in percentage of sleep stages between the groups of REM sleep recovery rats were assessed with an unpaired t test; comparison was done between the values of the last 1 h periods before the rats were killed. No significant difference was seen in percentage of non-REM sleep, whereas percentage of REM was significantly different between the groups (t(8) = 7.3; *p < 0.001). The 2 h recovery rats had significantly fewer full-length REM sleep bouts during the second hour versus the first hour of recovery sleep (t(8) = 3.9; *p < 0.001).
In experiment 1, percentage of time spent in non-REM sleep and percentage of time spent in REM sleep as well as the frequency and mean durations of REM sleep episodes (aborted and full-length) were calculated for 2 h recording period before the rats were killed. Spontaneously sleeping rats were divided into groups with high and comparatively low mean REM sleep percentage.
During REM sleep restriction (experiments 2 and 3), REM sleep pressure was defined by counting the number of REM sleep entries within the experimental procedure. To track the accumulation of REM sleep pressure, the number of REM sleep entries in each animal was averaged per consecutive 10 min interval of the 2 h REM sleep restriction period.
In experiment 2, rats were divided into low, moderate, and high REM-sleep-pressure groups. REM sleep pressure was considered to be high in rats (n = 5) that manifested the highest numbers of REM sleep attempts (61.4 ± 3.3) and low in rats (n = 5) that had the lowest numbers of REM sleep entries (20.4 ± 1.8). Average number of REM sleep entries in a third group of rats (n = 4) was 40.5 ± 4.4, and they were considered to have a moderate level of REM sleep pressure. Mean durations of scored REM sleep bouts were calculated for all three groups of REM-restricted animal (see Table 2). Percentage of time spent in REM sleep and percentage of time spent in non-REM sleep were calculated for 2 h recording period before the rats were killed.
Table 2.
Number of attempts to enter into REM sleep, mean durations of REM episodes, and percentage of time spent in REM sleep and non-REM sleep for REM-restricted rats (n = 14)
| Behavioral stages | Rats with low REM sleep pressure (n = 5) | Rats with moderate REM sleep pressure (n = 4) | Rats with high REM sleep pressure (n = 5) |
|---|---|---|---|
| REM sleep attempts (n) | 20.4 ± 1.8 | 40.5 ± 4.4* | 61.4 ± 3.3* |
| Durations of REM episodes (s) | 13.6 ± 0.6 | 14.1 ± 0.8 | 11.7 ± 0.5 |
| Accumulated REM sleep (%) | 3.9 ± 0.4 | 8.1 ± 0.5* | 10.1 ± 0.5* |
| Non-REM sleep (%) | 62.4 ± 2.1 | 63.2 ± 1.4 | 64.3 ± 2.5 |
Mean numbers of REM sleep attempts/entries, mean durations of REM sleep episodes, percentage of REM sleep, and percentage of non-REM sleep were calculated for a 2 h recording period before the rats were killed. The numbers of REM sleep entries (F(2,11) = 44.5; p < 0.001) and percentage of accumulated REM sleep (F(2,11) = 79.5; p < 0.001) were significantly different across the groups of REM-sleep-restricted animals. *p < 0.050, significantly different from all other groups by Newman–Keuls test.
In experiment 3, four of the experimental rats expressed low REM sleep pressure during the REM sleep restriction period (average number of REM sleep entries was 22 ± 1.4), and, therefore, we excluded them from the following steps of the experiment. Ten rats revealed moderate to high level of REM sleep pressure (average number of REM sleep was 57.7 ± 2.4), and these animals were allowed either 1 h (n = 5) or 2 h (n = 5) recovery sleeps after the 2 h period of REM sleep restriction.
In REM sleep recovery rats, percentage of non-REM sleep and percentage of REM sleep as well as the frequency and mean durations of REM sleep episodes (aborted and full-length) were calculated for the last 1 or 2 h of the recording period before the rats were killed.
Cell counts.
Cell counts were conducted by an individual who was blind to the experimental condition of the animals. The Neurolucida computer-aided plotting system (MicroBrightField, Williston, VT) was used to identify and quantify neurons that were single labeled for c-Fos-IR and double-labeled for Fos+ GAD-IR. Section outlines were drawn under 20× magnification. Fos-IRNs and Fos+ GAD-IRNs were mapped in the section outlines under 400× magnification. All cell counts were calculated for constant rectangular grids corresponding to four areas of interest. (1) The rostral MnPN (rMnPN) grid was a 600 × 600 μm square, centered on the apex of the third ventricle rostral to the decussation of the anterior commissure and to bregma (anterior, 0.1 mm) (Gong et al., 2000). (2) The caudal MnPN (cMnPN) grid was placed immediately dorsal to the third ventricle at the level of the decussation of the anterior commissure, extending 150 μm laterally and 600 μm dorsally just caudal to bregma (anterior, −0.26 mm) (Gong et al., 2000). The vlPOA counting grid was placed at the level of 160 μm or more caudal to the organum vasculosum of the lamina terminalis (approximately anterior, from −0.3 to −0.7 mm relative to bregma) and was subdivided into core and extended sections (Lu et al., 2002). (3) The vlPOA core box was 300 μm wide by 300 μm high, placed along the base of the brain, with its far border 400 μm lateral to the lateral edge of the optic chiasm. (4) The medial extended vlPOA box was medial to the vlPOA core, 400 μm wide by 300 μm high. The dorsal extended vlPOA box was 200 μm wide by 300 μm high, positioned above the vlPOA core and medial extended vlPOA boxes and centered over their border.
For both the rMnPN and the cMnPN, cell counts were made in three sections and averaged to yield a single value for each rat. For vlPOA, cell counts were made bilaterally in three sections containing the largest part of the vlPOA. Those six counts were then averaged to yield a single value for both the vlPOA core and extended vlPOA (medial and dorsal sections combined) for each rat.
Statistical analysis
All results are reported as mean ± SEM. Differences in sleep stage percentages and the frequency and mean durations of REM sleep episodes between rats with high and comparatively low spontaneous REM sleep, and between REM-sleep-restricted rats permitted 1 h recovery sleep and those permitted 2 h recovery sleep were assessed with an unpaired t test (see Tables 1, 3). One-way non-repeated-measures ANOVA was calculated for sleep stage percentages across groups of REM-sleep-restricted rats. A similar ANOVA was calculated for the number of attempts to enter into REM sleep and the mean durations of scored REM bouts across groups of REM-sleep-restricted rats (see Table 2).
For correlation analysis, mean numbers of single Fos-IRNs and Fos+ GAD-IRNs in MnPN and vlPOA sites of spontaneously sleeping and REM sleep recovery rats were plotted against amounts of recorded REM sleep (see Figs. 2, 6). In REM-sleep-restricted rats, a correlation coefficient was calculated for single Fos+ and double Fos+ GAD-IRNs in the MnPN and the vlPOA versus the number of attempts to enter into REM sleep (see Fig. 5).
Figure 2.
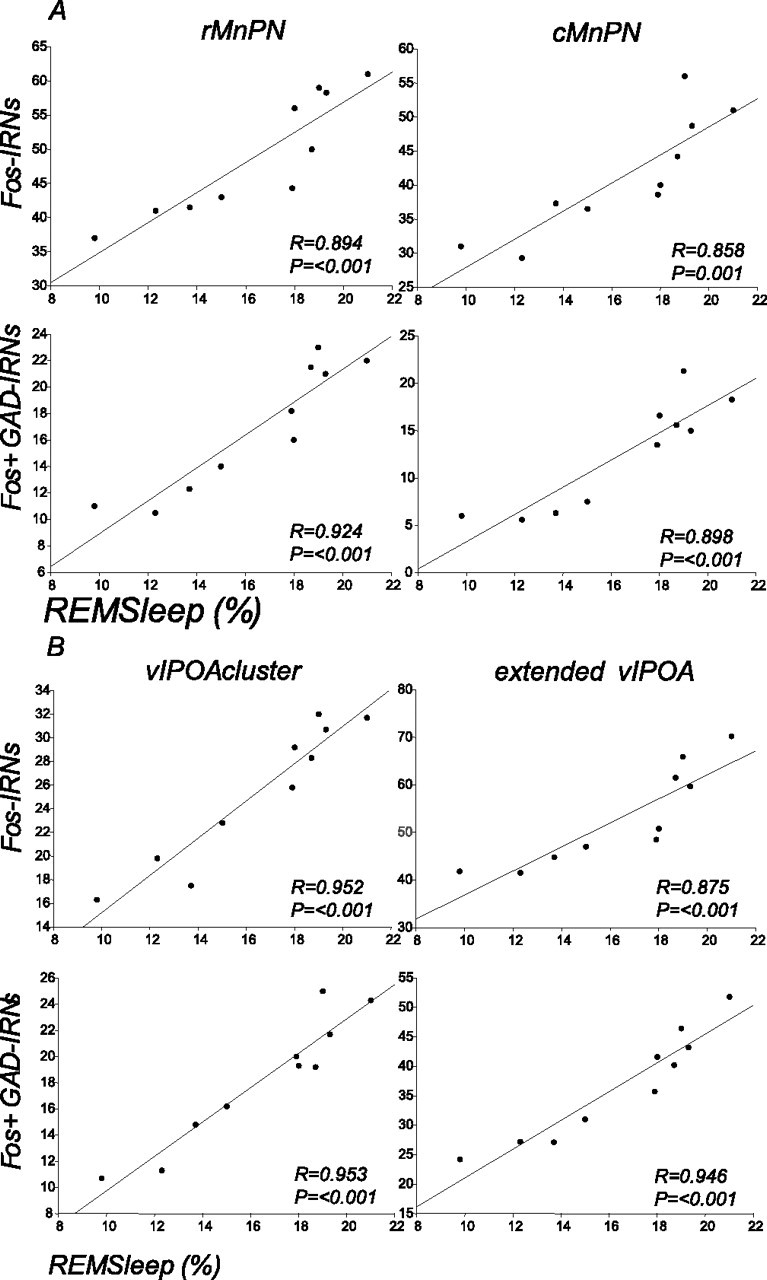
Regression lines and scatter plots of the number of Fos-IRNs and Fos+ GAD-IRNs versus the mean percentage of time spent in REM sleep in MnPN (A) and vlPOA (B) sites of spontaneously sleeping rats (n = 10).
Figure 6.
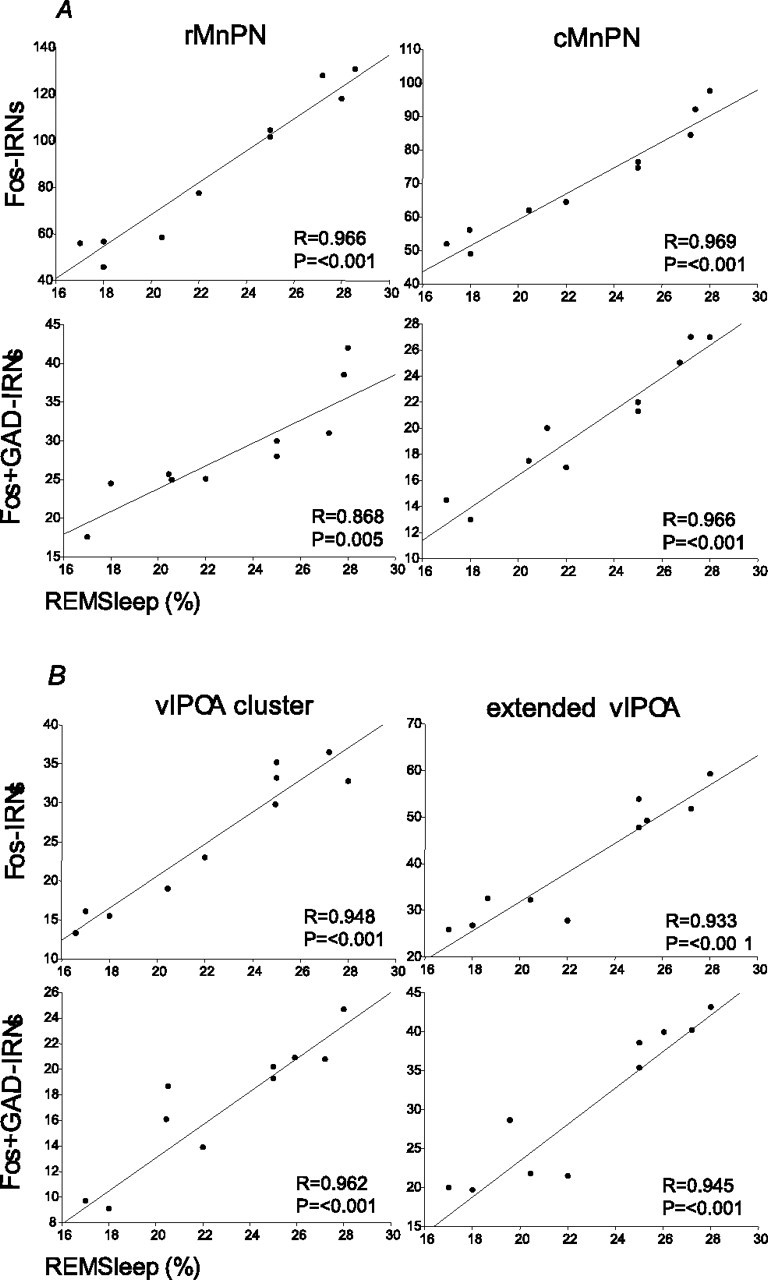
Regression lines and scatter plots of the number of Fos-IRNs and Fos+ GAD-IRNs versus the mean percentage of time spent in REM sleep in MnPN (A) and vlPOA (B) sites of REM-sleep-restricted rats (n = 10) that were permitted either a 1 h (n = 5) or 2 h (n = 5) recovery period.
Figure 5.
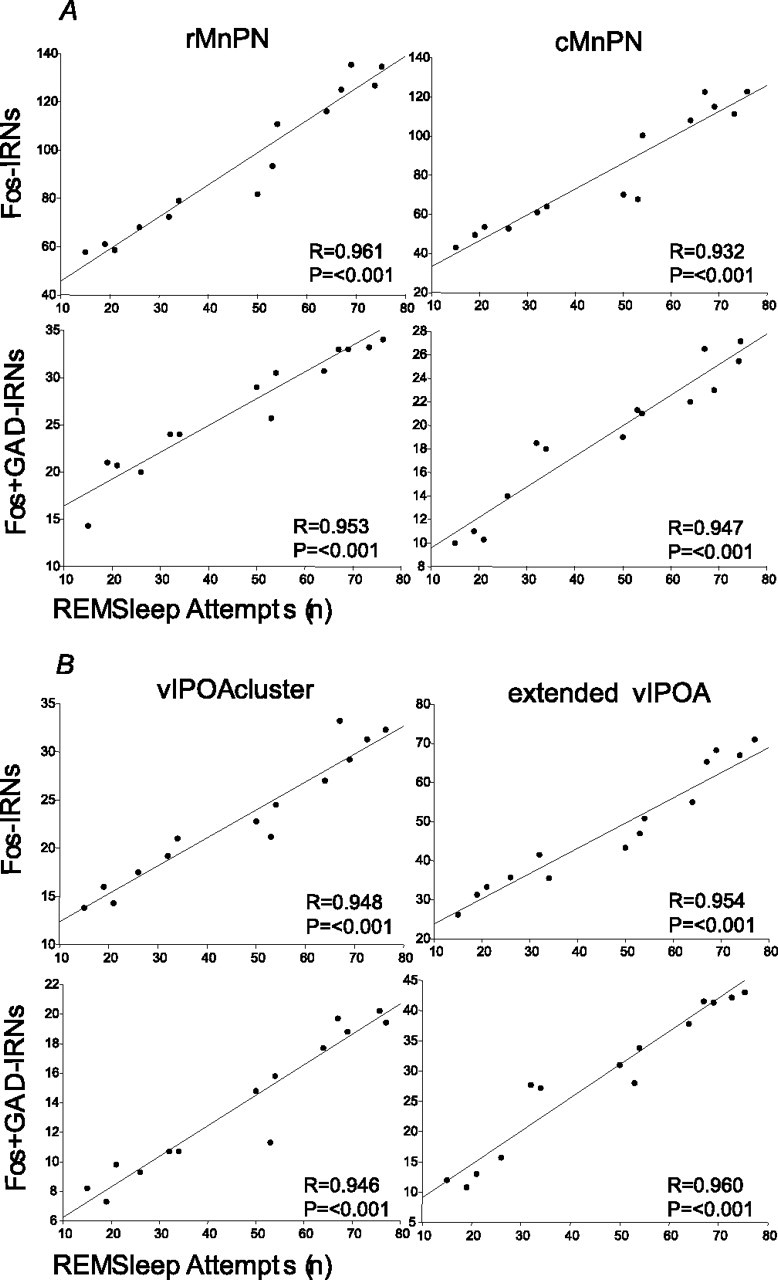
Regression lines and scatter plots of the number of Fos-IRNs and Fos+ GAD-IRNs versus the total number of REM sleep attempts in MnPN (A) and vlPOA (B) sites of REM-sleep-restricted rats (n = 14).
For single Fos-IR cell counts in MnPN and vlPOA sites across all seven experimental groups, a one-way non-repeated-measures ANOVA was calculated (see Fig. 7A,C). A similar ANOVA was calculated for Fos+ GAD-IRNs in MnPN and vlPOA sites across the same groups of rats (see Fig. 7B,D). After all ANOVAs, significance of the differences between individual group means was assessed by Newman–Keuls post hoc tests.
Figure 7.

Mean numbers of Fos-IRNs (A) and Fos+ GAD-IRNs (B) in rMnPN and cMnPN, respectively, and Fos-IRNs (C) and Fos+ GAD-IRNs (D) in vlPOA cluster and extended vlPOA across all experimental groups. For single Fos-IR cell counts in the MnPN, ANOVA indicated significant effects of experimental conditions in both the rostral (F(6,27) = 70.8; p < 0.001) and caudal (F(6,27) = 60.9; p < 0.001) portions of the MnPN. Significant effects of experimental conditions were seen in vlPOA cluster (F(6,27) = 29.4; p < 0.001) and extended vlPOA (F(6,27) = 34.0; p < 0.001) as well. There were significant effects of experimental conditions for double Fos+ GAD-IR cell counts in both rostral (F(6,27) = 22.9; p < 0.001) and caudal (F(6,27) = 42.7; p < 0.001) MnPN, vlPOA cluster (F(6,27) = 19.9; p < 0.001), and extended vlPOA (F(6,27) = 86.8; p < 0.001). Individual group mean differences as determined by post hoc tests (Newman–Keuls) are indicated by asterisks (*p < 0.01; **p < 0.001).
Results
Experiment 1: spontaneous sleep and waking
Table 1 presents the mean percentage time spent in different sleep stages and the frequency and mean durations of REM sleep episodes for the rats (n = 10) that were allowed 2 h spontaneous sleep and waking. As shown, one group of rats (n = 6) manifested high mean percentage of REM sleep (19.4 ± 0.6%), whereas the other group (n = 4) had a significantly lower mean REM sleep percentage (13.4 ± 1.1%; p < 0.001). Rats exhibiting comparatively low percentage of REM sleep had significantly lower numbers of full-length REM sleep episodes compared with the other group, whereas mean durations of REM sleep episodes did not differ between the groups. Mean percentage of non-REM sleep in these rats did not differ significantly.
Correlation analysis in spontaneously sleeping rats showed that the numbers of single Fos+ and double Fos+ GAD-IRNs in MnPN and vlPOA sites were positively correlated with the percentage of REM sleep calculated for the 2 h recording period before the rats were killed (Fig. 2).
Experiment 2: REM sleep restriction
Animals (n = 14) exhibited different degrees of REM sleep pressure estimated by the number of attempts to enter into REM sleep during REM sleep restriction procedure (see Materials and Methods) (Table 2, Fig. 3). However, all rats manifested evidence of gradual elevation of REM sleep pressure: the number of REM sleep entries progressively increased within the REM sleep restriction period (Fig. 4).
Figure 3.

Examples of sleep–waking organization in a 2 h period of REM sleep restriction in one rat with low REM sleep pressure (A) and one rat with high REM sleep pressure (B). W, Waking; NREM, non-REM.
Figure 4.
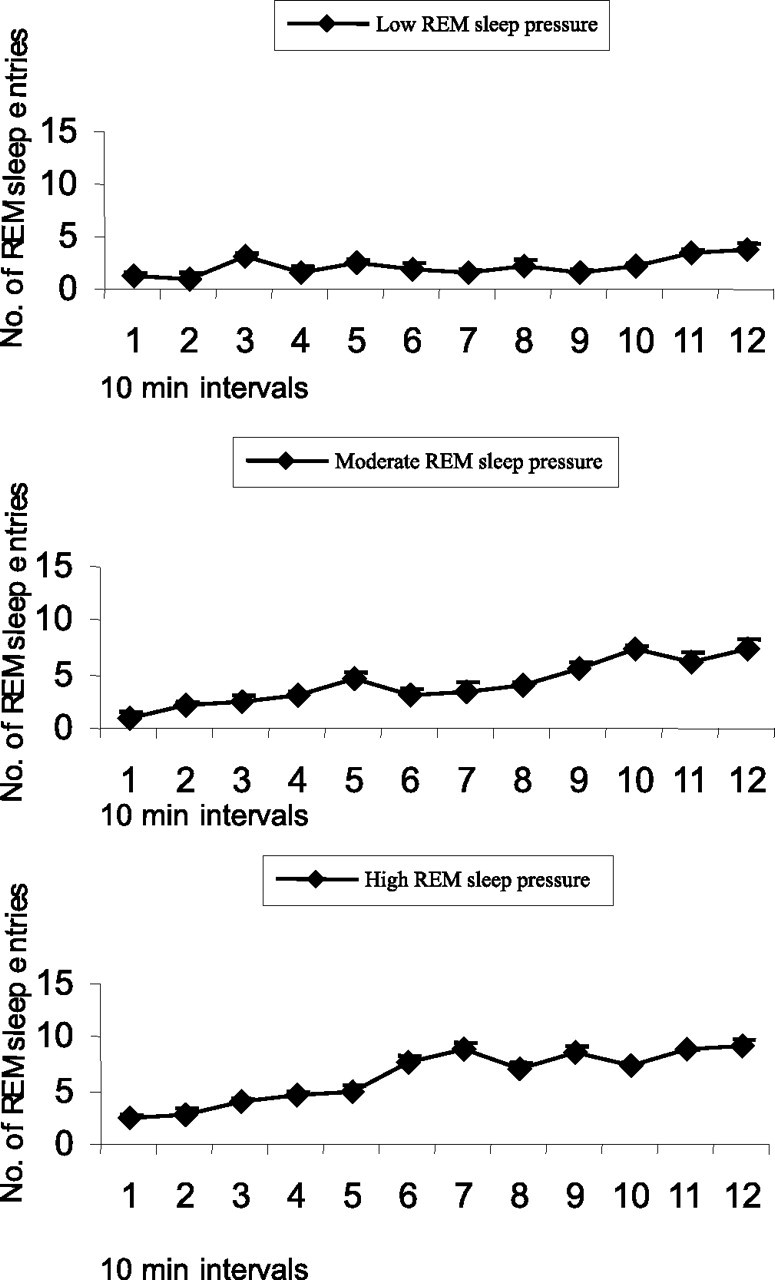
Average numbers of attempts to enter REM sleep during consecutive 10 min intervals across a 2 h period of REM sleep restriction for rats (n = 14) with different degrees of REM sleep pressure: low REM sleep pressure (n = 5), moderate REM sleep pressure (n = 4), and high REM sleep pressure (n = 5).
Table 2 presents mean numbers of attempts to enter into REM sleep, mean durations of scored REM bouts, percentage of time spent in REM sleep, and percentage of time spent in non-REM sleep for the groups of REM-sleep-restricted rats. As shown, mean percentage of time of accumulated REM sleep increased in parallel with an increase in the level of REM sleep pressure estimated by the number of attempts to enter into REM sleep. Mean percentage of non-REM sleep in these animals did not differ from that in spontaneously sleeping rats (Table 1).
The numbers of single Fos+ and double Fos+ GAD-IRNs in MnPN and vlPOA sites of REM-sleep-restricted rats were positively correlated with the number of attempts to enter into REM sleep during the 2 h period of REM sleep restriction (Fig. 5).
Experiment 3: recovery after REM sleep restriction
During REM sleep restriction, 10 rats revealed moderate to high levels of REM sleep pressure (see Materials and Methods); the average number of REM sleep entries was 57.7 ± 2.4, and the rats manifested evidence of gradual accumulation of REM sleep pressure within the experiment (data are not shown). The mean percentage of time of accumulated REM sleep (10.4 ± 0.8%) was comparable with that in rats with high REM sleep pressure in experiment 2 (Table 2). No significant difference was seen in the percentage of non-REM sleep (62.1 ± 2.8%) of these rats compared with spontaneously sleeping and REM-sleep-restricted rats (Tables 1, 2).
During the first hour of recovery sleep, all rats (n = 10) manifested a significant increase in percentage of REM sleep compared with that in spontaneously sleeping rats, whereas the second hour was characterized by significant decrease in percentage of time spent in REM sleep (Tables 1, 3). In 2 h recovery rats, the number of REM sleep episodes during the second hour of recovery sleep was significantly decreased compared with both the first hour and the value in 1 h recovery rats (Table 3).
Single Fos+ and double Fos+ GAD-IR cell counts in both MnPN and vlPOA sites of REM sleep recovery rats were positively correlated with the percentage of REM sleep, calculated for the last 1 h period before the animals were killed (Fig. 6).
Fos-IR and Fos+ GAD-IR in MnPN and vlPOA neurons across all experimental groups
Figure 7 presents mean numbers of single Fos+ and Fos+ GAD-IRNs in the MnPN and vlPOA of all experimental groups. The number of Fos-IRNs and Fos+ GAD-IRNs in the rostral and caudal MnPN of REM-sleep-restricted/high REM-sleep-pressure rats was significantly elevated compared with both groups of spontaneously sleeping rats (Fig. 7A,B). The number of Fos+ and Fos+ GAD-IRNs throughout the MnPN was also significantly higher in 1 h REM sleep recovery rats compared with both the low and high spontaneous REM sleep groups. In addition, there was a significant reduction in the number of single Fos+ and Fos+ GAD-IRNs during the second versus the first hour of recovery sleep after REM sleep restriction. For a summary of other between-group differences, see Figure 7, A and B, and the accompanying legend.
In contrast to the MnPN, the number of single Fos-IRNs in the extended vlPOA and vlPOA cluster was not significantly elevated in REM-sleep-restricted/high REM-sleep-pressure rats compared with high spontaneous REM sleep rats (Fig. 7C,D), nor were there any significant differences in Fos-IR cell counts between the 1 h REM sleep recovery and the high spontaneous REM sleep condition. Similar to the MnPN, the number of both single Fos+ and Fos+ GAD-IRNs in the extended vlPOA and the vlPOA cluster did significantly decrease during the second versus the first hour of recovery sleep after REM sleep restriction. One difference between the extended vlPOA and the vlPOA cluster was that a significant elevation in the number of Fos+ GAD-IRNs in the 1 h recovery versus the high spontaneous REM sleep condition was observed only in the extended vlPOA. For a summary of other between-group differences, see Figure 7, C and D, and the accompanying legend.
Extent of GAD-positive Fos-IR in MnPN and vlPOA sites in response to REM sleep restriction
Only 22–26% of Fos-IRNs in the MnPN of REM-sleep-restricted rats were immunoreactive for GAD (Table 4). REM-sleep-restricted rats, which displayed moderate and high levels of REM sleep pressure, showed significantly higher numbers of Fos-IRNs compared with spontaneously sleeping rats (Fig. 7), but a majority of the Fos-IRNs in the MnPN of these rats were located in the neurons that did not colocalize GAD. Percentage of Fos+ GAD-IRNs in REM-sleep-restricted animals was significantly lower than that in spontaneously sleeping rats (Table 4). In contrast to MnPN, a majority (65%) of vlPOA neurons expressing Fos in response to REM sleep restriction were immunoreactive for GAD (Table 4).
Table 4.
Percentage Fos+ GAD-IRNs in MnPN and vlPOA sites of rats with high spontaneous REM sleep, REM-sleep-restricted rats with high REM sleep pressure, and REM-sleep-restricted rats that were permitted a 1 h recovery sleep after REM sleep restriction
| Sites of the preoptic area | Rats with high spontaneous REM sleep | REM-sleep-restricted rats with high REM sleep pressure | REM-sleep-restricted rats with 1 h recovery sleep |
|---|---|---|---|
| rMnPN | 39.9 ± 1.3% | 26.3 ± 0.9%* | 29.9 ± 1.7%* |
| cMnPN | 36.1 ± 4.1% | 21.7 ± 0.9%** | 29.4 ± 1.6% |
| vlPOA cluster | 68.3 ± 1.8% | 64.7 ± 3.2% | 61.0 ± 2.5% |
| Extended vlPOA | 77.6 ± 4.6% | 64.6 ± 3.1% | 73.9 ± 2.6% |
Percentage of Fos+ GAD-IRNs in rostral (F(2,13) = 12.5; p < 0.001) and caudal (F(2,13) = 6.4; p = 0.01) parts of the MnPN were significantly different across the three groups of animals. *p < 0.050, significantly different from the group of spontaneously sleeping animals by Newman–Keuls test; **p < 0.050, significantly different from spontaneously sleeping rats by Newman–Keuls test.
Discussion
The main finding of this study was that, across three different experimental conditions, activation of neurons in the MnPN and vlPOA was most closely associated with homeostatic pressure for REM sleep rather than REM sleep amount. These findings provide the first evidence that the activity of subsets of preoptic area neurons is related to the need for REM sleep and that these neurons may constitute part of the forebrain circuitry involved in the homeostatic regulation of REM sleep.
Spontaneously sleeping rats (experiment 1) exhibited different amounts of REM sleep while having similar amounts of non-REM sleep (Table 1). The numbers of MnPN and vlPOA Fos+ and Fos+ GAD-IRNs in these animals were positively correlated with the percentage of REM sleep time. We assume that rats with high spontaneous REM sleep experienced elevated homeostatic pressure for this state compared with rats expressing low REM sleep time. This is supported by the finding that the number of full-length REM sleep episodes was higher in rats with high spontaneous REM sleep. REM-sleep-restricted rats (experiment 2) revealed different degrees of REM sleep homeostatic pressure defined by the number of attempts to enter REM sleep (Table 2). Fos+ and Fos+ GAD-IRNs in these animals were positively correlated with the number of REM sleep entries. REM-sleep-restricted rats that were permitted recovery sleep (experiment 3) exhibited REM sleep rebound (26.1 ± 0.8%) during the first hour of recovery, whereas the second hour was characterized by a return of percentage of REM sleep time toward baseline (19.1 ± 0.6%). Mean numbers of Fos+ and Fos+ GAD-IRNs in the MnPN and the vlPOA of REM sleep recovery rats decreased from the first to the second hour of recovery sleep. We infer that REM sleep homeostatic pressure during the first hour of recovery was stronger than during the second hour. The finding that the number of REM sleep episodes was higher during the first hour supports this assumption.
Our results suggest that a common element underlying MnPN and vlPOA neuronal activation in the experimental conditions studied was the level of REM sleep homeostatic pressure, not the amount of non-REM sleep or of REM sleep per se. First, there were no differences in non-REM sleep time among any of the experimental groups. Second, the numbers of Fos+ and Fos+ GAD-IRNs in REM-sleep-restricted rats were as high or higher than values in all other experimental groups (Fig. 7), although REM-restricted rats spent significantly less time in REM sleep than did spontaneously sleeping and REM sleep recovery rats (Tables 1–3). We hypothesize that the MnPN and the vlPOA contain neurons that promote transitions from non-REM to REM sleep in response to increasing homeostatic pressure for REM sleep. Fos-IR in these neurons could reflect patterns of neuronal activity occurring during transitions from non-REM to REM sleep, because REM-sleep-restricted rats experienced multiple transitions of this type.
A technical limitation of our study was the use of a monoclonal antibody for GAD67 to identify GABAergic neurons. It is possible that immunostaining methods did not label the entire GABAergic population because of low levels of protein in some cells. Therefore, we may be underestimating the number of MnPN and vlPOA GABAergic neurons that express c-fos in response to increasing REM sleep pressure.
The hypothetical role of the MnPN and the vlPOA in REM sleep regulation is supported by electrophysiological findings. A majority of neurons recorded in these nuclei exhibit elevated discharge rates during sleep compared with waking (Szymusiak et al., 1998; Suntsova et al., 2002). A subset of these sleep-active neurons exhibit maximum discharge during REM sleep, but, in most neurons of this type, discharge rates in REM sleep are only moderately higher than rates during non-REM sleep. There are no published data on discharge patterns of MnPN and vlPOA neurons after REM sleep restriction, but, based on our present findings, we predict that discharge of neurons in these nuclei should become more strongly REM sleep related in response to increasing REM sleep pressure.
Lu et al. (2000) have reported that loss of sleep-active cells in the extended vlPOA is correlated with decreases in REM sleep time, whereas loss of neurons in the vlPOA cluster correlated with decreases in non-REM sleep amounts (Lu et al., 2000). In the condition of enriched REM sleep after exposure of rats to dark treatment, the number of Fos-positive cells in the extended vlPOA was correlated with the preceding REM sleep amount (Lu et al., 2002). These two findings suggest that the vlPOA cluster and the extended vlPOA play differential roles in non-REM versus REM sleep regulation. In the present study, we observed that the number of Fos+ GAD neurons in the extended vlPOA was elevated during the first hour of recovery sleep compared with both the second hour of recovery and spontaneous sleep. In the vlPOA cluster, there were no differences in Fos+ GAD-IR cell counts among these conditions.
Our results demonstrate that acute REM sleep restriction led to an elevation of REM sleep homeostatic pressure indicated by increases in the number of attempts to initiate REM sleep (Fig. 4). Neurons involved in REM generation can be expected to exhibit increased activation in response to increasing homeostatic pressure for REM sleep. Therefore, we hypothesize that the MnPN and vlPOA neurons expressing Fos-IR during REM restriction are part of the neural circuitry involved in the generation of REM sleep. Involvement of forebrain mechanisms in REM sleep homeostasis is supported by the finding that chronic decerebrate cats do not exhibit a REM sleep rebound after REM deprivation (de Andres et al., 2003).
A limitation of our approach is an inability to distinguish between c-fos expression evoked in MnPN and vlPOA neurons by homeostatic pressure for REM sleep versus the process of initiating REM sleep. Rats exhibiting high REM sleep pressure in our REM restriction protocol undergo multiple, repeated non-REM to REM sleep transitions. Therefore, Fos-IR in this situation may occur predominately in neurons that discharge at high rates during such transition periods. These neurons may play an important mechanistic role in facilitating REM sleep onset but may not be responding directly to neurochemical signals coding homeostatic REM sleep pressure. Insight into the importance of REM sleep pressure versus REM sleep onset could be gained from examining Fos-IR in preoptic area neurons after 2 h of REM sleep restriction followed by a period of total REM sleep deprivation that eliminates non-REM to REM transitions.
The mechanism by which preoptic area neurons influence REM sleep generation may involve inhibition of rostral brainstem monoaminergic neurons. It is well accepted that inhibition of serotonergic cells in the dorsal raphe nucleus (DRN) and noradrenergic neurons in the locus ceruleus (LC) is a necessary prerequisite for REM sleep generation. These monoaminergic cells are active during waking, decrease activity during non-REM sleep, and become inactive during REM sleep (Heym et al., 1982; Fornal et al., 1985; Sakai, 1986; Reiner and McGeer, 1987; Yamuy et al., 1995, 1998; Thakkar et al., 1998; Gervasoni et al., 2000). Evidence suggests that the quiescence of these cells during REM sleep is attributable to GABA-mediated inhibition (Levine and Jacobs, 1992; Wang et al., 1992; Nitz and Siegel, 1996, 1997a,b; Gervasoni et al., 2000). Because both the MnPN and the vlPOA project to the DRN and LC (Zardetto-Smith and Johnson, 1995; Steininger et al., 2001; Lu et al., 2002) and they both contain populations of sleep-active GABAergic neurons, they may be a source of inhibition of monoaminergic systems at REM sleep onset.
In addition to activation of GABAergic neurons, our results demonstrate that increasing REM sleep pressure activates predominately non-GABAergic neurons in the MnPN. Only 22–26% of Fos-IRNs in the MnPN of high REM-sleep-pressure/REM-sleep-restricted rats were immunoreactive for GAD. This is in contrast to the vlPOA, in which 65% of Fos-IRNs were also positive for GAD. Furthermore, in the MnPN, the proportion of Fos-IRNs double labeled for GAD actually decreased between the high spontaneous REM sleep condition and the high REM-sleep-pressure/REM-sleep-restricted condition (26 vs 40% in rMnPN; 21 vs 36% in cMnPN). This indicates that, in conditions of high REM sleep pressure but low REM sleep amounts, activation in the MnPN occurs predominately in non-GABAergic neurons. What is the potential functional significance of activation of non-GABAergic MnPN neurons in response to increasing REM sleep homeostatic pressure? We hypothesize that these neurons are glutamatergic and function to promote REM sleep in two ways. First, they exert excitatory effects on vlPOA GABAergic neurons (Chou et al., 2002), which help to promote suppression of LC and DRN neurons. Second, they augment GABA-mediated inhibition in the LC and DRN via excitatory effects on local GABAergic interneurons in these areas. Thus, under conditions of elevated REM sleep homeostatic pressure, e.g., during REM sleep restriction and during recovery sleep after REM sleep restriction, activation of GABAergic and non-GABAergic MnPN neurons and of GABAergic/galaninergic neurons in the vlPOA function to suppress activity in brainstem monoaminergic neurons, leading to increased propensity for expression of REM sleep by brainstem REM sleep-generating circuitry.
Footnotes
This work was supported by the Medical Research Service of the Department of Veterans Affairs and National Institutes of Health Grants MH63323 and HL60296. We thank Keng-Tee Chew for technical assistance.
References
- Aston-Jones G, Bloom FE (1981). Activity of norepinepherine-containing locus coeruleus neurons in behaving rats anticipates fluctuations in the sleep-waking cycle. J Neurosci 1:876–886. [DOI] [PMC free article] [PubMed] [Google Scholar]
- Chou TC, Bjorkum AA, Gaus SE, Lu J, Scammell TE, Saper CB (2002). Afferents to the ventrolateral preoptic nucleus. J Neurosci 22:977–990. [DOI] [PMC free article] [PubMed] [Google Scholar]
- de Andres I, Garson M, Villablanca JR (2003). The disconnected brain stem does not support rapid eye movement sleep rebound following selective deprivation. Sleep 26:419–425. [DOI] [PubMed] [Google Scholar]
- Dragunow M, Faull R (1989). The use of c-fos as a metabolic marker in neuronal pathway tracing. J Neurosci Methods 29:261–265. [DOI] [PubMed] [Google Scholar]
- Fornal C, Auerbach S, Jacobs BL (1985). Activity of serotonin-containing neurons in nucleus raphe magnus in freely moving cats. Exp Neurol 88:590–608. [DOI] [PubMed] [Google Scholar]
- Gaus SE, Strecker RE, Tate BA, Parker RA, Saper CB (2002). Ventrolateral preoptic nucleus contains sleep-active, galaninergic neurons in multiple mammalian species. Neuroscience 115:285–294. [DOI] [PubMed] [Google Scholar]
- Gervasoni D, Peyron C, Rampon C, Barbagli B, Chouvet G, Urbain N, Fort P, Luppi PH (2000). Role and origin of the GABAergic innervation of dorsal raphe serotoninergic neurons. J Neurosci 20:4217–4225. [DOI] [PMC free article] [PubMed] [Google Scholar]
- Gong H, Szymusiak R, King J, Steininger T, McGinty D (2000). Sleep-related c-Fos protein expression in the preoptic hypothalamus: effects of ambient warming. Am J Physiol Regul Integr Comp Physiol 279:R2079–R2088. [DOI] [PubMed] [Google Scholar]
- Gong H, McGinty D, Guzman-Marin R, Chew KT, Stewart D, Szymusiak R (2004). Activation of c-fos in GABAergic neurons in the preoptic area during sleep and in response to sleep deprivation. J Physiol (Lond) 556:935–946. [DOI] [PMC free article] [PubMed] [Google Scholar]
- Gritti I, Mainville L, Jones BE (1994). Projections of GABAergic and cholinergic basal forebrain and GABAergic preoptic-anterior hypothalamic neurons to the posterior lateral hypothalamus of the rat. J Comp Neurol 339:251–268. [DOI] [PubMed] [Google Scholar]
- Heym J, Steinfels GF, Jacobs BL (1982). Activity of serotonin-containing neurons in the nucleus raphe pallidus of freely moving cats. Brain Res 251:259–276. [DOI] [PubMed] [Google Scholar]
- Levine ES, Jacobs BL (1992). Neurochemical afferents controlling the activity of serotoninergic neurons in the dorsal raphe nucleus: microiontophoretic studies in the awake cat. J Neurosci 12:4037–4044. [DOI] [PMC free article] [PubMed] [Google Scholar]
- Lu J, Greco M, Shiromani P, Saper CB (2000). Effects of the lesions of the ventrolateral preoptic nucleus on NREM and REM sleep. J Neurosci 20:3830–3842. [DOI] [PMC free article] [PubMed] [Google Scholar]
- Lu J, Bjorkum AA, Xu M, Gaus SE, Shiromani PJ, Saper CB (2002). Selective activation of the extended ventrolateral preoptic nucleus during rapid eye movement sleep. J Neurosci 22:4568–4576. [DOI] [PMC free article] [PubMed] [Google Scholar]
- McGinty D, Harper RM (1976). Dorsal raphe neurons: depression of firing during sleep in cats. Brain Res 101:569–575. [DOI] [PubMed] [Google Scholar]
- McGinty D, Gong H, Suntsova N, Alam N, Methippara M, Guzman-Marin R, Szymusiak R (2004). Sleep-promoting functions of the hypothalamic median preoptic nucleus: inhibition of arousal systems. Arch Ital Biol 142:501–509. [PubMed] [Google Scholar]
- Morgan JI, Curran T (1986). Role of ion flux in the control of c-fos expression. Nature 322:552–555. [DOI] [PubMed] [Google Scholar]
- Nitz D, Siegel J (1996). GABA release in posterior hypothalamus across sleep-wake cycle. Am J Physiol 271:R1707–R1712. [DOI] [PMC free article] [PubMed] [Google Scholar]
- Nitz D, Siegel J (1997a). GABA release in the dorsal raphe nucleus: role in the control of REM sleep. Am J Physiol 273:R451–R455. [DOI] [PMC free article] [PubMed] [Google Scholar]
- Nitz D, Siegel J (1997b). GABA release in the locus coeruleus as a function of sleep/wake state. Neuroscience 78:795–801. [DOI] [PMC free article] [PubMed] [Google Scholar]
- Reiner PB, McGeer PB (1987). Electrophysiological properties of cortically projecting histamine neurons of the rat hypothalamus. Neurosci Lett 73:43–47. [DOI] [PubMed] [Google Scholar]
- Sakai K (1986). Central mechanisms of paradoxical sleep. Brain Dev 8:402–407. [DOI] [PubMed] [Google Scholar]
- Sakai K (1988). Executive neurons of paradoxical sleep. Arch Ital Biol 126:239–257. [PubMed] [Google Scholar]
- Saper CB, Chou TC, Scammel TE (2001). The sleep switch: hypothalamic control of sleep and wakefulness. Trends Neurosci 24:726–731. [DOI] [PubMed] [Google Scholar]
- Sherin JE, Shiromani PJ, McCarley RW, Saper CB (1996). Activation of ventrolateral preoptic neurons during sleep. Science 271:216–219. [DOI] [PubMed] [Google Scholar]
- Sherin JE, Elmquist JK, Torrealba F, Saper CB (1998). Innervation of histaminergic tuberomammillary neurons by GABAergic and galaninergic neurons in the ventrolateral preoptic nucleus of the rat. J Neurosci 18:4705–4721. [DOI] [PMC free article] [PubMed] [Google Scholar]
- Steininger TL, Gong H, McGinty D, Szymusiak R (2001). Subregional organization of preoptic area/anterior hypothalamic projections to arousal-related monoaminergic cell groups. J Comp Neurol 429:638–653. [PubMed] [Google Scholar]
- Suntsova N, Szymusiak R, Alam MN, Guzman-Marin R, McGinty D (2002). Sleep-waking discharge patterns of median preoptic nucleus neurons in rats. J Physiol (Lond) 543:665–667. [DOI] [PMC free article] [PubMed] [Google Scholar]
- Szymusiak R, Alam MN, Steininger TL, McGinty D (1998). Sleep-waking discharge patterns of ventrolateral preoptic/anterior hypothalamic neurons in rats. Brain Res 803:178–188. [DOI] [PubMed] [Google Scholar]
- Thakkar MM, Strecker RE, McCarley RW (1998). Behavioral state control through differential serotoninergic inhibition in the mesopontine cholinergic nuclei: a simultaneous unit recoding and microdialysis study. J Neurosci 18:5490–5497. [DOI] [PMC free article] [PubMed] [Google Scholar]
- Thompson R, Swanson L (2003). Structural characterization of a hypothalamic visceromotor pattern generator network. Brain Behav Rev 41:153–202. [DOI] [PubMed] [Google Scholar]
- Wang QP, Ochiai H, Nakai Y (1992). GABAergic innervation of serotoninergic neurons in the dorsal raphe nucleus of the rats studied by electron microscopy double immunostaining. Brain Res Bull 29:943–948. [DOI] [PubMed] [Google Scholar]
- Yamuy J, Sampogna S, Lopez-Rodriguez F, Luppi PH, Morales FR, Chase MH (1995). Fos and serotonin immunoreactivity in the raphe nuclei of the cat during carbachol-induced active sleep: a double-labeling study. Neuroscience 67:211–223. [DOI] [PubMed] [Google Scholar]
- Yamuy J, Sampogna S, Morales FR, Chase MH (1998). c-fos expression in mesopontine noradrenergic and cholinergic neurons of the cat during carbachol-induced active sleep: a double-labeling study. Sleep Res Online 1:28–40. [PubMed] [Google Scholar]
- Zardetto-Smith A, Johnson A (1995). Chemical topography of efferent projections from the median preoptic nucleus to the pontine monoaminergic cell groups in the rat. Neurosci Lett 199:215–219. [DOI] [PubMed] [Google Scholar]