

Abstract
At early stages of brain development, GABA plays a dual role. It fulfills important trophic functions and provides a major excitatory drive for the immature neuronal network. Here, we investigated whether GABA itself can limit the strength of excitatory GABAergic synapses on Cajal-Retzius (CR) cells in sagittal slices from the mouse visual cortex. (2S)-3-[[(1S)-1-(3,4-dichlorophenyl)ethyl]amino-2-hydroxypropyl](phenylmethyl)phosphinic acid (CGP55845), a specific GABAB receptor (GABABR) blocker, increased the frequency of spontaneous Ca2+ transients and spontaneous and miniature IPSCs (mIPSCs) but did not affect mIPSC amplitudes or kinetics. CGP55845 significantly increased evoked IPSC (eIPSC) amplitudes and decreased the paired-pulse ratio (PPR). Baclofen, a specific GABABR agonist, produced opposite effects. The size of the readily releasable pool was not affected by these GABABR modulators. The same CGP55845 actions were observed at physiological temperatures, but they were abolished after glutamate decarboxylase block with 3-mercaptopropionic acid (3-MP). These results indicate that presynaptic GABABRs dynamically regulate GABA release probability. SNAP-5114, a specific GABA transporter-2/3 (GAT-2/3) blocker, enhanced mIPSC frequencies, decreased PPR, and increased eIPSC amplitudes without changing eIPSC kinetics. These effects were blocked by CGP55845 and 3-MP. NO-711, a specific GAT-1 blocker, prolonged eIPSC decay and decreased eIPSC/mIPSC amplitudes. These NO-711-mediated effects were not sensitive to CGP55845 and 3-MP. We conclude that the strength of GABAergic inputs to CR cells is constrained by GABABRs that are persistently activated by ambient GABA. The latter is also provided by GAT-2/3 operating in the reversed mode. Presynaptic GAT-1 functions in the uptake mode and possibly provides GABA for presynaptic vesicle filling.
Keywords: presynaptic inhibition, GABAB receptor, readily releasable pool, release probability, IPSCs, GAT-1, GAT-2/3
Introduction
The amino acid GABA is the main inhibitory neurotransmitter in the adult mammalian brain. In addition, it has a trophic role during neuronal maturation even before synapses are formed (for review, see Owens and Kriegstein, 2002; Represa and Ben-Ari, 2005). In the rodent neocortex, GABA is already present at embryonic day 14 (E14) (Van Eden et al., 1989). In addition to GABA, other components of the GABA signaling system are available at early developmental stages. GABAA receptors (GABAARs) are expressed by precursor cells in the neocortical proliferative zone and are activated by endogenous GABA (LoTurco et al., 1995). A pharmacological block of various GABA receptors (GABAA, GABAC, and GABAB) influences the motility of migrating cells, suggesting that GABA receptors are functional at this developmental stage (Behar et al., 1996; Manent et al., 2005). GABA transporters (GATs), which are suggested to accelerate GABA clearance from the extracellular space, are expressed in the marginal zone of the neocortex before birth (Minelli et al., 1995; Jursky and Nelson, 1996). Thus, the main components of the GABA signaling system are functional early in development and may contribute to synapse and network formation.
In the neocortex, the first anatomically defined synapses have been observed in the primordial plexiform layer at E14 (Balslev et al., 1996). The postsynaptic sites are most likely formed with the dendrites of Cajal-Retzius (CR) cells. The latter represent a major class of early-generated neurons in the marginal zone (later layer I) of the neocortex. CR cells synthesize and release reelin, a protein that plays a pivotal role in the neocortical layer formation (D’Arcangelo et al., 1995; Hirotsune et al., 1995; Rice and Curran, 2001). Although CR cells constitute a transient population of layer I cells (Frotscher, 1998; for review, see Marin-Padilla, 1998), they form synaptic connections with migrating cortical neurons (Marin-Padilla, 1998) and receive GABAergic (Kilb and Luhmann, 2001; Radnikow et al., 2002; Soda et al., 2003) synaptic inputs. Calcium imaging experiments revealed that CR cells contribute to the synchronized network activity in layer I of both wild-type and reelin-deficient (reeler) mice (Schwartz et al., 1998; Aguilo et al., 1999). CR cells have been suggested to provide a physiological scaffold for synaptic circuits developing in the cerebral cortex. Interestingly, the action of GABA remains depolarizing in CR cells until these neurons disappear (Mienville, 1998). Consequently, GABAergic over-excitation may induce CR cell degeneration because of an uncontrolled overload of intracellular Ca2+ (excitotoxicity). However, the functional properties of GABAergic inputs on CR cells and the mechanisms that control their strength have not yet been elucidated.
The present study was undertaken to answer the question whether the GABA signaling system controls GABAergic synaptic input to CR cells. It will be shown that GABABRs as well as GAT-1 and GAT-2/3 are functional at early postnatal stages and tune GABAergic synaptic transmission. Extracellular GABA determines the GABA release probability via persistently active presynaptic GABABRs. This ambient GABA-dependent, GABABR-mediated control of GABA release is mediated, at least partially, via GAT-2/3, which operates in the reversed mode releasing GABA into the extracellular space. In contrast to GAT-2/3, presynaptically located GAT-1 functions in the uptake mode, and its blockade leads to a reduction in the quantal IPSC amplitude.
Materials and Methods
Brain slice preparation.
All experiments were conducted with pigmented C57BL/6J mice pups of postnatal day 5 (P5) to P7 (the day of birth was designated as P0). Animals were decapitated under deep ether anesthesia. The brain was removed quickly and transferred into ice-cold saline that contained the following (in mm): 125 NaCl, 4 KCl, 10 glucose, 1.25 NaH2PO4, 25 NaHCO3, 0.5 CaCl2, and 2.5 MgCl2, constantly aerated with a 5% CO2/95% O2 mixture, pH 7.3. The brain was separated into two hemispheres. Sagittal slices of both hemispheres were cut on a Vibratome (Integraslice 7550PSDS; Campden Instruments, Loughborough, UK). Visual cortex areas 17 and 18 were identified based on the stereotaxic atlas of the mouse brain (Franklin and Paxinos, 1996). After preparation, slices (200 μm thick) were stored for at least 1 h at room temperature in artificial CSF (ACSF) that contained the following (in mm): 125 NaCl, 4 KCl, 10 glucose, 1.25 NaH2PO4, 25 NaHCO3, 2 CaCl2, and 1 MgCl2. The pH was buffered to 7.3 by continuous bubbling with a 5% CO2/95% O2 mixture. The osmolarity was 330 mOsm. All experiments were performed according to the guidelines laid down by the Office of Health Protection and Technical Safety of the regional government Berlin (Landesamt für Arbeitsschutz, Gesundheitsschutz und technische Sicherheit Berlin, T0406/03).
Electrophysiological recordings in acute slices.
For recordings, slices were placed into a recording chamber (∼0.4 ml volume) on the microscope stage (Axioscope FS; Zeiss, Oberkochen, Germany) equipped with phase-contrast optics. Slices were submerged with a constant flow of oxygenated ACSF. Concentrations of 10 μm 6,7-dinitroquinoxaline-2,3-dione (DNQX; an AMPA/kainate receptor antagonist) and 50 μm dl-2-amino-5-phosphonopentanoic acid (APV; an NMDA receptor blocker) were added to the ACSF to block glutamatergic currents, unless stated otherwise. The flow rate was set to 1 ml/min using a gravity-driven manually operated superfusion system. A 40× water-immersion objective (Zeiss) was used in all experiments. IPSCs were recorded using the whole-cell configuration of the patch-clamp technique. The intra-pipette solution contained the following (in mm): 100 potassium gluconate, 50 KCl, 5 NaCl, 0.5 CaCl2, 5 EGTA, 25 HEPES, 2 MgATP, and 0.3 GTP, pH 7.2 with KOH. The osmolarity was 320 mOsm. The pipette resistance was 3–5 MΩ, when filled with the above saline. Electrophysiological signals were acquired using an EPC-7 amplifier (List, Darmstadt, Germany), a 16-bit analog–digital/digital–analog board (ITC-16; HEKA Elektronik, Lambrecht, Germany), and TIDA 4.11 software (HEKA Elektronik). The signals were filtered at 3 kHz and sampled at a rate of 10 kHz.
Access resistance was controlled by applying hyperpolarizing pulses of 10 mV. Cell capacitance and access resistance values were obtained by fitting a monoexponential function to the capacitance artifacts. Only recordings with a series resistance <30 MΩ were accepted. Series resistance compensation was not applied. Cells exhibiting >20% changes in the access resistance during an experiment were discarded. The chloride reversal potential was approximately −20 mV. The holding potential was set to −70 mV.
CR cell identification.
The identification of CR cells in the mouse visual cortex was described previously (Kirmse et al., 2005). Briefly, CR cells were visually selected according to morphological criteria (Hestrin and Armstrong, 1996; Schwartz et al., 1998; Radnikow et al., 2002): (1) location in layer I; (2) horizontal orientation; (3) large ovoid soma; and (4) one thick tapered dendrite typically extended in parallel to the pial surface. Electrophysiologically, CR cells have been shown to exhibit (1) a relatively depolarized resting potential (Mienville and Pesold, 1999) and (2) a hyperpolarization-activated inward Ih current (Kilb and Luhmann, 2000). The resting potential of visually identified CR cells was measured shortly after the establishment of whole-cell configuration, and it ranged from −40 to −60 mV. The injection of hyperpolarizing currents induced a voltage sag, indicating the presence of Ih currents (data not shown).
Electrical stimulation.
Evoked postsynaptic currents were elicited by focal electrical stimulation through glass pipettes filled with ACSF (∼10 MΩ). In this case, QX 314 [N-(2,6-dimethylphenylcarbamoylmethyl)-triethylammonium bromide; 2 mm] was added to the intracellular solution to prevent generation of action potentials in the tested neurons. An isolated stimulation unit was used to generate rectangular electrical pulses. The pulse duration was set to 0.5 ms.
The following strategy was applied when seeking for a synaptic input on CR cells. The stimulation pipette was slowly moved over layer I, and trains of stimuli (four pulses, 20 Hz, 1.5 μA) were applied once per 4 s. The searching protocol was immediately terminated after an evoked IPSC (eIPSC) appearance. Next, paired-pulse stimulation [50 ms interstimulus interval (ISI)] was applied once per 10 s, and stimulus intensity was varied to achieve minimal stimulation (i.e., an activation of a single cell/axon). The reason to use paired-pulse instead of single-pulse stimulation was the high failure rate of the first eIPSC accompanied by strong paired-pulse facilitation (PPF). Simulation was accepted as minimal if the following criteria were satisfied: (1) eIPSC latency remained stable (<20% fluctuations); (2) lowering stimulus intensity by 20% resulted in a complete failure of eIPSCs; and (3) an increase in stimulus intensity by 20% changed neither mean eIPSC amplitude nor eIPSC shape. The typical pulse intensity required for minimal stimulation was between 1 and 2 μA.
Analysis of postsynaptic responses.
The present work relies on the assumption that IPSCs could well be approximated by the binomial model of synaptic transmission (Katz, 1969). This model suggests that (1) there are a constant number of release sites (N) that liberate vesicles with an average probability of pr, (2) a single vesicle produces an invariant (quantal) IPSC (q), (3) all release sites are independent, and (4) each release site liberates either a single vesicle or nothing in response to an action potential. In the frame of the binomial model, the mean eIPSC amplitude is given by the following equation:
Mean eIPSC = N × pr × q.
Two approaches were applied to estimate the quantal size. First, miniature IPSCs (mIPSCs) were recorded in the presence of tetrodotoxin (TTX; 1 μm). Because mIPSC distribution was skewed to the right, the median instead of mean mIPSC amplitude was calculated for each cell and taken as a q estimate. Second, postsynaptic currents were elicited applying trains of pulses (40 stimuli) at different frequencies. The late eIPSC amplitude was defined as the mean eIPSC amplitude in response to the last 20 stimuli excluding failures and was taken as a q estimate (see also Results).
The number of release sites is difficult to measure directly. Therefore, the size of the readily releasable pool (RRP) has been used frequently as its approximate (Schneggenburger et al., 1999; Lu and Trussell, 2000; Kirischuk and Grantyn, 2003). To estimate the RRP, we used high-frequency stimulation (20 Hz, 40 pulses; see also Results). Repetitive stimulation leads to a decrease in the eIPSC amplitudes. Assuming that the eIPSC depression is primarily caused by a transient decrease in the number of readily releasable quanta, it is possible to estimate the RRP size on the basis of the cumulative eIPSC amplitude plot (Schneggenburger et al., 1999; Lu and Trussell, 2000; Kirischuk and Grantyn, 2003). Namely, cumulative eIPSC amplitudes were plotted versus stimulus number. After 10–20 pulses, the cumulative eIPSCs reached a steady state, as indicated by the linear slope dependence of the cumulative eIPSC amplitude on the pulse number (see Fig. 6C). Assuming that (1) the number of release sites remains constant throughout the experiment and (2) the linear component reflects vesicle recycling, the cumulative IPSC amplitude in the absence of pool replenishment can be estimated by back-extrapolation to the start of the train. Note that RRP estimations were performed without preceding or following mIPSC measurements. Therefore, the RRP in this work has a dimension of picoamperes and represents the product of N and q. Release probability (pr) was calculated using the above equation, namely pr = mean eIPSC/RRP.
Figure 6.

Presynaptic GABABRs are only partially activated under control conditions. A, Single experiment in which eIPSC sensitivity to the GABABR agonist baclofen (10 μm) and the antagonist CGP55845 (1 μm) was verified. Note a delay between baclofen/CGP55845 application and eIPSC amplitude changes. B, Paired-pulse stimulation (50 ms ISI) induced eIPSCs in the control and in the presence of either baclofen or CGP55845. Traces represent an average of 40 sequential responses. C–G, PPRs (C), failure rates (D), mean eIPSC1 amplitudes (E), RRPs (F), and calculated release probabilities (G) obtained in the control and in the presence of either baclofen or CGP55845 for each individual experiment. Filled symbols show the respective mean values (n = 5). H, I, Plots of the second eIPSC amplitude against the first eIPSC amplitude in individual pairs in the control (H) and in the presence of CGP55845 (1 μm; I). Data were obtained from the same CR cell. Dashed lines represent the results of linear regression. Error bars indicate SEM. ∗p < 0.05; ∗∗p < 0.01. Bac, Baclofen; CGP, CGP55845; Cont., control.
To apply the above method, one has to measure the amplitudes of stimulus-locked eIPSCs. However, high-frequency stimulation strongly increases the frequency of asynchronous events. To discriminate between stimulus-locked and asynchronous IPSCs, IPSCs that peaked within a 3 ms interval after the end of a stimulus pulse will be referred to as stimulus-locked eIPSCs (for details, see Kirischuk et al., 2005). To measure eIPSC amplitudes, a linear fit of the decay of the preceding IPSC was first subtracted from each event. Because spontaneous IPSC frequency was usually much lower than 0.5 Hz (see Results and Fig. 1), a possible contribution of spontaneous IPSCs originating from nonstimulated synaptic contacts was ignored.
Figure 1.

GABABR blockade increased the frequency of sIPSCs and intracellular Ca2+ transients. A, Sample traces represent sIPSCs recorded in the control (left), in the presence of CGP55845 (1 μm; middle), and after CGP55845 washout (right). B, CR cell (arrow) loaded with OGB1. The image was modified by applying a shadow filter. C, Ca2+ transients measured in the CR cell (shown in B) in the control and in the presence of CGP55845. Note that BMI (10 μm) completely and reversibly blocked Ca2+ transients. CGP, CGP55845.
Ca2+ imaging.
The detailed description of the method was given previously (Kirischuk and Verkhratsky, 1996). In this study, we used Oregon Green 488 BAPTA-1 (OGB1) to measure intracellular [Ca2+] changes. Slices were incubated in ACSF supplemented with 5 μm OGB1-AM and 0.02% pluronic F-127 (Molecular Probes, Eugene, OR) for 20 min at 36°C. After loading, slices were washed twice with ACSF and stored in ACSF for at least 20 min at room temperature to ensure deesterification. For recording, slices were transferred to the experimental chamber. The excitation wavelength was controlled by a fast monochromator system, and a cooled CCD camera was used to record fluorescence signals (TILL Photonics, München, Germany). OGB1 was excited at 490 nm. The excitation and emission light was separated using a 510 nm dichroic mirror. Emitted light was filtered using a 530 nm long-pass filter. Images were acquired and evaluated using Vision 4.0 software (TILL Photonics). All measurements were performed using 4 × 4 binning. The exposure time was set to 400 ms. The acquisition rate was one image per 1 s. The background fluorescence was calculated from a region in the immediate vicinity of the tested cell and subtracted. Fluorescence signals were expressed as relative changes from prestimulus levels (ΔF/F0).
Superfusion.
All experiments were performed at room temperature (22–25°C), unless stated otherwise (see Fig. 7). Low (1 mm) Ca2+-containing ACSF was prepared by equimolar replacement of Ca2+ by Mg2+. In high (4 mm) Ca2+-containing ACSF, MgCl2 was omitted and [Ca2+] was set to 4 mm. TTX was obtained from Alomone Labs (Jerusalem, Israel). (2S)-3-[[(1S)-1-(3,4-dichlorophenyl)ethyl]amino-2-hydroxypropyl](phenylmethyl)phosphinic acid (CGP55845) and SNAP-5114 were from Tocris (Bristol, UK). All other chemicals were obtained from Sigma-Aldrich (Munich, Germany).
Figure 7.

Dependence of presynaptic GABABR activation on temperature and GAD activity. A, Sample traces represent eIPSCs elicited by paired-pulse stimulation in the control and in the presence of CGP55845. Traces represent an average of 40 sequential responses. Data were obtained from the same cell. B, Statistical data showing CGP55845 effects on PPR and release probability at 34°C (n = 7). ∗∗p < 0.01. C, Paired-pulse eIPSCs recorded when GAD was blocked with 3-MP (100 μm, but after >1 h preincubation with 1 mm 3-MP). Traces represent an average of 40 sequential responses. Data were obtained from the same cell. D, Statistical data showing CGP55845 effects on PPR and release probability (n = 6). Error bars indicate SEM. CGP, CGP55845; Cont., control.
Data evaluation and statistics.
Data were evaluated off-line. eIPSCs were analyzed using TIDA 4.11 (HEKA Elektronik). PeakCount 3.2 (C. Henneberger, Berlin, Germany) was used to analyze mIPSCs. This software uses a derivative threshold-crossing algorithm to detect individual postsynaptic events. Each automatically detected event is displayed for visual inspection. The mIPSC rise time (10–90%) and decay time constant (single exponential fit) can be also obtained. All results are presented as mean ± SEM. The error bars in all figures indicate SEM. Differences between means were tested for significance using paired Student’s t test, unless stated otherwise. The asterisks indicate the following: ∗p < 0.05, ∗∗p < 0.01, and ∗∗∗p < 0.001.
Results
GABABRs contribute to cortical network excitability
Spontaneous synaptic currents were observed in the vast majority of CR cells studied. The mean frequency of spontaneous postsynaptic events was 0.08 ± 0.01 Hz (range, 0.004–0.32 Hz; n = 37). In line with previous studies (Kilb and Luhmann, 2001; Soda et al., 2003), spontaneous postsynaptic currents were insensitive to the glutamate receptor antagonists APV (50 μm) and DNQX (10 μm; data not shown), but they were completely and reversibly blocked by 10 μm bicuculline methiodide (BMI), revealing their GABAergic nature (data not shown). Below, GABAAR-mediated postsynaptic currents will be referred to as IPSCs even though the action of GABA is depolarizing in CR cells (Mienville, 1998).
GABABRs have been shown to be expressed in the developing neocortex as early as at E14 (Lopez-Bendito et al., 2002), and their block affected the motility of migrating cells (Behar et al., 1996). To examine whether GABABRs influence the activity of the immature network, we applied CGP55845, a specific GABABR antagonist. CGP55845 (1 μm) significantly increased spontaneous IPSC (sIPSC) frequency, and this effect was partially reversible (Fig. 1A). The corresponding values were 0.11 ± 0.02 and 0.20 ± 0.03 Hz in the control and in the presence of CGP55845, respectively (p < 0.05; n = 5). GABABR block also increased mean sIPSC amplitude by 20% (p < 0.05; n = 5). Next, CR cells were bulk loaded with the Ca2+ indicator OGB1, and intracellular [Ca2+] changes were recorded using the calcium imaging technique (Fig. 1B). As GABA action in CR cells is depolarizing, an elevated network activity could lead to an increase in Ca2+ influx. CGP55845 had no effect on the resting [Ca2+], but it significantly enhanced the frequency of Ca2+ transients in CR cells (Fig. 1C). The respective values were 0.02 ± 0.01 Hz in the control and 0.05 ± 0.02 Hz in the presence of CGP55845 (n = 7; p < 0.05) (Fig. 1C). Moreover, Ca2+ transients depended on GABAAR activation, because they were completely and reversibly blocked by 10 μm BMI (Fig. 1C). We conclude that GABABRs are functional and modulate the network activity of the postnatal neocortex.
GABABRs are expressed presynaptically
In principle, the CGP55845-induced increase in sIPSC frequency and amplitude may have a postsynaptic as well as presynaptic origin. If GABABR blockers affected postsynaptic sites, for instance by decreasing a K+ conductance, CGP55845 would be expected to influence the holding current and/or membrane resistance. This was not the case. The mean holding current was −6 ± 10 pA (range, −70 to 12 pA) and −3 ± 14 pA (range, −85 to 14 pA) in the control and in the presence of CGP55845, respectively (n = 11; p > 0.65). The membrane resistance was 760 ± 105 MΩ (range, 350–1230 MΩ) and 685 ± 110 MΩ (range, 290–1200 MΩ) in the control and in the presence of CGP55845, respectively (n = 11; p > 0.1). This result supports the previous notion (Lopez-Bendito et al., 2002) that CR cells do not express functional GABABRs.
To clarify whether GABABRs are expressed presynaptically, mIPSCs were recorded in the presence of TTX (1 μm), a specific blocker of voltage-sensitive Na+ channels. CR cells with reasonably high mIPSC frequencies were selected, and it was found that CGP55845 produced a significant increase in the mIPSC frequency (Fig. 2A). The respective values were 0.041 ± 0.008 Hz in control and 0.053 ± 0.007 Hz in the presence of CGP55845 (Fig. 2B) (n = 7; p < 0.05). On the other hand, CGP55845 had no effect on mIPSC kinetics (Fig. 2C) or mIPSC amplitudes (Fig. 2D, E). The median mIPSC amplitudes were 48.3 ± 8.3 pA (range, 25–82 pA) in the control and 46.6 ± 8.6 pA (range, 25–89 pA) in the presence of CGP55845, respectively (n = 7; p > 0.15) (Fig. 2E). We conclude that functional GABABRs are expressed presynaptically and regulate GABAergic synaptic transmission on CR cells.
Figure 2.

GABABR blockade increased mIPSC frequency but did not affect the median mIPSC amplitude. A, Sample traces show mIPSCs recorded in the control and in the presence of CGP55845. B, Statistical data show CGP55845-induced increase in mIPSC frequency. Open symbols represent mean values obtained for each cell in the control and in the presence of CGP55845. Filled symbols represent the mean values (n = 7). ∗p < 0.05. C, CGP55845 did not change mIPSC rise time (10–90%) and decay kinetics. Data were obtained from seven CR cells. D, mIPSC amplitude distribution was not affected by CGP55845 (filled symbols). The plot represents data obtained from a single CR cell. E, CGP55845 did not change the median mIPSC amplitude. Open symbols represent values obtained for each cell in the control and in the presence of CGP55845. Filled symbols represent the mean values (n = 7). Error bars indicate SEM. CGP, CGP55845; Cont., control.
GABABR block affects the paired-pulse plasticity of GABAergic synaptic transmission
To corroborate this observation, we studied eIPSCs. First, paired-pulse stimulation with variable ISIs was applied, and the paired-pulse ratio (PPR; mean eIPSC2/mean eIPSC1) was calculated. The intertrial interval was set to 10 s. The minimal number of trials used for PPR calculations was 40. CGP55845 considerably changed the paired-pulse behavior (Fig. 3A,B). In the control, paired-pulse depression (PPD) was observed at short ISIs (10 and 25 ms), whereas PPF dominated at longer ISIs (50–250 ms) (Fig. 3B). In the presence of CGP55845, synaptic connections displayed mainly PPD (n = 4) (Fig. 3B).
Figure 3.

GABABR blockade increased the mean eIPSC amplitude and decreased the PPR. A, Sample traces show eIPSCs elicited at different ISIs under control conditions. Traces represent an average of 20 responses. The thick line shows the first eIPSC. B, PPR (mean eIPSC2/mean eIPSC1) as a function of ISI in the control (filled) and in the presence of CGP55845 (open; n = 4). C, Sample traces represent eIPSCs elicited by the paired-pulse stimulation (50 ms ISI) in the control (left) and in the presence of CGP55845 (right). Traces represent an average of 40 sequential responses. Data were obtained from the same cell. D–F, PPRs (D), mean eIPSC1 amplitudes (E), and eIPSC1 failure rates (F) in the control and in the presence of CGP55845 for each individual experiment. Filled symbols show the mean values (n = 9). Error bars indicate SEM. ∗∗p < 0.01; ∗∗∗p < 0.001. CGP, CGP55845; Cont., control.
As the maximal CGP55845 effect was observed at the ISI of 50 ms, the additional experiments were performed using this ISI (Fig. 3C). CGP55845 drastically decreased the PPR. Under control conditions, all CR cells tested at this ISI exhibited PPF (mean PPR, 1.8 ± 0.2). Application of CGP55845 diminished the PPR to 0.91 ± 0.14 (p < 0.01; n = 9) (Fig. 3C,D). The PPR decrease was associated with an increase in the amplitude of the first eIPSCs (Fig. 3E) and a decrease in the mean failure rate (Fig. 3F). The respective values were 75 ± 13 and 128 ± 21 pA for eIPSC amplitude (p < 0.01; n = 9) and 0.28 ± 0.05 and 0.09 ± 0.03 for the failure rate (p < 0.001; n = 9) in the control and in the presence of CGP55845, respectively. These results support the conclusion that GABABRs are located presynaptically.
GABABR block facilitates the frequency-dependent depression of eIPSCs
Next, we investigated the frequency dependence of GABABR-mediated modulation of eIPSCs. Postsynaptic currents were elicited by trains of 40 pulses at four different stimulation frequencies ranging from 1 to 20 Hz. Only 5–10 trials were performed at each stimulation frequency, to prevent potential frequency-dependent modification of synaptic strength. The intertrial interval was set to 1 min. The amplitudes of eIPSCs usually reached a steady state after 10–15 pulses. Therefore, the mean amplitude of eIPSCs was calculated using the eIPSC amplitudes in response to the last 20 pulses of each train, excluding failures (late eIPSCs) (Fig. 4A). To allow for comparison, the mean late eIPSCs were normalized to the mean amplitude of the first eIPSC recorded at 1 Hz. A frequency-dependent depression of eIPSC amplitude was observed under all conditions (Fig. 4B). Even at 1 Hz, the normalized late eIPSC amplitude was 0.78 ± 0.06 (p < 0.05; n = 6; one-population Student′s t test). Next, the late eIPSC amplitudes in CGP55845 were normalized to the controls. Figure 4C shows that at low frequencies (<20 Hz), CGP55845 significantly reduced the late eIPSC amplitudes (minimal p < 0.05; n = 5–10; one-population Student′s t test). These data show that activation of presynaptic GABABRs reduces the frequency-dependent depression of GABAergic synaptic inputs to CR cells.
Figure 4.

GABABR block potentiated frequency-dependent depression of eIPSCs. A, Sample traces showing individual postsynaptic responses elicited by 5 and 10 Hz trains (20 pulses) in the control and in the presence of CGP55845. B, Late eIPSCs recorded at distinct stimulation frequencies. For each CR cell, the mean late eIPSC amplitudes were normalized to the mean amplitude of the first eIPSC induced by 1 Hz trains (n = 6). C, At low frequencies, late eIPSCs recorded in the presence of CGP55845 were significantly smaller than in the controls (n = 5–10).Error bars indicate SEM. ∗p < 0.05; ∗∗p < 0.01. CGP, CGP55845.
GABABRs control the release probability but not the size of the RRP of presynaptic vesicles
GABABRs belong to the family of G-protein-coupled receptors, activation of which can modulate adenylyl cyclase activity. Intracellular cAMP may, in turn, have an effect on transmitter release probability (Kaneko and Takahashi, 2004; Thakur et al., 2004), the number of primed vesicles [RRP (Nagy et al., 2004; Thakur et al., 2004)], and/or the rate of new vesicle recruitment (Sakaba and Neher, 2003; Kidokoro et al., 2004). We have tried to separate the above parameters by using the binomial model of synaptic transmission. In the frame of the binomial model, the mean eIPSC amplitude is the product of the number of release sites (N), the mean release probability (pr), and the mean quantal size (q): eIPSC1 = N × pr × q. GABABR block has been shown not to affect the quantal size (Fig. 2E). To estimate the size of the RRP, we applied high-frequency stimulation (Fig. 5A). The latter results in depletion of the presynaptic vesicle pool, and the cumulative eIPSC amplitude plot provides the basis for RRP estimation (see Materials and Methods) (Schneggenburger et al., 1999; Kirischuk and Grantyn, 2003). A train of 40 pulses delivered at 20 Hz was selected as a standard stimulation protocol for two reasons. First, during 20 Hz trains, the mean late eIPSC amplitude (41 ± 12 pA; n = 9) was close to the median mIPSC amplitude observed in this preparation (48 ± 8 pA) (Fig. 2E). These data favor the suggestion that the RRP is depleted after ∼20 pulses and the rate of new vesicle recruitment rather than stimulation frequency determines the late eIPSC amplitudes. Consequently, the latter approaches the amplitude of quantal events. Second, the late eIPSC amplitudes were similar in the control and in the presence of CGP55845 (41 ± 12 and 40 ± 9; n = 9; p > 0.7; data not shown), which is in line with the observation that CGP55845 does not affect mIPSC amplitude (Fig. 2E).
Figure 5.
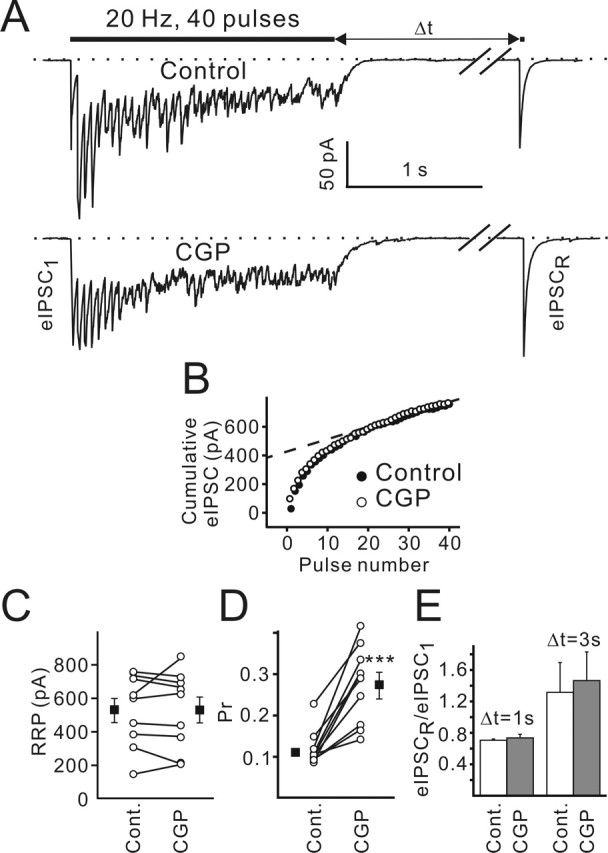
Presynaptic GABABRs control release probability without affecting the size of the RRP of presynaptic vesicles. A, Sample traces show postsynaptic responses elicited by a 40 stimuli train delivered at 20 Hz in the control (top trace) and in the presence of CGP55845 (bottom trace). eIPSCR was elicited by a test pulse applied 1 or 3 s (Δt) after the termination of stimulation. Traces represent an average of five sequential responses. Both traces were recorded from the same cell. B, eIPSC amplitudes were summed to determine the cumulative eIPSC amplitude during trains. Each data point is an average of five trials. SEMs are not shown for clarity. The last 20 points (from 21st to 40th pulses) were fitted by linear regression (dashed line) and back-extrapolated to time 0 (see Materials and Methods). C, RRP sizes obtained in the control and in the presence of CGP55845 plotted for each individual experiment. Filled symbols show mean values (n = 9; p = 0.9). D, Calculated release probabilities are plotted in the control and after CGP55845 application for each individual experiment. Filled symbols show mean values (n = 9; ∗∗∗p < 0.001). E, RRP recovery was not affected by CGP55845 (p > 0.3; n = 9). Error bars indicate SEM. CGP, CGP55845; Cont., control.
Figure 5, B and C, shows that GABABR block failed to affect the RRP size (533 ± 72 and 536 ± 77 pA in the control and in the presence of CGP55845, respectively; p > 0.8; n = 9). In contrast, the mean release probability (pr = mean eIPSC1/RRP) significantly increased in the presence of CGP55845. The respective pr values were 0.11 ± 0.01 and 0.27 ± 0.03 in the control and in the presence of CGP55845 (Fig. 5D) (p < 0.001; n = 9).
We then investigated whether GABABR blockade influences RRP replenishment. A test pulse was applied at different time intervals (1 and 3 s) after termination of 20 Hz stimulation (Fig. 5A). The mean amplitudes of test eIPSCs were normalized to the mean amplitudes of the first eIPSCs in the trains. No difference was observed at both intervals (minimal p > 0.3; n = 9) (Fig. 5E). Next, we inspected whether CGP55845 changed the steady-state tetanic current (i.e., mean postsynaptic current measured over the last 20 pulses). Its amplitude is dependent on the number of release sites, the quantal amplitude, and the frequency of vesicle liberation at any given release site. The first two parameters were not modified by CGP55845 (Figs. 2E, 5C). Therefore, a change in the steady-state current could be attributed to a change in the vesicle recruitment/release rate. We found that the steady-state tetanic postsynaptic current was not affected by CGP55845 (107 ± 9% of the control value; n = 9; p > 0.5; one-population Student’s t test; data not shown), suggesting that presynaptic GABABRs do not influence the rate of vesicle recruitment. We conclude that presynaptic GABABR blockade mainly affects the GABA release probability.
Presynaptic GABABRs are partially activated by ambient GABA
The observation that CGP55845, a GABABR blocker, increased the probability of GABA release suggests that GABABRs are, at least partially, activated under control conditions. To examine the degree of GABABR activation, we aimed at maximal activation of GABABRs by applying baclofen, a specific GABABR agonist. Like CGP55845, baclofen (10 μm) influenced neither the holding current nor the membrane resistance (data not shown). However, baclofen drastically decreased the eIPSC amplitude, and this effect was reverted by CGP55845 (Fig. 6A). Activation/block of GABABRs significantly altered the PPR (Fig. 6B,C), the failure rate (Fig. 6D), and the eIPSC amplitude (Fig. 6E), but it did not change the RRP size (Fig. 6F). Calculated release probabilities were 0.07 ± 0.02, 0.17 ± 0.02, and 0.31 ± 0.07 in the presence of baclofen, in the control, and in the presence of CGP55845, respectively (n = 5) (Fig. 6G). These data suggest that under control conditions, GABABRs are only partially activated by ambient GABA. Consequently, changes in extracellular GABA concentration can dynamically alter the strength of GABAergic synapses on CR cells.
To examine whether synaptically released GABA can vary the degree of GABABR activation, we investigated the relationship between the first and the second eIPSC in individual pairs. If the degree of presynaptic GABABR activation were altered by synaptically released GABA, a larger eIPSC1 should be followed by a smaller eIPSC2 (i.e., their amplitudes should demonstrate a negative correlation). Indeed, even despite a small number of trials, a negative correlation was observed in 9 of 14 cells tested (Fig. 6H). However, the observed negative correlation between eIPSC1 and eIPSC2 could also reflect the depletion of the RRP: the larger is the first IPSC; the smaller number of vesicles remains available for the following release. If this were the case, CGP55845-induced increase in GABA release probability (Fig. 6G) should result in a stronger RRP depletion and make the above correlation more pronounced. If GABABR activation contributed to the observed eIPSC1–eIPSC2 relationship, CGP55845 should attenuate the negative correlation between eIPSC1 and eIPSC2. GABABR block weakened this relationship (Fig. 6I). In the presence of CGP55845, a statistically significant correlation between eIPSC1 and eIPSC2 was observed only in 2 of 14 cells tested. We conclude that synaptically released GABA can modify the degree of GABABR activation and affect the following GABA release.
Presynaptic GABABRs are tonically activated at near physiological temperatures
Because GABA metabolism is temperature dependent, we examined whether CGP55845 affects GABAergic transmission at 34°C, which is much closer to physiological temperatures. The higher temperatures led to an acceleration of eIPSC decay from 23 ± 1 ms (n = 34) at room temperatures to 16 ± 3 ms at 34°C (n = 9; p < 0.01; unpaired Student’s t test). However, the CGP55845 effects on GABAergic synaptic transmission were similar to those at room temperature. The PPR was reduced from 1.34 ± 0.12 in the control to 0.97 ± 0.06 in the presence of CGP55845 (p < 0.01; n = 7) (Fig. 7A,B). The calculated release probabilities were 0.15 ± 0.01 and 0.22 ± 0.01 in the control and in the presence of CGP55845 (n = 7; p < 0.01) (Fig. 7B). These data suggest that tonic activation of presynaptic GABABRs is also present at near physiological temperatures.
Inhibition of GABA synthesis abolished tonic activation of presynaptic GABABRs
Next, we investigated whether blockade of GABA synthesis has an effect on the GABABR-mediated presynaptic inhibition. Glutamate decarboxylase (GAD) was suppressed by 3-mercaptopropionic acid (3-MP). Extracellular GABA concentration has been shown to decrease after 3-MP (1 mm) treatment for 1 h (Golan et al., 1996). Therefore, slices were preincubated in ACSF supplemented with 1 mm 3-MP for >1 h. During the recordings, ACSF contained 100 μm 3-MP. GAD blockade increased the mIPSC frequency (0.07 ± 0.02, n = 5, vs 0.04 ± 0.01 in the control, n = 7; p < 0.05) without affecting the mIPSC amplitudes (42 ± 5 pA, n = 5, vs 48 ± 3 pA in the control, n = 7; p > 0.2; unpaired Student’s t test; data not shown). In addition, PPR observed in the presence of 3-MP (0.91 ± 0.06; n = 19) was significantly smaller than the control value (1.5 ± 0.1; n = 29; p < 0.001; unpaired Student’s t test). Moreover, in the presence of 3-MP, CGP55845 failed to affect the PPR (0.86 ± 0.06 vs 0.87 ± 0.09; p > 0.8) (Fig. 7C,D) and GABA release probability (0.29 ± 0.02 vs 0.32 ± 0.02; n = 6; p > 0.2) (Fig. 7D). The calculated GABA release probabilities were not significantly different from the controls observed in the standard ACSF supplemented with CGP55845 (Fig. 5D) (0.27 ± 0.03; n = 9; p > 0.4; unpaired Student’s t test). This suggests that an inhibitory action of extracellular GABA is influenced by the GAD-dependent GABA synthesis and release.
GABA released via GAT-2/3 partially mediates tonic activation of GABABRs
The extracellular GABA level is mainly regulated by specific, high-affinity, Na+/Cl−-dependent transporters. The high intracellular chloride concentration of immature neurons may potentially have the consequence that GAT functions in the reversed mode (i.e., it releases GABA) (Schwartz, 1987; Taylor and Gordon-Weeks, 1991). Although four distinct GABA transporters have been identified, two of them, GAT-1 and GAT-3, have been shown to be expressed in the marginal zone (Minelli et al., 1995, 1996). GAT-3 expression is strong at birth and further increases during the first week of life (Minelli et al., 2003b). Because GAT-3 is not confined to the vicinity of GABAergic synapses, it is assumed to play a dominant role in controlling extracellular GABA concentration in the developing cortex (Jursky and Nelson, 1996; Minelli et al., 1996). To examine whether GAT-3 affects GABAergic transmission in layer I, we used SNAP-5114, a specific GAT-2/3 blocker. First, mIPSCs were recorded in the presence of 1 μm TTX. If GAT-2/3 released GABA, its block should attenuate GABABR-mediated presynaptic inhibition and lead to an increase in mIPSC frequency. Indeed, SNAP-5114 (40 μm) increased mIPSC frequency to 144 ± 5% of the control (p < 0.05; n = 7; one-population Student’s t test) (Fig. 8A,B) without any significant effect on mIPSC amplitude (103 ± 5%; p > 0.3; n = 7) (Fig. 8B) and kinetics. SNAP-5114 also increased eIPSC amplitudes to 148 ± 12% of the control (p < 0.01; n = 11; one-population Student’s t test) (Fig. 8C,D) and decreased the PPR from 1.35 ± 0.18 to 0.98 ± 0.07 (p < 0.01; n = 6) (Fig. 8D,E). Thus, the observed SNAP-5114 effects were quite similar to those of GABABR blockade with CGP55845 (Figs. 2, 3), suggesting that GAT-2/3 could function in the reversed mode releasing GABA. Application of CGP55845 in the presence of SNAP-5114 led to an additional increase in eIPSC amplitude and a decrease in the PPR to 0.86 ± 0.05 (Fig. 8E). These data suggest that tonic GABABR-mediated inhibition is only partially determined by GAT-2/3 activity. If the observed strengthening of GABABR-mediated inhibition is the only result of GAT-2/3 blockade, then CGP55845 should make SNAP-5114 ineffective. Indeed, SNAP failed to change both eIPSC amplitudes (102 ± 5%) and the PPR (101 ± 4%; n = 5; p > 0.6; one-population Student’s t test) in the presence of CGP55845 (Fig. 8F,G). Because the GAT operation mode depends on the intracellular/extracellular GABA concentration (Richerson and Wu, 2003), we inspected whether SNAP-5114 influences GABAergic synaptic transmission when the total amount of GABA is lower. Indeed, when GAD activity was suppressed with 3-MP, SNAP did not significantly change eIPSC amplitudes (110 ± 9%; p > 0.25) or the PPR (97 ± 9%; p > 0.7; n = 5; one-population Student’s t test) (Fig. 8G). Based on the above results, we conclude that GAT-2/3 operates in the reversed mode releasing GABA. The latter activates presynaptic GABABRs, thereby inhibiting synaptic GABA release.
Figure 8.
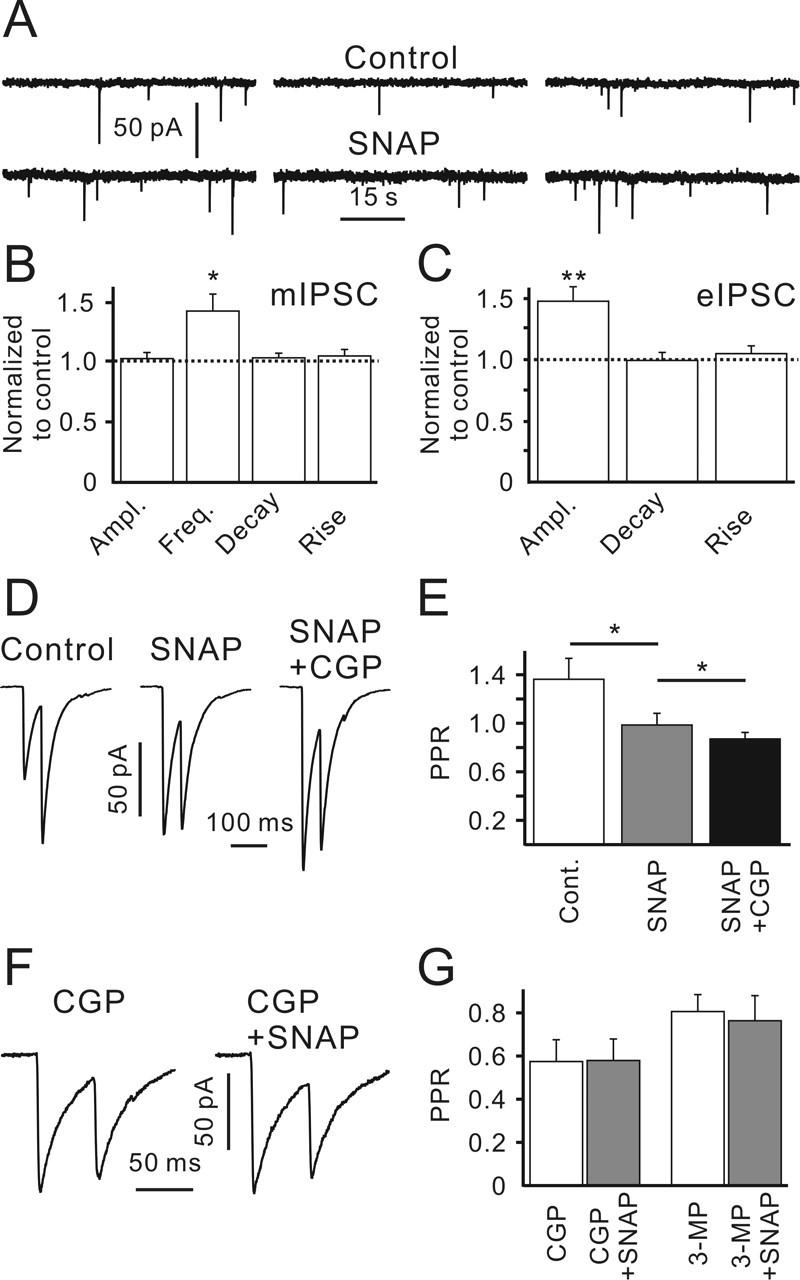
GAT-2/3 operates in the reversed mode supporting GABABR-mediated presynaptic inhibition. A, Sample traces showing mIPSCs recorded in the control (top recordings) and in the presence of SNAP-5114 (40 μm; bottom recordings). B, SNAP-5114 increased mean mIPSC frequency but did not affect mIPSC amplitude and kinetics. Statistical data were obtained from seven CR cells. C, SNAP-5114 increased eIPSC amplitude but did not affect eIPSC kinetics (n = 11). D, Averaged paired-pulse eIPSCs (40 trials) recorded in the control, in the presence of SNAP-5114, and in the presence of SNAP-5114 plus CGP55845. Traces were recorded from the same cell. E, SNAP-5114 decreased the PPR. Statistical data were obtained from six CR cells. F, Paired-pulse eIPSCs recorded in the presence of CGP55845 or CGP55845 plus SNAP-5114. Traces represent an average of 40 sequential responses. Data were obtained from the same cell. G, Statistical data showing SNAP-5114 effects on PPRs in the presence of CGP55845 (left; n = 5) or 3-MP (right; n = 5). Error bars indicate SEM. ∗p < 0.05; ∗∗p < 0.01. Ampl., Amplitude; Freq., frequency; CGP, CGP55845; Cont., control.
The quantal amplitude depends on GAT-1 activity
Because GAT-2/3 blockade did not completely abolish GABABR-mediated inhibition of GABA release (Fig. 8E), we asked whether GAT-1 also contributes to the phenomenon. Similar to GAT-2/3, GAT-1 is expressed in neocortical layer I before birth, but in contrast to GAT-2/3, GAT-1 is abundant in presynaptic GABAergic terminals (Minelli et al., 1995; Conti et al., 2004). Therefore, based on the morphological data, GAT-1 seems to be a good candidate to control GABAergic synaptic transmission. To verify the suggestion, we applied NO-711, a specific GAT-1 blocker. First, mIPSCs were recorded in the presence of 1 μm TTX. In contrast to GAT-2/3 blockade, NO-711 (10 μm) decreased the mIPSC frequency to 77 ± 6% of the control (p < 0.05; n = 7; one-population Student’s t test) (Fig. 9A,C), but it did not affect mIPSC kinetics (Fig. 9C). This result supports the idea that GAT-1 operates in the uptake mode and its block results in an increase in extracellular GABA concentration and strengthening of GABABR-mediated inhibition. Unexpectedly, GAT-1 blockade led to a decrease in the median mIPSC amplitude in six of seven cells tested. On average, the mIPSC amplitude was decreased to 75 ± 11% of the control (p < 0.01; n = 7; one-population Student’s t test) (Fig. 9A–C). NO-711 did not produce an inward current (n = 7) (Fig. 9D) or a change in the membrane resistance. Therefore, an attenuation of mIPSCs attributable to postsynaptic shunting seems unlikely. Next, we applied high-frequency (20 Hz, 40 pulses) stimulation to examine whether NO-711 affected the late eIPSC amplitudes. Indeed, both the RRP size (70 ± 8%; p < 0.05; n = 7) and the late eIPSC amplitudes (74 ± 6% of the control; p < 0.01; n = 7; one-population Student’s t test) were significantly lowered by NO-711 (data not shown). We conclude that GAT-1 block reduces the quantal amplitude. The observed decrease in the mIPSC frequency may therefore reflect a stronger activation of GABABRs, or reduced detection of small mIPSCs, or both.
Figure 9.
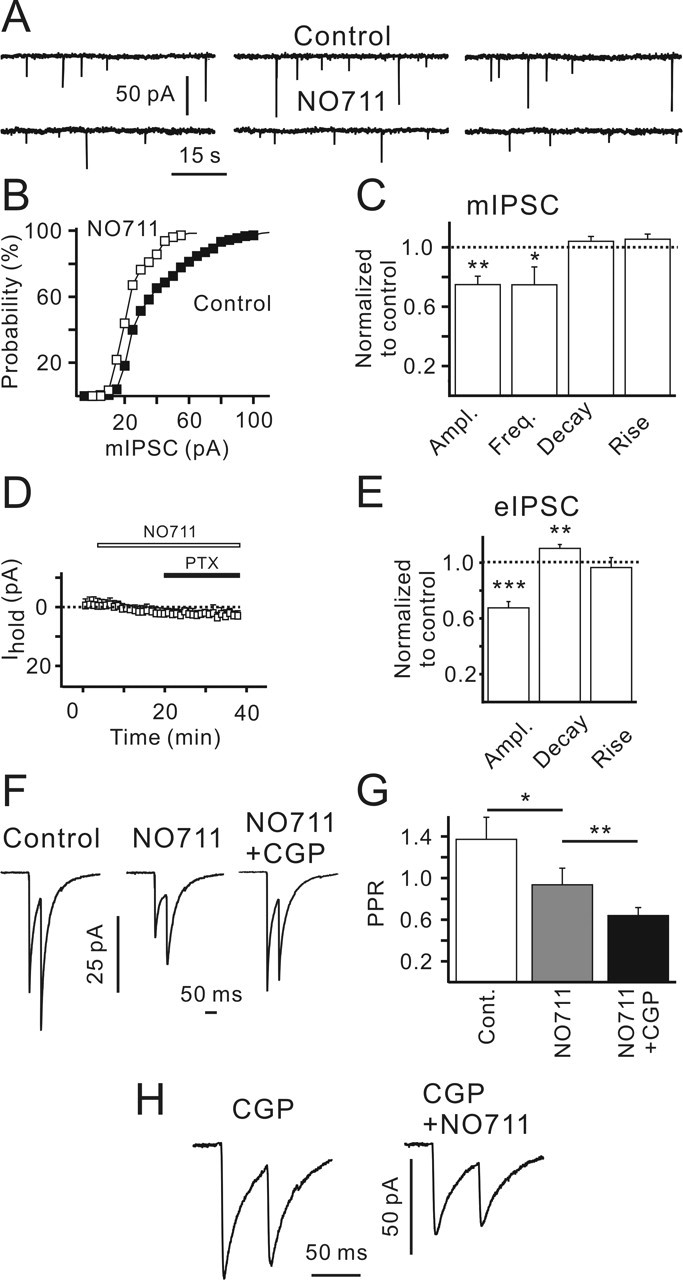
GAT-1 block leads to strengthening of GABABR-mediated inhibition of synaptic GABA release and a decrease in the quantal size. A, Sample traces showing mIPSCs recorded in the control (top recordings) and in the presence of NO-711 (10 μm; bottom recordings). Note a decrease in the mIPSC amplitude in the presence of NO-711. B, NO-711 shifted mIPSC amplitude distribution to the left. Data were obtained from a single CR cell. C, NO-711 decreased the median mIPSC amplitude and mean mIPSC frequency but did not affect mIPSC kinetics. Statistical data were obtained from seven CR cells. D, NO-711 and picrotoxin (100 μm) did not change the holding current (Ihold; n = 7). E, NO-711 decreased eIPSC amplitude and increased eIPSC decay time constant. Statistical data were obtained from nine CR cells. F, Averaged paired-pulse eIPSCs (40 trials) recorded in the control, in the presence of NO-711, and in the presence of NO-711 plus CGP55845. Traces were recorded from the same cell. G, NO-711 decreased the PPR. Statistical data were obtained from nine CR cells. H, Paired-pulse eIPSCs recorded in the presence of CGP55845 or CGP55845 plus NO-711. Traces represent an average of 40 sequential responses. Data were obtained from the same cell. Error bars indicate SEM. ∗p < 0.05; ∗∗p < 0.01; ∗∗∗p < 0.001. Ampl., Amplitude; Freq., frequency; PTX, picrotoxin; CGP, CGP55845; Cont., control.
To investigate the possibilities, we recorded eIPSCs. NO-711 (10 μm) decreased the eIPSC amplitudes to 65 ± 4% of the control (p < 0.001; n = 9; one-population Student’s t test) (Fig. 9E,F). In addition, NO-711 significantly increased the eIPSC decay time constant to 110 ± 3% (p < 0.01; n = 9; one-population Student’s t test) (Fig. 9E). The NO-711 effects on eIPSCs were partially reversible. After a 30 min washout, the eIPSC amplitude and decay time constant were 87 ± 4 and 103 ± 5% of the controls (n = 3) (data not shown). Another GAT-1 blocker, SKF89976A, produced effects similar to those of NO-711. SKF89976A (10 μm) decreased the eIPSC amplitudes to 73 ± 5% and prolonged the eIPSC decay time constant to 107 ± 3% (n = 3; data not shown). If GAT-1 took up GABA, its block should lead to an increase in the extracellular GABA concentration, stronger activation of presynaptic GABABRs, and a decrease in eIPSC amplitudes. This was indeed observed. However, if this were the only effect of GAT-1 blockade, one should also expect an increase in the PPR (similar to the action of baclofen) (Fig. 6B,C). Contrary to this expectation, NO-711 significantly decreased the PPR from 1.4 ± 0.2 to 0.9 ± 0.2 (p < 0.05; n = 9) (Fig. 9F,G). Coapplication of CGP55845 increased the first eIPSC amplitude only to the control value (96 ± 9% of the eIPSC amplitude recorded in the control; p > 0.5; one-population Student’s t test) and resulted in a further decrease in the PPR to 0.58 ± 0.07 (n = 5) (Fig. 9F,G). To investigate this unexpected NO-711 effect, CGP55845 was added before NO-711. In this case, NO-711 failed to change the PPR (0.59 ± 8 and 0.58 ± 9 in the presence of CGP55845 and CGP55845 plus NO-711; n = 5; p > 0.6) but still reduced eIPSC amplitudes to 69 ± 5% (p < 0.01; n = 5; one-population Student’s t test) (Fig. 9H). Thus, although the discrepancy between NO-711- and baclofen-induced PPR changes requires additional investigations, it can be concluded that the NO-711-induced PPR decrease is mediated via GABABRs.
The NO-711-induced reduction in the quantal amplitude, however, seems to be GABABR independent. This effect may have a postsynaptic [e.g., desensitization of GABAARs (Overstreet et al., 2000)] as well as a presynaptic [e.g., decreased vesicle filling (Zhou et al., 2000; Engel et al., 2001)] origin. If the number of postsynaptic GABAARs available for synaptic transmission were dynamically regulated by extracellular GABA concentration, then varying the latter should affect the quantal amplitude. However, both the 3-MP- and SNAP-5114-induced decrease in [GABA], as reported by the weakening of GABABR-mediated inhibition, failed to change mIPSC amplitudes (Fig. 8A,B). To corroborate the idea, we modulated synaptic GABA release by using various (namely 1, 2, and 4 mm) extracellular Ca2+ concentrations ([Ca2+]). The eIPSC amplitudes and the PPR were dependent on [Ca2+] both in the absence and in the presence of CGP55845 (Fig. 10A,B). Elevated [Ca2+] also led to an increase in the frequency of mIPSCs from 0.10 ± 0.06 Hz in control to 0.18 ± 0.07 (p < 0.05; n = 5; data not shown). These results confirm that high [Ca2+] increased the probability of GABA release and can potentially result in an increase in the extracellular GABA level. However, the median mIPSC amplitudes were not significantly different. The respective values were 41 ± 7 and 47 ± 5 pA in 2 and 4 mm [Ca2+], respectively (p > 0.5; n = 5) (Fig. 10C). This result shows that an increase in spontaneous GABA release does not influence the quantal amplitude. We asked then whether a prolonged presence of GABA in the synaptic cleft can result in a decrease in quantal amplitudes. To test the hypothesis, we applied high-frequency stimulation and measured the late eIPSC amplitudes. The mean amplitude of late eIPSCs was independent of extracellular [Ca2+] (Fig. 10D). When normalized to the late eIPSC amplitude obtained in 2 mm [Ca2+], the corresponding values were 101 ± 7 and 96 ± 10% in 1 and 4 mm extracellular [Ca2+], respectively (p > 0.5; n = 6; one-population Student’s t test). Further potentiation of GABA release by applying CGP55845 also failed to change the late eIPSC amplitude [39 ± 3 pA in the control (4 mm [Ca2+] in this case) and 38 ± 2 pA in the presence of CGP55845; p > 0.7; n = 6] (Fig. 10D). Thus, both reduction in extracellular [GABA] and potentiation of synaptic GABA release failed to change mIPSC amplitude, when GAT-1 was intact.
Figure 10.

GAT-1 provides GABA for vesicle filling. A, Sample recordings show eIPSCs in 1 mm (top) and 4 mm (bottom) extracellular [Ca2+] in the control and in the presence of CGP55845. Traces are an average of 20 trials. The top and bottom pair of traces were obtained from different CR cells. B, Dependence of the PPR on the extracellular [Ca2+]. C, Median mIPSC amplitudes were not dependent on extracellular [Ca2+]. B and C represent data obtained from seven (1 and 4 mm extracellular [Ca2+]) and nine (2 mm extracellular [Ca2+]) CR cells. D, Late eIPSC amplitudes were not dependent on extracellular [Ca2+] and GABABR activity. Late eIPSCs were normalized to the late eIPSC amplitude obtained in standard (2 mm [Ca2+]) ASCF. Data were obtained from six CR cells. E, Paired-pulse eIPSCs recorded when GAD was blocked with 3-MP (100 μm, but after >1 h preincubation with 1 mm 3-MP). Traces represent an average of 40 sequential responses. Data were obtained from the same cell. Error bars indicate SEM. ∗p < 0.05; ∗∗ p < 0.01. CGP, CGP55845.
It is, however, possible that synaptically located GAT-1 creates a specific environment in the synaptic cleft preserving postsynaptic GABAARs from detecting extracellular [GABA] changes. If this were the case, a decrease in [GABA] should, at least, weaken the effect of GAT-1 block. As expected, in the presence of 3-MP, NO-711 failed to affect the PPR (0.85 ± 11 vs 0.89 ± 8; n = 7; p > 0.5) (Fig. 10E,F). However, it reduced the eIPSC amplitudes to 78 ± 11% (p < 0.05; n = 7; one-population Student’s t test) (Fig. 10E). The latter was not significantly different from the NO-711-induced eIPSC reduction in the absence of 3-MP (65 ± 4%; p > 0.3; n = 9; unpaired Student’s t test) (Fig. 9C). These results favor a presynaptic origin of the NO-711-induced reduction in mIPSC/eIPSC amplitudes.
Discussion
Based on patch-clamp recordings of GABAergic synaptic currents from CR cells, we report the following results: (1) the strength of GABAergic synaptic transmission is dynamically regulated by the extracellular GABA concentration; (2) ambient GABA governs the level of presynaptic GABABR activation and, in turn, controls the probability of GABA release; (3) GAT-2/3 operating in the reversed mode enhances the GABABR-mediated suppression of GABA release; and (4) presynaptically located GAT-1 in the forward mode and its blockade influences the quantal IPSC amplitude.
Functional properties of GABAergic inputs to CR cells
Despite the fact that GABAergic spontaneous IPSCs (sIPSCs) have been reported in mouse and rat neocortical CR cells (Kilb and Luhmann, 2001; Radnikow et al., 2002; Soda et al., 2003), their physiological properties have not yet been investigated in detail. In the present study, bicuculline-sensitive IPSCs were the only kind of postsynaptic currents encountered. Typically, sIPSC and mIPSC frequency was low (in most cases, <0.1 Hz). Such a low rate of sIPSCs/mIPSCs could be attributed to a small number of synapses (Konig and Marty, 1981; Derer and Derer, 1990). However, electron microscopy studies revealed a large number of GABA-immunoreactive synaptic contacts on the somata and proximal dendrites of CR cells (Radnikow et al., 2002). Immunostaining of the vesicular GABA transporter (VGAT) is intense in layer I at P0–P10 (Minelli et al., 2003a). VGAT-positive puncta are exclusively associated to axonal swellings of the symmetric type and also display GABA immunoreactivity (Minelli et al., 2003a). These data suggest that GABAergic terminals are present on CR cells already at birth and they appear to be sufficiently mature.
Another possibility to explain the low level of spontaneous GABA release at CR cells is that presynaptic vesicles are not “ready” for release. Indeed, rapid rundown of eIPSCs and little variation of eIPSC amplitudes have been reported previously (Radnikow et al., 2002). We applied high-frequency stimulation to estimate the size of the RRP. When normalized to the mean amplitude of late eIPSCs, the mean RRP size was 13 ± 4 vesicles (range, 4–29; n = 32). This is comparable with the mean RRP size at GABAergic synapses in the superior colliculus [24 (Kirischuk et al., 2005)] and the cerebellum [10–15 (Saitow et al., 2005)]. However, mIPSC frequencies observed both in the superior colliculus [0.1 Hz (Juttner et al., 2001)] and the cerebellum [10 Hz (Saitow et al., 2005)] were much higher than in CR cells. Dendritic filtering of postsynaptic currents could also attenuate the mIPSC amplitudes below the patch-clamp detection threshold. However, the somatic or proximal dendritic location of GABAergic contacts (Radnikow et al., 2002) in combination with the high membrane resistance of CR cells (Kilb and Luhmann, 2001; present work) argues against this suggestion.
Alternatively, the rare occurrence of spontaneous events could result from low release probability of GABA-containing vesicles. Indeed, the release probability of GABAergic synapses on CR cells was lower (0.11) (Fig. 6E) than in other GABAergic synapses of similar age, including those in the superior colliculus (0.25) (Kirischuk et al., 2005). However, block of GABABRs elevated pr to about the level observed in other structures (0.27) (Fig. 6E). This result supports the hypothesis that the low release probability of GABAergic terminals on CR cells is the consequence of GABABR-mediated inhibition of release rather than immaturity of the release apparatus.
GABABR-mediated inhibition of GABA release
In the rat neocortex, both R1 and R2 subunits of GABABRs are present as early as E14. Because heterodimerization of both R1 and R2 subunits is required for GABABR formation (White et al., 1998), CR cells have been suggested not to express functional GABABRs, because they only contain the R1 subunit (Lopez-Bendito et al., 2002). In this study, (1) neither baclofen nor CGP55845 induced a current and/or a change of the membrane resistance in CR cells and (2) mIPSC kinetics, mIPSC amplitude distribution, and median mIPSC amplitude were not affected by CGP55845 (Fig. 2C–E). These results are in line with the above suggestion that CR cells do not have functional GABABRs.
On the other hand, eIPSC amplitudes and PPRs were significantly altered by pharmacological block or stimulation of GABABRs (Fig. 6B). These data suggest that GABABRs are present on GABAergic terminals contacting CR cells. Interestingly, both at room and near physiological temperatures, GABABRs appeared to be persistently active already under control conditions. Tonic presynaptic GABABR-mediated inhibition has also been reported in some other preparations (Le Feuvre et al., 1997; Parnas et al., 1999), suggesting that ambient GABA can suppress synaptic GABA release. In the present study, we have shown that GABABR activation/block only alters GABA release probability without affecting the RRP or mIPSC amplitudes. In addition, GAD blockade with 3-MP abolished GABABR-mediated inhibition without affecting mIPSC amplitudes. The latter observation suggests that extracellular GABA levels also depend on the rate of GABA synthesis. But what are the mechanisms of GABA release? Vesicular release is able to activate presynaptic GABABRs because CGP55845 (1) attenuated the negative correlation between the first and the second eIPSC (Fig. 6H,I) and (2) reduced the amplitude of late eIPSC at low frequencies (Fig. 4). In contrast, GAD blockade enhanced mIPSC frequency but failed to influence mIPSC amplitudes or kinetics (i.e., the total GABA release was increased by 3-MP). Consequently, if vesicular GABA release were the main determinant of extracellular GABA levels, one would expect a stronger GABABR-mediated inhibition. Contrary to this expectation, CGP55845 failed to affect both eIPSC amplitudes and paired-pulse behavior in the presence of 3-MP (Fig. 7C,D), suggesting that GABABR-mediated inhibition became even weaker. We conclude that vesicular GABA release can vary the degree of presynaptic GABABR activation and contribute to short-term plasticity but does not determine the basal GABABR-mediated inhibitory tonus.
GAT-2/3 is functional and operates in the reversed mode
High-affinity, Na+/Cl−-dependent GATs operating either in the uptake or reversed mode are suggested to control extracellular GABA levels (Richerson and Wu, 2003). In the neonatal neocortex, GAT-3 and GAT-1 immunoreactivity has been shown to be strongest in the marginal zone/layer I (Conti et al., 2004). Because GAT-3-immunopositive spots are not colocalized with GABAergic synapses, GAT-3 is assumed to play a dominant role in controlling extracellular GABA levels (Jursky and Nelson, 1996; Minelli et al., 1996). However, SNAP-5114, a specific GAT-2/3 antagonist, failed to affect amplitudes and/or kinetics of eIPSCs recorded from layer II/III pyramidal cells and layer I interneurons in P17–P22 rat neocortex (Keros and Hablitz, 2005). On the other hand, SNAP-5114 has been reported to increase the amplitudes of eIPSCs in layer V pyramidal cells of P7–P28 rats (Kinney, 2005). Our data are in line with the latter observation. We have shown that SNAP-5114 (1) increased mIPSC frequencies, (2) increased eIPSC amplitudes, and (3) decreased the PPR. These results suggest a presynaptic site of GAT-2/3 action. In addition, blockade of GABABRs with CGP55845 or GAD with 3-MP abolished the observed SNAP effects (Fig. 8F,G). This suggests that the SNAP-5114 effects depend on intracellular GABA concentration and are mediated by presynaptic GABABRs. We therefore conclude that GAT-2/3 operates in the reversed mode releasing GABA. Higher extracellular [GABA] accounts, at least partially, for the observed tonic activation of presynaptic GABABRs and the resulting inhibition of vesicular GABA release.
Presynaptic GAT-1 supplies GABA for vesicle filling
GAT-1 is abundant in presynaptic GABAergic terminals (Minelli et al., 1995; Conti et al., 2004) and seemed to be well suited to control GABAergic synaptic transmission. Indeed, GAT-1 inhibitors increase tonic conductance in the cerebellum (Rossi et al., 2003) and the hippocampus (Nusser and Mody, 2002; Semyanov et al., 2003). GAT-1 antagonists prolong eIPSC decay (Thompson and Gahwiler, 1992; Overstreet and Westbrook, 2003; Rossi et al., 2003; Keros and Hablitz, 2005), suggesting that GAT-1 is responsible for GABA clearance from the synaptic cleft. In this study, NO-711 prolonged eIPSC decay, decreased mIPSC frequency, and reduced eIPSC amplitude. These data support the hypothesis that GAT-1 operates in the uptake mode and its block leads to longer GABA presence in the synaptic cleft and a decrease in GABA release probability. However, NO-711 decreased the PPR that points to an increase in GABA release probability. The mechanism of these contradictory NO-711 actions has remained unclear, but we report that the NO-711 effect on the PPR can be blocked by CGP55845 and 3-MP (Figs. 9, 10), suggesting its dependence on ambient GABA-activated GABABRs. Because the operation mode of GAT is dependent on transmembrane Na+, Cl−, GABA, and potential gradients, the existence of two cell populations in which GAT-1 operates in the forward and reversed modes (see supplemental Fig. 1, available at www.jneurosci.org as supplemental material) seems to provide a suitable explanation for the above inconsistency. However, this working hypothesis definitely needs further investigations.
In addition to its GABABR-mediated effects, NO-711 significantly reduced the quantal size in a GABABR-independent manner. Similar results were reported in the juvenile (P13–P16) hippocampus where NO-711 decreased both mIPSC amplitude and frequency. An NO-711-induced GABA accumulation, followed by desensitization of synaptic GABAARs, has been suggested to underlie this phenomenon (Overstreet et al., 2000). However, if postsynaptic GABAARs were partially desensitized by ambient GABA, the number of desensitized GABAARs would be expected to reflect extracellular [GABA] changes. We performed several experiments (SNAP-5114, 3-MP, high/low extracellular [Ca2+]) directed to manipulate extracellular and synaptic GABA levels but failed to reverse this NO-711 effect on mIPSC/eIPSC amplitudes. Therefore, although GABAAR desensitization cannot be excluded, our data support the alternative idea that presynaptic GAT-1 operates in the uptake mode and its blockade leads to a reduction in presynaptic vesicle filling.
Footnotes
This work was supported by the Charité (project 2006-147 to S.K.). K.K. received a scholarship from the German Research Foundation (Deutsche Forschungsgemeinschaft) as a member of the Graduate School (Graduiertenkollegs) 238. We express our particular gratitude to Prof. R. Grantyn and Dr. C. Henneberger for critical reading and helpful comments on previous versions of this manuscript. The technical assistance of Kerstin Rückwardt is highly appreciated.
References
- Aguilo A, Schwartz TH, Kumar VS, Peterlin ZA, Tsiola A, Soriano E, Yuste R (1999). Involvement of Cajal-Retzius neurons in spontaneous correlated activity of embryonic and postnatal layer 1 from wild-type and reeler mice. J Neurosci 19:10856–10868. [DOI] [PMC free article] [PubMed] [Google Scholar]
- Balslev Y, Saunders NR, Mollgard K (1996). Synaptogenesis in the neocortical anlage and early developing neocortex of rat embryos. Acta Anat (Basel) 156:2–10. [DOI] [PubMed] [Google Scholar]
- Behar TN, Li YX, Tran HT, Ma W, Dunlap V, Scott C, Barker JL (1996). GABA stimulates chemotaxis and chemokinesis of embryonic cortical neurons via calcium-dependent mechanisms. J Neurosci 16:1808–1818. [DOI] [PMC free article] [PubMed] [Google Scholar]
- Conti F, Minelli A, Melone M (2004). GABA transporters in the mammalian cerebral cortex: localization, development and pathological implications. Brain Res Brain Res Rev 45:196–212. [DOI] [PubMed] [Google Scholar]
- D’Arcangelo G, Miao GG, Chen SC, Soares HD, Morgan JI, Curran T (1995). A protein related to extracellular matrix proteins deleted in the mouse mutant reeler. Nature 374:719–723. [DOI] [PubMed] [Google Scholar]
- Derer P, Derer M (1990). Cajal-Retzius cell ontogenesis and death in mouse brain visualized with horseradish peroxidase and electron microscopy. Neuroscience 36:839–856. [DOI] [PubMed] [Google Scholar]
- Engel D, Pahner I, Schulze K, Frahm C, Jarry H, Ahnert-Hilger G, Draguhn A (2001). Plasticity of rat central inhibitory synapses through GABA metabolism. J Physiol (Lond) 535:473–482. [DOI] [PMC free article] [PubMed] [Google Scholar]
- Franklin KBJ, Paxinos G (1996). In: The mouse brain in stereotaxic coordinates San Diego: Academic.
- Frotscher M (1998). Cajal-Retzius cells, reelin, and the formation of layers. Curr Opin Neurobiol 8:570–575. [DOI] [PubMed] [Google Scholar]
- Golan H, Talpalar AE, Schleifstein-Attias D, Grossman Y (1996). GABA metabolism controls inhibition efficacy in the mammalian CNS. Neurosci Lett 217:25–28. [DOI] [PubMed] [Google Scholar]
- Hestrin S, Armstrong WE (1996). Morphology and physiology of cortical neurons in layer I. J Neurosci 16:5290–5300. [DOI] [PMC free article] [PubMed] [Google Scholar]
- Hirotsune S, Takahara T, Sasaki N, Hirose K, Yoshiki A, Ohashi T, Kusakabe M, Murakami Y, Muramatsu M, Watanabe S (1995). The reeler gene encodes a protein with an EGF-like motif expressed by pioneer neurons. Nat Genet 10:77–83. [DOI] [PubMed] [Google Scholar]
- Jursky F, Nelson N (1996). Developmental expression of GABA transporters GAT1 and GAT4 suggests involvement in brain maturation. J Neurochem 67:857–867. [DOI] [PubMed] [Google Scholar]
- Juttner R, Meier J, Grantyn R (2001). Slow IPSC kinetics, low levels of alpha1 subunit expression and paired-pulse depression are distinct properties of neonatal inhibitory GABAergic synaptic connections in the mouse superior colliculus. Eur J Neurosci 13:2088–2098. [DOI] [PubMed] [Google Scholar]
- Kaneko M, Takahashi T (2004). Presynaptic mechanism underlying cAMP-dependent synaptic potentiation. J Neurosci 24:5202–5208. [DOI] [PMC free article] [PubMed] [Google Scholar]
- Katz B (1969). In: The release of neural transmission substances Liverpool, UK: Liverpool UP.
- Keros S, Hablitz JJ (2005). Subtype-specific GABA transporter antagonists synergistically modulate phasic and tonic GABAA conductances in rat neocortex. J Neurophysiol 94:2073–2085. [DOI] [PubMed] [Google Scholar]
- Kidokoro Y, Kuromi H, Delgado R, Maureira C, Oliva C, Labarca P (2004). Synaptic vesicle pools and plasticity of synaptic transmission at the Drosophila synapse. Brain Res Brain Res Rev 47:18–32. [DOI] [PubMed] [Google Scholar]
- Kilb W, Luhmann HJ (2000). Characterization of a hyperpolarization-activated inward current in Cajal-Retzius cells in rat neonatal neocortex. J Neurophysiol 84:1681–1691. [DOI] [PubMed] [Google Scholar]
- Kilb W, Luhmann HJ (2001). Spontaneous GABAergic postsynaptic currents in Cajal-Retzius cells in neonatal rat cerebral cortex. Eur J Neurosci 13:1387–1390. [DOI] [PubMed] [Google Scholar]
- Kinney GA (2005). GAT-3 transporters regulate inhibition in the neocortex. J Neurophysiol 94:4533–4537. [DOI] [PubMed] [Google Scholar]
- Kirischuk S, Grantyn R (2003). Intraterminal Ca2+ concentration and asynchronous release at single GABAergic boutons in rat collicular cultures. J Physiol (Lond) 548:753–764. [DOI] [PMC free article] [PubMed] [Google Scholar]
- Kirischuk S, Verkhratsky A (1996). [Ca2+]i recordings from neural cells in acutely isolated cerebellar slices employing differential loading of the membrane-permeant form of the calcium indicator fura-2. Pflügers Arch 431:977–983. [DOI] [PubMed] [Google Scholar]
- Kirischuk S, Juttner R, Grantyn R (2005). Time-matched pre- and postsynaptic changes of GABAergic synaptic transmission in the developing mouse superior colliculus. J Physiol (Lond) 563:795–807. [DOI] [PMC free article] [PubMed] [Google Scholar]
- Kirmse K, Grantyn R, Kirischuk S (2005). Developmental downregulation of low-voltage-activated Ca2+ channels in Cajal-Retzius cells of the mouse visual cortex. Eur J Neurosci 21:3269–3276. [DOI] [PubMed] [Google Scholar]
- Konig N, Marty R (1981). Early neurogenesis and synaptogenesis in cerebral cortex. Bibl Anat 152–160. [PubMed]
- Le Feuvre Y, Fricker D, Leresche N (1997). GABAA receptor-mediated IPSCs in rat thalamic sensory nuclei: patterns of discharge and tonic modulation by GABAB autoreceptors. J Physiol (Lond) 502:91–104. [DOI] [PMC free article] [PubMed] [Google Scholar]
- Lopez-Bendito G, Shigemoto R, Kulik A, Paulsen O, Fairen A, Lujan R (2002). Expression and distribution of metabotropic GABA receptor subtypes GABABR1 and GABABR2 during rat neocortical development. Eur J Neurosci 15:1766–1778. [DOI] [PubMed] [Google Scholar]
- LoTurco JJ, Owens DF, Heath MJ, Davis MB, Kriegstein AR (1995). GABA and glutamate depolarize cortical progenitor cells and inhibit DNA synthesis. Neuron 15:1287–1298. [DOI] [PubMed] [Google Scholar]
- Lu T, Trussell LO (2000). Inhibitory transmission mediated by asynchronous transmitter release. Neuron 26:683–694. [DOI] [PubMed] [Google Scholar]
- Manent JB, Demarque M, Jorquera I, Pellegrino C, Ben-Ari Y, Aniksztejn L, Represa A (2005). A noncanonical release of GABA and glutamate modulates neuronal migration. J Neurosci 25:4755–4765. [DOI] [PMC free article] [PubMed] [Google Scholar]
- Marin-Padilla M (1998). Cajal-Retzius cells and the development of the neocortex. Trends Neurosci 21:64–71. [DOI] [PubMed] [Google Scholar]
- Mienville JM (1998). Persistent depolarizing action of GABA in rat Cajal-Retzius cells. J Physiol (Lond) 512:809–817. [DOI] [PMC free article] [PubMed] [Google Scholar]
- Mienville JM, Pesold C (1999). Low resting potential and postnatal upregulation of NMDA receptors may cause Cajal-Retzius cell death. J Neurosci 19:1636–1646. [DOI] [PMC free article] [PubMed] [Google Scholar]
- Minelli A, Brecha NC, Karschin C, DeBiasi S, Conti F (1995). GAT-1, a high-affinity GABA plasma membrane transporter, is localized to neurons and astroglia in the cerebral cortex. J Neurosci 15:7734–7746. [DOI] [PMC free article] [PubMed] [Google Scholar]
- Minelli A, DeBiasi S, Brecha NC, Zuccarello LV, Conti F (1996). GAT-3, a high-affinity GABA plasma membrane transporter, is localized to astrocytic processes, and it is not confined to the vicinity of GABAergic synapses in the cerebral cortex. J Neurosci 16:6255–6264. [DOI] [PMC free article] [PubMed] [Google Scholar]
- Minelli A, Alonso-Nanclares L, Edwards RH, DeFelipe J, Conti F (2003a). Postnatal development of the vesicular GABA transporter in rat cerebral cortex. Neuroscience 117:337–346. [DOI] [PubMed] [Google Scholar]
- Minelli A, Barbaresi P, Conti F (2003b). Postnatal development of high-affinity plasma membrane GABA transporters GAT-2 and GAT-3 in the rat cerebral cortex. Brain Res Dev Brain Res 142:7–18. [DOI] [PubMed] [Google Scholar]
- Nagy G, Reim K, Matti U, Brose N, Binz T, Rettig J, Neher E, Sorensen JB (2004). Regulation of releasable vesicle pool sizes by protein kinase A-dependent phosphorylation of SNAP-25. Neuron 41:417–429. [DOI] [PubMed] [Google Scholar]
- Nusser Z, Mody I (2002). Selective modulation of tonic and phasic inhibitions in dentate gyrus granule cells. J Neurophysiol 87:2624–2628. [DOI] [PubMed] [Google Scholar]
- Overstreet LS, Westbrook GL (2003). Synapse density regulates independence at unitary inhibitory synapses. J Neurosci 23:2618–2626. [DOI] [PMC free article] [PubMed] [Google Scholar]
- Overstreet LS, Jones MV, Westbrook GL (2000). Slow desensitization regulates the availability of synaptic GABAA receptors. J Neurosci 20:7914–7921. [DOI] [PMC free article] [PubMed] [Google Scholar]
- Owens DF, Kriegstein AR (2002). Is there more to GABA than synaptic inhibition? Nat Rev Neurosci 3:715–727. [DOI] [PubMed] [Google Scholar]
- Parnas I, Rashkovan G, Ong J, Kerr DI (1999). Tonic activation of presynaptic GABAB receptors in the opener neuromuscular junction of crayfish. J Neurophysiol 81:1184–1191. [DOI] [PubMed] [Google Scholar]
- Radnikow G, Feldmeyer D, Lubke J (2002). Axonal projection, input and output synapses, and synaptic physiology of Cajal-Retzius cells in the developing rat neocortex. J Neurosci 22:6908–6919. [DOI] [PMC free article] [PubMed] [Google Scholar]
- Represa A, Ben-Ari Y (2005). Trophic actions of GABA on neuronal development. Trends Neurosci 28:278–283. [DOI] [PubMed] [Google Scholar]
- Rice DS, Curran T (2001). Role of the reelin signaling pathway in central nervous system development. Annu Rev Neurosci 24:1005–1039. [DOI] [PubMed] [Google Scholar]
- Richerson GB, Wu Y (2003). Dynamic equilibrium of neurotransmitter transporters: not just for reuptake anymore. J Neurophysiol 90:1363–1374. [DOI] [PubMed] [Google Scholar]
- Rossi DJ, Hamann M, Attwell D (2003). Multiple modes of GABAergic inhibition of rat cerebellar granule cells. J Physiol (Lond) 548:97–110. [DOI] [PMC free article] [PubMed] [Google Scholar]
- Saitow F, Suzuki H, Konishi S (2005). Beta-adrenoceptor-mediated long-term up-regulation of the release machinery at rat cerebellar GABAergic synapses. J Physiol (Lond) 565:487–502. [DOI] [PMC free article] [PubMed] [Google Scholar]
- Sakaba T, Neher E (2003). Direct modulation of synaptic vesicle priming by GABAB receptor activation at a glutamatergic synapse. Nature 424:775–778. [DOI] [PubMed] [Google Scholar]
- Schneggenburger R, Meyer AC, Neher E (1999). Released fraction and total size of a pool of immediately available transmitter quanta at a calyx synapse. Neuron 23:399–409. [DOI] [PubMed] [Google Scholar]
- Schwartz EA (1987). Depolarization without calcium can release gamma-aminobutyric acid from a retinal neuron. Science 238:350–355. [DOI] [PubMed] [Google Scholar]
- Schwartz TH, Rabinowitz D, Unni V, Kumar VS, Smetters DK, Tsiola A, Yuste R (1998). Networks of coactive neurons in developing layer 1. Neuron 20:541–552. [DOI] [PubMed] [Google Scholar]
- Semyanov A, Walker MC, Kullmann DM (2003). GABA uptake regulates cortical excitability via cell type-specific tonic inhibition. Nat Neurosci 6:484–490. [DOI] [PubMed] [Google Scholar]
- Soda T, Nakashima R, Watanabe D, Nakajima K, Pastan I, Nakanishi S (2003). Segregation and coactivation of developing neocortical layer 1 neurons. J Neurosci 23:6272–6279. [DOI] [PMC free article] [PubMed] [Google Scholar]
- Taylor J, Gordon-Weeks PR (1991). Calcium-independent gamma-aminobutyric acid release from growth cones: role of gamma-aminobutyric acid transport. J Neurochem 56:273–280. [DOI] [PubMed] [Google Scholar]
- Thakur P, Stevens DR, Sheng ZH, Rettig J (2004). Effects of PKA-mediated phosphorylation of snapin on snaptic transmission in cultured hippocampal neurons. J Neurosci 24:6476–6481. [DOI] [PMC free article] [PubMed] [Google Scholar]
- Thompson SM, Gahwiler BH (1992). Effects of the GABA uptake inhibitor tiagabine on inhibitory synaptic potentials in rat hippocampal slice cultures. J Neurophysiol 67:1698–1701. [DOI] [PubMed] [Google Scholar]
- Van Eden CG, Mrzljak L, Voorn P, Uylings HB (1989). Prenatal development of GABA-ergic neurons in the neocortex of the rat. J Comp Neurol 289:213–227. [DOI] [PubMed] [Google Scholar]
- White JH, Wise A, Main MJ, Green A, Fraser NJ, Disney GH, Barnes AA, Emson P, Foord SM, Marshall FH (1998). Heterodimerization is required for the formation of a functional GABAB receptor. Nature 396:679–682. [DOI] [PubMed] [Google Scholar]
- Zhou Q, Petersen CC, Nicoll RA (2000). Effects of reduced vesicular filling on synaptic transmission in rat hippocampal neurones. J Physiol (Lond) 525:195–206. [DOI] [PMC free article] [PubMed] [Google Scholar]