

Abstract
The major pathway for visual information reaching cerebral cortex is through the lateral geniculate nucleus (LGN) of the thalamus. Acting on this vital relay is another thalamic nucleus, the thalamic reticular nucleus (TRN). This nucleus receives topographically organized collaterals from both thalamus and cortex and sends similarly organized projections back to thalamus. The inputs to the TRN are excitatory, but the output back to the thalamic relay is inhibitory, providing an ideal organization for modulating visual activity during early processing. This functional architecture led Crick in 1984 to hypothesize that TRN serves to direct a searchlight of attention to different regions of the topographic map; however, despite the substantial influence of this hypothesis, the activity of TRN neurons has never been determined during an attention task. We have determined the nature of the response of visual TRN neurons in awake monkeys, and the modulation of that response as the monkeys shifted attention between visual and auditory stimuli. Visual TRN neurons had a strong (194 spikes/s) and fast (25 ms latency) transient increase of activity to spots of light falling in their receptive fields, as well as high background firing rate (45 spikes/s). When attention shifted to the spots of light, the amplitude of the transient visual response typically increased, whereas other neuronal response characteristics remained unchanged. Thus, as predicted previously, TRN activity is modified by shifts of visual attention, and these attentional changes could influence visual processing in LGN via the inhibitory connections back to the thalamus.
Keywords: attention, thalamus, visual, thalamic reticular nucleus, macaque, extracellular recordings
Introduction
Almost all sensory information passes through the thalamus before reaching cortex. Sensory signals in the thalamus are subject to the influence of the thalamic reticular nucleus (TRN). TRN is a thin layer of GABAergic neurons that receives topographically organized collaterals from both thalamus and cortex and sends similarly organized but inhibitory projections back to thalamus. The organization and location of TRN led Crick (1984) to comment that “If the thalamus is the gateway to the cortex, the reticular complex might be described as the guardian of the gateway.”
TRN can be divided into five modality-specific sectors. Each sector is defined by the specific relays in thalamus to which they project, the origin of the cortical and thalamic collaterals they receive, and their physiology (Carman et al., 1964; Jones, 1975; Ohara and Lieberman, 1985) (for review, see Guillery et al., 1998; Crabtree, 1999; Pinault, 2004). Visual TRN in the primate receives input from the visual thalamic relay [the lateral geniculate nucleus (LGN)] via LGN axon collaterals projecting to primary visual cortex (V1). The projection from V1 layer 6 back to LGN also sends collaterals to TRN (Conley and Diamond, 1990; Harting et al., 1991; Uhlrich et al., 2003). Both of these inputs to TRN are excitatory. In striking contrast, the projections from TRN back on the LGN are inhibitory (Cox et al., 1997; Kim et al., 1997).
Interface of TRN with the visual pathway thus consists of excitatory inputs and an inhibitory output, providing an ideal organization for modulating neuronal activity during early visual processing. After Crick’s original suggestion that TRN modulates selective attention, support for that hypothesis has been derived primarily from lesion and histological studies in rats. Lesions of visual TRN abolished priming effects associated with cues to contralateral visual targets in an attentional orienting task (Weese et al., 1999), demonstrating a link between TRN and the attentional effects of visual cues. Other studies focused on the interactions between the modality-specific sectors of TRN, showing a selective increase in Fos-positive neurons in the sector of TRN associated with the modality of the attended stimulus (Montero, 1997, 1999, 2000; McAlonan et al., 2000).
Although these lesion and histological studies provide evidence that modulation of TRN occurs with attention, they could not address whether the changes were increases or decreases of activity or whether the changes occurred fast enough to modulate visual responses in the LGN. To determine the underlying neuronal mechanisms of this attentional modulation, we recorded visual responses from single TRN neurons in two monkeys while they shifted attention between competing stimuli. Because of the multimodal nature of TRN and the evidence of cross-modal interactions from the previously cited histological studies, we used a task that required the monkey to shift attention between visual and auditory stimuli. If Crick’s hypothesis is correct, and visual TRN acts as an “attentional searchlight,” TRN neuronal responses to a visual stimulus should be modulated when attention shifts from the auditory to the visual stimulus.
Materials and Methods
Recording procedures.
Chambers for accessing the TRN were implanted stereotaxically 10 mm anterior from the interaural line and 13 mm lateral from the midline on two male rhesus monkeys (Macaca mulatta: monkey G and monkey O). The surgical procedures, recording of single neuron and eye position, and control of the monkeys’ behavior have been described previously (Sommer and Wurtz, 2004). All procedures were approved by the Institute Animal Care and Use Committee and complied with Public Health Service Policy on the humane care and use of laboratory animals.
Localization of visual TRN.
TRN is a small, thin structure; thus, localizing it and then identifying its visual region presented a challenge. First, to find visual TRN, we obtained a magnetic resonance image (MRI) after the recording cylinder was implanted and several microelectrodes had been inserted into the brain to predetermined depths. Comparing the positions of these electrodes on the MRI with the predicted location of the TRN in an anatomical atlas gave us the coordinates for finding TRN. Second, during recording experiments, we used the LGN as a guide to corroborate our estimates of TRN location from the MRI. On some penetrations, we were able to locate LGN and then carefully pull the electrode back up to hit TRN. These penetrations gave us the opportunity to appreciate the substantial difference between TRN and LGN activity and the noticeably different receptive field locations. Additionally, our TRN neurons were at depths inconsistent with LGN. The small visual receptive fields we found were highly unlikely to be from pulvinar neurons. Finally, we verified the location of the TRN in one monkey (monkey G) by making four microlesions (20 μA anodal current for 20 s) at the end of a recording session, and then later locating these microlesions on Nissl-stained histological sections.
In the recording experiments, when a TRN neuron was isolated, the location and approximate extent of the receptive field were estimated manually while the monkey fixated on a spot of light in the center of the screen. After this initial characterization, monkeys performed a fixation task during which we determined the minimum response field of the neuron by probing the receptive field boundaries with a spot of light at various locations.
Visual stimuli were backprojected onto the tangent screen 54 cm in front of the monkey by a liquid crystal display projector. In this and the attention task, the central fixation spot was 0.4° and the peripheral stimulus was 0.4–1.5° in diameter
Cross-modal attention task.
After we assessed receptive field size and location, monkeys performed a cross-modal attention task. In all trials, a central fixation point appeared (Fig. 1). The color of the fixation point (red or green) instructed the monkey which of the two impending stimuli required attention. After a 500 ms fixation period, a visual stimulus and an auditory stimulus were presented simultaneously. The visual stimulus, a 0.4–1.5° white spot, was always placed in the center of the receptive field of the recorded neuron. The auditory stimulus, a single tone, was presented via two speakers placed on each side of the screen in front of the monkey. Note that the use of an auditory and a visual stimulus allowed us to measure attentional effects between sensory modalities but not between spatial locations within a modality. The stimuli were presented for 500–1000 ms. After this initial presentation period, a transient change (a 600 ms decrease in luminance of the visual stimulus and/or a 600 ms decrease in volume of the auditory stimulus) possibly occurred in one, both, or neither of the stimuli. After the 600 ms “dimming” period, any stimulus that was “dimmed” returned to its original intensity for another 500–1000 ms. During this entire time, the monkeys were required to maintain fixation on the central spot. Both stimuli then disappeared and two blue targets appeared, 15° above and below the central fixation point, and the monkey was free to make a saccade to one or the other target, if warranted. The monkey’s task was to indicate whether a change occurred in the attended stimulus, the modality of which was indicated by the color of the fixation point. A green fixation point indicated that the visual stimulus was to be attended and the correct response to the spot of light dimming was a saccade to the upper of the two target points. A red fixation point indicated that the auditory stimulus was to be attended, and the correct response in this case was a saccade to the lower target if the auditory tone had dimmed during the trial. If the attended stimulus did not change, whether it was visual or auditory, the correct response was to remain fixating, regardless of whether the unattended stimulus had changed or not. Monkeys received a drop of water for correct responses.
Figure 1.

Cross-modal attention task. The color of the fixation point indicated whether a given trial was a visual trial or an auditory trial. A green fixation point meant a visual trial, and the monkey was to attend to the visual stimulus (a spot in the receptive field of the TRN neuron). A red fixation point denoted an auditory trial, and the monkey was to attend to the auditory stimulus (a tone). During both visual and auditory trials, the visual spot either dimmed or remained constant, and, independently, the auditory tone either dimmed or remained constant. The possible dimming of either stimulus did not depend on the trial type. The monkey was rewarded by correctly reporting whether the attended stimulus (indicated by the color of the fixation point) dimmed or not. For details, see Materials and Methods.
Analysis of performance.
Our experiments were designed to be difficult to ensure that some degree of attention would be necessary for the monkeys to perform well. Because the complexity of the cross-modal task dictated that the changes to be detected must be necessarily above threshold, and because the monkey’s performance depended on a number of unrelated factors (for example, daily level of motivation, and eccentricity of visual stimuli) we could not directly measure the allocation of attention. However, we believed that a certain criterion level of performance would ensure that the monkey was, on average, selectively attending to the appropriate stimuli as instructed by cue color.
We used two different measures of performance to determine the degree to which the monkeys performed the task. Our first performance index used the proportion of hits (Ph = correct saccades to a target) and false positives (Pfp = incorrect saccades to a target) to ensure that the animal was doing the task. The two different attended stimuli in our task had two different contingencies (change or no change), and the monkey could either remain fixating or indicate a change in the attended stimulus by making a saccade to one of two possible targets. Given this experimental structure, chance performance (if the monkey were randomly guessing on each trial) would be <25% correct. However, if the monkey were to remain fixating all the time, he would be correct on the 50% of trials on which the attended stimulus did not change and he was supposed to remain fixating. We required the first index, calculated as Ph(1 − Pfp) to be >0.33. This is approximate to, but is more stringent than, an average performance level of 57% correct, which is well above chance levels from simple guessing. This also ruled out the simple strategy of remaining fixated on every trial. Although this simple strategy would yield 50% correct, there would be no correct saccades (Ph = 0), and this first index would therefore be zero. Likewise, if the monkey always made a saccade to the target indicated by the color of the cue regardless of the change in the attended stimulus, this first index would also be zero (because Pfp = 1).
To further verify selective attention, we devised a second performance index that insured the monkey was not attending to only one of the two stimuli. To calculate this index, we examined a critical subset of trials: trials in which the stimulus to be attended was the only stimulus that changed. We separated these trials into visual and auditory cases. If the monkey had a tendency to attend to only one of the stimuli, disregarding the color of the cue, the proportion correct in one of these cases would necessarily suffer, even if the monkey then correctly used the color of the cue to choose the saccade target. For example, if the monkey attended only to the visual stimulus, he might be able to reach 75% correct overall, but he would perform poorly on the trials when he was required to respond to a change in the auditory stimulus. We required the proportion correct in each case (visual and auditory) independently to exceed 50%. Given the difficulty of the task, we were confident that these two criteria assured the use of selective attention in the task.
Note that, for experiments not meeting these performance criteria, we were not ruling out that the monkey was selectively attending, we just could not be sure the monkey was not using some other response strategy.
Results
Characteristics of TRN neuronal activity
We recorded visual responses from 36 single neurons in visual TRN of two monkeys. We found that visual TRN neurons responded well to small spots of light positioned in a specific part of the visual field. Receptive field diameters were small, and correlated strongly with receptive field eccentricity (r = 0.73, p = 0.002). The most foveal (3.8 degrees eccentricity) receptive field we found was 0.3 degrees in diameter, whereas the most eccentric receptive fields (>30 degrees eccentricity) were between 1.5 and 1.75 degrees in diameter
These TRN neurons had two salient discharge characteristics: they had a high background firing rate and a transient visual response. The superposition of the spike density plots in Figure 2 for all 36 TRN neurons demonstrates the remarkable consistency of the visual response. The high background rate is evident before stimulus onset and had a mean and SE of 45 ± 16 spikes/s. The transient responses to the onset of the stimulus raised the discharge by an average of 194 ± 85 spikes/s (background rate subtracted). The visual transients had short latencies (25 ± 4.4 ms) and short durations (66 ± 27 ms). The small sustained response to the still-present visual stimulus 200–400 ms after stimulus onset (51 ± 20 spikes/s) was only slightly greater than the prestimulus activity (Wilcoxon sign rank test, p = 0.002).
Figure 2.

Transient visual response of TRN neurons in the awake monkey. The superimposed transient visual responses of each of the 36 visual TRN neurons after the onset of a high-contrast spot of light centered in the receptive field of the neuron are aligned on stimulus onset at time 0. Each gray line is a spike density plot showing the mean of at least 27 stimulus presentations (mean number of presentations, 64). The thicker black line indicates the mean response for all 36 neurons. Note that each of the individual responses resembles a scaled version of the mean response, demonstrating the consistency of response latency and duration for TRN neurons.
As described in Materials and Methods, we verified the location of the recordings we took to be in TRN by passing current through the recording microelectrode at the site of four TRN neurons. Figure 3 shows a histological section through one of the resulting marks. The uppermost portion shows the entire hemisphere of the histological section on which we visualized the lesion. The higher magnification section in the middle (taken from the inset square on the hemisphere above) shows the relationship of this visual region of the TRN to the underlying pulvinar, and the highest magnification (its location denoted again by the inset square on the image above it) shows the electrode track and the mark within TRN. Our sampling of visual TRN extended from a region overlapping LGN to that overlapping pulvinar. Note that TRN neurons projecting to LGN occupy the entire extent of visual TRN (Conley and Diamond, 1990), including the portion overlapping pulvinar, as shown here.
Figure 3.

Location of visual TRN neurons recorded in the awake monkey. Site of a visual TRN neuron marked by passing current through the recording microelectrode. Successive enlargements of the Nissl-stained coronal section show the location of the lesion. The pulvinar (PUL) and TRN have been labeled for reference.
Because the putative visual TRN neurons from which we recorded all gave the same consistent, stereotypical response, and the few sample sites we marked were located anatomically in the TRN, we were convinced that we were sampling TRN neurons and not cells in some other structure. We then went on to determine how attention toward and away from the visual stimulus altered the visual responses of these neurons.
Attentional modulation of TRN neurons
We had the two monkeys perform the cross-modal attention task outlined in Figure 1. The color of the central fixation point during each trial indicated which of the two upcoming stimuli was to be attended. While the monkey fixated, a spot of light in the receptive field of the TRN neuron and a single frequency tone came on. After a variable period of 500–1000 ms, there was a probability that either the visual spot and/or the auditory tone decreased or dimmed briefly (600 ms) in luminance or volume. The monkey’s task was to indicate whether the attended stimulus changed or not.
Figure 4A shows the responses of a typical visual TRN neuron to a visual stimulus, placed within the receptive field of the neuron, when attention was directed toward the visual stimulus (top plot), and when attention was directed toward the auditory tone (bottom plot). The peak visual response was higher when attention was directed toward the visual stimulus, as shown by the difference in responses in Figure 4B. We considered a response difference to be individually significant if the change in the peak visual response was significantly different from the difference in background activity (Kolmogorov–Smirnov test). The difference in the mean visual responses for the neuron depicted in Figure 4 was highly significant (p < 0.0001).
Figure 4.

Modulation of the visual response by attention. A, Visual responses of an example TRN neuron when the monkey was instructed to attend to the visual stimulus (top recording) and when it attended to the auditory stimulus (bottom recording). Only responses for correct trials are shown. For each trial type, spike density plots are superimposed on the spike rasters. The spike density plot for visual attention trials is duplicated in the bottom panel to facilitate comparison between the two cases. The arrow in each panel indicates the peak visual response (before subtracting background activity). The peak visual response was greater when the monkey attended to the visual stimulus. B, Difference in response when the visual stimulus is attended. The black trace is the difference between the spike density plots in the top and bottom panels of A (visual attended − auditory attended).
Figure 5A shows the average difference in responses (visual trials − auditory trials) for all 36 neurons. The thick black line shows the mean response difference, and the thin lines denote ± 1 SD. Figure 5B shows the distribution of response changes for all neurons now measured as the proportional increase in the peak visual response when the monkey was instructed to attend to the visual stimulus. On average, neuronal responses were 10% greater (Wilcoxon sign rank test, p = 0.007) when the monkey attended to the visual stimulus than when it attended to the auditory tone. The change in neuronal response was 13% for monkey G (Wilcoxon sign rank test, p = 0.007, n = 22) but monkey O’s change was only 5.4% (Wilcoxon sign rank test, p = 0.91, n = 14), although the monkeys were not significantly different from each other (Wilcoxon rank sum test, p = 0.18), because of the smaller number and greater variability of monkey O’s data. Although there were some neurons for which responses decreased slightly with attention (n = 14), the average decrease in response was only 7%, whereas the average increase in response (n = 22) was 22%. The other TRN response properties (latency, duration, background activity, and any low sustained visual response) did not change significantly with attention (Wilcoxon sign rank test, p = 0.079, 0.85, 0.26, and 0.23 respectively). In addition, analysis of autocorrelograms of spikes both during the transient response and during the small sustained response showed no evidence of burst firing, either with or without attention. Hence, in these experiments, increasing the relative allocation of attention to a visual stimulus increased only the magnitude of the transient visual response.
Figure 5.
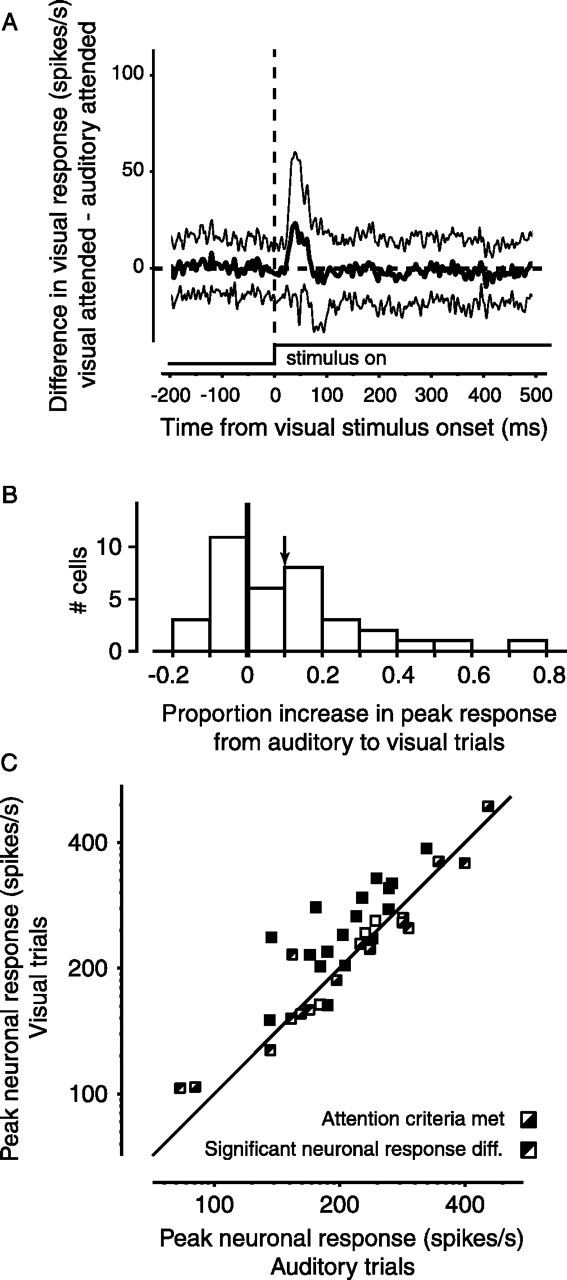
Change in visual response with attention in the sample of 36 neurons. A, Summary of differences in response for all 36 TRN neurons. The thick trace shows the mean change in response when the monkey shifted attention to the visual stimulus. Thin lines represent ± 1 SD of the differences. B, Distribution of response differences expressed as the proportion change in response between auditory and visual trials. The mean proportional increase in peak response (0.10, p = 0.007) is indicated by the arrow. C, Change in peak neuronal response for each TRN neuron. For each neuron, this plot shows the peak neuronal response during visual trials (when the monkey was instructed to attend to the visual stimulus) versus the peak neuronal response during auditory trials. Background activity was subtracted from all peak responses. Note that the abscissa and ordinate are both in log coordinates, so as not to overemphasize response differences at higher firing rates. Symbols with the top triangle filled indicate significant differences in peak visual response. Symbols with the bottom triangle filled denote experiments in which the monkey met the attentional psychophysical criteria.
Figure 5C shows the change in response with attention for each of the neurons. We have plotted the peak responses when the monkey was instructed to attend to the visual stimulus (ordinate) against the peak responses when it was instructed to attend to the auditory stimulus (abscissa). Each square represents the responses of a single neuron. Symbols with the top triangle in the square filled (including those with both top and bottom filled) indicate significant differences in response. The increase in the visual responses of TRN neurons with attention is shown by the tendency of the significant points in Figure 5C to lie above the diagonal. The proportion of increase in response was not correlated with the firing rate of the neuron (r = 0.16; p = 0.34).
To verify that the monkey was attending as expected, we calculated two measures of performance, as detailed in Materials and Methods. This permitted us to establish a performance criterion that not only assured that the monkey was performing well above chance levels, but also that it was selectively attending and not using other response strategies. The symbols in Figure 5C also show whether the monkey met these performance criteria; the squares with the lower triangle filled indicate experiments when the performance criteria were met. The monkeys almost always (35 of 36) passed the first performance index (insuring above chance performance). Failures to achieve the second performance criterion occurred five times on auditory trials and five times on visual trials (including the one failure on the first criterion). When the monkey met both performance criteria (n = 26), the mean response increase was 13%, whereas when they were not met (n = 10), the increase was only 3%.
Our second performance index looked only at trials when the stimulus to be attended was the only one that changed. However, when looking at trials when the only stimulus that changed was the unattended one, we saw that the monkeys tended to have a bias for the visual stimulus. That is, most false positives we observed were responses to the visual stimulus changing when the nonchanging auditory tone was the one to be attended. This is not surprising, given the predominantly visual nature of monkeys and the close coupling between visual attention and saccadic eye movements.
Although given the difficulty of the cross-modal task, it seemed unlikely that the monkey attended to both stimuli equally at the same time, our experiment did not preclude that possibility, but a post hoc analysis of their performance indicated this was not the case. To do this, we looked at their performance on trials when both stimuli changed. On these trials, the correct response was always to make a saccade, although the target depended on the color of the cue. Performance on these trials correlated with performance on trials when only the stimulus to be attended changed (r > 0.69; p < 0.0001), rather than when the other stimulus alone changed (r <0.23; p > 0.21). If monkeys were attending to both stimuli we would expect, given a certain color cue, that performance would be similar for each category of stimulus change, because both stimuli were attended on each trial. Instead, correlations in performance between categories of stimulus changes were more consistent with attention being allocated to one stimulus or the other. Moreover, the fact remains that responses changed when the monkey was cued to the visual stimulus.
Discussion
Our experiments have revealed two salient characteristics of TRN neurons in the awake monkey. First, the visual response is a remarkably consistent transient response superimposed on substantial background activity. Second, when the monkey shifts attention from the auditory to the visual stimulus, the amplitude of this transient response changes.
TRN neuronal activity
The spike densities plotted in Figure 2 demonstrate the consistency of the visual responses of TRN neurons. Such response regularity is consistent with TRN receiving its visual input from a point very early in the visual pathway as its anatomical connections with LGN would predict (Jones, 1975; Conley and Diamond, 1990; Harting et al., 1991; Uhlrich et al., 2003). What is probably more important is that because this visual response has such a short latency and brief duration, the output of the TRN appears to be temporally tuned to act, in return, on early visual responses in the LGN.
The TRN could also influence the visual processing in other areas to which it projects, such as the pulvinar (Conley and Diamond, 1990). The pulvinar can be regarded as much farther up the visual pathway than are the LGN and TRN, with visual latencies at least twice as long as the 25 ms TRN latencies, ∼65 ms for retinotopically organized neurons (Petersen et al., 1985). If the TRN were to influence activity in the pulvinar, the combination of short latency and brief duration of TRN responses implies that, in many cases, TRN responses may have largely ended before the full development of the pulvinar visual response. This does not exclude an influence of the TRN on higher levels of visual processing, but it does emphasize that the early transient visual response of TRN neurons makes them particularly appropriate for influencing visual processing early in the visual pathway.
The high background activity we observed in the TRN of the awake monkey is consistent with its potential role of providing inhibitory modulation to the LGN. Because the output of TRN is inhibitory, this background activity provides a tonic inhibition that is modified by changes in TRN activity. This high background rate is similar to that in another area where the output is inhibitory, the substantia nigra pars reticulata (Hikosaka and Wurtz, 1983; Hikosaka et al., 2000). Unlike the substantia nigra where the response to a visual stimulus is usually a transient pause in activity, with only some neurons showing a rise in activity (Handel and Glimcher, 1999), the response in TRN is consistently a transient increase of activity. Therefore, although the substantia nigra and the TRN both provide inhibitory outputs, the substantia nigra removes inhibition in response to visual stimuli, whereas the TRN produces a transient increase in inhibition.
TRN modulation with attention
When attention shifted from auditory to visual stimuli, the amplitude of the TRN transient visual responses changed, with increases in amplitude prevailing. This is the only effect we observed. The latency and duration of the transient did not change nor was there any change in the activity after the transient while the stimulus was still present. The background discharge rate did not change although the attentional cue was early enough to permit such a change. Thus, in our experiments, the modulation of TRN inhibitory output appears to be limited to a change in the amplitude of the transient visual response.
Although the mean increase in the amplitude of the visual response with attention was limited, when our population of TRN neurons was taken as a whole, the overall 10% change we observed is in line with the neuronal changes seen in V1 (Posner and Gilbert, 1999) although less than those sometimes seen in higher visual areas (Maunsell, 1995). This similarity to V1 might be expected, given the recognized circuit of connections between LGN, TRN, and V1. Accordingly, some of the cortical attentional effects seen in V1 might reflect the modulation of the visual signal by TRN before it reaches cortex if the effect we observe is, in fact, spatially selective. Primary visual cortex in turn might be one source of the modulation in TRN as suggested by the projection to TRN from cells in layer 6 of V1.
If we assume that the TRN affects early visual processing by its inhibitory influence on the LGN, then the predominant attentional effect acting through the TRN in these experiments transiently increases the inhibitory GABAergic drive on the LGN. How could an increase in inhibition on the LGN enhance visual processing? If visual TRN neurons project back to the LGN neurons from which they receive their inputs (to the neurons representing the same part of the visual field), they would form “closed loop” connections, resulting in feedback inhibition. It has been suggested that during wakefulness, feedback inhibition initiates a rhythmic burst firing in LGN relay neurons, which may serve to alert visual cortex of behaviorally relevant sensory input (Crick, 1984; Sherman and Guillery, 1996) and facilitate signal transmission during visual target acquisition and early phases of fixation (Guido and Weyand, 1995; also see Ramcharan et al., 2000). The predominant increase in visual TRN activity that we have shown would be consistent with this view, because this increase in activity would be passed to the LGN as an increase in inhibition, resulting in the hyperpolarization of the LGN membrane and the consequent switching of these visual thalamic relay neurons from tonic to burst mode (Llinas and Jahnsen, 1982; Jahnsen and Llinas, 1984a,b; Sherman and Koch, 1986). This would then facilitate visual detection and discrimination by the generation of a burst of activity rather than by simply modulating the average discharge rate. If this hypothesis turns out to be correct, it would provide exceptional validation of a change in behavioral state being translated into a change in membrane properties and then into a change in the pattern of neuronal discharge.
Alternatively, or additionally, visual TRN neurons may project to LGN neurons in adjacent areas of the visual field, forming an open loop connection. In this case, the effect of a focal increase in TRN activity would be lateral or surround inhibition rather than a change in firing mode. Consequently, initial discriminability and detectability would be improved by elevating the signal-to-noise ratio in the LGN and, therefore, the entire ensuing visual processing stream. Such lateral inhibition may preclude the relay of nearby irrelevant information, thus rendering attended information more salient or conspicuous. Anatomical evidence of predominantly open loop connections between TRN and LGN neurons in rodents suggests that TRN mediates its attentional effect primarily through lateral or surround inhibition (Pinault and Deschenes, 1998).
Both of these alternatives are readily testable by examining the changes in LGN neurons during attention tasks and by testing the spatial specificity of the attentional effect we observe. Regardless of how TRN mediates its attentional effect, however, our results support a central tenet of Crick’s attentional searchlight hypothesis –TRN contributes to subcortical stages of attentional processing where relevant sensory input is selected for additional processing at the expense of irrelevant input.
Footnotes
This work was supported by the intramural research program of the National Eye Institute. We are grateful for the assistance of Mitchell Smith, John McClurkin, Tom Ruffner, Altah Nichols, and Ginger Tansey.
References
- Carman JB, Cowan WM, Powell TP (1964). Cortical connexions of the thalamic reticular nucleus. J Anat 98:587–598. [PMC free article] [PubMed] [Google Scholar]
- Conley M, Diamond IT (1990). Organization of the visual sector of the thalamic reticular nucleus in Galago. Eur J Neurosci 2:211–226. [DOI] [PubMed] [Google Scholar]
- Cox CL, Huguenard JR, Prince DA (1997). Nucleus reticularis neurons mediate diverse inhibitory effects in thalamus. Proc Natl Acad Sci USA 94:8854–8859. [DOI] [PMC free article] [PubMed] [Google Scholar]
- Crabtree JW (1999). Intrathalamic sensory connections mediated by the thalamic reticular nucleus. Cell Mol Life Sci 56:683–700. [DOI] [PMC free article] [PubMed] [Google Scholar]
- Crick F (1984). Function of the thalamic reticular complex: the searchlight hypothesis. Proc Natl Acad Sci USA 81:4586–4590. [DOI] [PMC free article] [PubMed] [Google Scholar]
- Guido W, Weyand T (1995). Burst responses in thalamic relay cells of the awake behaving cat. J Neurophysiol 74:1782–1786. [DOI] [PubMed] [Google Scholar]
- Guillery RW, Feig SL, Lozsadi DA (1998). Paying attention to the thalamic reticular nucleus. Trends Neurosci 21:28–32. [DOI] [PubMed] [Google Scholar]
- Handel A, Glimcher PW (1999). Quantitative analysis of substantia nigra pars reticulata activity during a visually guided saccade task. J Neurophysiol 82:3458–3475. [DOI] [PubMed] [Google Scholar]
- Harting JK, Van Lieshout DP, Feig S (1991). Connectional studies of the primate lateral geniculate nucleus: distribution of axons arising from the thalamic reticular nucleus of Galago crassicaudatus. J Comp Neurol 310:411–427. [DOI] [PubMed] [Google Scholar]
- Hikosaka O, Wurtz RH (1983). Visual and oculomotor functions of monkey substantia nigra pars reticulata. I. Relation of visual and auditory responses to saccades. J Neurophysiol 49:1230–1253. [DOI] [PubMed] [Google Scholar]
- Hikosaka O, Takikawa Y, Kawagoe R (2000). Role of the basal ganglia in the control of purposive saccadic eye movements. Physiol Rev 80:953–978. [DOI] [PubMed] [Google Scholar]
- Jahnsen H, Llinas R (1984a). Voltage-dependent burst-to-tonic switching of thalamic cell activity: an in vitro study. Arch Ital Biol 122:73–82. [PubMed] [Google Scholar]
- Jahnsen H, Llinas R (1984b). Electrophysiological properties of guinea-pig thalamic neurones: an in vitro study. J Physiol (Lond) 349:205–226. [DOI] [PMC free article] [PubMed] [Google Scholar]
- Jones EG (1975). Some aspects of the organization of the thalamic reticular complex. J Comp Neurol 162:285–308. [DOI] [PubMed] [Google Scholar]
- Kim U, Sanchez-Vives MV, McCormick DA (1997). Functional dynamics of GABAergic inhibition in the thalamus. Science 278:130–134. [DOI] [PubMed] [Google Scholar]
- Llinas R, Jahnsen H (1982). Electrophysiology of mammalian thalamic neurones in vitro. Nature 297:406–408. [DOI] [PubMed] [Google Scholar]
- Maunsell JHR (1995). The brain’s visual world: representation of visual targets in cerebral cortex. Science 270:764–769. [DOI] [PubMed] [Google Scholar]
- McAlonan K, Brown VJ, Bowman EM (2000). Thalamic reticular nucleus activation reflects attentional gating during classical conditioning. J Neurosci 20:8897–8901. [DOI] [PMC free article] [PubMed] [Google Scholar]
- Montero VM (1997). c-fos induction in sensory pathways of rats exploring a novel complex environment: shifts of active thalamic reticular sectors by predominant sensory cues. Neuroscience 76:1069–1081. [DOI] [PubMed] [Google Scholar]
- Montero VM (1999). Amblyopia decreases activation of the corticogeniculate pathway and visual thalamic reticularis in attentive rats: a ‘focal attention’ hypothesis. Neuroscience 91:805–817. [DOI] [PubMed] [Google Scholar]
- Montero VM (2000). Attentional activation of the visual thalamic reticular nucleus depends on “top-down” inputs from the primary visual cortex via corticogeniculate pathways. Brain Res 864:95–104. [DOI] [PubMed] [Google Scholar]
- Ohara PT, Lieberman AR (1985). The thalamic reticular nucleus of the adult rat: experimental anatomical studies. J Neurocytol 14:365–411. [DOI] [PubMed] [Google Scholar]
- Petersen SE, Robinson DL, Keys W (1985). Pulvinar nuclei of the behaving rhesus monkey: visual responses and their modulations. J Neurophysiol 54:867–886. [DOI] [PubMed] [Google Scholar]
- Pinault D (2004). The thalamic reticular nucleus: structure, function and concept. Brain Res Brain Res Rev 46:1–31. [DOI] [PubMed] [Google Scholar]
- Pinault D, Deschenes M (1998). Anatomical evidence for a mechanism of lateral inhibition in the rat thalamus. Eur J Neurosci 10:3462–3469. [DOI] [PubMed] [Google Scholar]
- Posner MI, Gilbert CD (1999). Attention and primary visual cortex. Proc Natl Acad Sci USA 96:2585–2587. [DOI] [PMC free article] [PubMed] [Google Scholar]
- Ramcharan EJ, Gnadt JW, Sherman SM (2000). Burst and tonic firing in thalamic cells of unanesthetized, behaving monkeys. Vis Neurosci 17:55–62. [DOI] [PubMed] [Google Scholar]
- Sherman SM, Koch C (1986). The control of retinogeniculate transmission in the mammalian lateral geniculate nucleus. Exp Brain Res 63:1–20. [DOI] [PubMed] [Google Scholar]
- Sherman SM, Guillery RW (1996). Functional organization of thalamocortical relays. J Neurophysiol 76:1367–1395. [DOI] [PubMed] [Google Scholar]
- Sommer MA, Wurtz RH (2004). What the brain stem tells the frontal cortex. I. Oculomotor signals sent from superior colliculus to frontal eye field via mediodorsal thalamus. J Neurophysiol 91:1381–1402. [DOI] [PubMed] [Google Scholar]
- Uhlrich DJ, Manning KA, Feig SL (2003). Laminar and cellular targets of individual thalamic reticular nucleus axons in the lateral geniculate nucleus in the prosimian primate Galago. J Comp Neurol 458:128–143. [DOI] [PubMed] [Google Scholar]
- Weese GD, Phillips JM, Brown VJ (1999). Attentional orienting is impaired by unilateral lesions of the thalamic reticular nucleus in the rat. J Neurosci 19:10135–10139. [DOI] [PMC free article] [PubMed] [Google Scholar]