

Abstract
The external and internal segments of the pallidum (GPe and GPi) receive heavy GABAergic innervations from the neostriatum, an input nucleus of the basal ganglia. The GPe neurons provide another major GABAergic innervation to the GPe itself and GPi. Although these GABAergic inputs are considered to play key roles in controlling the level and pattern of firing activity of pallidal neurons in both normal and pathophysiological conditions, these inputs have not been well characterized in vivo. Here, we characterized the responses of pallidal neurons to single and burst stimulation of the putamen (Put) in awake monkeys. Unit recordings in combination with local infusion of drugs and a chemical blockade of the subthalamic nucleus (STN), the major origin of excitatory afferents, revealed the following. Under STN blockade, the duration of single Put stimulation induced gabazine (a GABAA antagonist)-sensitive responses differed greatly in the GPe (∼400 ms long) and in the GPi (60 ms long). Burst stimulation of the Put induced CGP55845 [(2S)-3-{[(1S)-1-(3,4-dichlorophenyl)ethyl]amino-2-hydroxypropyl}(phenylmethyl)phosphinic acid] (a GABAB antagonist)-sensitive responses in the GPe and GPi. However, the data suggested that the origin of the GABAB responses was the GPe, not the Put. Local CGP55845 application increased the spontaneous firing of GPe and GPi neurons, suggesting that GABA released from the axons of GPe neurons effectively activates GABAB receptors in the GPe and GPi and contributes significantly to the control of the level of neuronal activity.
Keywords: globus pallidus, putamen, unit recording, GABAA responses, GABAB responses, awake monkey
Introduction
The external (GPe) and internal (GPi) segments of the pallidum (GPe/GPi) play key roles in the physiology and pathophysiology of the basal ganglia. GPe/GPi receive their main GABAergic inputs from the neostriatum, an input nucleus of the basal ganglia, and GPe. The GPe projects to most of the basal ganglia nuclei, including the GPe itself (Robledo and Feger, 1990; Kita and Kitai, 1991; Kita, 1992, 1994; Parent and Hazrati, 1995; Kita et al., 1999). Thus, the GPe may play a significant role in controlling the level and pattern of firing activity of neurons in various nuclei of the basal ganglia (Kita, 1992, 1994). The GPi is a major output nucleus of the basal ganglia, receiving major inputs from the neostriatum, GPe, and the subthalamic nucleus (STN), and projecting to the thalamus.
The level and pattern of firing activity of GPe/GPi neurons changes with the development of basal ganglia diseases, including Parkinson's disease and hemiballism (Pan and Walters, 1988; Tremblay et al., 1989; Filion and Tremblay, 1991; Sterio et al., 1994; Nini et al., 1995; Beric et al., 1996; Lenz et al., 1998; Vitek et al., 1999; Boraud et al., 2001; Wichmann and Soares, 2006). Thus, exploring the mechanisms controlling their firing activity is important for understanding basal ganglia function in normal and pathological conditions. Although anatomical and in vitro physiological evidence suggests that GABAergic inputs from the neostriatum and GPe to GPe/GPi may exert different effects on the postsynaptic neurons through different receptors located at different loci (Parent and Hazrati, 1995; Shink and Smith, 1995; Ogura and Kita, 2000; Kaneda and Kita, 2005), in vivo studies that evaluate the actions of these receptors are scarce. Studies with cortical stimulation suggested that the duration of GABAA receptor-mediated inhibition in the GPe and GPi differ greatly (Nambu et al., 2000; Kita et al., 2004). Recent studies using monkeys revealed basic roles of ionotropic GABAergic inputs in the control of the level and pattern of firing activity of GPe/GPi neurons (Kita et al., 2004, 2005). Existence of ambient and synaptically evoked GABAB responses in the primate GPe/GPi (Galvan et al., 2005) and rat GPe (Kaneda and Kita, 2005) was also revealed recently. GPe neurons have more burst firing in parkinsonian conditions (Filion and Tremblay, 1991; Sterio et al., 1994; Nini et al., 1995; Beric et al., 1996; Boraud et al., 2001; Wichmann and Soares, 2006). This burst firing may be more effective for a large release of GABA and for GABAB receptor activation. Thus, the aim of the present study was to test the hypothesis that the activity of GPe/GPi neurons is controlled by continuous GABAA and GABAB receptor-mediated inputs originating from spontaneously active GPe neurons. Specifically, we examined whether putamen (Put) stimulation did indeed evoke different inhibitions in the two nuclei by pharmacological identifications and characterize GABAA and GABAB receptor-mediated responses of GPe/GPi neurons to single and burst Put stimulation in awake monkeys.
Materials and Methods
Monkey preparation.
This study was performed in compliance with the guidelines of National Institutes of Health Guide for Care and Use of Laboratory Animals and the National Institute of Physiological Sciences for the Use and Care of Laboratory Animals in Research. The monkey preparation methods used in the present study were very similar to those reported previously (Nambu et al., 2000; Kita et al., 2004, 2005). In short, a Macaca fuscata and a Macaca mulatta were trained to sit in a monkey chair quietly. Before surgery, monkeys were anesthetized and placed in a homemade acrylic stereotaxic apparatus, and then magnetic resonance images of the monkey head were taken. The monkeys then received surgery to fix their heads painlessly to a stereotaxic frame attached to the chair. Under sodium pentobarbital (25 mg/kg, i.v.) and ketamine hydrochloride (10 mg/kg, i.m.) anesthesia, the skull of the monkey was widely exposed, small stainless screws were attached to the skull as anchors, the exposed skull and screws were completely covered with transparent acrylic resin, and two stainless steel pipes were mounted in parallel over the frontal and occipital areas for head fixation. A few days after the initial surgery, a second surgery was performed to implant a stimulus electrode into the hand region of the primary motor cortex (M1). The M1 stimulation was used to locate the hand areas of the Put, GPe/GPi, and STN (for details, see Nambu et al., 2000). Monkeys were anesthetized with ketamine hydrochloride (10 mg/kg, i.m.) and xylazine hydrochloride (1–2 mg/kg, i.m.) and were seated in a monkey chair with its head fixed in a stereotaxic frame. To access the M1, a hole was drilled in the skull. After recovery from the anesthesia, a glass-coated Elgiloy (Hampstead, NH) alloy microelectrode (0.5–1.5 MΩ at 1 kHz) was inserted perpendicular to the cortical surface. Extracellular unit activity was recorded in 1–1.5 mm intervals, and the neuronal responses to somatosensory stimuli (skin touch and passive joint movement) were examined. After extracellular unit recording, intracortical microstimulation, a train of 12 cathodal pulses (200 μs duration at 333 Hz) with currents of <50 μA, was delivered, and movements evoked in the various body parts were observed. According to the electrophysiological mapping, a bipolar stimulating electrode (made of 200-μm-diameter enamel-coated stainless steel wire; intertip distance, 2 mm) was implanted into the hand region of the M1. Monkeys were reanesthetized, and two holes (10–15 mm diameter) were drilled in the skull to access the Put, pallidum, and the STN. A rectangular-shaped plastic chamber covering both holes, 30- and 55-mm-long in the rostrocaudal and mediolateral directions, was fixed with an ∼20° tilt from the horizontal plane onto the skull with acrylic resin.
Electrode assembly for unit recording and local injection of drugs.
The method for GPe/GPi units recording was very similar to previous studies (Nambu et al., 2000; Kita et al., 2004). During the experimental sessions, the monkeys were seated in a monkey chair with their heads restrained. Single-unit recordings in combination with local applications of GABAA or GABAB antagonists were performed with an electrode assembly consisting of a platinum–iridium wire (catalog #7675; A-M Systems, Carlsborg, WA) placed in a silica tube [outer diameter (OD), 147 μm; inner diameter (ID), 74 μm; part #2000018; Polymicro Technologies, Phoenix, AZ] for unit recordings and two other silica tubes (OD, 146 μm; ID, 31 μm; part #2000012; Polymicro Technologies) for drug delivery (for more detail on the electrode assembly, see Kita et al., 2004). The impedance of the unit-recording electrode ranged from 0.7 to 1.2 MΩ (measured with 1 kHz alternating current).
The electrode assembly was penetrated obliquely (45° from vertical) into GPe/GPi with reference to the recording regions used in previous studies (see hand region of GPe/GPi) (Yoshida et al., 1993; Nambu et al., 2000) and from the responses to M1 stimulation. Throughout the course of the experiment, x-ray images of the frontal and sagittal planes were taken frequently to locate the electrodes. Recordings were made from GPe/GPi neurons that responded to M1 stimulation but not from other neurons. The GABAA antagonist gabazine (0.2 mm) and the GABAB antagonist CGP55845 [(2S)-3-{[(1S)-1-(3,4-dichlorophenyl)ethyl]amino-2-hydroxypropyl} (phenylmethyl)phosphinic acid] (a final concentration of 0.5 mm from a 50 mm stock in DMSO) were dissolved in saline, and a total volume of 0.1–0.2 μl was injected to the recording site at a rate of 0.03 μl/min (i.e., the total injection time was 3–7 min) by advancing the plungers with computer-controlled stepping motor-driven actuators. Our previous study using the same injection method indicated that the drug effect became maximum 5–10 min after the injection, and the radius of the effective area was <1 mm with a 0.2 μl injection (Kita et al., 2004, 2005). Thus, once an injection was made, the next injection site was separated by at least 1 mm from the previous injection site. In an initial stage of the experiment, we confirmed that injections of saline alone (four neurons each in the GPe and GPi) or saline with 1% DMSO (four neurons each in the GPe and GPi) did not alter the firing rate, firing pattern, or Put stimulation-induced responses.
The method for blockade of the STN with the GABAA receptor agonist muscimol was also the same as that described previously (Nambu et al., 2000; Kita et al., 2004). In short, the area of the STN responding to M1 stimulation was mapped by unit recording with an Elgiloy electrode. A tungsten wire attached to the 30 gauge needle of a 10 μl Hamilton microsyringe was then used to penetrate vertically into the mapped location of the STN using a hydraulic microdrive with unit recordings and x-ray images as guides. Muscimol (0.5 μg/μl in saline, 0.5–1.0 μl) was injected only once a day.
Put stimulation, unit recordings, and data analysis.
The Put was mapped by unitary responses to M1 stimulation to locate the wrist/digits region. Concentric-bipolar electrodes fabricated with a stainless steel center lead (diameter, 120 μm) and a stainless steel outer tube (OD, 0.35 mm), with a tip separation of 0.5 mm and an impedance of ∼5 kΩ (measured with 1 kHz alternating current), was chronically implanted in the area of the Put that responded to M1 stimulation (for the location, see Nambu et al., 2002). The duration of the stimulus current pulses was 300 μs. Other stimulus parameters were as follows: for single stimulation, strength up to 0.7 mA, delivered every 1.4 s; for burst stimulation with 10 burst pulses (up to 100 Hz), strength up to 0.4 mA, delivered every 5.4 s.
The unit recordings were amplified, passed through a 0.7–2 kHz bandpass filter and then to a homemade time-amplitude-window discriminator that has a threshold selection and a window setting mechanism (a modified version of Mano and Yamamoto, 1978). The window can be placed at a specified delay time from the initial threshold setting. For instance, a level above noise is selected for the threshold, and a window is set at the peak of the desired spikes to exclude other spikes of different sizes or widths and stimulus artifacts. The stimulus artifacts to strong intensity stimulation of the Put created short, one or two bins, gaps, or shortening of bins in the peristimulus time histograms (PSTHs) immediately after the stimulation. However, the artifacts did not affect the analysis in the present study. The responses of GPe/GPi neurons to the Put stimulation were assessed by constructing PSTHs for 50 single stimulation trials and 25 burst stimulation trials. The ordinate of all of the PSTHs was converted to the firing rate. PSTHs with a 1 ms bin width were constructed on-line for initial evaluations. For analysis of the slow inhibitory responses lasting >100 ms to burst stimulation, PSTHs with a 4 ms bin width were generated off-line. The firing during the 100 ms preceding the stimulation was considered to be the base discharge. The changes in the firing activity in response to Put stimulation were judged to be significant if the firing rate during at least two consecutive bins of the PSTHs exceeded the 95% confidence interval of the base discharge (one-tailed t test for each bin). The amplitude of fast excitations and inhibitions was obtained from the average of the two consecutive highest or lowest bins, respectively. The magnitude of the slow inhibitory responses occurring after the termination of burst Put stimulation was obtained in the following manner. The duration of the inhibition with its initiation and end points was determined by having two consecutive bins exceeding the significance level. The mean firing rate of the base discharge minus that of the inhibition (i.e., the area of the inhibition) was obtained as the magnitude of the inhibition. Changes in the slow inhibitory responses from local injections of CGP55845 were similarly assessed by comparing the areas of the inhibition (see Fig. 3). Because the drug effects became strongest 5–10 min after injection and decayed very slowly with partial recovery at 45–60 min after injection (Kita et al., 2004), the spontaneous firing rate, the amplitudes, and the durations of the responses to Put stimulation obtained immediately before and 5–10 min after completion of drug injection were evaluated by ANOVA with Bonferroni's/Dunn's post hoc test or paired t test. In some experiments, a second drug injection was made 12–15 min after the first injection, and effects of the second drug were similarly assessed 5–10 min after completion of drug injection. The rates and patterns of firing were analyzed by calculating the mean rates and autocorrelograms (bin width, 0.5 ms) from 50 s of digitized recordings. The regularity of the firing was assessed from the presence of multiple peaks and their height in the autocorrelograms. The 50 s of data were also used to obtain burst indexes. We chose the proportion of spikes in bursts (percentage) as the index because this was frequently used in other studies and was not correlated with the background firing rate of neurons (Wichmann and Soares, 2006). Bursts were detected by the “surprise” method of Legendy and Salcman (1985) with the surprise value of at least three and the number of spikes of at least three in a burst. These values were adopted from a recent detailed study on burst in monkey pallidum and STN (Wichmann and Soares, 2006).
Figure 3.

A–D, Responses of a local gabazine (0.2 mm, 0.2 μl)-treated GPe neuron to burst Put stimulation (10 pulses, 0.4 mA) with different stimulus frequencies. PSTHs obtained from the GPe neuron show that burst stimulation with 100 Hz evoked the strongest excitations during the burst stimulation and was followed by the strongest slow inhibition. In this and in Figure 4, the hatched areas indicate the magnitude of slow inhibitions. The open arrowheads mark the statistically defined beginning and end of the slow inhibitions. E, The magnitudes of the inhibitions from three gabazine-treated GPe neurons were normalized by the maximum inhibition and plotted. Burst stimulation with 100 or 50 Hz evoked the strongest inhibition.
Histology.
Several of the recording and drug injection sites were marked by passing a cathodal direct current (20 μA for 30 s) through the recording electrode. At the end of the final experiment, the monkeys were deeply anesthetized with sodium pentobarbital (50 mg/kg, i.v.) and perfused transcardially with 2 liters of PBS, pH 7.3, followed by 5 liters of 4% paraformaldehyde in 0.1 m phosphate buffer. The monkeys were then perfused with 3 liters of 0.1 m phosphate buffer containing 10% sucrose and, finally, with 2 liters of the phosphate buffer containing 30% sucrose. The brains were cut serially into 60-μm-thick frontal sections on a freezing microtome. These sections were mounted onto gelatin-coated glass slides and stained with 1% neutral red. The recording and drug injection sites were reconstructed according to the lesions made by current injections and the traces of the electrode tracks (data not shown).
Results
Responses of GPe/GPi neurons to single and burst Put stimulation
The neurons that responded to stimulation of the Put included 38 GPe and 14 GPi neurons recorded before the STN block and 16 GPe and 11 GPi neurons recorded after the STN block. The neurons from the two monkeys were pooled because the spontaneous firing rates and amplitudes of inhibitory and excitatory responses to single Put stimulation obtained from these monkeys were the same (ANOVA). Before the STN blockade, the patterns of responses evoked by single or burst Put stimulation were similar in both the GPe and the GPi. Single Put stimulation induced an inhibition in all responded neurons, and the inhibition was followed by an excitation in the majority of the GPe (35 of 38) and GPi (13 of 14) neurons (Fig. 1A-a,B-a). Three GPe neurons and one GPi neuron induced an inhibition only. Table 1 shows the latencies and the half-durations of the inhibitions and excitations evoked by single, up to 0.7 mA, stimulation. The latency of the inhibition was ∼2.5 ms shorter in the GPe than in the GPi (p < 0.01, ANOVA). The mean duration of the inhibition in the GPe was ∼3 ms longer than in the GPi, but the difference was insignificant. The latencies of the excitations were similar in the two nuclei. The duration of the excitations was significantly longer in the GPe than in the GPi (p < 0.02, ANOVA). These statistical differences can also be seen in the population responses, the averaged PSTHs, of all of the GPe and GPi neurons that responded to single Put stimulation (Fig. 2A-a,B-a). Occasional experimentation with very strong, up to 1.2 mA, stimulation revealed 2–3 ms latency inhibitions in both GPe and GPi neurons, as expected from the direct stimulation of the axons of GPe neurons projecting to the Put (Kita and Kitai, 1994; Bevan et al., 1998; Kita et al., 1999; Ogura and Kita, 2000). These short-latency responses were excluded from the present report.
Figure 1.

Single and burst Put stimulation evoked similar responses in GPe (A) and GPi (B) neurons. A-a, B-a, Single Put stimulation with 0.7 mA evoked an inhibition followed by an excitation in both the GPe and GPi neurons. Burst Put stimulation with 0.4 mA (10 pulses with 50 Hz) evoked short inhibitions and excitations to each burst stimulation. A-b, B-b, Local application of gabazine (0.2 mm, 0.2 μl) to the same neurons increased the rate of spontaneous firing and also greatly reduced or blocked the short-duration inhibitions to single and burst stimulations. After gabazine application, the excitations of both the GPe and GPi neurons to burst stimulations were followed by a slow inhibition. In this and the following figures, the PSTHs for single and burst stimulations (marked by black arrows) were constructed with 1 and 4 ms bins, respectively. Also, in this and some of the following figures, the mean firing rate and the significance levels of excitations and inhibitions, determined by one-tailed t tests using the base firing from the 100 ms before stimulation, are indicated by a long, thin black line, a thick black line, and a white line.
Figure 2.

Population responses of GPe (A) and GPi (B) neurons to single Put stimulation. A-a, B-a, PSTHs of all GPe and GPi neurons responding to single Put stimulation with 0.7 mA obtained in control conditions were averaged. A-b, B-b, PSTHs of all GPe and GPi neurons responding to single Put stimulation with 0.7 mA obtained after the blockade of the STN were averaged. In A-b, an averaged PSTH is shown with different timescales.

In most of the GPe and GPi neurons, burst Put stimulation (10 pulses with 50 or 100 Hz) induced repeated occurrences of short inhibitions and excitations, forming a comb-like appearance in the PSTHs. Termination of the stimulation was followed by either an excitation lasting 150–200 ms (n = 22 in GPe; n = 12 in GPi) (Fig. 1) or an excitation followed by a slow inhibition lasting >100 ms in a small number (4 of 26 GPe and 3 of 15 GPi) of neurons.
Effects of local gabazine and CGP55845
Local application of the GABAA antagonist gabazine increased the rate and regularity of spontaneous firing as reported previously (Kita et al., 2004) and greatly decreased or abolished single-stimulation-induced inhibition in all GPe and GPi neurons tested (Fig. 1). After gabazine application, the latency of the excitations was ∼4 ms shorter in the GPe (p < 0.01, ANOVA) and 6.5 ms shorter in the GPi (p < 0.01; Table 1). The peak amplitude of the single-stimulation-induced excitations in the GPe and GPi was reduced by 34.2% (p < 0.02, paired t test; n = 13) and by 27.2% (p < 0.05, paired t test; n = 8), respectively. The duration of the excitation in GPi increased by ∼9 ms as the blockade of the inhibition uncovered the early part of the excitations (Fig. 1, Table 1), although the change in the GPe was insignificant.
Gabazine also greatly decreased or abolished the early inhibitions that were induced during burst Put stimulation (Fig. 1). After the excitations to burst stimulation, 11 of 13 in GPe and 10 of 12 in GPi neurons evoked a slow gabazine-insensitive inhibition lasting 100–200 ms (Fig. 1). The remaining neurons had no slow inhibition. Three of the GPe neurons that showed the slow inhibition were tested with various frequencies of burst Put stimulation. Using a fixed number of stimulus pulses, 50 or 100 Hz stimulation most effectively evoked the excitation during stimulation and the gabazine-insensitive inhibition in these GPe neurons (Fig. 3).
Local application of the GABAB antagonist CGP55845 was performed on nine GPe and nine GPi neurons that were pretreated by gabazine 12–15 min before the CGP55845 injection. CGP55845 increased the spontaneous activity of all of these GPe and GPi neurons and also greatly decreased the gabazine-insensitive slow inhibition to burst Put stimulation (Fig. 4). The burst indexes of most of the gabazine-treated neurons, both before and after CGP55845 application, were 0 or nearly 0. CGP55845 was also tested on four GPe and three GPi neurons recorded before local gabazine application. CGP55845 increased the spontaneous firing rate without altering the firing patterns (Figs. 4C,D, 5A). CGP55845 decreased the burst indexes of all four GPe neurons (from 9.3, 6.8, 8.7, and 14.2% to 2.5, 2.3, 0.6, and 6.3%, respectively; p < 0.005, paired t test) and also for all three GPi neurons (from 6.5, 1.1, and 18.0% to 1.2, 0.8, and 3.9% respectively; p > 0.05). CGP55845 did not change the short-latency inhibitions of the GPe and GPi neurons to single (Fig. 5A) and repetitive stimulation of the Put (data not shown).
Figure 4.
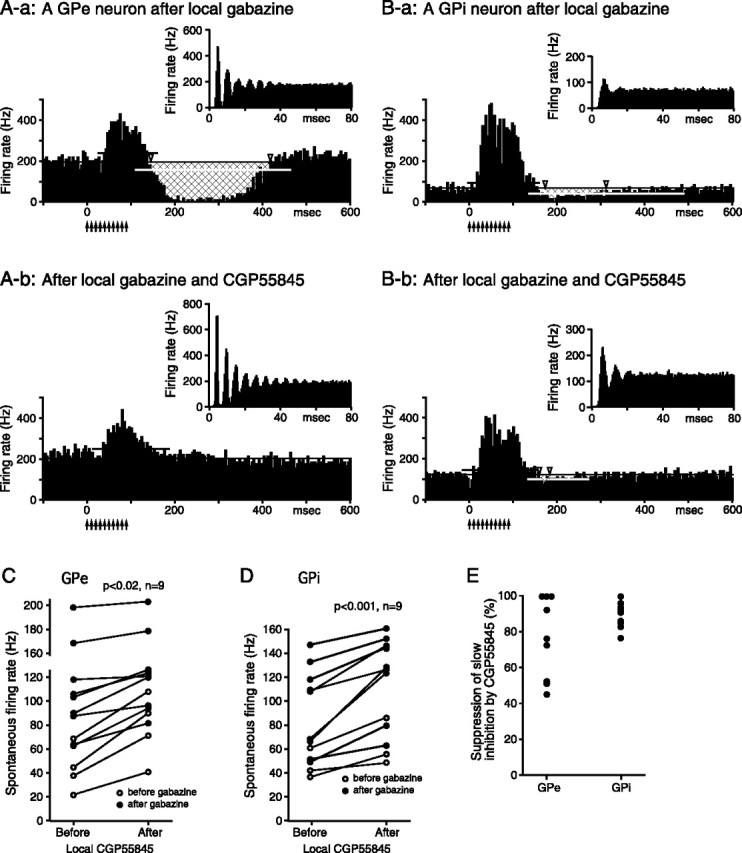
Effects of CGP55845 on GPe and GPi neurons pretreated with local gabazine (0.2 mm, 0.2 μl) application. A, B, Autocorrelograms and PSTHs to burst Put stimulation (10 pulses, 0.4 mA, 100 Hz) of a GPe (A-a, A-b) and a GPi (B-a, B-b) neuron recorded before and after local application of the CGP55845 (0.5 mm, 0.2 μl). C, D, Summaries show that CGP55845 significantly increased the spontaneous firing rate of the GPe and GPi neurons. The neurons recorded after the gabazine applications were used for the paired t tests. E, A summary shows that CGP55845 significantly suppressed or blocked the gabazine-insensitive slow inhibition to burst stimulation of the Put. The magnitude of the inhibition was assessed from PSTHs as described in Materials and Methods (also see the legend for Fig. 3), and the effect of each neuron was normalized by the inhibition in the PSTH recorded before the application of CGP55845.
Figure 5.

Effects of CGP55845 on GPe neurons. A-a, A-b, Responses of a GPe neuron to single 0.4 mA Put stimulation. An autocorrelogram and a digitized spike trace of the neuron before and after local CGP55845 application (0.5 mm, 0.2 μl). B-a, B-b, Another GPe neuron similarly recorded after muscimol (0.5 μg/μl, 1.0 μl) blockade of the STN. In both cases, CGP55845 increased the firing rate without significantly altering the responses to Put simulation or the firing patterns.
Effects of muscimol blockade of the STN
To block the excitations originating from the STN, muscimol was injected in the STN. In previous studies, we showed that local injection of the GABAA agonist muscimol results in a complete cessation of the unitary activity of the STN, in alterations in the firing activity in the GPe and GPi, and in some instances, but not always, in the induction of dyskinesias 15–60 min after the injection (for details, see Nambu et al., 2000; Kita et al., 2004). The data presented here were collected before the development of dyskinesias. During generation of strong dyskinetic movements, the recording was terminated, and ketamine hydrochloride (10 mg/kg, i.m.) and pentobarbital (10–15 mg/kg, i.m.) were given to suppress the movement. The STN blockade eliminated the excitatory responses to single Put stimulation in the GPe and greatly prolonged the duration of the inhibition (Table 1, Fig. 6A-a,B-a). In the GPi, the inhibitions to single Put stimulation were also prolonged but to a smaller degree than with the GPe neurons (Table 1). These statistical differences can also be seen in the population responses, the averaged PSTHs, of all of the GPe and GPi neurons that responded to single Put stimulation (Fig. 2A-b,B-b). In 5 of 11 GPi neurons, the inhibition was followed by a gabazine-sensitive rebound-like excitation (Fig. 6C). These responses in the GPe and GPi were very similar to the responses to motor cortex stimulation (Nambu et al., 2000; Kita et al., 2004). Responses to burst Put stimulation after the STN blockade also differed in the GPe and GPi. In the GPe, burst stimulation induced an inhibition lasting 405.5 ± 37.4 ms (n = 9), followed by a slow excitation lasting >1 s (Fig. 6A-a,B-a). In the GPi, burst stimulation induced an inhibition with the duration of 207.4 ± 22.5 ms (n = 7). Unlike the GPe, the inhibition ended shortly after termination of the repetitive stimulation (Fig. 6C-a). In three of the seven GPi neurons, the inhibition was followed by a very weak rebound-like excitation.
Figure 6.

Responses of GPe and GPi neurons to single (0.7 mA) and burst (10 pulses, 0.4 mA, 50 Hz) Put stimulation recorded after muscimol (0.5 μg/μl, 1.0 μl) blockade of the STN. A, Both single and burst stimulation induced a long-duration inhibition in a GPe neuron (A-a), and local gabazine (0.2 mm, 0.2 μl) application completely blocked the inhibitions (A-b). B, Another GPe neuron induced a similar slow inhibition to both single and burst stimulation (B-a). Local gabazine (0.2 mm, 0.6 μl) application blocked the inhibition to single stimulation, whereas the inhibition to burst stimulation was prolonged although the initiation of the inhibition was slowed (marked by an open arrow in B-b). C, Single and burst stimulation induced a relatively short-duration inhibition followed by a short excitation in a GPi neuron (C-a), which was completely blocked by gabazine (0.2 mm, 0.2 μl) (C-b).
Local gabazine application increased the level of spontaneous activity of GPe/GPi and greatly reduced the occurrence of the spontaneous long pauses in the GPe, as reported previously (Kita et al., 2004). In the GPe, gabazine completely blocked the inhibitions to single Put stimulation (Fig. 6A,B). Gabazine also blocked the long inhibitions evoked after the termination of the burst stimulation in five of nine neurons (Fig. 6A). When gabazine blocked the long inhibition, the following slow excitation was also eliminated. However, in the remaining four neurons, gabazine slowed the onset of the inhibition but prolonged the duration of the inhibition to burst stimulation instead of blocking it (Fig. 6B). These four neurons were tested with multiple applications of gabazine, repeated three times in 5 min intervals with a total application of 0.6 μl. It was confirmed that the second and third applications of gabazine did not block the inhibition (Fig. 6B). In the GPi, gabazine completely eliminated the inhibitions to single and burst Put stimulation (Fig. 6C-b).
Application of CGP55845 increased the spontaneous firing rate of all five GPe neurons (39.0 ± 14.6 to 52.9 ± 16.6 Hz; p < 0.001, paired t test) (Fig. 5B) and four GPi neurons (35.7 ± 6.1 to 43.0 ± 6.7 Hz; p < 0.005) tested after the blockade of the STN. Although CGP55845 did not alter the firing pattern (Fig. 5B), the burst indexes decreased in both GPe (73.8 ± 17.8 to 51.6 ± 27.4%; p < 0.05, paired t test) and GPi neurons (27.3 ± 8.3 to 14.1 ± 12.2%; p < 0.02). The burst index of GPe neurons after the STN blockade was very high because of the development of strong active and silent phases (Nambu et al., 2000; Kita et al., 2004). However, the effects of CGP55845 on single Put-stimulation-induced gabazine-sensitive inhibition were insignificant (p > 0.05 in paired t tests in both GPe and GPi) and inconsistent. CGP55845 decreased the duration of the inhibition in four GPe and three GPi neurons and increased the duration in two GPe and one GPi neuron. CGP55845 also had no significant effect on burst-stimulation-induced gabazine-insensitive inhibition in the GPe (data not shown; p > 0.05 in paired t tests in both GPe and GPi). Thus, no GABAB receptor-mediated responses to Put stimulation could be identified in either the GPe or the GPi after the blockade of the STN.
Discussion
Responses to single Put stimulation
Response patterns of GPe/GPi neurons to single Put stimulation in control conditions were similar to those published previously (Ohye et al., 1976; Tremblay and Filion, 1989; Yoshida et al., 1993). Based on anatomical and physiological evidence, the initial inhibitions in GPe/GPi were attributable to GABAergic Put–GPe/GPi inputs (Kita and Kitai, 1991; Kita, 1994; Parent and Hazrati, 1995; Shink and Smith, 1995). The inhibition should consist of both monosynaptic and polysynaptic components because Put stimulation could activate cortical and thalamic axons terminating on nearby Put neurons (Kita, 1993). When the STN was blocked, the duration of Put stimulation-induced-inhibition in the GPe was much longer than in the GPi. We made a similar observation with motor cortex stimulation (Nambu et al., 2000; Kita et al., 2004). Thus, the differences in the inhibitions in the two nuclei were not specific to cortical stimulation. The long-duration inhibition in the GPe is puzzling because in vitro recordings never evoked such inhibitions (Nambu and Llinás, 1994; Stanford and Cooper, 1999; Ogura and Kita, 2000; Kaneda and Kita, 2005). Some possible explanations for the long inhibition are (1) that membrane properties or GABA uptake mechanisms differ in monkey and rodent GPe and (2) that stimulation of the Put might activate dopamine and serotonin systems that modulate GABAergic inhibition. For instance, activation of dopamine D1 receptors in the substantia nigra pars reticulata enhances GABAergic inhibition (Radnikow and Misgeld, 1998). However, in our preliminary in vitro study, dopamine reduced the GABAergic IPSCs in GPe (Hashimoto et al., 2001), probably attributable to presynaptic D2 receptor activation (Cooper and Stanford, 2001). We do not think that serotonin prolonged the inhibition because our preliminary results suggested that serotonin decreased the inhibition (Hashimoto and Kita, 2002). The relatively short-duration inhibition in the GPi was attributable, at least in part, to activation of rebound mechanisms, because the inhibition often ended abruptly with gabazine-sensitive excitation.
In control conditions, the inhibition of GPe/GPi to single Put stimulation was followed by an excitation that could be decreased by the STN blockade. Put stimulation excites the STN through multiple pathways. One is the Put–GPe–STN pathway that disinhibits the STN during Put stimulation. The reduction of the excitation in GPe neurons after local gabazine application can be attributed to this pathway, similar to the responses to cortical stimulation (Kita et al., 2004). Another route is the activation of cortical and thalamic axons in the Put that monosynaptically or polysynaptically (for instance, through the cortex) activates the STN. Because our main interest of the present study was to characterize the Put–GPe/GPi inhibitory inputs, additional attempts to isolate these connections were not made.
GABAB responses
In control conditions, burst Put stimulation induced slow inhibitions in only a small number of GPe/GPi neurons. However, most of the neurons induced a slow inhibition when gabazine was applied to block GABAA responses. Possible reasons for the induction of the slow inhibition are that gabazine increased the firing rate (i.e., depolarized the neurons), making the slow inhibition easier to detect in unit recordings, and that GABAA responses may have effectively shunted the GABAB responses. Presynaptic GABAA inhibition of GABA release is unlikely because GABAA receptors have not been found on GABAergic terminals in GPe/GPi (Charara et al., 2005). Our previous in vitro study showed no significant direct gabazine effects on the amplitude of the local repetitive stimulation-induced GABAB response in rat GPe (Kaneda and Kita, 2005). Another possibility applicable to the GPe is that gabazine increased the firing during stimulation, thus evoking stronger slow inhibition. This last possibility is based on the assumption discussed below that GPe activation is the source of the slow inhibition.
We found that the blockade of the STN eliminated not only the excitations to burst Put stimulation but also the CGP55845-sensitive inhibitions, although the gabazine-insensitive responses remained. These observations suggest that GPe neurons, but not Put neurons that form GABAergic synapses in GPe/GPi, effectively evoke GABAB responses. It should be noted that, unlike GPe neurons, GPi neurons in both monkey and rat do not have extensive local collaterals (Nakanishi et al., 1991; Parent et al., 1999). The most effective burst Put stimulus frequency to evoke the CGP55845-sensitive inhibition was 50 or 100 Hz, which was also the most effective stimulus to evoke strong excitations in the GPe. Receptor localization studies suggest that both striatal and local collateral synapses may evoke GABAB responses (Chen et al., 2004). Thus, some possibilities for the failure of Put axons to evoke an appreciable GABAB response are that the Put-axon terminals may have a small GABA release probability or, conversely, that the GABA released from Put terminals was taken up before reaching the receptors. Another factor may be that the distal dendritic location of the Put-axon synaptic site, opposed to the proximal dendritic location of GPe-axon synaptic site (Shink and Smith, 1995), may greatly dampen the response when recording at the soma (Hanson et al., 2004).
The observation that CGP55845 application consistently increased the firing frequency of GPe/GPi neurons suggested tonic activation of GABAB receptors. It also supports the hypothesis that ambient GABA levels in GPe projection sites play a significant role in the control of the rate and pattern generations in neuronal activities (Galvan et al., 2005; Hallworth and Bevan, 2005; Kaneda and Kita, 2005). This observation is consistent with our previous study suggesting that the spontaneous firing of most of GPe neurons in vivo is sufficient to release the GABA required to activate perisynaptic GABAB receptors (Kaneda and Kita, 2005). The short and long pauses in the GPe before and after muscimol blockade of the STN were not abolished by CGP55845, although their intervals shorten as the firing rate increased, suggesting that the pauses were not initiated but were modulated by GABAB receptor activation. CGP55845 reduced the burst indexes of GPe/GPi neurons, probably attributable to an increase in the mean firing rate, which itself regularized the firing intervals (Bar-Gad et al., 2001).
We tested the possibility that CGP55845 might block presynaptic GABAB suppression and enhance the GABAA inhibition to single Put stimulation (Kaneda and Kita, 2005). The experiments produced inconsistent results probably because the increase in the spontaneous firing obscured the enhancement of the GABAA response. Alternatively, the tonic level of GABA might be insufficient to activate GABAB receptors on Put-axons terminals. The examination of GABAB receptors on the GPe-axon terminals was not performed in the present study because of technical difficulties.
Other responses
After STN blockade, the slow inhibition to burst Put stimulation was followed by strong slow excitations in the GPe or by short excitations in the GPi. These excitations were considered to be rebounds because the blockade of the preceding inhibitions also blocked the excitations. The difference in the duration of the excitations in the GPe and GPi suggests that there are different mechanisms to induce rebounds such as the prominent involvement of the persistent sodium current in the GPe versus the low-threshold calcium current in the GPi (Nakanishi et al., 1990; Kita and Kitai, 1991; Chen et al., 2004).
After the STN blockade, burst Put stimulation revealed gabazine- and CGP55845-insensitive slow inhibition in ∼40% of the GPe neurons. The nature of the inhibition is unknown at present.
Conclusions
One of the main findings in the present study was that Put stimulation given after the muscimol blockade of the STN evoked very-long-duration inhibitions in the GPe and short-duration inhibitions in the GPi. We speculate that the long-duration inhibition in the GPe observed after STN blockade may underlie, at least in part, the frequent occurrence of relatively long gabazine-sensitive pauses in the GPe, because local gabazine abolished the pauses in some GPe neurons (Kita et al., 2004). Another main finding was that GABA released from GPe axons may effectively activate GABAB receptors in GPe/GPi and contribute significantly to the control of the level of the neuronal activity. From this and previous in vivo and in vitro findings, it can be suggested that GABAB receptors at the GPe innervation sites, including the GPe, GPi, and STN, are activated by ambient extracellular GABA released from GPe axons and that these receptors contribute significantly to the feedback and feedforward controls of the neurons in the target structures (Galvan et al., 2005; Hallworth and Bevan, 2005; Kaneda and Kita, 2005). In patients and in the animal models of Parkinson's disease, GPe neurons have more burst firing than in normal conditions (Filion and Tremblay, 1991; Sterio et al., 1994; Nini et al., 1995; Beric et al., 1996; Boraud et al., 2001; Wichmann and Soares, 2006) that might effectively activate GABAB receptors at their innervation sites. The expression of GABAB receptors in the pallidum and STN was altered in parkinsonian subjects (Calon et al., 2001, 2003; Johnston and Duty, 2003). Additional studies are required to clarify the roles of the GABAB responses in movement control in normal and in basal ganglia disorder conditions and to develop strategies for using GABAB reagents for the treatments of basal ganglia disorders.
Footnotes
This work was supported by National Institutes of Health Grant NS-42762 and NS-47085 and by the Japan Society for the Promotion of Science. We thank Ms. D. Merrick and Dr. T. Kita for editing this manuscript and Dr. A. Kita for helping statistical analysis.
References
- Bar-Gad I, Ritov Y, Bergman H (2001). The neuronal refractory period causes a short-term peak in the autocorrelation function. J Neurosci Methods 104:155–163. [DOI] [PubMed] [Google Scholar]
- Beric A, Sterio D, Dogali M, Fazzini E, Eidelberg D, Kolodny E (1996). Characteristics of pallidal neuronal discharges in Parkinson's disease patients. Adv Neurol 69:123–128. [PubMed] [Google Scholar]
- Bevan MD, Booth PA, Eaton SA, Bolam JP (1998). Selective innervation of neostriatal interneurons by a subclass of neuron in the globus pallidus of the rat. J Neurosci 18:9438–9452. [DOI] [PMC free article] [PubMed] [Google Scholar]
- Boraud T, Bezard E, Bioulac B, Gross CE (2001). Dopamine agonist-induced dyskinesias are correlated to both firing pattern and frequency alterations of pallidal neurones in the MPTP-treated monkey. Brain 124:546–557. [DOI] [PubMed] [Google Scholar]
- Calon F, Lavertu N, Lemieux AM, Morissette M, Goulet M, Grondin R, Blanchet PJ, Bedard PJ, Di Paolo T (2001). Effect of MPTP-induced denervation on basal ganglia GABAB receptors: correlation with dopamine concentrations and dopamine transporter. Synapse 40:225–234. [DOI] [PubMed] [Google Scholar]
- Calon F, Morissette M, Rajput AH, Hornykiewicz O, Bedard PJ, Di Paolo T (2003). Changes of GABA receptors and dopamine turnover in the postmortem brains of parkinsonians with levodopa-induced motor complications. Mov Disord 18:241–253. [DOI] [PubMed] [Google Scholar]
- Charara A, Pare JF, Levey AI, Smith Y (2005). Synaptic and extrasynaptic GABA-A and GABA-B receptors in the globus pallidus: an electron microscopic immunogold analysis in monkeys. Neuroscience 131:917–933. [DOI] [PubMed] [Google Scholar]
- Chen L, Boyes J, Yung WH, Bolam JP (2004). Subcellular localization of GABAB receptor subunits in rat globus pallidus. J Comp Neurol 474:340–352. [DOI] [PubMed] [Google Scholar]
- Cooper AJ, Stanford IM (2001). Dopamine D2 receptor mediated presynaptic inhibition of striatopallidal GABAA IPSCs in vitro. Neuropharmacology 41:62–71. [DOI] [PubMed] [Google Scholar]
- Filion M, Tremblay L (1991). Abnormal spontaneous activity of globus pallidus neurons in monkeys with MPTP-induced parkinsonism. Brain Res 547:142–151. [PubMed] [Google Scholar]
- Galvan A, Villalba RM, West SM, Maidment NT, Ackerson LC, Smith Y, Wichmann T (2005). GABAergic modulation of the activity of globus pallidus neurons in primates: in vivo analysis of the functions of GABA receptors and GABA transporters. J Neurophysiol 94:990–1000. [DOI] [PubMed] [Google Scholar]
- Hallworth NE, Bevan MD (2005). Globus pallidus neurons dynamically regulate the activity pattern of subthalamic nucleus neurons through the frequency-dependent activation of postsynaptic GABAA and GABAB receptors. J Neurosci 25:6304–6315. [DOI] [PMC free article] [PubMed] [Google Scholar]
- Hanson JE, Smith Y, Jaeger D (2004). Sodium channels and dendritic spike initiation at excitatory synapses in globus pallidus neurons. J Neurosci 24:329–340. [DOI] [PMC free article] [PubMed] [Google Scholar]
- Hashimoto K, Kita H (2002). Serotoninergic modulation of membrane properties and synaptic transmissions in rat globus pallidus. Soc Neurosci Abstr 28:359–5. [Google Scholar]
- Hashimoto K, Matsui T, Kita H (2001). Dopaminergic modulation on membrane properties and excitatory synaptic transmissions in rat globus pallidus. Soc Neurosci Abstr 27:290–1. [Google Scholar]
- Johnston T, Duty S (2003). Changes in GABAB receptor mRNA expression in the rodent basal ganglia and thalamus following lesion of the nigrostriatal pathway. Neuroscience 120:1027–1035. [DOI] [PubMed] [Google Scholar]
- Kaneda K, Kita H (2005). Synaptically released GABA activates both pre- and postsynaptic GABAB receptors in the rat globus pallidus. J Neurophysiol 94:1104–1114. [DOI] [PubMed] [Google Scholar]
- Kita H (1992). Responses of globus pallidus neurons to cortical stimulation: intracellular study in the rat. Brain Res 589:84–90. [DOI] [PubMed] [Google Scholar]
- Kita H (1993). GABAergic circuits of the striatum. Prog Brain Res 99:51–72. [DOI] [PubMed] [Google Scholar]
- Kita H (1994). Parvalbumin-immunopositive neurons in rat globus pallidus: a light and electron microscopic study. Brain Res 657:31–41. [DOI] [PubMed] [Google Scholar]
- Kita H, Kitai ST (1991). Intracellular study of rat globus pallidus neurons: membrane properties and responses to neostriatal, subthalamic and nigral stimulation. Brain Res 564:296–305. [DOI] [PubMed] [Google Scholar]
- Kita H, Kitai ST (1994). The morphology of globus pallidus projection neurons in the rat: an intracellular staining study. Brain Res 636:308–319. [DOI] [PubMed] [Google Scholar]
- Kita H, Tokuno H, Nambu A (1999). Monkey globus pallidus external segment neurons projecting to the neostriatum. NeuroReport 10:1467–1472. [DOI] [PubMed] [Google Scholar]
- Kita H, Nambu A, Kaneda K, Tachibana Y, Takada M (2004). Role of ionotropic glutamatergic and GABAergic inputs on the firing activity of neurons in the external pallidum in awake monkeys. J Neurophysiol 92:3069–3084. [DOI] [PubMed] [Google Scholar]
- Kita H, Tachibana Y, Nambu A, Chiken S (2005). Balance of monosynaptic excitatory and disynaptic inhibitory responses of the globus pallidus induced after stimulation of the subthalamic nucleus in the monkey. J Neurosci 25:8611–8619. [DOI] [PMC free article] [PubMed] [Google Scholar]
- Legendy CR, Salcman M (1985). Bursts and recurrences of bursts in the spike trains of spontaneously active striate cortex neurons. J Neurophysiol 53:926–939. [DOI] [PubMed] [Google Scholar]
- Lenz FA, Suarez JI, Metman LV, Reich SG, Karp BI, Hallett M, Rowland LH, Dougherty PM (1998). Pallidal activity during dystonia: somatosensory reorganisation and changes with severity. J Neurol Neurosurg Psychiatry 65:767–770. [DOI] [PMC free article] [PubMed] [Google Scholar]
- Mano N, Yamamoto K (1978). Automatic and reliable discrimination between simple and complex spikes of a cerebellar Pukinje cell. In: Integrative control functions of the brain (Ito M, Tsukahara N, Kubota K, Yagi K, eds) Vol 1: pp. 212–214. Tokyo: Kodansha. [Google Scholar]
- Nakanishi H, Kita H, Kitai ST (1990). Intracellular study of rat entopeduncular nucleus neurons in an in vitro slice preparation: electrical membrane properties. Brain Res 527:81–88. [DOI] [PubMed] [Google Scholar]
- Nakanishi H, Kita H, Kitai ST (1991). Intracellular study of rat entopeduncular nucleus neurons in an in vitro slice preparation: response to subthalamic stimulation. Brain Res 549:285–291. [DOI] [PubMed] [Google Scholar]
- Nambu A, Llinás R (1994). Electrophysiology of globus pallidus neurons in vitro. J Neurophysiol 72:1127–1139. [DOI] [PubMed] [Google Scholar]
- Nambu A, Tokuno H, Hamada I, Kita H, Imanishi M, Akazawa T, Ikeuchi Y, Hasegawa N (2000). Excitatory cortical inputs to pallidal neurons via the subthalamic nucleus in the monkey. J Neurophysiol 84:289–300. [DOI] [PubMed] [Google Scholar]
- Nambu A, Kaneda K, Tokuno H, Takada M (2002). Organization of corticostriatal motor inputs in monkey putamen. J Neurophysiol 88:1830–1842. [DOI] [PubMed] [Google Scholar]
- Nini A, Feingold A, Slovin H, Bergman H (1995). Neurons in the globus pallidus do not show correlated activity in the normal monkey, but phase-locked oscillations appear in the MPTP model of parkinsonism. J Neurophysiol 74:1800–1805. [DOI] [PubMed] [Google Scholar]
- Ogura M, Kita H (2000). Dynorphin exerts both postsynaptic and presynaptic effects in the globus pallidus of the rat. J Neurophysiol 83:3366–3376. [DOI] [PubMed] [Google Scholar]
- Ohye C, Le Gayader C, Feger J (1976). Responses of subthalamic and pallidal neurons to striatal stimulation: an extracellular study on awake monkeys. Brain Res 111:241–252. [DOI] [PubMed] [Google Scholar]
- Pan HS, Walters JR (1988). Unilateral lesion of the nigrostriatal pathway decreases the firing rate and alters the firing pattern of globus pallidus neurons in the rat. Synapse 2:650–656. [DOI] [PubMed] [Google Scholar]
- Parent A, Hazrati LN (1995). Functional anatomy of the basal ganglia. II. The place of subthalamic nucleus and external pallidum in basal ganglia circuitry. Brain Res Brain Res Rev 20:128–154. [DOI] [PubMed] [Google Scholar]
- Parent M, Levesque M, Parent A (1999). The pallidofugal projection system in primates: evidence for neurons branching ipsilaterally and contralaterally to the thalamus and brainstem. J Chem Neuroanat 16:153–165. [DOI] [PubMed] [Google Scholar]
- Radnikow G, Misgeld U (1998). Dopamine D1 receptors facilitate GABAA synaptic currents in the rat substantia nigra pars reticulata. J Neurosci 18:2009–2016. [DOI] [PMC free article] [PubMed] [Google Scholar]
- Robledo P, Feger J (1990). Excitatory influence of rat subthalamic nucleus to substantia nigra pars reticulata and the pallidal complex: electrophysiological data. Brain Res 518:47–54. [DOI] [PubMed] [Google Scholar]
- Shink E, Smith Y (1995). Differential synaptic innervation of neurons in the internal and external segments of the globus pallidus by the GABA- and glutamate- containing terminals in the squirrel monkey. J Comp Neurol 358:119–141. [DOI] [PubMed] [Google Scholar]
- Stanford IM, Cooper AJ (1999). Presynaptic μ and δ opioid receptor modulation of GABAA IPSCs in the rat globus pallidus in vitro. J Neurosci 19:4796–4803. [DOI] [PMC free article] [PubMed] [Google Scholar]
- Sterio D, Beric A, Dogali M, Fazzini E, Alfaro G, Devinsky O (1994). Neurophysiological properties of pallidal neurons in Parkinson's disease. Ann Neurol 35:586–591. [DOI] [PubMed] [Google Scholar]
- Tremblay L, Filion M (1989). Responses of pallidal neurons to striatal stimulation in intact waking monkeys. Brain Res 498:1–16. [DOI] [PubMed] [Google Scholar]
- Tremblay L, Filion M, Bedard PJ (1989). Responses of pallidal neurons to striatal stimulation in monkeys with MPTP-induced parkinsonism. Brain Res 498:17–33. [DOI] [PubMed] [Google Scholar]
- Vitek JL, Chockkan V, Zhang JY, Kaneoke Y, Evatt M, DeLong MR, Triche S, Mewes K, Hashimoto T, Bakay RA (1999). Neuronal activity in the basal ganglia in patients with generalized dystonia and hemiballismus. Ann Neurol 46:22–35. [DOI] [PubMed] [Google Scholar]
- Wichmann T, Soares J (2006). Neuronal firing before and after burst discharges in the monkey basal ganglia is predictably patterned in the normal state and altered in parkinsonism. J Neurophysiol 95:2120–2133. [DOI] [PubMed] [Google Scholar]
- Yoshida S, Nambu A, Jinnai K (1993). The distribution of the globus pallidus neurons with input from various cortical areas in the monkeys. Brain Res 611:170–174. [DOI] [PubMed] [Google Scholar]