

Abstract
Magnetic resonance imaging and computer image analysis in human clinical studies effectively identify abnormal neuroanatomy in disease populations. As more mouse models of neurological disorders are discovered, such an approach may prove useful for translational studies. Here, we demonstrate the effectiveness of a similar strategy for mouse neuroscience studies by phenotyping mice with the cerebellar deficient folia (cdf) mutation. Using in vivo multiple-mouse magnetic resonance imaging for increased throughput, we imaged groups of cdf mutant, heterozygous, and wild-type mice and made an atlas-based segmentation of the structures in 15 individual brains. We then performed computer automated volume measurements on the structures. We found a reduced cerebellar volume in the cdf mutants, which was expected, but we also found a new phenotype in the inferior colliculus and the olfactory bulbs. Subsequent local histology revealed additional cytoarchitectural abnormalities in the olfactory bulbs. This demonstrates the utility of anatomical magnetic resonance imaging and semiautomated image analysis for detecting abnormal neuroarchitecture in mutant mice.
Keywords: mice, imaging, cytoarchitecture, cerebellum, hippocampus, inferior colliculus
Introduction
Mouse mutants are valuable to the understanding of brain development, structure, and function, and as models of human neurological diseases. Historically, the effects of genetics on brain structure have been detected and measured from gross morphology and histology, whereas effects on function have been revealed through electrophysiology. Too, behavioral studies have provided a wide repertoire of assays for identifying human disease models in the mouse (Bucan and Abel, 2002). Recently, several human brain mapping techniques, including magnetic resonance imaging (MRI) (Natt et al., 2002; Redwine et al., 2003; Cyr et al., 2005), electrical encephalography (Weiergraber et al., 2005), and functional MRI (Ahrens and Dubowitz, 2001) have expanded to live mice, providing more extensive phenotyping capability.
MRI is advantageous for phenotyping because it can cover the whole brain, allowing for live imaging with an isotropic resolution approaching 100 μm (Natt et al., 2002; Nieman et al., 2005). This can identify abnormal brain morphology and disease at the level of gross brain structure. Finer nuclei and white matter tracts can be visualized by imaging fixed brains at a resolution as fine as 47 μm (Ma et al., 2005), although specimen preparation and fixation lead to structural artifacts, and the benefits of using an in vivo technique for phenotyping are lost. Ultimately, the underlying cytoarchitecture must still be examined with histology because MRI lacks the fidelity to resolve detail at the cellular level.
Because magnetic resonance (MR) images are digital, quantitative data can be readily extracted from inbred mouse strains (Chen et al., 2006). Many mice are needed in such studies to generate meaningful statistics, but their numbers are usually limited because high-resolution three-dimensional (3D) images take hours to acquire, even with dedicated small-animal MRIs. We overcome this limitation by using multiple-mouse MRI (MMMRI), which currently allows us to image seven live mice at once (Bock et al., 2005). Each MR image of the brain contains on the order of 106 volume elements (or voxels), and this tremendous amount of data must be condensed to useful measurements and statistics, a challenge that has been met in human neuroimaging with sophisticated image analysis techniques (Watkins et al., 2001). The purpose of this work is to apply semiautomated human neuroimaging techniques to derive strong brain structure volume statistics to further phenotype the cerebellar deficient folia (cdf) mutant mouse that has previously been characterized only by traditional histological methods. Mice that are homozygous for the cdf mutation have a deletion that truncates the Catna2 gene encoding αN-catenin, a protein that links the classical cadherins to the neuronal cytoskeleton. This produces cerebellar hypoplasia and abnormal lobulation of the cerebellum (Beierbach et al., 2001; Park et al., 2002a,b). As well, there is an abnormal organization of pyramidal cells in the hippocampus (Park et al., 2002a). We seek to determine whether these cytoarchitectural changes manifest as volume changes on MRI. As well, we investigate the volumes of additional brain structures that were revealed to have a high variation in structure between the wild-type and cdf/cdf mutant mouse groups during the image registration. In doing so, we find additional phenotypes, not previously detected.
Materials and Methods
Mice.
cdf/cdf mutant mice (n = 5), cdf/+ heterozygous mice (n = 5), and +/+ wild-type mice (n = 5) on an inbred C3H/HeSnJ background were bred at The Jackson Laboratory (Bar Harbor, ME) and Mount Sinai Hospital (Toronto, Canada) and examined at ∼11 weeks old. The mice were not sex-matched. All of the animal experiments were accepted by the animal ethics committees of The Hospital for Sick Children (Toronto, Canada) and Mount Sinai Hospital, and the animal care and use committee at The Jackson Laboratory.
Imaging.
The mice were injected intraperitoneally with 20 mg/kg MnCl2 48 h before imaging. Mn2+ is a Ca2+ analog and is taken up in brain regions with a high density of functioning neurons where it acts as a positive MRI contrast agent (Lin and Koretsky, 1997). The actual enhancement pattern of Mn2+ in the brain has been shown to be independent of the mode of administration of MnCl2 (Kuo et al., 2005); thus, MnCl2 was injected intraperitoneally to reduce its toxicity by avoiding a bolus of Mn2+ ions from reaching the heart. The mice were imaged on a 7 Tesla MRI scanner (Varian, Palo Alto, CA) outfitted for MMMRI on seven mice at once. They were induced with 4% isoflurane in pure O2 and anesthetized during imaging with 1% isoflurane in pure O2. Body temperature was maintained at 37°C with flowing warm air heated to an ambient temperature of ∼30°C. A 3D T1-weighted spin-echo pulse sequence (repetition time, 300 ms; echo time, 10 ms) imaged the mice with two repeat acquisitions for a total time of 2 h and 45 min. The number of voxels along the brain in the cranial–caudal direction was 256, covering a length of 4 cm and the number of voxels in each of the two transverse directions was 128, covering a length of 2 cm. This produced a 3D image of the mouse brain with an isotropic resolution of 156 μm.
Image postprocessing.
To prevent a data backlog, the acquired MRI data were reconstructed into 3D images using an SGI Origin 2000 with 32 CPUs and 32 gigabytes of RAM (Silicon Graphics, Mountain View, CA). An average atlas image was created that contained the common image information in the five brains from each genotype. This atlas was not a simple summation of the five 3D images, but was created in a common coordinate space using registration techniques. First, the images were registered using a 12-parameter affine registration (Woods et al., 1998) that removed postural and global size differences between the individual brains. Next, the images were nonlinearly registered using the multiresolution, multiscale ANIMAL algorithm (Collins and Evans, 1997). This ensured that the internal structures of the brains were deformed into a common coordinate space (for example, the hippocampus of each mouse was in the same location). The common coordinate space was initially defined by positioning one of the wild-type brain MR images in the orientation seen in standard histological atlases. The result of this registration was a single 3D atlas image for each genotype that provided an unbiased representation of the brains of the five mice and five associated deformation fields, vector fields that recorded the magnitude and direction required to deform each point in an individual mouse’s image to the atlas image (Kovacevic et al., 2004).
The average mutant atlas was also registered to the average wild-type atlas to produce an additional deformation field. This deformation field was visualized as the magnitude of the displacement vector at each voxel location. The structures of the brain containing large displacements (>300 μm) needed to register the mutant to the wild-type average atlas were segmented to investigate possible abnormal neuroanatomy. As well, the hippocampus was segmented because it had been identified in previous studies as having abnormal cytoarchitecture. The average atlas image of the five wild-type mice was used for these segmentations. This was done by manually painting over regions of the 3D atlas using image analysis software (Amira; TGS, San Diego, CA) guided by a traditional textbook atlas as an anatomical reference (Hof, 2000). Each structure was painted in its preferred 2D image orientation, and touched up in the other perpendicular axes to best capture its three dimensionality. This produced an additional 3D image containing voxels carrying the labels of the segmented structures that could be superimposed on the MR atlas image. The label image of the average wild-type atlas was then nonlinearly registered and superimposed on the heterozygote and mutant average atlases, and the resulting target segmentations were confirmed and adjusted as needed by visual inspection. Finally, the deformation field for each mouse was used to inversely transform the label image from each of the average atlases back onto its original individual five MR images.
Statistical analysis of volumes.
The number of labeled voxels for each segmented brain region was counted in Amira to calculate the volume of each structure for each individual mouse. The volumes of structures between the groups of wild-type, heterozygote, and cdf/cdf mice were compared using a two-sided Student’s t test.
Histology.
Mice were anesthetized with tribromethanol and intracardially perfused with PBS followed by Bouin’s fixative. After overnight incubation, tissue was processed for paraffin embedding. Brains were serially sectioned (7 μm) on the coronal plane and tissue sections were stained with hematoxylin and eosin (H&E).
Results
The 3D MR images of +/+, cdf/+, cdf/cdf (n = 5 for each genotype) with the MMMRI had an isotropic resolution of 156 μm, a signal-to-noise ratio (SNR) in the cortex of 33 ± 7 (mean ± SD; n = 15) and were without detectable artifacts; thus, they were suitable for registration. Figure 1 shows the results of the image registration for the five wild-type mice. The top row of images shows slices at about the same level in each mouse taken from the acquired 3D MR images. It is difficult to compare brain anatomy because there are small postural and even smaller morphological differences between the mice in these images. In the middle left of the figure, however, the brains are registered to form an average atlas image, which has two advantages over the acquired images: (1) it is of a higher SNR than any of the individual input images because of averaging (Holmes et al., 1998) and (2) the brain is shown in an orientation that is close to standard histological atlases. This makes it ideal for visually comparing structures between groups of mice and manually painting brain structures, as illustrated in the middle right of the figure. Finally, the bottom of the figure shows the labels after they have been transformed back onto the individual images. These images are not affected by the registration and represent the brains in their true in vivo conformation, which is ideal for making statistical comparisons of brain structures. A close inspection shows that the labeling is slightly different in each image because it reflects discrepancies in the slice plane in each mouse caused by its posture and morphology. The semiautomated image registration technique we used requires that the relative image intensities in anatomical structures between the wild-type, heterozygous, and mutant mice are similar. In our study, the pattern of Mn2+ distribution was qualitatively the same across all the mice. If the distribution had differed in the brains of the mutant mice, however, the registration may have failed and we would have needed to investigate the affected region manually.
Figure 1.
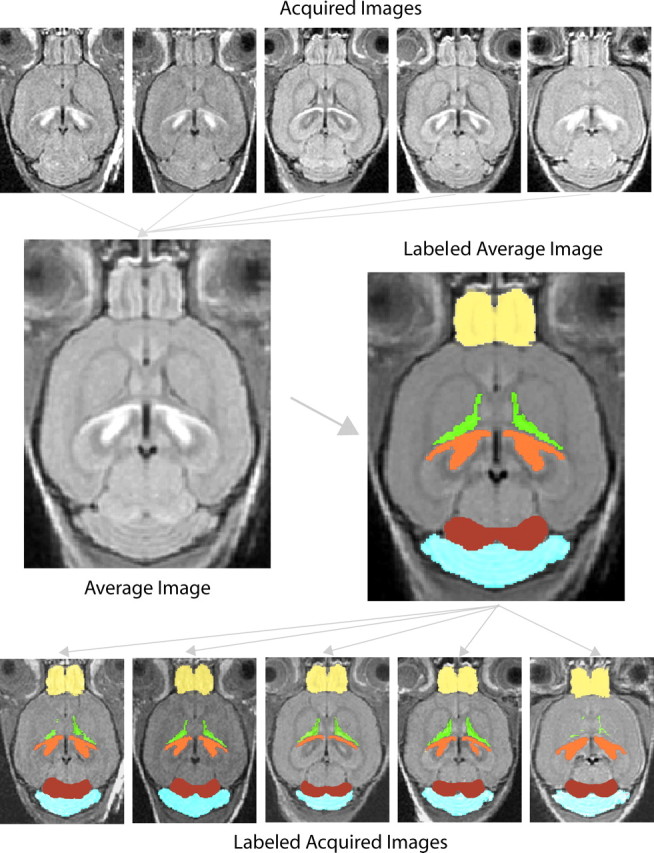
Image registration and labeling. Top, Five wild-type brain images acquired from the MRI. Middle, The average wild-type atlas image superimposed with manual labeling. Bottom, The original acquired images superimposed with automatic labeling. Yellow, Olfactory bulbs; green, lateral ventricles; orange, hippocampus; red, inferior colliculus; blue, cerebellum.
Figure 2 shows a 3D segmentation of the average atlases with labeling for the wild-type and mutant mice in a volume-rendered presentation that makes it easier to compare the overall size and shape of structures between the two phenotypes. Figure 3 shows the volumes of the brain structures that were labeled in the five individual images each from the wild-type, heterozygote, and cdf/cdf mutants. Overall, the brains of the mutant mice were slightly smaller (by 5%) than the brains of the wild-type mice. The cerebellum, however, was significantly smaller (by 18%) in the cdf/cdf mutants, consistent with previous reports of cerebellar hypoplasia in mutant mice. We did not detect a significant volume change in the hippocampus in the mutant mice from the MRI. Although our segmentation of the hippocampus did not include the CA1 subfield because it did not enhance strongly with manganese on the MR images, we did include the CA2 and CA3 subfields of the hippocampus, which had previously been shown to have disorganized pyramidal cells on histology.
Figure 2.

Three-dimensional brain structure comparison. Volume renderings of the wild-type average atlas (left) and the cdf/cdf mutant average atlas (right). Large shape and volume differences are seen in the cerebellum and ventricular system of the cdf mutant mouse, whereas there is a subtle visible reduction in the volume of the inferior colliculus and olfactory bulbs.
Figure 3.

Brain structure volume measurements (mean ± SEM; n = 5). Significant findings are reported at the *p ≤ 0.05 level and the **p ≤ 0.001 level.
The 3D segmentation of the average atlases also revealed new and unexpected differences in the phenotype of the cdf/cdf mutants. The inferior colliculi in the mutant mice are 38% smaller and the olfactory bulbs in the mutants are 14% smaller than in the wild types. Figure 4 compares slices from the MRI average atlases and histology sections for these structures.
Figure 4.

Comparative MRI and histology in the inferior colliculus and olfactory bulbs. a, Slices at the inferior colliculus from the wild-type and cdf/cdf average MRI atlases. b, Corresponding H&E-stained sections. c, Slices at the olfactory bulb from the from the wild-type and cdf/cdf average MRI atlases. d, Corresponding H&E sections. e, Enlarged view of the H&E sections. GCL, Granule cell layer; IPL, internal plexiform layer; MCL, mitral cell layer; EPL, external plexiform layer; GL, glomerular layer. Note that the IPL is absent in the cdf/cdf mutant. Scale bars, 1 mm.
The size of the inferior colliculus in the cdf/cdf mutant is clearly smaller in both the MRI and the histology, although the cytoarchitecture appears normal. The volume reduction in the olfactory bulbs in the cdf/cdf mutant is not evident on either the MRI slices or in the histological sections (where the olfactory bulbs are distorted), which shows the added sensitivity of using volume measurements from 3D MRI data to detect abnormalities. The cytoarchitecture in the olfactory bulbs of the cdf/cdf mutant is, however, visibly disrupted in the histology (there is a lamination defect and the mice lack a clearly defined internal plexiform layer).
Overall, the total ventricular volume was increased by 30% because of an enlargement of the fourth ventricle around the smaller cerebellum in the mutant mice and the appearance of the third ventricle (which is not present in the wild-type C3H mice) toward the base of the brain. Finally, the volumes of structures in the heterozygote mice were statistically identical with those in the wild-type mice at the p ≤ 0.05 level. It was interesting to note, however, that there was higher statistical variation in those volumes and their values tended to lie between the wild-type and cdf/cdf values.
Discussion
The purpose of this study was to demonstrate the utility of MRI and semiautomated image analysis techniques in phenotyping a mutant mouse based on brain structure volume measurements. Our analysis identified and confirmed a known abnormality in the cdf/cdf mutant mouse and revealed entirely new neuroanatomical differences.
Volume analysis is an intuitive place to begin for analyzing phenotypes because it can relate to underlying cellular changes such as atrophy, hyperplasia, and developmental defects (Cyr et al., 2005). We confirmed the known cerebellar defect using the volume measurements, which demonstrates the utility of MRI for phenotypic screening. We did not detect the hippocampal defect using our technique, because the pyramidal cell ectopia in the CA2 and CA3 subfields did not result in a detectable volume change. This shows that, at a diagnostically comparable resolution to human MRI, a change at the cellular level may not manifest in a volume change in gross brain structure in the mouse; thus, multiple methods should be used for comprehensive phenotyping. Many studies in human patients with diseases such as schizophrenia have hypothesized that a change in the ventricular volume in the brain can indicate undetectable changes in the structure of other regions (Styner et al., 2005). We have clearly shown the coexistence of ventricular volume changes with structural abnormalities in the cdf/cdf brain.
Our brain structure volume analysis also described new abnormalities in the inferior colliculus and the olfactory bulbs of mice homozygous for the cdf mutation. The cause of the volume reduction in the cdf/cdf inferior colliculus is currently unknown because the cytoarchitecture appears normal. Thus, MRI provides additional phenotypic differences that cannot be appreciated on histology. The cause of the volume reduction in the olfactory bulbs is most likely directly related to the lamination defect, which we identified on histology. This finding is consistent with the normal role of αN-catenin and cadherins in guiding neurons to form laminar structures in the brain.
Although there have been numerous studies in humans comparing the volumes of brain structures between healthy and diseased populations, such analysis in mice is just beginning. We have shown that MRI can sensitively detect abnormalities in the volumes of structures across the whole mouse brain and that this type of phenotyping can detect underlying changes in cellular structure with follow-up histology. Because serial sectioning is time-consuming, the whole brain is not usually completely sectioned and examined for its cytoarchitectural phenotype. Three-dimensional MRI and manual segmentation can prove time-consuming as well, but our phenotyping method is much more practical than the techniques that are usually used in mice, because MMMRI affords us a sevenfold increase in MRI throughput and because we manually paint the structures only once in the wild-type average atlas, instead of in every mouse brain image that we collect. Because manually labeling a mouse MRI brain image takes many hours, using an automatic image registration technique to propagate labels to multiple brains represents a significant acceleration in the data analysis. Phenotyping using this method will improve as MR image resolution is increased and different contrast mechanisms are used to better delineate detailed structures in the mouse brain. As more detailed images become available, it will be important to screen the entire brain for abnormalities based on information in the deformation field from the image registration.
The combination of high-throughput MMMRI and image analysis techniques brings mouse neuroscience closer to human neuroscience and will enable strong translational phenotyping studies in the future.
This work is part of the Mouse Imaging Centre at the Hospital for Sick Children and the University of Toronto with infrastructure funded by the Canada Foundation for Innovation and Ontario Innovation Trust and research funded by an Ontario Research and Development Challenge Fund grant to the Ontario Consortium for Small Animal Imaging. S.L.A. is an investigator at the Howard Hughes Institute; her work was supported by National Institutes of Health Grant NS35900. We thank Lori Davidson, Leslie Marquis, and Christopher Anderson for their technical assistance.
References
- Ahrens ET, Dubowitz DJ (2001). Peripheral somatosensory fMRI in mouse at 11.7 T. NMR Biomed 14:318–324. [DOI] [PubMed] [Google Scholar]
- Beierbach E, Park C, Ackerman SL, Goldowitz D, Hawkes R (2001). Abnormal dispersion of a purkinje cell subset in the mouse mutant cerebellar deficient folia (cdf). J Comp Neurol 436:42–51. [PubMed] [Google Scholar]
- Bock NA, Nieman BJ, Bishop JB, Mark Henkelman R (2005). In vivo multiple-mouse MRI at 7 Tesla. Magn Reson Med 54:1311–1316. [DOI] [PubMed] [Google Scholar]
- Bucan M, Abel T (2002). The mouse: genetics meets behaviour. Nat Rev Genet 3:114–123. [DOI] [PubMed] [Google Scholar]
- Chen XJ, Kovacevic N, Lobaugh NJ, Sled JG, Henkelman RM, Henderson JT (2006). Neuroanatomical differences between mouse strains as shown by high-resolution 3D MRI. NeuroImage 29:99–105. [DOI] [PubMed] [Google Scholar]
- Collins DL, Evans AC (1997). ANIMAL: validation and applications of non-linear registration based segmentation. Int J Pattern Recogn 11:1271–1294. [Google Scholar]
- Cyr M, Caron MG, Johnson GA, Laakso A (2005). Magnetic resonance imaging at microscopic resolution reveals subtle morphological changes in a mouse model of dopaminergic hyperfunction. NeuroImage 26:83–90. [DOI] [PubMed] [Google Scholar]
- Hof PR (2000). In: Comparative cytoarchitectonic atlas of the C57BL/6 and 129/Sv mouse brains New York: Elsevier.
- Holmes CJ, Hoge R, Collins L, Woods R, Toga AW, Evans AC (1998). Enhancement of MR images using registration for signal averaging. J Comput Assist Tomogr 22:324–333. [DOI] [PubMed] [Google Scholar]
- Kovacevic N, Henderson JT, Chan E, Lifshitz N, Bishop J, Evans AC, Henkelman RM, Chen XJ (2004). A three-dimensional MRI atlas of the mouse brain with estimates of the average and variability. Cereb Cortex 15:639–645. [DOI] [PubMed] [Google Scholar]
- Kuo Y, Herlihy AH, So P, Bhakoo KK, Bell JD (2005). In vivo measurements of T1 relaxation times in mouse brain associated with different modes of systemic administration of manganese chloride. J Magn Reson Imaging 21:334–339. [DOI] [PubMed] [Google Scholar]
- Lin YJ, Korestsky AP (1997). Manganese ion enhances T1-weighted MRI during brain activation: an approach to direct imaging of brain function. Magn Reson Med 38:378–388. [DOI] [PubMed] [Google Scholar]
- Ma Y, Hof PR, Grant SC, Blackband SJ, Bennett R, Slatest L, McGuigan MD, Benveniste H (2005). A three-dimensional digital atlas database of the adult C57BL/6J mouse brain by magnetic resonance microscopy. Neuroscience 135:1203–1215. [DOI] [PubMed] [Google Scholar]
- Natt O, Watanabe T, Boretius S, Radulovic J, Frahm J, Michaelis T (2002). High-resolution 3D MRI of mouse brain reveals small cerebral structures in vivo. J Neurosci Methods 120:203–209. [DOI] [PubMed] [Google Scholar]
- Nieman BJ, Bock NA, Bishop J, Sled JG, Josette Chen X, Mark Henkelman R (2005). Fast spin-echo for multiple mouse magnetic resonance phenotyping. Magn Reson Med 54:532–537. [DOI] [PubMed] [Google Scholar]
- Park C, Finger JH, Cooper JA, Ackerman SL (2002a). The cerebellar deficient folia (cdf) gene acts intrinsically in Purkinje cell migrations. Genesis 32:32–41. [DOI] [PubMed] [Google Scholar]
- Park C, Falls W, Finger JH, Longo-Guess CM, Ackerman SL (2002b). Deletion in Catna2, encoding alpha N-catenin, causes cerebellar and hippocampal lamination defects and impaired startle modulation. Nat Genet 31:279–284. [DOI] [PubMed] [Google Scholar]
- Redwine JM, Kosofsky B, Jacobs RE, Games D, Reilly JF, Morrison JH, Young WG, Bloom FE (2003). Dentate gyrus volume is reduced before onset of plaque formation in PDAPP mice: a magnetic resonance microscopy and stereologic analysis. Proc Natl Acad Sci USA 100:1381–1386. [DOI] [PMC free article] [PubMed] [Google Scholar]
- Styner M, Lieberman JA, McClure RK, Weinburger DR, Jones DW, Gerig G (2005). Morphometric analysis of lateral ventricles in schizophrenia and healthy controls regarding genetic and disease-specific factors. Proc Natl Acad Sci USA 102:4872–4877. [DOI] [PMC free article] [PubMed] [Google Scholar]
- Watkins KE, Paus T, Lerch JP, Zijdenbos A, Collins DL, Neelin P, Taylor J, Worsley KJ, Evans AC (2001). Structural asymmetries in the human brain: a voxel-based statistical analysis of 142 MRI scans. Cereb Cortex 11:868–877. [DOI] [PubMed] [Google Scholar]
- Weiergraber M, Henry M, Hescheler J, Smyth N, Schneider T (2005). Electrocorticographic and deep intracerebral EEG recording in mice using a telemetry system. Brain Res Brain Res Protoc 14:154–164. [DOI] [PubMed] [Google Scholar]
- Woods RP, Grafton ST, Watson JD, Sicotte NL, Mazziotta JC (1998). Automated image registration: II. Intersubject validation of linear and nonlinear models. J Comput Assist Tomogr 22:153–165. [DOI] [PubMed] [Google Scholar]