

Abstract
CNS abnormalities can be detected during chronic human immunodeficiency virus (HIV) infection, before the development of opportunistic infections or other sequelae of immunodeficiency. However, although end-stage dementia caused by HIV has been linked to the presence of infected and activated macrophages and microglia in the brain, the nature of the changes resulting in the motor and cognitive disorders in the chronic stage is unknown. Using simian immunodeficiency virus-infected rhesus monkeys, we sought the molecular basis for CNS dysfunction. In the chronic stable stage, nearly 2 years after infection, all animals had verified CNS functional abnormalities. Both virus and infiltrating lymphocytes (CD8+ T-cells) were found in the brain. Molecular analysis revealed that the expression of several immune response genes was increased, including CCL5, which has pleiotropic effects on neurons as well as immune cells. CCL5 was significantly upregulated throughout the course of infection, and in the chronic phase was present in the infiltrating lymphocytes. We have identified an altered state of the CNS at an important stage of the viral–host interaction, likely arising to protect against the virus but in the long term leading to damaging processes.
Keywords: HIV, SIV, CCL5, RANTES, CD8, CTL, brain, neuroAIDS, cognitive, gene array
Introduction
Abnormalities of the CNS resulting from human immunodeficiency virus (HIV) infection are usually studied during end-stage disease, when individuals with acquired immunodeficiency syndrome (AIDS) suffer from a range of disorders including HIV-associated dementia (HAD). However, most people living with HIV have a long-term, reasonably asymptomatic, condition before the development of immunodeficiency and the full range of HIV-related complications. Still, throughout this chronic infection, CNS function is often aberrant.
A number of analyses have documented such alterations. Asymptomatic HIV+ patients have been found to be significantly impaired in tests of verbal memory and psychomotor speed (Villa et al., 1993). Other studies have revealed changes or impairment in measures of choice reaction, visuomotor coordination, global attentional performance (Kokkevi et al., 1991), spatial working memory (Sahakian et al., 1995), and fine motor control (Hestad et al., 1993; Stern et al., 2001; Chang et al., 2002).
Even a mild degree of neurocognitive disorder is associated with neuroimaging abnormalities. Magnetic resonance imaging (MRI) studies have found decreased volumes in cortical, limbic, and striatal structures (Jernigan et al., 2005), as well as selective thinning of the cerebral cortex (Thompson et al., 2005). Additionally, functional MRI has revealed increased brain activation in HIV-infected individuals, interpreted as an increased usage of brain reserve capacity to maintain normal cognitive functions (Ernst et al., 2003). In addition, CNS neurophysiological abnormalities have been found in HIV-infected individuals, including abnormalities in the spontaneous encephalogram (EEG) (Gabuzda et al., 1988; Parisi et al., 1989) and changes in brainstem auditory sensory evoked potential latencies (Pagano et al., 1992; Pierelli et al., 1993; Reyes-Contreras et al., 2002).
The analysis of the etiology and pathogenesis of CNS abnormalities in the chronic stage of HIV are quite limited, hampering their analysis. One study had found elevations in major histocompatibility complex class II (MHC-II) and cytokines in the brains of those with chronic HIV infection (An et al., 1996). However, a more accessible window for sampling the CNS in chronic HIV infection is examination of the CSF. In the CSF, increases in IgG, neopterin, and β2-microglobulin (β2M) have been found (McArthur et al., 1988; Bogner et al., 1992), with elevated β2M found to be predictive of development of CNS disorders in asymptomatic HIV-infected individuals (Brew et al., 1996).
Taken as a whole, these studies indicate that, although the period between acute HIV infection and overt AIDS may be reasonably asymptomatic, the CNS undergoes changes that could be progressive and cause additional damage as the disease worsens. Access to human brain tissue during this stage is rarely possible, making determination of the basis for CNS involvement problematic. The simian immunodeficiency virus (SIV)-infected rhesus macaque provides an excellent model for mimicking the CNS abnormalities induced by HIV in humans. Here, we report a longitudinal study of CNS function in SIV-infected rhesus macaques, after which the animals were killed in the stable phase of infection, while still asymptomatic but with demonstrable CNS dysfunction. Molecular analyses of brain tissue was performed to uncover the effect of this chronic infection on the brain.
Materials and Methods
Rhesus macaques.
For these experiments, we used rhesus macaques free from SIV, type D simian retrovirus and Herpes B virus; these animals were obtained from Charles River Laboratories (Key Lois, FL), Labs of Virginia (Yemassee, SC) and Covance (Alice, TX). Experiments were performed with the approval and guidelines of the Animal Care and Use Committee of The Scripps Research Institute. In this study, four monkeys were first trained in the behavioral tests (detailed below), followed by electrophysiological analysis (details to follow) for baseline values. These monkeys were then intravenously inoculated with a cell-free stock of SIVmac182 (Lane et al., 1995; Gaskill et al., 2005). Additional behavioral and electrophysiological analyses were performed during the chronic period of infection, and the subjects were subsequently killed at 92–114 weeks postinoculation (p.i.) (denoted the chronic group). Three of the four monkeys were treated with a CD8 depleting antibody, by a slight modification of the originally described protocol (Schmitz et al., 1999), at either 30 or 66 weeks p.i. (25–61 weeks pretermination), which led to a transient depletion of CD8+ T-cells. This experiment was performed to examine the effect of increasing viral load on behavioral parameters and did not alter disease course compared with untreated infected animals. Viral load rose briefly, and performance on some of the tasks declined temporarily; however, virus and task performance quickly returned to predepletion baseline. Details of such temporary abnormalities were not included in the present study.
Another group of six uninfected animals (control group) did not receive SIV injections but underwent mock inoculation. One monkey from the control group also received a CD8+ T-cell-depleting regime at 16 weeks pretermination. Four additional groups were also investigated in the molecular analysis and are detailed in Table 1 along with the control and chronically infected animals.
Table 1.
Numbers and groupings of monkeys
| Group | Monkey | Day p.i. | Frontal lobe viral load | Signs/symptoms | AIDS pathology |
|---|---|---|---|---|---|
| Control | 298 | NA | NA | None | None |
| 331 | NA | NA | None | None | |
| 332 | NA | NA | None | None | |
| 357 | NA | NA | None | None | |
| 382 | NA | NA | None | None | |
| 393 | NA | NA | None | None | |
| Acute | 335 | 13 | 2711 | Anorexia, rash | None |
| 346 | 13 | 746 | None | None | |
| 347 | 13 | 1239 | Anorexia | None | |
| 430 | 13 | 38,721 | Fever | None | |
| Postacute | 350 | 73 | 178 | None | None |
| 352 | 75 | 264 | None | None | |
| 353 | 77 | 2442 | None | None | |
| 354 | 80 | 161 | None | None | |
| Early chronic | 324 | 270 | 20 | None | None |
| 360 | 183 | 15 | None | None | |
| 387 | 191 | 633 | None | None | |
| 407 | 226 | 64 | None | None | |
| Chronic | 227 | 799 | nd (<5) | None | None |
| 290 | 723 | 207 | None | Lymphoma* | |
| 291 | 641 | 147 | None | None | |
| 304 | 646 | 709 | None | None | |
| SIVE | 383 | 133 | 1,142,004 | Anorexia, diarrhea, edema | SIVE |
| 417 | 56 | 775,060 | Anorexia, lethargy | SIVE | |
| 418 | 82 | 5,777,621 | Anorexia, fever | SIVE | |
| 494 | 105 | 916,066 | Anorexia, lethargy | SIVE |
Monkeys are grouped by stage of infection. Time of sacrifice, viral load in frontal lobe RNA (in viral equivalents per microgram total RNA), prominent clinical signs and symptoms at time of sacrifice, and simian AIDS histopathology are given. NA, Not applicable; nd, not detectable. The asterisk indicates that the incidental B-cell lymphoma found in animal 290 did not involve the CNS.
Terminal anesthesia was performed with ketamine, xylazine, and pentobarbital, followed by extensive intracardiac perfusion with sterile PBS containing 1 U/ml heparin to clear blood-borne cells from the brain tissue. This was followed by necropsy, during which a portion of the frontal lobe (cut coronally with the rostral border 0.5 cm from the frontal pole and the caudal border rostral to the head of the caudate) was taken for RNA extraction for the gene array analysis. Additionally, other regions of the brain were taken for RNA extraction as well as immersed in 10% formalin for histological studies.
Histopathological analysis.
Sections (6 μm) of formalin-fixed, paraffin-embedded tissue were mounted on glass slides, deparaffinized with xylene, hydrated in graded alcohols, and either subjected to hematoxylin and eosin staining (Sigma-Aldrich, St. Louis, MO), immunohistochemical staining, or in situ hybridization (ISH) analysis. Immunohistochemical staining followed a basic indirect protocol, using an antigen retrieval (AR) method (heated to 95°C in the indicated buffer for 45 min and then left for 20 min to steep). Primary antibodies were anti-CD163 (Novocastra, Newcastle-upon-Tyne, UK) and anti-human leukocyte antigen (HLA)-DR (Zymed, San Francisco, CA) mouse monoclonal antibodies (both using citrate buffer for AR), anti-CD8 (Panomics, Fremont, CA), rabbit polyclonal antibody, and anti-RANTES/CCL5 (R&D Systems, Minneapolis, MN) goat polyclonal antibody (both using Tris/Urea buffer for AR). Staining reactions were developed with the NovaRed chromogen (Vector Laboratories, Burlingame, CA), followed by a hematoxylin counterstain. Controls included omission of the primary antibody and use of irrelevant primary antibodies. ISH was performed as described previously using 35S-labeled single-strand RNA probes consisting of a fragment of the SIVmac nef (negative factor) gene (Fox et al., 2000). In addition to the antisense probe hybridization, controls included sense probe hybridization and omission of the probe. Sections were counterstained with methyl green (Vector Laboratories).
Flow cytometry.
Cells were isolated from the brain and stained with a mixture of antibodies as described previously (Marcondes et al., 2001). The antibodies used for the staining were anti-monkey CD3-biotin (Biosource, Camarillo, CA) followed by Streptavidin-PerCP or Streptavidin-APC (BD Biosciences Pharmingen, San Diego, CA), anti-human CD8-PE (Dako, High Wycombe, UK), and anti-human CD4-phycoerythrin (PE) (clone OKT4 hybridoma obtained from the American Type Culture Collection, with the secreted antibody purified and PE-conjugated in our laboratory). Isotype controls (BD Biosciences Pharmingen) were used for controls. The cells were then processed through a FacScan flow cytometer before analysis of data with CellQuest software (BD Biosciences Immunocytometry Systems, San Jose, CA).
Behavioral testing.
Behavior testing was performed, as described previously (Weed et al., 2004), on the four monkeys in the chronic group, with each acting as its own control using preinfection baselines. Briefly, animals were trained to perform four to five behavioral tasks, with baseline measurements being taken for 3 months once performance was stable. Testing was done 4–5 d/week for 1–3 tasks/day. The tasks included self-ordered spatial search, which measures spatial working memory; delayed nonmatching-to-sample, which assesses delayed recognition memory for complex visual stimuli; a reaction time task, which measures psychomotor speed; progressive-ratio schedule of reinforcement, which measures the motivation to work for food, and a bimanual motor skills task, which measures fine motor control and requires coordination of both hands.
For each task, Z-scores were calculated using the mean and SD of the baseline performance to compare measurements obtained during the final 6 months of infection, using Excel software (Microsoft, Redmond, WA). Performance on any task was considered impaired when the Z-score was less than −1.96 for two consecutive months or less than −2.58 for the last month preceding the killing of the animals. These criteria correspond to a 95 and 99% confidence interval around the baseline. The behavioral data on one of the animals reported here (#227) has been published previously (Weed et al., 2004).
Neurophysiology.
Electrophysiology of brainstem auditory evoked potentials (BSAEPs) was performed monthly on ketamine (20 mg/kg)-anesthetized animals as described previously (Prospero-Garcia et al., 1996). Positive waves in BSAEPs were identified and denoted P1, P2a, P2b, P3, P4, and P5. In visual evoked potentials (VEPs) and auditory evoked potentials (AEPs), three positive and three (VEP) or two (AEP) negative waves; respectively; were identified. Average peak latencies were calculated for the six measurements before infection, and the six measurements before termination were then compared between preinfection and pretermination measurements using Student's t test (with Excel software).
RNA extraction.
Total RNA was purified from samples using TRIzol Reagent (Invitrogen, Carlsbad, CA) following the protocol of the manufacturer, with an additional centrifugation step to remove cellular debris. RNA was further purified (RNeasy mini kit; Qiagen, Valencia, CA), and the quantity of total RNA was assessed by 260 nm UV absorption, with quality verified by gel electrophoresis and analysis of the ribosomal RNA bands.
Viral quantitation.
Viral load in brain tissue was determined on RNA, purified as above, using the quantitative branched DNA (bDNA) signal amplification assay performed by Bayer Reference Testing Laboratory (Emeryville, CA), using 25 μg of RNA. In animals killed in the acute stage of infection, three of the four viral load values (excluding monkey #430) have been published previously (Marcondes et al., 2001). Values for the postacute group were also investigated previously in that study; however, the results presented here are a repeated measurement of the tissue RNA using a more sensitive assay than that applied to the previous samples (now allowing the quantification of virus in one sample, which was previously below the limits of detection). Values are also presented for plasma and CSF viral load, taken within 2 weeks of termination.
Gene array analysis.
Total RNA was prepared as described above to synthesize cDNA for use as a template to produce biotinylated cRNA, which was hybridized to duplicate Affymetrix Human U95Av2 GeneChips (Santa Clara, CA) as described previously (Roberts et al., 2003). The gene array data from this study has been deposited in the National Center for Biotechnology Information Gene Expression Omnibus (GEO) database (http://www.ncbi.nlm.nih.gov/projects/geo/). We analyzed these data using guanine cytosine (GC)-robust multiarray analysis (GC-RMA), using GeneSpring 7.0 software (Agilent Technologies, Palo Alto, CA). This was chosen for our cross-species hybridization because Affymetrix Microarray Suite 5.0 analysis, with both positive and mismatch (MM) probes can exaggerate gene variance (Irizarry et al., 2003). Instead, a background adjustment step, which ignores the MMs, was used, thereby sacrificing a small amount of accuracy for a large amount of precision. This procedure was combined with a normalization step across all the chips. Additionally, because nonspecific binding relates to GC content, GC-RMA models the intensity of probe-level data as a function of this GC content (Wu et al., 2005). Differences in expression levels were determined to highlight only upregulated genes as follows: (1) mean normalized signal values (SVs) of the chronic group of at least 10 (to select for a minimum level of expression that could be verified), (2) at least two-fold increase change in mean normalized SV in the chronic group compared with the control group (to select for a level of difference that can be verified between groups), and (3) p < 0.05 using the Wilcoxon–Mann–Whitney U test.
Quantitative reverse transcription (qRT)-PCR.
Specific RNA transcripts were quantified through the use of real-time PCR using dual-labeled hydrolysis probes. The primers and probe sequences selected for use here were designed for rhesus macaque sequences either by reference to previous studies, by the PrimerExpress software (Applied Biosystems, Foster City, CA), or through the Genescript online tool (https://www.genscript.com/ssl-bin/app/primer), and are listed in Table 2. Our protocol for qRT-PCR was described in detail previously (Burudi et al., 2002). To compute the relative amounts of each cytokine mRNA in the samples, the average cycle threshold (Ct) of the primary signal for 18S was subtracted from that for each cytokine to give changes in Ct (dCt). In this manner, the degree of changes in expression (the differences in dCt, or ddCt) are determined, which are log2 relative units. Statistical analysis was done using Student's t test (Excel) or ANOVA plus Tukey's honestly significant difference multiple-range test using Statgraphics software (StatPoint, Herndon, VA).
Table 2.
Sequences of the oligonucleotide primers and probes used in qRT-PCR
| Gene | Forward | Reverse | Probe |
|---|---|---|---|
| β2Ma | gaggctatccagcgtactcc | cagatggatgaaatccagaca | cacgccatccaccagagaatgg |
| CCL5c | accagtggcaagtgctcca | tggcacacacttggcgatt | ccagcagtcgtctttgtcacc |
| GIP3b | cagaaggcggtatcgctttt | gagctctccgagcactctttctt | tgtgctacctgctgctcttcacttgca |
| HLA-DRαa | tctcaagcactgggagtttg | cacccttgatgatgaagacg | cccagggcacacaccacgtt |
| IFITM1a | atagcattcgcctactccgt | agatgttcaggcacttggc | cggtcacgtcgccaaccatc |
| IgGhcb | gggaac(gt/ac)cttctcatgctce | ggctcttctgggtgtagtgg | tgcagagcctcatgcatcacg |
| 18Sd | cggctaccacatccaaggaa | gctggaattaccgcggct | tgctggcaccagacttgccctc |
Primers and probes were designed based on rhesus monkey cDNA sequences and analyzed by
aa web-based program from Genescript,
bPrimerExpress software, or from published studies of
eFor detection of IgGhc, a mixture of two forward primers was used, differing at the bases in parentheses, in order to quantify all three IgG heavy chains.
Results
Chronic SIV infection results in CNS dysfunction
Four rhesus monkeys were injected intravenously with SIVmac182 and studied for CNS functional abnormalities over the course of the resulting chronic infection. Before infection, the animals were trained to perform a variety of tasks to enable investigators to score cognitive and motor functions and then compare behaviors during the 6 months before the animals were killed with those obtained at the preinfection baseline. Once trained, performance on such tasks is stable over time, and performance is markedly abnormal in animals progressing to simian AIDS with SIV encephalitis (Weed et al., 1999, 2003, 2004). In the chronically infected animals studied here, animals were clinically asymptomatic and exhibited stable plasma viral loads. However, all of these infected animals developed significant deficits in bimanual motor skills (Table 3). In addition, three of the four monkeys had other abnormalities; two showed deficits in the self-ordered spatial search task (testing spatial working memory), and the third was slow in reaction release times and in progressive-ratio schedule of reinforcement.
Table 3.
Behavioral testing results
| Monkey | SOSS |
D(N)MS |
Reaction time |
PR | BMS | No. of tasks abnormal | |||
|---|---|---|---|---|---|---|---|---|---|
| Acc | Lat | Acc | Lat | Rel | Move | Lat | |||
| 227 | x | ✓ | x | x | x | x | x | ✓ | 2 of 5 |
| 290 | ✓ | x | x | x | x | x | x | ✓ | 2 of 5 |
| 291 | x | x | x | x | nt | nt | x | ✓ | 1 of 4 |
| 304 | x | x | x | x | ✓ | x | ✓ | ✓ | 3 of 5 |
Animals were trained on a series of behavioral tasks, and their performance was compared for the 6 months before SIV infection and the 6 months before termination. ✓, Statistically significant disruption in task; x, no disruption; nt, not tested; SOSS, self-ordered spatial search; D(N)MS, delayed nonmatching-to-sample; PR, progressive ratio; BMS, bimanual motor skills; Acc, accuracy; Lat, latency; Rel, release; Move, movement.
As a second measure of CNS function, neurophysiological testing was performed to assess sensory evoked potentials. Such measurements are stable over time in uninfected animals but become abnormal relatively early after SIV infection (Horn et al., 1998; Fox et al., 2000). Analysis of BSAEPs revealed significant delays in the P3 (Fig. 1A), P4, and P5 waves of all animals. Because the P1 wave is generated via the auditory nerve, the examination of interpeak latencies (Fig. 1B, P3–P1) reveals that this delay is localized within the CNS. Because delays in the earlier waves, i.e., P3, can slow the later waves, the P4 and P5 changes may not be independent abnormalities, and indeed, examination of the P4-P3 and P5-P3 interpeak latencies did not reveal significant delays, except for the P4-P3 latency in animal #290. Although delays in some of the cortical evoked potentials were found in these animals, there were no consistent changes in VEP or AEP latencies (data not shown). Alterations in the evoked potentials occurred before behavioral changes were evident. Thus, these two independent measures of CNS function were abnormal in these chronically SIV-infected animals.
Figure 1.

BSAEPs. Electrophysiological measurements in the 6 months before infection (Pre) and in the 6 months before termination (SIV) for the individual animals were compared, and mean and SD shown for the (A) P3 wave, and the (B) interpeak latency P3-P1. Values are in milliseconds, and all show statistically significant increases in chronic infection compared with preinfection (p < 0.001). Error bars represent SEM.
SIV and infiltrating immune cells are present in the brain
After necropsy, we evaluated the viral load in the frontal lobe (as presented in Table 1), caudate, midbrain, and cerebellum of the infected monkeys (Fig. 2A) and compared these with plasma and CSF viral loads measured within 2 weeks before the animals were killed. Tissues were extensively perfused to eliminate any contribution from blood. Viral RNA was present in the brains of all four animals. Two monkeys had virus in all five of the areas examined, and the others were positive for virus in four areas of the brain. However, although three of the animals had 104.7–106.1 log10 viral equivalents per milliliter of virus in the plasma and 102.9–103.7 log10 viral equivalents per milliliter of virus in the CSF, no virus was detectable in these fluids in the other animal (#304; limit of detection 102.1 log10 viral equivalents per milliliter). Thus, SIV is present in the brain during the chronic infection period, regardless of levels of peripheral or CSF viremia.
Figure 2.
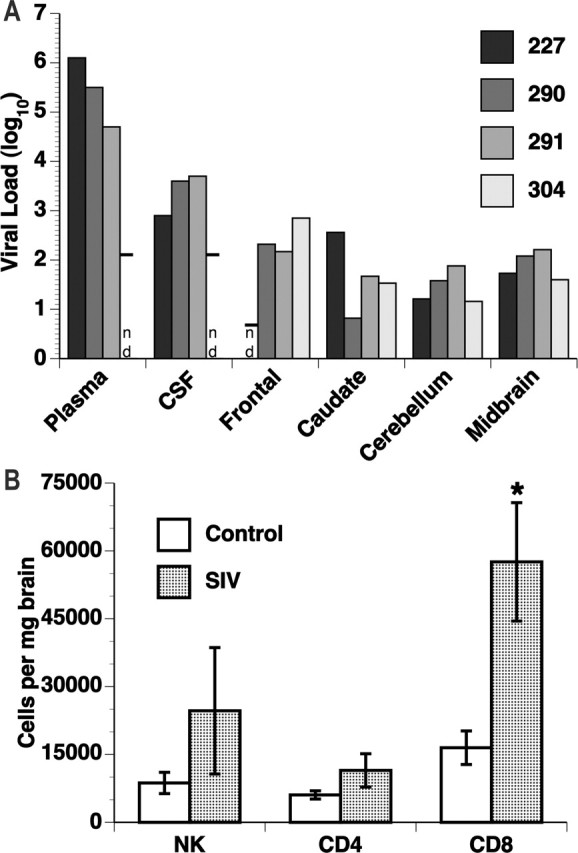
CNS virus and infiltrating immune cells. A, Viral load. Virus quantification was determined by the bDNA assay on samples from chronically SIV-infected rhesus monkeys. For fluids (plasma and CSF), quantitation is viral equivalents per milliliter, and for the brain regions, quantitation is viral equivalents per microgram of total RNA; all values have been log10 transformed. nd, Not detected (or below the limit of detection), with the detection limit shown by the horizontal bar. B, Numbers of infiltrating immune cells were determined by multiplying the number of cells recovered from the brains by the percentage identified by flow cytometry analysis in the indicated subsets. The number of CD8+ T-cells was significantly increased in the chronically infected animals (p < 0.01). Error bars represent SEM.
We had reported previously that, during the postacute stage of infection, a significant number of CD8+ T-cells [cytotoxic T lymphocytes (CTLs)] infiltrate the brains of SIV-infected monkeys. To examine whether the presence of such an infiltrate persists in longer-term infection, lymphoid cells were isolated from the brains of the four chronically infected and six control animals and subjected to flow cytometric analysis (Fig. 2B). Both natural killer (NK) cells and CD4+ T lymphocytes were present but did not differ between the infected and uninfected animals. However, a three-fold increase in the number of CD8+ T lymphocytes could be found in the brains of the chronically infected group relative to the uninfected controls.
SIV infection induces CNS molecular changes
Our previous success in using human oligonucleotide-based gene arrays to identify upregulated genes in the brains of SIV-infected animals, both in the acute and terminal encephalitic stages (Roberts et al., 2003, 2004), prompted us to apply the same methodology to seek transcripts upregulated at least two-fold in this chronic phase over values found in uninfected controls. Table 4 details the mean expression values, SDs, fold-change values and p values for the seven genes found to be increased in the frontal lobe, following our criteria. These were, in order of fold-change values: chemokine (C-C motif) ligand 5 (CCL5) (also known as RANTES); HLA-DRα; immunoglobulin heavy constant gamma 3 (IGHG3) (a constant region of heavy chain of IgG3); G1P3 (also known as interferon α-inducible protein 6–16); interferon-induced transmembrane protein 1 (IFITM1) (also known as 9–27 or Leu 13), HLA-A, and HLA-C.
Table 4.
Upregulated transcripts
| Gene Array |
qRT-PCR |
||||||||||||
|---|---|---|---|---|---|---|---|---|---|---|---|---|---|
| Gene | Control |
Chronic |
Fold | p value | Gene | Control |
Chronic |
Fold | p value | ||||
| Mean | SD | Mean | SD | Mean | SD | Mean | SD | ||||||
| CCL5 | 13.4 | 2.0 | 26.3 | 17.6 | 2.0 | 0.0212 | CCL5 | 7.0 | 0.4 | 11.2 | 0.4 | 18.0 | <0.0001 |
| G1P3 | 5.5 | 0.3 | 11.2 | 6.1 | 2.0 | 0.0464 | G1P3 | 16.4 | 1.1 | 17.8 | 0.3 | 2.7 | 0.0421 |
| HLA-A | 92.3 | 20.2 | 202.2 | 19.7 | 2.2 | 0.0017 | β2M | 17.1 | 0.8 | 18.8 | 0.9 | 3.3 | 0.0146 |
| HLA-C | 14.1 | 2.7 | 31.5 | 16.1 | 2.2 | 0.0017 | |||||||
| HLA-DRα | 9.5 | 1.9 | 22.2 | 12.9 | 2.3 | 0.0212 | HLA-DRα | 11.3 | 1.1 | 14.9 | 1.0 | 11.7 | 0.0008 |
| IFITM1 | 201.1 | 128.8 | 510.1 | 223.8 | 2.5 | 0.0212 | IFITM1 | 14.0 | 0.7 | 15.6 | 1.5 | 3.0 | 0.0464 |
| IGHG3 | 6.4 | 0.2 | 28.1 | 16.5 | 4.4 | 0.0017 | IgGhc | 8.8 | 1.2 | 14.8 | 1.2 | 61.4 | <0.0001 |
Gene transcripts found to be significantly upregulated in the frontal lobe RNA of the chronic group compared to that of the control group. For the U95Av2 gene array, the calculated mean and SD of the SVs, the fold increase in the chronic group, and the p values are given, followed by the values (in dCt, log2 relative units) determined on the same samples by qRT-PCR, the fold increase in the chronic group, and the p values.
To verify these changes and more accurately assess the level of change, we performed qRT-PCR using primers and probes derived from the rhesus monkey sequences for these genes. Transcripts for CCL5, HLA-DRα, IgG heavy chain (IgGhc) (using a mix of primers and a probe recognizing all three heavy chains), G1P3, IFITM1, and, for the HLA class I genes (HLA-A and HLA-C), the expression of β2M, their common light chain, was measured. Relative to the levels found in the frontal lobes of uninfected controls, all six of the tested transcripts were confirmed to be increased during chronic SIV infection (Table 4). Expression of these upregulated genes was also assessed in three noncortical areas of the brain: the caudate, cerebellum, and midbrain. Except for β2M and IFITM1 in the caudate, expression of all of the genes was significantly upregulated in these other regions of the CNS (Fig. 3).
Figure 3.

Upregulation of gene transcripts in other brain regions. Using qRT-PCR, the levels of expression of the genes listed in Table 4 were examined in the caudate (A), cerebellum (B), and midbrain (C). The dCt on the y-axis is a log2 scale. ∗p < 0.05, significantly increased in SIV chronic versus uninfected controls. Error bars represent SEM.
SIV infection progresses through several distinct phases, including (1) the acute phase, which incorporates disease symptoms as well as brain transcriptional changes (Madden et al., 2004; Roberts et al., 2004); (2) the postacute phase, during which the acute phase resolves and a relatively asymptomatic period ensues; (3) an early chronic period, when a steady-state viremia has developed; (4) the chronic phase investigated here, with stable clinical, viral and immune parameters over one and one-half years after infection; and (5) simian AIDS, in which some of the animals exhibit frank neurological symptoms and SIV encephalitis. Using RNA samples from the frontal lobes of animals killed at these three antecedent stages, end-stage SIV, and uninfected control animals, we examined the temporal pattern of changes for six of the genes found to be upregulated in the chronic infection phase.
All of the gene transcripts differed significantly over the stages of infection (Fig. 4). Post hoc testing of the ANOVA revealed distinct groupings. With the exception of G1P3, which peaked during the acute stage, expression of the upregulated genes was highest at end-stage SIV encephalitis (SIVE). Examination of individual genes reveals that CCL5 expression rose sharply in the acute phase, but dropped, although not to control levels, in the postacute stage. The level of CCL5 transcripts then rose at the early chronic and chronic stages and reached its highest level in SIVE. For IgGhc, in contrast, only levels at the chronic and SIVE stages differed significantly from the uninfected control group. β2M and HLA-DRα levels differed significantly from uninfected controls at the acute, chronic, and SIVE stages. The remaining gene transcripts, G1P3 and IFITM1, although differing across the infection stages, were not distinctly different in the chronic stage from the uninfected control condition in this analysis of multiple stages.
Figure 4.

Time course of expression changes. Frontal lobe RNA samples from animals at the indicated stage of infection as in Table 1, labeled Control, Postacute (Post-A), Early Chronic (Early-C), Chronic, and SIVE, were analyzed by qRT-PCR for the individual gene transcripts. The dCt values (log2 scale) for individual animals (filled circles) are shown, along with the group mean (horizontal bar). For each gene transcript, the groups were compared by ANOVA, which indicated significant differences between the stages for all genes (all p < 0.0001 except G1P3 for which p = 0.0002). Tukey's HSD test was used for post hoc analysis to determine homogenous groups, indicated here by the lowercase letters above each group (a, b, c, and/or d). Groups having different letters are significantly different from each other; those sharing a letter are indistinguishable statistically (i.e., those that have two letters are similar to groups with either letter).
Infiltrating immune cells and CCL5 protein expression
Histopathological analysis was performed on the brains to uncover changes associated with chronic, asymptomatic SIV infection. Similar to findings of others at this stage of infection, no distinct neuropathology was found. Immunohistochemical and ISH analysis was performed for verification and additional examination of the viral, immune, and molecular changes found above. In infected animals, although macrophages could be found in a perivascular location (Fig. 5A,B), macrophages infiltrating into the parenchyma were not found. This staining pattern did not differ from that of controls. Some of these perivascular cells also stained for HLA-DR, the product of one of the upregulated genes and a marker of activated microglia, but the staining pattern again did not differ between infected brains and those of controls, and parenchymal microglia did not stain for HLA-DR (data not shown). Productive CNS infection was identified by ISH, with rare SIV-RNA-positive cells in the brains of infected monkeys but not controls. These were localized in a perivascular regions (Fig. 5C). Antibodies to CCL5 reacted with intracytoplasmic structures within lymphoid cells in the brains of infected, but not control, monkeys (Fig. 5D,E). Such cells were found both in perivascular locations and within the brain parenchyma. Examination of serial sections revealed that these lymphoid cells were immunopositive for CD8 (Fig. 5E,F).
Figure 5.

Photomicrographs of CNS pathology studies. A, B, Immunohistochemical staining using anti-CD163, identifying macrophages (animal #227; original magnification 20×). C, In situ hybridization for SIV revealing productively infected cells (animal #290; original magnification 20×). D, E, Immunohistochemical staining using anti-CCL5 identifying its localization within lymphoid cells (animal #304; original magnification 60×). F, Immunohistochemical staining using anti-CD8 of a serial section following the one presented in E, revealing the lymphoid cells to be predominantly CD8+.
Discussion
In this study, we performed a molecular analysis of the brains of four chronically SIV-infected monkeys whose behavioral and electrophysiological abnormalities of the CNS were evident. At this chronic phase of infection, averaging 23 months p.i., all animals had viral RNA in the brain, and transcriptional profiling of the frontal cortex revealed the upregulation of a discrete set of genes. These results signify an altered state of the CNS at a distinct stage of the viral–host interaction and may reflect protective as well as damaging processes.
Previously, we and others have demonstrated functional CNS deficiencies in asymptomatic SIV-infected rhesus monkeys, including abnormalities in sensory evoked potentials, behavioral/cognitive abnormalities, and motor problems (Murray et al., 1992; Prospero-Garcia et al., 1996; Gold et al., 1998; Raymond et al., 1998; Weed et al., 2004). Here, during the chronic period, the functional impairments found with cognitive/motor testing (bimanual motor task in all monkeys, and spatial working memory in two of the four monkeys), as well as abnormalities in the BSAEPs (in all of these SIV-infected monkeys) simulate those found deficient in HIV-infected patients. By using samples from these SIV-infected animals, we believe we can effectively model effects on the brain during chronic HIV infection and examine the basis for the resulting dysfunctions.
The alterations in the latencies of BSAEPs confirm our previous findings in SIV-infected monkeys and extend them to relate these abnormalities to those in the cognitive and motor spheres. Abnormalities in BSAEPs can be early indicators of neurological disruptions and have been reported in HIV infection (Goodin et al., 1990; Pagano et al., 1992; Pierelli et al., 1993; Reyes-Contreras et al., 2002), as well as in other causes of neurodegeneration and dementia including Creutzfeldt-Jakob, Alzheimer's, and a number of childhood neurodegenerative diseases (Chen et al., 1986). Although the exact mechanisms resulting in the electrophysiological alterations induced by SIV, HIV, and the other disorders are unknown, the ability to identify preclinical signs of CNS dysfunction in these conditions can enable early detection of susceptible individuals and allow the testing of measures to prevent the development of clinical sequelae.
Postmortem we found SIV RNA in the brain of all four infected monkeys; however, no correlation was discernable between viral RNA levels in the brain and viral loads in the plasma or CSF. For instance, in animal #304, the virus, if present in the plasma, CSF, or occipital lobe, was below the limit of detection, whereas the frontal lobe of this monkey contained more virus than any brain region of the other monkeys. ISH confirmed productive virus infection in the brain, localized in perivascular cells, consistent with findings in acute SIV infection and end-stage SIVE (Chakrabarti et al., 1991; Williams et al., 2001).
To obtain a global assessment of the changes in the chronically infected brain, the extent of transcription in the frontal lobe was analyzed by using gene array technology. Thereby, we noted significant upregulation of seven genes in the frontal lobes: CCL5, HLA-DRα, IgGhc, G1P3, IFITM1, HLA-A, and HLA-C. Quantitative RT-PCR was used to confirm their upregulation in the frontal lobe, as well as in other regions of the brain.
We found CCL5, also known as RANTES, to be expressed at a significantly increased level at each stage of infection compared with controls. CCL5 expression can be induced in astrocytes, and potentially other CNS cells, by proinflammatory cytokines (Oh et al., 1999), as well as by HIV infection of microglia (Si et al., 2002). However, although some degree of staining of other cell types or their processes can be observed, here in chronic infection the predominant cell type in which CCL5 is found is infiltrating lymphoid cells, likely CD8+ T-cells. Indeed, CCL5 is present in HIV-specific CD8+ CTLs (Wagner et al., 1998). Interestingly, in contrast to other chemokines/cytokines and cytotoxic granule proteins, CCL5 is stored in a unique secretory compartment, with rapid release after T-cell activation (Catalfamo et al., 2004), thus with the capacity for a brisk effect on immune as well as neural cells.
Because CCL5 has been shown to inhibit HIV-1 infection (Cocchi et al., 1995) and can protect from gp120-mediated neurotoxicity (Kaul and Lipton, 1999); the increases here may be part of the protective measures of the CNS against infection. Additionally, because another study showed that CCL5 treatment of a differentiated neuronal cell line led to induction of genes involved in neuronal survival, synaptogenesis, and neurite outgrowth (Valerio et al., 2004), this also may imply a protective function for CCL5 on neurons. However, there are also detrimental aspects associated with the presence of CCL5. For instance, CCL5 application resulted in apoptosis in a neuroblastoma cell line (Cartier et al., 2003). It is also a chemoattractant, and memory and effector CTLs efficiently migrate in response to CCL5 (Fukada et al., 2002), leading to immune cell infiltration as found in the increased numbers of CD8 T-cells found here. Such a response is likely aimed at protecting against the virus but, over a chronic course, can potentially damage neurons and other CNS cells. Although a low level of CCL5 may be protective, the rising amounts we found as infection progressed may eventually lead to various mechanisms of damage to the CNS.
An essential component of the immune system, the MHC system, was represented in our monkeys by upregulation of both class I (HLA-A and HLA-C) and class II (HLA-DRα) transcripts. Because the MHC class I genomic region encoding the Mamu (Macaca mulatta, rhesus monkeys) genes is quite different in rhesus than that found for HLA (Otting et al., 2005), the common class I light chain β2M, which is regulated in a similar manner to MHC class I genes (van den Elsen et al., 2004), was examined as a surrogate. Indeed, β2M was significantly upregulated in the chronic phase, likely reflecting immune activation. Although quite prominent in end-stage HIV/SIV encephalitis, immunohistochemistry failed to identify a difference in HLA-DR staining of the brain between chronically infected and uninfected animals. However, more sensitive analysis using flow cytometry indeed has reported that HLA-DR is increased on microglia in the chronic stage of SIV infection (Scheller et al., 2005), likely reflecting the increase in mRNA detected by the gene array and qRT-PCR.
The humoral arm of the adaptive immune system also undergoes alterations in this situation (i.e., we find increases in the level of IgGhc transcription). As expected for chronic exposure to an antigen, the highest levels of expression occur as exposure time increases. Humoral immunity in the brain has not been extensively studied in HIV infection, although intrathecal anti-HIV antibody production was identified early in the AIDS pandemic (Resnick et al., 1985) and can be associated with neurological disorders (Fainardi et al., 2001). A study of brain-resident, antibody-secreting cells (plasma cells) performed in SIV-infected rhesus macaques (Sopper et al., 1998) revealed that the frequency of anti-gp120 plasma cells increased with time of infection and amounted to, on average, 15% of all plasma cells, far exceeding the 2–4% in blood, spleen, and lymph nodes. Although we have not been able to detect B-cells by flow cytometry or immunohistochemistry in the brains of SIV-infected monkeys (our unpublished observations), the antigens identified by the antibodies used in those studies are not expressed by plasma cells. Viruses from the brains of infected monkeys can show increased sensitivity to neutralization by antibodies (Puffer et al., 2002; Song et al., 2004). Therefore, humoral immune responses within the brain may be an important protective arm against the viral attack within the CNS.
The final two genes identified by the gene array in the chronically SIV-infected brain, G1P3 and IFITM1, are known as interferon-inducible genes and have poorly characterized functions, although they are implicated in antiviral activities. No increases in any of the interferons were seen by qRT-PCR at this stage (our unpublished observations); however, as we hypothesized previously, other cytokines or infection itself may be responsible for the upregulation of G1P3 and IFITM1 (Roberts et al., 2004).
The following picture emerges of the brain in this chronic stage of SIV infection. A low level of productive viral infection coexists with an immune cell response, maintaining a stable steady-state balance of virus and the immune response against it. Some of this response is relatively nonspecific, such as the increase in the interferon-inducible genes as well as HLA molecules, whereas the adaptive immune response, manifested by CD8+ CTLs and antibody-producing cells, are likely enriched for specific reactivity against the virus. We have identified a molecule made by CTLs, CCL5, which, after a peak in the acute phase of infection, is elevated, and gradually increases over time to this chronic phase. CCL5 has direct antiviral action and the ability to attract other immune cells into the brain, including CTLs, thus playing an important role in the equilibrium existing in the infected brain. CCL5 also has a number of varied effects on neurons themselves. Although a chronic host-pathogen interaction can be tolerated by some physiological systems, the brain is a unique organ. Through CCL5 and perhaps other products of the protective immune response, neurons themselves can be affected, enabling us to detect CNS functional abnormalities before the onset of frank neurological disorders later in the disease course. Viral infection of the brain, which occurs early after HIV/SIV inoculation, may upregulate factors we see here such as CCL5, which may be short-term protective measures but are, in the long term, harmful.
Highly active antiretroviral therapy (HAART) can be quite efficacious in lowering peripheral viral load, prolonging life span, and lowering the incidence (annual number of new cases) of CNS disorders caused by HIV. However, with the advent of HAART, the total prevalence (total number of people currently afflicted) of HIV-related cognitive impairment has either not changed or is possibly increasing (Sacktor et al., 2002; Dore et al., 2003; Cysique et al., 2004; Tozzi et al., 2005). Furthermore, a recent neuropathological autopsy study of HAART-treated HIV-infected individuals revealed a surprising level of neuroinflammation, with high levels of microglial activation and macrophages in the brain (Anthony et al., 2005). Possibly, this therapy does not reach sufficient concentrations within the brain to inhibit viral replication, thus requiring agents with better blood–brain barrier penetration (Letendre et al., 2004).
In conclusion, the many instances of injurious changes during the chronic period of SIV infection documented here indicate that labeling this phase “asymptomatic” is a dangerous misnomer. Although some of the factors we identified may protect the CNS, others may lead to the behavioral, physiological, and neuronal malfunctions we have observed in these cases. Alterations within the brain defined here can provide a basis for calculating the effect of therapy on the CNS.
Footnotes
References
- An SF, Ciardi A, Giometto B, Scaravilli T, Gray F, Scaravilli F (1996). Investigation on the expression of major histocompatibility complex class II and cytokines and detection of HIV-1 DNA within brains of asymptomatic and symptomatic HIV-1-positive patients. Acta Neuropathol 91:494–503. [DOI] [PubMed] [Google Scholar]
- Anthony IC, Ramage SN, Carnie FW, Simmonds P, Bell JE (2005). Influence of HAART on HIV-related CNS disease and neuroinflammation. J Neuropathol Exp Neurol 64:529–536. [DOI] [PubMed] [Google Scholar]
- Bogner JR, Junge-Hulsing B, Kronawitter U, Sadri I, Matuschke A, Goebel FD (1992). Expansion of neopterin and beta 2-microglobulin in cerebrospinal fluid reaches maximum levels early and late in the course of human immunodeficiency virus infection. Clin Invest 70:665–669. [DOI] [PubMed] [Google Scholar]
- Brew BJ, Dunbar N, Pemberton L, Kaldor J (1996). Predictive markers of AIDS dementia complex: CD4 cell count and cerebrospinal fluid concentrations of beta 2-microglobulin and neopterin. J Infect Dis 174:294–298. [DOI] [PubMed] [Google Scholar]
- Burudi EM, Marcondes MC, Watry DD, Zandonatti M, Taffe MA, Fox HS (2002). Regulation of indoleamine 2,3-dioxygenase expression in simian immunodeficiency virus-infected monkey brains. J Virol 76:12233–12241. [DOI] [PMC free article] [PubMed] [Google Scholar]
- Cartier L, Dubois-Dauphin M, Hartley O, Irminger-Finger I, Krause KH (2003). Chemokine-induced cell death in CCR5-expressing neuroblastoma cells. J Neuroimmunol 145:27–39. [DOI] [PubMed] [Google Scholar]
- Catalfamo M, Karpova T, McNally J, Costes SV, Lockett SJ, Bos E, Peters PJ, Henkart PA (2004). Human CD8+ T cells store RANTES in a unique secretory compartment and release it rapidly after TcR stimulation. Immunity 20:219–230. [DOI] [PubMed] [Google Scholar]
- Chakrabarti L, Hurtrel M, Maire MA, Vazeux R, Dormont D, Montagnier L, Hurtrel B (1991). Early viral replication in the brain of SIV-infected rhesus monkeys. Am J Pathol 139:1273–1280. [PMC free article] [PubMed] [Google Scholar]
- Chang L, Ernst T, Witt MD, Ames N, Gaiefsky M, Miller E (2002). Relationships among brain metabolites, cognitive function, and viral loads in antiretroviral-naive HIV patients. NeuroImage 17:1638–1648. [DOI] [PubMed] [Google Scholar]
- Chen YJ, Kurokawa T, Mitsudome A, Hanai T, Narazaki O, Ueda K (1986). Brainstem auditory evoked potentials in children with neurodegenerative diseases. Eur J Pediatr 145:471–474. [DOI] [PubMed] [Google Scholar]
- Cocchi F, DeVico AL, Garzino-Demo A, Arya SK, Gallo RC, Lusso P (1995). Identification of RANTES, MIP-1 alpha, and MIP-1 beta as the major HIV-suppressive factors produced by CD8+ T cells. Science 270:1811–1815. [DOI] [PubMed] [Google Scholar]
- Cysique LA, Maruff P, Brew BJ (2004). Prevalence and pattern of neuropsychological impairment in human immunodeficiency virus-infected/acquired immunodeficiency syndrome (HIV/AIDS) patients across pre- and post-highly active antiretroviral therapy eras: a combined study of two cohorts. J Neurovirol 10:350–357. [DOI] [PubMed] [Google Scholar]
- Dore GJ, McDonald A, Li Y, Kaldor JM, Brew BJ (2003). Marked improvement in survival following AIDS dementia complex in the era of highly active antiretroviral therapy. AIDS 17:1539–1545. [DOI] [PubMed] [Google Scholar]
- Ernst T, Chang L, Arnold S (2003). Increased glial metabolites predict increased working memory network activation in HIV brain injury. NeuroImage 19:1686–1693. [DOI] [PubMed] [Google Scholar]
- Fainardi E, Contini C, Benassi N, Bedetti A, Castellazzi M, Vaghi L, Govoni V, Paolino E, Balboni P, Granieri E (2001). Assessment of HIV-intrathecal humoral immune response in AIDS-related neurological disorders. J Neuroimmunol 119:278–286. [DOI] [PubMed] [Google Scholar]
- Fox HS, Weed MR, Huitron-Resendiz S, Baig J, Horn TF, Dailey PJ, Bischofberger N, Henriksen SJ (2000). Antiviral treatment normalizes neurophysiological but not movement abnormalities in simian immunodeficiency virus-infected monkeys. J Clin Invest 106:37–45. [DOI] [PMC free article] [PubMed] [Google Scholar]
- Fukada K, Sobao Y, Tomiyama H, Oka S, Takiguchi M (2002). Functional expression of the chemokine receptor CCR5 on virus epitope-specific memory and effector CD8+ T cells. J Immunol 168:2225–2232. [DOI] [PubMed] [Google Scholar]
- Gabuzda DH, Levy SR, Chiappa KH (1988). Electroencephalography in AIDS and AIDS-related complex. Clin Electroencephalogr 19:1–6. [DOI] [PubMed] [Google Scholar]
- Gaskill PJ, Watry DD, Burdo TH, Fox HS (2005). Development and characterization of positively selected brain-adapted SIV. Virol J 2:44. [DOI] [PMC free article] [PubMed] [Google Scholar]
- Gerard CJ, Andrejka LM, Macina RA (2000). Mitochondrial ATP synthase 6 as an endogenous control in the quantitative RT-PCR analysis of clinical cancer samples. Mol Diagn 5:39–46. [DOI] [PubMed] [Google Scholar]
- Gold LH, Fox HS, Henriksen SJ, Buchmeier MJ, Weed MR, Taffe MA, Huitron-Resendiz S, Horn TF, Bloom FE (1998). Longitudinal analysis of behavioral, neurophysiological, viral and immunological effects of SIV infection in rhesus monkeys. J Med Primatol 27:104–112. [DOI] [PubMed] [Google Scholar]
- Goodin DS, Aminoff MJ, Chernoff DN, Hollander H (1990). Long latency event-related potentials in patients infected with human immunodeficiency virus. Ann Neurol 27:414–419. [DOI] [PubMed] [Google Scholar]
- Hestad K, McArthur JH, Dal Pan GJ, Selnes OA, Nance-Sproson TE, Aylward E, Mathews VP, McArthur JC (1993). Regional brain atrophy in HIV-1 infection: association with specific neuropsychological test performance. Acta Neurol Scand 88:112–118. [DOI] [PubMed] [Google Scholar]
- Hofmann-Lehmann R, Swenerton RK, Liska V, Leutenegger CM, Lutz H, McClure HM, Ruprecht RM (2000). Sensitive and robust one-tube real-time reverse transcriptase-polymerase chain reaction to quantify SIV RNA load: comparison of one- versus two-enzyme systems. AIDS Res Hum Retroviruses 16:1247–1257. [DOI] [PubMed] [Google Scholar]
- Horn TFW, Huitron-Resendiz S, Weed MR, Henriksen SJ, Fox HS (1998). Early physiological abnormalities after simian immunodeficiency virus infection. Proc Natl Acad Sci USA 95:15072–15077. [DOI] [PMC free article] [PubMed] [Google Scholar]
- Irizarry RA, Hobbs B, Collin F, Beazer-Barclay YD, Antonellis KJ, Scherf U, Speed TP (2003). Exploration, normalization, and summaries of high density oligonucleotide array probe level data. Biostatistics 4:249–264. [DOI] [PubMed] [Google Scholar]
- Jernigan TL, Gamst AC, Archibald SL, Fennema-Notestine C, Mindt MR, Marcotte TL, Heaton RK, Ellis RJ, Grant I (2005). Effects of methamphetamine dependence and HIV infection on cerebral morphology. Am J Psychiatry 162:1461–1472. [DOI] [PubMed] [Google Scholar]
- Kaul M, Lipton SA (1999). Chemokines and activated macrophages in HIV gp120-induced neuronal apoptosis. Proc Natl Acad Sci USA 96:8212–8216. [DOI] [PMC free article] [PubMed] [Google Scholar]
- Kokkevi A, Hatzakis A, Maillis A, Pittadaki J, Zalonis J, Samartzis D, Touloumi G, Mandalaki T, Stefanis C (1991). Neuropsychological assessment of HIV-seropositive haemophiliacs. AIDS 5:1223–1229. [DOI] [PubMed] [Google Scholar]
- Lane TE, Buchmeier MJ, Watry DD, Jakubowski DB, Fox HS (1995). Serial passage of microglial SIV results in selection of homogeneous env quasispecies in the brain. Virology 212:458–465. [DOI] [PubMed] [Google Scholar]
- Letendre SL, McCutchan JA, Childers ME, Woods SP, Lazzaretto D, Heaton RK, Grant I, Ellis RJ (2004). Enhancing antiretroviral therapy for human immunodeficiency virus cognitive disorders. Ann Neurol 56:416–423. [DOI] [PubMed] [Google Scholar]
- Madden LJ, Zandonatti MA, Flynn CT, Taffe MA, Marcondes MC, Schmitz JE, Reimann KA, Henriksen SJ, Fox HS (2004). CD8+ cell depletion amplifies the acute retroviral syndrome. J Neurovirol 10:[Suppl 1], 58–66. [DOI] [PubMed] [Google Scholar]
- Marcondes MC, Burudi EM, Huitron-Resendiz S, Sanchez-Alavez M, Watry D, Zandonatti M, Henriksen SJ, Fox HS (2001). Highly activated CD8(+) T cells in the brain correlate with early central nervous system dysfunction in simian immunodeficiency virus infection. J Immunol 167:5429–5438. [DOI] [PubMed] [Google Scholar]
- McArthur JC, Cohen BA, Farzedegan H, Cornblath DR, Selnes OA, Ostrow D, Johnson RT, Phair J, Polk BF (1988). Cerebrospinal fluid abnormalities in homosexual men with and without neuropsychiatric findings. Ann Neurol 23:[Suppl], S34–S37. [DOI] [PubMed] [Google Scholar]
- Murray EA, Rausch DM, Lendvay J, Sharer LR, Eiden LE (1992). Cognitive and motor impairments associated with SIV infection in rhesus monkeys. Science 255:1246–1249. [DOI] [PubMed] [Google Scholar]
- Oh JW, Schwiebert LM, Benveniste EN (1999). Cytokine regulation of CC and CXC chemokine expression by human astrocytes. J Neurovirol 5:82–94. [DOI] [PubMed] [Google Scholar]
- Otting N, Heijmans CM, Noort RC, de Groot NG, Doxiadis GG, van Rood JJ, Watkins DI, Bontrop RE (2005). Unparalleled complexity of the MHC class I region in rhesus macaques. Proc Natl Acad Sci USA 102:1626–1631. [DOI] [PMC free article] [PubMed] [Google Scholar]
- Pagano MA, Cahn PE, Garau ML, Mangone CA, Figini HA, Yorio AA, Dellepiane MC, Amores MG, Perez HM, Casiro AD (1992). Brain-stem auditory evoked potentials in human immunodeficiency virus-seropositive patients with and without acquired immunodeficiency syndrome. Arch Neurol 49:166–169. [DOI] [PubMed] [Google Scholar]
- Parisi A, Strosselli M, Di Perri G, Cairoli S, Minoli L, Bono G, Moglia A, Nappi G (1989). Electroencephalography in the early diagnosis of HIV-related subacute encephalitis: analysis of 185 patients. Clin Electroencephalogr 20:1–5. [DOI] [PubMed] [Google Scholar]
- Pierelli F, Soldati G, Zambardi P, Garrubba C, Spadaro M, Tilia G, Pauri F, Morocutti C (1993). Electrophysiological study (VEP, BAEP) in HIV-1 seropositive patients with and without AIDS. Acta Neurol Belg 93:78–87. [PubMed] [Google Scholar]
- Prospero-Garcia O, Gold LH, Fox HS, Polis I, Koob GF, Bloom FE, Henriksen SJ (1996). Microglia-passaged simian immunodeficiency virus induces neurophysiological abnormalities in monkeys. Proc Natl Acad Sci USA 93:14158–14163. [DOI] [PMC free article] [PubMed] [Google Scholar]
- Puffer BA, Pohlmann S, Edinger AL, Carlin D, Sanchez MD, Reitter J, Watry DD, Fox HS, Desrosiers RC, Doms RW (2002). CD4 independence of simian immunodeficiency virus Envs is associated with macrophage tropism, neutralization sensitivity, and attenuated pathogenicity. J Virol 76:2595–2605. [DOI] [PMC free article] [PubMed] [Google Scholar]
- Raymond LA, Wallace D, Berman NE, Marcario J, Foresman L, Joag SV, Raghavan R, Narayan O, Cheney PD (1998). Auditory brainstem responses in a Rhesus Macaque model of neuro-AIDS. J Neurovirol 4:512–520. [DOI] [PubMed] [Google Scholar]
- Resnick L, DiMarzo-Veronese F, Schupbach J, Tourtellotte WW, Ho DD, Muller F, Shapshak P, Vogt M, Groopman JE, Markham PD, Gallo RC (1985). Intra-blood-brain-barrier synthesis of HTLV-III-specific IgG in patients with neurologic symptoms associated with AIDS or AIDS-related complex. N Engl J Med 313:1498–1504. [DOI] [PubMed] [Google Scholar]
- Reyes-Contreras L, Silva-Rojas A, Ysunza-Rivera A, Jimenez-Ruiz G, Berruecos-Villalobos P, Romo-Gutierrez G (2002). Brainstem auditory evoked response in HIV-infected patients with and without AIDS. Arch Med Res 33:25–28. [DOI] [PubMed] [Google Scholar]
- Roberts ES, Zandonatti MA, Watry DD, Madden LJ, Henriksen SJ, Taffe MA, Fox HS (2003). Induction of pathogenic sets of genes in macrophages and neurons in neuroAIDS. Am J Pathol 162:2041–2057. [DOI] [PMC free article] [PubMed] [Google Scholar]
- Roberts ES, Burudi EM, Flynn C, Madden LJ, Roinick KL, Watry DD, Zandonatti MA, Taffe MA, Fox HS (2004). Acute SIV infection of the brain leads to upregulation of IL6 and interferon-regulated genes: expression patterns throughout disease progression and impact on neuroAIDS. J Neuroimmunol 157:81–92. [DOI] [PubMed] [Google Scholar]
- Sacktor N, McDermott MP, Marder K, Schifitto G, Selnes OA, McArthur JC, Stern Y, Albert S, Palumbo D, Kieburtz K, De Marcaida JA, Cohen B, Epstein L (2002). HIV-associated cognitive impairment before and after the advent of combination therapy. J Neurovirol 8:136–142. [DOI] [PubMed] [Google Scholar]
- Sahakian BJ, Elliott R, Low N, Mehta M, Clark RT, Pozniak AL (1995). Neuropsychological deficits in tests of executive function in asymptomatic and symptomatic HIV-1 seropositive men. Psychol Med 25:1233–1246. [DOI] [PubMed] [Google Scholar]
- Scheller C, Sopper S, Jenuwein M, Neuen-Jacob E, Tatschner T, Grunblatt E, Ter Meulen V, Riederer P, Koutsilieri E (2005). Early impairment in dopaminergic neurotransmission in brains of SIV-infected rhesus monkeys due to microglia activation. J Neurochem 95:377–387. [DOI] [PubMed] [Google Scholar]
- Schmitz JE, Kuroda MJ, Santra S, Sasseville VG, Simon MA, Lifton MA, Racz P, Tenner-Racz K, Dalesandro M, Scallon BJ, Ghrayeb J, Forman MA, Montefiori DC, Rieber EP, Letvin NL, Reimann KA (1999). Control of viremia in simian immunodeficiency virus infection by CD8+ lymphocytes. Science 283:857–860. [DOI] [PubMed] [Google Scholar]
- Si Q, Kim MO, Zhao ML, Landau NR, Goldstein H, Lee S (2002). Vpr- and Nef-dependent induction of RANTES/CCL5 in microglial cells. Virology 301:342–353. [DOI] [PubMed] [Google Scholar]
- Song B, Cayabyab M, Phan N, Wang L, Axthelm MK, Letvin NL, Sodroski JG (2004). Neutralization sensitivity of a simian-human immunodeficiency virus (SHIV-HXBc2P 3.2N) isolated from an infected rhesus macaque with neurological disease. Virology 322:168–181. [DOI] [PubMed] [Google Scholar]
- Sopper S, Sauer U, Hemm S, Demuth M, Muller J, Stahl-Hennig C, Hunsmann G, ter Meulen V, Dorries R (1998). Protective role of the virus-specific immune response for development of severe neurologic signs in simian immunodeficiency virus-infected macaques. J Virol 72:9940–9947. [DOI] [PMC free article] [PubMed] [Google Scholar]
- Stern Y, McDermott MP, Albert S, Palumbo D, Selnes OA, McArthur J, Sacktor N, Schifitto G, Kieburtz K, Epstein L, Marder KS (2001). Factors associated with incident human immunodeficiency virus-dementia. Arch Neurol 58:473–479. [DOI] [PubMed] [Google Scholar]
- Thompson PM, Dutton RA, Hayashi KM, Toga AW, Lopez OL, Aizenstein HJ, Becker JT (2005). Thinning of the cerebral cortex visualized in HIV/AIDS reflects CD4+ T lymphocyte decline. Proc Natl Acad Sci USA. [DOI] [PMC free article] [PubMed]
- Tozzi V, Balestra P, Lorenzini P, Bellagamba R, Galgani S, Corpolongo A, Vlassi C, Larussa D, Zaccarelli M, Noto P, Visco-Comandini U, Giulianelli M, Ippolito G, Antinori A, Narciso P (2005). Prevalence and risk factors for human immunodeficiency virus-associated neurocognitive impairment, 1996 to 2002: results from an urban observational cohort. J Neurovirol 11:265–273. [DOI] [PubMed] [Google Scholar]
- Valerio A, Ferrario M, Martinez FO, Locati M, Ghisi V, Bresciani LG, Mantovani A, Spano P (2004). Gene expression profile activated by the chemokine CCL5/RANTES in human neuronal cells. J Neurosci Res 78:371–382. [DOI] [PubMed] [Google Scholar]
- van den Elsen PJ, Holling TM, Kuipers HF, van der Stoep N (2004). Transcriptional regulation of antigen presentation. Curr Opin Immunol 16:67–75. [DOI] [PubMed] [Google Scholar]
- Villa G, Monteleone D, Marra C, Bartoli A, Antinori A, Pallavicini F, Tamburrini E, Izzi I (1993). Neuropsychological abnormalities in AIDS and asymptomatic HIV seropositive patients. J Neurol Neurosurg Psychiatry 56:878–884. [DOI] [PMC free article] [PubMed] [Google Scholar]
- Wagner L, Yang OO, Garcia-Zepeda EA, Ge Y, Kalams SA, Walker BD, Pasternack MS, Luster AD (1998). Beta-chemokines are released from HIV-1-specific cytolytic T-cell granules complexed to proteoglycans. Nature 391:908–911. [DOI] [PubMed] [Google Scholar]
- Weed MR, Taffe MA, Polis I, Roberts AC, Robbins TW, Koob GF, Bloom FE, Gold LH (1999). Performance norms for a rhesus monkey neuropsychological testing battery: acquisition and long-term performance. Brain Res Cogn Brain Res 8:185–201. [DOI] [PubMed] [Google Scholar]
- Weed MR, Hienz RD, Brady JV, Adams RJ, Mankowski JL, Clements JE, Zink MC (2003). Central nervous system correlates of behavioral deficits following simian immunodeficiency virus infection. J Neurovirol 9:452–464. [DOI] [PubMed] [Google Scholar]
- Weed MR, Gold LH, Polis I, Koob GF, Fox HS, Taffe MA (2004). Impaired performance on a rhesus monkey neuropsychological testing battery following simian immunodeficiency virus infection. AIDS Res Hum Retroviruses 20:77–89. [DOI] [PubMed] [Google Scholar]
- Williams KC, Corey S, Westmoreland SV, Pauley D, Knight H, deBakker C, Alvarez X, Lackner AA (2001). Perivascular macrophages are the primary cell type productively infected by simian immunodeficiency virus in the brains of macaques. Implications for the neuropathogenesis of aids. J Exp Med 193:905–916. [DOI] [PMC free article] [PubMed] [Google Scholar]
- Wu Z, Irizarry R, Gentleman R, Martinez Murillo F, Spencer F (2005). A model based background adjustment for oligonucleotide expression arrays. J Am Stat Assoc 99:909–917. [Google Scholar]