

Abstract
Some models propose that the spatial and temporal distributions of premotor activity in the intermediate layer of the superior colliculus are shaped by neuronal ensembles that give rise to local excitatory and distant inhibitory connections. One function proposed for these connections is to mediate a “winner-take-all” network; the short-range excitatory connections build up the activity of neighboring cells that command orienting movements in one direction, whereas the wide-ranging inhibitory projections attenuate the activity of remote cells that command incompatible movements. We used in vitro photostimulation and whole-cell patch-clamp recording to test these models by measuring the spatial extent of synaptic interactions within the rat intermediate layer. Uncaging glutamate over whole-cell patch-clamped cells in the intermediate layer elicited long-lasting inward currents, resulting from direct activation of glutamate receptors expressed by the cells, and brief synaptic currents evoked by activation of presynaptic neurons. The synaptic responses comprised clusters of excitatory and inhibitory currents. The size of these responses depended on the location of the stimulus with respect to the clamped cell. Large responses were commonly evoked by stimuli within 200 μm of the soma in the intermediate layer; smaller responses could occasionally be evoked from sites as distant as 500 μm. Responses evoked by stimulation beyond this distance were rare. Although the results demonstrated powerful local excitatory and inhibitory connections, they did not support the pattern of short-range excitation and widespread inhibition predicted by the winner-take-all hypothesis.
Keywords: rat, patch-clamp, intrinsic circuitry photostimulation, eye movements, winner-take-all network, IPSC, EPSC
Introduction
Neurons in the intermediate gray layer (SGI) of the superior colliculus generate command signals for orienting movements that shift the direction of gaze toward salient features of the visual field (Sparks, 1978). These neurons are organized as a spatial map of saccade vectors. For example, cells located in caudal SGI respond most vigorously before large amplitude horizontal saccades, whereas progressively more rostral cells discharge maximally before progressively smaller saccades (Schiller and Koerner, 1971; Wurtz and Goldberg, 1972). The same conclusion is supported by electrical stimulation; current pulses applied caudally elicit large horizontal saccades, whereas rostral stimulation evokes smaller saccades (Schiller and Stryker, 1972).
The spatial coding of saccade vectors suggests that stimuli in different parts of the visual field will simultaneously activate multiple ensembles of command cells, which compete for control of the oculomotor system (Didday, 1976; Arai et al., 1994). Some models (Van Opstal and Van Gisbergen, 1989; Arai et al., 1994; Das et al., 1996) propose that the competition is mediated by short-range excitatory connections that build up the activity of neurons in one region to the command threshold required for an orienting movement and by wide-ranging inhibitory projections that attenuate activity in other regions that might otherwise command undesired movements.
According to these models, each region of the map inhibits all others; therefore, wide-ranging horizontal inhibition should be a pervasive feature of SGI. To test these models, we measured the excitatory and inhibitory responses of cells in vitro using whole-cell patch-clamp recording while putative presynaptic cells were activated using photolysis of caged glutamate (Katz and Dalva, 1994; Pettit et al. 1999; Helms et al., 2004). The patch-clamp recordings provided a sensitive method for measuring synaptic responses, whereas photostimulation allowed spatially precise excitation of presynaptic neurons without the confounding activation of axons of passage (Helms et al., 2004). The results support the proposal that neighboring cells amplify their activity by sharing strong recurrent excitatory inputs. However, inhibitory interactions are as restricted spatially as the excitatory and seem unlikely to provide a substrate for wide-ranging competition within the motor map.
Materials and Methods
The procedures for in vitro photostimulation and whole-cell recording are described by Helms et al. (2004). Briefly, collicular coronal or parasagittal slices 200–300 μm thick were prepared from 13- to 28-d-old rats. Slices were superfused at room temperature with oxygenated physiological saline containing 100–150 μm caged glutamate (Invitrogen, Eugene, OR). In some experiments, 1–1.5 μm tetrodotoxin (TTX) was added to block spikes in presynaptic cells as a means for demonstrating that the evoked currents were synaptically mediated. In other experiments, either 10 μm GABAzine (SR-95532) or 50 μm picrotoxin was used to identify GABAA receptor currents. Sometimes, the AMPA and NMDA receptor blockers CNQX (10 μm) and APV (50 μm) were added to demonstrate currents mediated by glutamate receptors.
In one set of experiments, recordings were made from 30 neurons voltage clamped in the range of −70 and −53 mV. EPSCs generated at these potentials were used to measure the extent of horizontal excitation. In another set of experiments designed to measure the horizontal extent of inhibition, 25 neurons were clamped at potentials as depolarized as −30 mV. The internal voltage-gated Na+ channel blocker lidocaine N-ethyl bromide (5–10 mm) was added to the pipette to suppress action potentials. Internal solutions with chloride reversal potentials of either −65 or −82 mV were used to further increase the driving force on IPSCs. The combination of high-chloride reversal potentials and low holding potentials increased the amplitude of IPSCs while reducing EPSCs that might mask inhibitory currents.
Recordings were accepted only if the holding current was <100 pA when the membrane potential was clamped at −60 to −70 mV. All holding potentials include correction for a calculated −13 or −15 mV junction potential. To determine cell location and morphology after the experiment, biocytin (0.3–0.5%) was included in the internal solution and diffused into the cell during the recording. The slices were then fixed, and a DAB reaction was performed to reveal the biocytin.
The photostimulation method was described by Helms et al. (2004). In brief, ultraviolet light from a laser was delivered through a microscope objective and focused on the slice. Glutamate was photolyzed consistently over an area 50 μm in diameter at the focal plane. An electronic shutter was used to vary the duration of the light pulse (5–25 ms) and thus the total amount of photostimulation. The laser beam was aligned in the center of the objective and remained stationary while a motorized microscope stage varied the distance between the site of photostimulation and the clamped cell.
Results
The measurements indicated that horizontal interactions within SGI are local; both EPSCs and IPSCs decreased rapidly with increases in the distance between the photostimulation site and the patch-clamped cell. For the majority of cells, currents could not be evoked following stimulation beyond 500 μm. These measurements are probably not an artifact of the in vitro method because, in similar experiments, photostimulation at superficial layer sites as distant as 1300 μm evoked large EPSCs in SGI cells (Helms et al., 2004).
The identification of EPSCs and IPSCs
Our criteria for identifying EPSCs are described in previous studies (Lee et al., 1997; Pettit et al., 1999; Helms et al., 2004). The excitatory currents had reversal potentials ∼0 mV. Figure 1A shows that TTX, which blocks Na/K action potentials, eliminated the inward currents, confirming that they were synaptically mediated (EPSCs). Figure 1 also shows our criteria for identifying IPSCs. Figure 1B illustrates recordings made while the photostimulus was directly over the soma of a clamped SGI cell. In the black trace, the stimulus evoked a large slow inward current with superimposed, smaller, more rapid outward currents. In the red trace, TTX eliminated the outward currents, indicating they were synaptically mediated. Finally, in the gray trace, the large inward current remaining after the application of TTX was blocked by the AMPA and NMDA receptor blockers CNQX (10 μm) and APV (50 μm), indicating this nonsynaptic current was evoked by direct stimulation of glutamate receptors expressed by the clamped cell. In Figure 1C, the GABAA receptor blocker GABAzine (10 μm) was added, and the outward currents evoked by photostimulation 200 μm from the cell soma disappeared. The same conclusion is supported by Figure 1D: outward currents evoked by stimulation 40 and 80 μm from the soma of a cell were eliminated by the selective Cl− channel blocker picrotoxin (50 μm), indicating that they are GABAA receptor-mediated IPSCs.
Figure 1.

Identification of evoked currents. The baselines below the traces of neural activity indicate the time of photostimulation. A, Inward currents evoked by photostimulation 200 μm from the cell are blocked by 1.5 mm TTX (holding potential, −70 mV). B, Photostimulation over a cell soma evokes a large, slow, inward current with small superimposed outward currents (black trace). TTX (1 μm) eliminates the outward currents but spares the inward current (red trace). APV (50 μm) and CNQX (10 μm) added to the bath eliminate the inward current (gray trace; holding potential, −65 mV). C, The GABAA receptor blocker GABAzine (10 μm) eliminates the outward currents evoked by photostimulation 200 μm from the cell soma (holding potential, −30 mV). D, The chloride channel blocker picrotoxin (50 μm) eliminates outward currents evoked by photostimulation 40 and 80 μm from the cell soma (holding potential, −58 mV). Glu, Glutamate.
The horizontal extent of excitation
In these experiments, recordings were made from 30 SGI cells during photostimulation at sites along a trajectory parallel to the curvature of the layer. A total of 227 sites were examined for an average of 7.6 sites per cell. Stimulus sites ranged from 14 to 1005 μm from the recorded cell soma with a mean separation of 268 μm (195 μm median; 501 μm mode).
The probability of evoking synaptic responses is a function of the size of the stimulus (50 μm) and the density of presynaptic cells at the stimulus site. Figure 2 plots the probability of evoking EPSCs pooled in bins of 100 μm for the 30 cells. The columns indicate the mean probability and SE. EPSCs were evoked from 28% of the stimulus sites (n = 63 sites). Figure 2 illustrates that the probability of evoking EPSCs was relatively constant for stimulation sites within 300 μm of the soma but decreased to near zero when the stimulus was as remote as 500 μm.
Figure 2.

Probability of evoking EPSCs as a function of the horizontal distance between the stimulus and the clamped cell. Probability is the percentage of photostimulation attempts at a given distance that evoked responses, pooled across the 30 SGI neurons and binned at a given distance. Columns indicate mean probability and SE.
The horizontal extent of inhibition
To measure IPSCs, 25 cells from 15 coronal and 10 parasagittal slices were clamped at depolarized potentials to increase the outward current amplitudes and reduce the size of inward currents that might mask IPSCs. Figure 3 illustrates a cell approximately midway between the rostral and caudal borders of SGI. At the top is a photograph of the parasagittal slice taken at the time of the experiment. The black circle indicates the location of the clamped cell, and the red circles indicate stimulation sites. For this cell, the photostimulus was applied at seven sites in a temporal sequence beginning 1000 μm rostral to the soma (site 7), near the border between the rostral pole of SGI and the pretectum, and ending at a site 100 μm rostral to the cell soma (site 1). The evoked IPSCs are illustrated in the bottom left side of the figure. Prominent IPSCs were evoked by stimuli near the soma (top two traces), but they decreased sharply when the stimulus was >200 μm from the cell (asterisk). At the end of the experiment, currents were evoked again by stimulation at 200 μm and blocked with GABAzine, confirming that they were GABAA receptor-mediated IPSCs (Fig. 3, bottom right).
Figure 3.
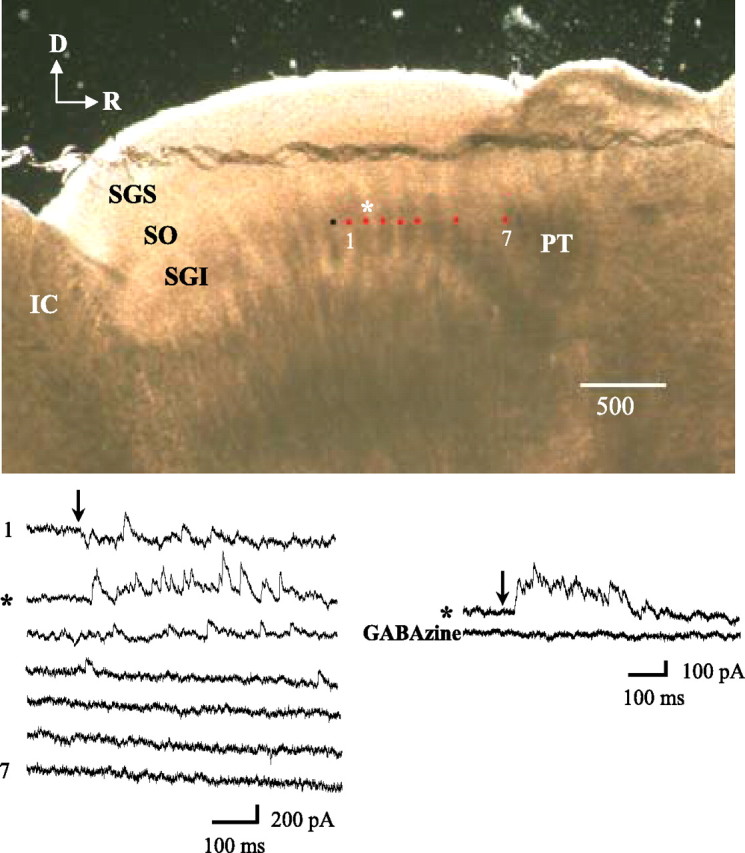
Horizontal inhibitory circuitry. Top, Photograph of the living slice. Black circle, Clamped cell location; red circles, stimulation sites. Bottom left, Seven tracings of evoked responses. Stimulation began at site 7 (1000 μm from the soma of the clamped cell) and moved progressively toward site 1, 100 μm from the soma. IPSC amplitude and frequency decreased rapidly with distance and approached zero within 300–500 μm from the soma. Bottom right: Site 2, 200 μm from the soma (asterisk), was stimulated again, and the response was blocked by GABAzine (holding potential, −30 mV). D, Dorsal; R, rostral; SGI, stratum griseum intermedium or intermediate gray layer; SGS, stratum griseum superficiale or superficial gray layer; SO, stratum opticum or optic layer; IC, inferior colliculus; PT, pretectum.
The combined results for 10 cells in parasagittal slices are summarized in Figure 4. Evoked IPSCs decreased rapidly to baseline between 200 and 500 μm and could not be detected after stimulation at more distant sites. Initial F tests based on ANOVA indicated significant differences among the mean responses evoked from the 11 stimulus sites in Figure 4 (p < 0.0001). To determine which responses are significantly different, we performed ANOVA multiple comparisons with Duncan and Tukey tests. Both tests showed that the amplitudes of the responses evoked between the soma and 200 μm are significantly different (p < 0.05) from those evoked from sites located from 500 to 1000 μm. The tests also showed that the activity measured after stimulation at sites between 500 and 1000 μm does not differ significantly from control baseline measurements made in the absence of caged glutamate and/or laser stimulation. Additional analysis based on LOESS (Cleveland et al., 1992) showed that the inhibitory input decreases exponentially with distance from the soma (p < 0.0001). Similar results were obtained in the mediolateral dimension from coronal slices.
Figure 4.
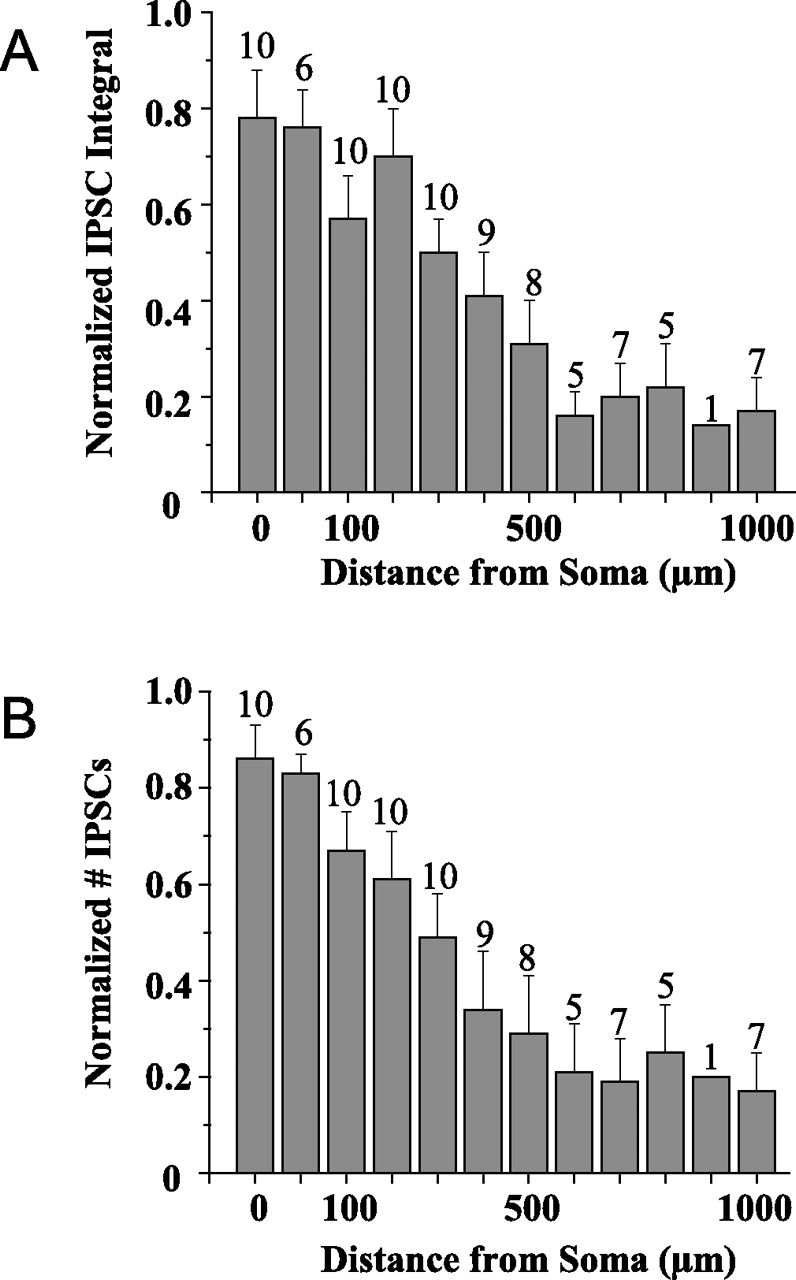
Summary of experiments in parasagittal slices. The number at the top of the columns indicates the number of cells that were tested at each distance. A, The peak IPSC amplitude for the 10 cells recorded at a −30 mV holding potential decreased sharply with distance from the soma and reached a plateau near baseline by 500 μm. B, IPSC frequency was calculated by measuring all synaptic events, the amplitude of which exceeded twice the baseline noise. The frequency decreased rapidly over the first 200 μm and reached the control baseline level by 500 μm.
Discussion
Multiple objects can exist simultaneously in the visual field and, based on their saliency, compete for control of the circuitry that initiates orienting movements. SGI has been proposed as a site for this competition, because it spatially encodes the loci of these multiple objects (Basso and Wurtz, 1998) and generates a spatially encoded output that commands a gaze shift toward the selected target (Sparks, 1978; Anderson et al., 1998). Some models propose that inputs to SGI encoding stimulus location combine with local recurrent excitation to increase local activity to a threshold for a command, whereas widespread inhibition originating at this locus attenuates the activity of distant cells that otherwise might command undesired movements (Van Opstal and Van Gisbergen, 1989; Arai et al., 1994; Das et al., 1996). Our objective was to test this model.
Our conclusion that a “winner-take-all” mechanism is not mediated by the circuitry of SGI is based on two results. First, IPSCs could only be evoked by stimulation within 500 μm of the soma of a cell. Even when the cells were held at depolarized potentials, evoked IPSCs could be detected only from distances within 500 μm. These distances are comparable with the length of intralaminar GABAergic cell axons in the SGI of the mouse (Sooksawate et al., 2005). This local inhibition may mediate the short-range suppression of premotor cell activity (Basso and Wurtz, 1998; Li and Basso, 2005) but is too restricted for the long-range interactions required by a winner-take-all model of the rat SGI, which extends ∼3.5 mm in both the rostrocaudal and mediolateral dimensions. Second, the excitatory responses only were evoked within a region extending <500 μm from soma. The spatial extent of this excitation approximates the combined radii of the terminal fields of the recurrent collaterals and the dendritic fields of cells in this layer (Moschovakis and Karabelas, 1985; Moschovakis et al., 1988; Hall and Lee, 1997). These excitatory connections could elevate activity locally toward the command threshold for a movement, but their spatial range is insufficient to mediate global inhibition by exciting remote inhibitory interneurons (Meredith and Ramoa, 1998).
Evidence for widespread inhibition and excitation within SGI
Previous evidence for widespread inhibition was provided by experiments in which glutamate was injected at one site to locally increase background activity, whereas other sites were electrically stimulated (Douglas and Vetter, 1986). A decrease in background activity at the injection site was evoked by stimulation throughout both colliculi. Later, Munoz and Istvan (1998) and Meredith and Ramoa (1998) evoked short-latency inhibition by electrically stimulating widely separated regions within SGI. In the latter study, the inhibition was reduced after excitatory synapses were blocked pharmacologically, suggesting that the inhibition was mediated by long-range excitatory projections to local inhibitory interneurons. However, our results suggest that neither inhibitory nor excitatory projections within SGI are wide ranging enough to mediate long-distance effects. One explanation for the differences might be that the electrical stimulation activated axons of passage. For example, the widespread inhibitory responses could have been evoked either by activating excitatory axons that arise outside of the colliculus and contact inhibitory interneurons within SGI or by activating axons from one of the GABAergic cell populations that project to the superior colliculus (Appell and Behan, 1990).
In another study, McIlwain (1982) reported that focal electrical stimulation within SGI can excite ≥50% of the cells within 1.5 mm of the stimulation electrode. These distances exceed the dimensions of the excitatory surround measured in the present experiments and are consistent with the proposal that wide-ranging inhibition in SGI is mediated by long-range excitatory projections that contact short axon inhibitory neurons (Meredith and Ramoa, 1998). However, as McIlwain (1982) discussed more than one synapse could intervene between the stimulated cells and the cells that exhibited evoked responses. In contrast, the responses evoked by photostimulation are almost entirely monosynaptic (Callaway and Katz, 1993; Dalva and Katz, 1994; Helms et al., 2004). McIlwain (1982) also pointed out that the responses could have been mediated by activating extrinsic afferent pathways that terminate over a wide area of the colliculus. Therefore, although McIlwain's (1982) results are consistent with models proposing that multisynaptic circuits mediate widespread interactions within SGI (Munoz and Wurtz, 1995), they do not contradict the present results, indicating that these interactions are not mediated by long-range monosynaptic connections.
Alternative winner-take-all models
Circuits within SGI are not the only mechanisms that have been proposed to mediate a winner-take-all competition. Alternative models propose that pathways from outside structures could provide global inhibition and local excitation. For example, substantia nigra pars reticulata is the source of a widespread GABAergic pathway that tonically inhibits both ipsilateral and contralateral SGI cells. (Chevalier et al., 1981; Hikosaka and Wurtz, 1983; May and Hall, 1984; Karabelas and Moschovakis, 1985; Harting et al., 1988; Bickford and Hall, 1992; Basso and Wurtz, 2002). A winner-take-all mechanism could be mediated by local disinhibition of the premotor cells produced by a spatially selective decrease in nigral cell activity, in combination with a build up in the activity of the premotor cells by afferent pathways and recurrent excitation (Das et al., 1996).
Another alternative involves the parabigeminal nucleus, which has reciprocal retinotopically organized connections with the superior colliculus (Graybiel, 1978). This cholinergic pathway reduces the level of activity of superficial layer cells (Lee et al., 2001) and may provide a spatially selective modulation of visual signals relayed to SGI. Moreover, the adjacent midbrain tegmentum contains GABAergic cells that project to the superior colliculus (Appell and Behan, 1990) and may mediate global inhibition.
Finally, evidence suggests that a winner-take-all mechanism may not operate in SGI (Keller, 2004). For example, in a double-step saccade paradigm, monkeys are presented sequentially with two saccade targets before the onset of the initial saccade (Port and Wurtz, 2000). The monkeys sometimes initiate a saccade that is directed toward the first target but then curves toward the second. During these curved saccades, activity can simultaneously occur in two different SGI sites. Similarly, monkeys trained to orient toward the odd stimulus in an array sometimes initiate a saccade toward a distracting stimulus that is replaced en route by a curved saccade toward the correct target (McPeek and Keller, 2002b). During the curved saccade, activity is initially present at two sites in the map. Also, in visual search paradigms, monkeys sometimes make a short-latency corrective saccade, and during the initial saccade, activity can build up at the site that commands the corrective saccade (McPeek and Keller, 2002a). Finally, Edelman and Keller (1998) show that when short-latency “express saccades” are generated in the presence of two stimuli, neither of the two regions of activity in the motor map is suppressed. These studies are consistent with the argument that the process of selection takes place downstream of SGI.
Conclusions
The present experiments revealed strong excitatory and inhibitory interactions within SGI, but the interactions are too restricted spatially to mediate a competitive mechanism based on local excitation and wide-ranging inhibition. Instead, these interactions seem more likely to play a role in modulating the spatial and temporal profiles of activity at particular sites within SGI.
Footnotes
This work was supported by National Institutes of Health Grant EY08233. We thank Matthew C. Helms for assembling the apparatus and writing the initial software for these experiments and for collecting a portion of the data. We also thank Dr. Gulden Ozen for helping in the collection of data. We especially thank Dr. George Augustine for expert advice on all phases of these experiments; Drs. Robert Wurtz, Edward Keller, and Michelle Basso for their comments on a previous version of this manuscript; and Dr. Young Truong for advice on the statistical analyses.
References
- Anderson RW, Keller EL, Gandhi NJ, Das S (1998). Two dimensional saccade-related population activity in superior colliculus in monkey. J Neurophysiol 80:798–817. [DOI] [PubMed] [Google Scholar]
- Appell PP, Behan M (1990). Sources of subcortical GABAergic projections to the superior colliculus in the cat. J Comp Neurol 302:143–158. [DOI] [PubMed] [Google Scholar]
- Arai K, Keller EL, Edelman JA (1994). Two-dimensional neural network model of the primate saccadic system. Neural Netw 7:1115–1135. [Google Scholar]
- Basso MA, Wurtz RH (1998). Modulation of neuronal activity in superior colliculus by changes in target probability. J Neurosci 18:7519–7534. [DOI] [PMC free article] [PubMed] [Google Scholar]
- Basso MA, Wurtz RH (2002). Neuronal activity in substantia nigra pars reticulata during target selection. J Neurosci 22:1883–1894. [DOI] [PMC free article] [PubMed] [Google Scholar]
- Bickford ME, Hall WC (1992). The nigral projection to predorsal bundle cells in the superior colliculus of the rat. J Comp Neurol 319:11–33. [DOI] [PubMed] [Google Scholar]
- Callaway EM, Katz LC (1993). Photostimulation using caged glutamate reveals functional circuitry in living brain slices. Proc Natl Acad Sci USA 90:7661–7665. [DOI] [PMC free article] [PubMed] [Google Scholar]
- Chevalier G, Thierry AM, Shibazaki T, Ferger J (1981). Evidence for a GABAergic inhibitory nigrotectal pathway in the rat. Neurosci Lett 21:61–70. [DOI] [PubMed] [Google Scholar]
- Cleveland WS, Grosse E, Shyu WM (1992). Local regression models. In: Statistical models in S (Chambers JM, Hastie TJ, eds) pp. 309–376. Boca Raton, FL: CRC.
- Dalva MB, Katz LC (1994). Rearrangements of synaptic connections in visual cortex revealed by laser photostimulation. Science 265:255–258. [DOI] [PubMed] [Google Scholar]
- Das S, Keller EL, Arai K (1996). A distributed model of the saccadic system: the effects of internal noise. Neurocomput 11:245–269. [Google Scholar]
- Didday RL (1976). A model of visuomotor mechanisms in the frog optic tectum. Math Biosci 30:169–1180. [Google Scholar]
- Douglas RM, Vetter M (1986). Widespread inhibition and target selection in the superior colliculus. Soc Neurosci Abstr 12:458. [Google Scholar]
- Edelman JA, Keller EL (1998). Dependence on target configuration of express saccade-related activity in the primate superior colliculus. J Neurophysiol 80:1407–1426. [DOI] [PubMed] [Google Scholar]
- Graybiel AM (1978). A satellite system of the superior colliculus: the parabigeminal nucleus and its projections to the superficial layers. Brain Res 145:365–374. [DOI] [PubMed] [Google Scholar]
- Hall WC, Lee P (1997). Interlaminar connections of the superior colliculus in the tree shrew. III: The optic layer. Vis Neurosci 14:647–661. [DOI] [PubMed] [Google Scholar]
- Harting JK, Huerta MF, Hashikawa T, Weber JT, van Lieshout DP (1988). Neuroanatomical studies of the nigrotectal projection in the cat. J Comp Neurol 278:615–631. [DOI] [PubMed] [Google Scholar]
- Helms MC, Özen G, Hall WC (2004). Organization of the intermediate gray layer of the superior colliculus. I. Intrinsic vertical connections. J Neurophysiol 91:1706–1715. [DOI] [PubMed] [Google Scholar]
- Hikosaka O, Wurtz RH (1983). Visual and oculomotor functions of monkey substantia nigra pars reticulata. IV. Relation of substantia nigra to superior colliculus. J Neurophysiol 49:1285–1301. [DOI] [PubMed] [Google Scholar]
- Karabelas AB, Moschovakis AK (1985). Nigral inhibitory termination on efferent neurons of the superior colliculus: an intracellular horseradish peroxidase study in the cat. J Comp Neurol 239:309–329. [DOI] [PubMed] [Google Scholar]
- Katz LC, Dalva MB (1994). Scanning laser photostimulation: a new approach for analyzing brain circuits. J Neurosci Methods 54:205–218. [DOI] [PubMed] [Google Scholar]
- Keller EL (2004). Distributed neural processing in the saccadic system. In: The superior colliculus: new approaches for studying sensorimotor integration (Hall WC, Moschovakis A, eds) pp. 277–301. Boca Raton, FL: CRC.
- Lee PH, Helms MC, Augustine GJ, Hall WC (1997). Role of intrinsic synaptic circuitry in collicular sensorimotor integration. Proc Natl Acad Sci USA 94:13299–13304. [DOI] [PMC free article] [PubMed] [Google Scholar]
- Lee PH, Schmidt M, Hall WC (2001). Excitatory and inhibitory circuitry in the superficial gray layer of the superior colliculus. J Neurosci 21:8145–8153. [DOI] [PMC free article] [PubMed] [Google Scholar]
- Li X, Basso MA (2005). Competitive stimulus interactions within single response fields of superior colliculus neurons. J Neurosci 25:11357–11373. [DOI] [PMC free article] [PubMed] [Google Scholar]
- May PJ, Hall WC (1984). Relationships between the nigrotectal pathway and the cells of origin of the predorsal bundle. J Comp Neurol 226:357–376. [DOI] [PubMed] [Google Scholar]
- McIlwain JT (1982). Lateral spread of neural excitation during microstimulation in intermediate gray layer of cat's superior colliculus. J Neurophysiol 47:167–178. [DOI] [PubMed] [Google Scholar]
- McPeek RM, Keller EL (2002a). Activity related to concurrent processing of saccade goals in a visual search task. J Neurophysiol 87:1805–1815. [DOI] [PubMed] [Google Scholar]
- McPeek RM, Keller EL (2002b). Competition between saccadic goals in the superior colliculus produces saccade curvature. J Neurophysiol 89:2577–2590. [DOI] [PubMed] [Google Scholar]
- Meredith MA, Ramoa AS (1998). Intrinsic circuitry of the superior colliculus: pharmacophysiological identification of horizontally oriented inhibitory interneurons. J Neurophysiol 79:1597–1602. [DOI] [PubMed] [Google Scholar]
- Moschovakis AK, Karabelas AB (1985). Observations on the somatodendritic morphology and axonal trajectory of intracellularly HRP-labeled efferent neurons located in the deeper layers of the superior colliculus of the cat. J Comp Neurol 239:276–308. [DOI] [PubMed] [Google Scholar]
- Moschovakis AK, Karabelas AB, Highstein SM (1988). Structure-function relationships in the primate superior colliculus. I. Morphological classification of efferent neurons. J Neurophysiol 60:232–262. [DOI] [PubMed] [Google Scholar]
- Munoz DP, Istvan PJ (1998). Lateral inhibitory interactions in the intermediate layers of the monkey superior colliculus. J Neurophysiol 79:1193–1209. [DOI] [PubMed] [Google Scholar]
- Munoz DP, Wurtz RH (1995). Saccade-related activity in monkey superior colliculus. II. Spread of activity during saccades. J Neurophysiol 73:2334–2348. [DOI] [PubMed] [Google Scholar]
- Pettit DL, Helms MC, Lee P, Augustine GJ, Hall WC (1999). Local excitatory circuits in the intermediate gray layer of the superior colliculus. J Neurophysiol 81:1424–1427. [DOI] [PubMed] [Google Scholar]
- Port NL, Wurtz RH (2000). Two electrode recordings in monkey superior colliculus during curved saccades. Soc Neurosci Abstr 26:297. [Google Scholar]
- Schiller PH, Koerner F (1971). Discharge characteristics of single units in superior colliculus of the alert rhesus monkey. J Neurophysiol 34:920–936. [DOI] [PubMed] [Google Scholar]
- Schiller PH, Stryker M (1972). Single unit recording and stimulation in superior colliculus of the alert monkey. J Neurophysiol 35:915–924. [DOI] [PubMed] [Google Scholar]
- Sooksawate T, Isa K, Obata K, Yanagawa Y, Isa T (2005). Electrophysiological and morphological properties of GABAergic neurons in the intermediate gray layer of superior colliculus in GAD67-GFP knock-in mice. Soc Neurosci Abstr 31:167.8. [Google Scholar]
- Sparks DL (1978). Functional properties of neurons in the monkey superior colliculus: coupling of neuronal activity and saccade onset. Brain Res 156:1–16. [DOI] [PubMed] [Google Scholar]
- Van Opstal AJ, Van Gisbergen JAM (1989). A nonlinear model for collicular spatial interactions underlying the metrical properties of electrically elicited saccades. Biol Cybern 60:171–183. [DOI] [PubMed] [Google Scholar]
- Wurtz RH, Goldberg MF (1972). Activity of superior colliculus in behaving monkey. III. Cells discharging before eye movements. J Neurophysiol 35:575–586. [DOI] [PubMed] [Google Scholar]