Abstract
The left dorsal premotor cortex (PMd) is thought to play a dominant role in the selection of movements made by either hand. We used transcranial magnetic stimulation to study the functional connectivity of the left PMd and right primary motor cortex (M1) during an acoustic choice reaction time (RT) task involving contraction of the thumb and forefinger. The facilitatory and inhibitory pathways that can be demonstrated between left PMd and right M1 at rest were suppressed during most of the reaction period. However, they were activated briefly at the start of the reaction period, depending on whether the cue indicated that the forthcoming movement had to be made with the left or the right hand. The facilitatory pathway was active at 75 ms in those trials in which the subjects were required to move the left hand, whereas the inhibitory pathway was active at 100 ms in trials in which the subjects had to move the right hand. These changes in excitability did not occur in hand muscles not used in the task. There were no significant changes in the excitability of intracortical circuits [short intracortical inhibition (SICI) and intracortical facilitation (ICF)] in the right M1. Interhemispheric interactions between the right PMd and left M1 were mainly inhibitory at rest and showed the same temporal profile of interhemispheric inhibition as for left PMd–right M1, although no evidence was found for facilitatory interactions. The results illustrate the importance of PMd not only in facilitating cued movements but also in suppressing movements that have been prepared but are not used.
Keywords: premotor cortex, transcranial magnetic stimulation, paired TMS, corticocortical connectivity, movement selection, time
Introduction
Single neuron recording and human neuroimaging studies indicate that the premotor cortex has an important role in the selection of movements for execution. Different parts of the premotor cortex may be related to the selection of different types of movement (Crammond and Kalaska, 1996; Picard and Strick, 2001; Rizzolatti and Luppino, 2001; Toni et al., 2001; Dum and Strick, 2002; Thoenissen et al., 2002). The dorsal premotor cortex (PMd) seems to be involved particularly in the selection of movements according to learned arbitrary associations (Rushworth et al., 2003), in contrast to the ventral premotor areas that are involved in grasping movements triggered by viewing natural objects and body parts.
It has been proposed that the PMd in the left hemisphere is dominant for the selection of actions (Schluter et al., 2001; Rushworth et al., 2003). Functional imaging studies show that, when the subjects have to select between left and right hand movements, the right PMd is active only for movements made by the left hand, whereas the left PMd is active for movements of either hand (Schluter et al., 2001). Similarly, transcranial magnetic stimulation (TMS) of the right PMd only disrupts the selection of left hand movements, whereas TMS of the left PMd disrupts the selection of movements that will be made by either hand (Schluter et al., 1998; Johansen-Berg et al., 2002). In both cases TMS had the largest effect on performance when it was applied in the earlier part of the task in contrast with the disruptive effect of TMS over the primary motor cortex (M1), which is maximal late in the reaction period. Thus activity in the PMd seems crucial during early decisional processes involved in the selection of movements.
Little is known about the neurophysiological mechanisms that are responsible for the influence of the left PMd on movements made by the contralateral M1. However, recent studies show that it may be possible to probe the functional connectivity of these areas in human cortex with the use of paired pulse TMS (ppTMS). Mochizuki and colleagues (2004) found that a conditioning TMS pulse over the right PMd at 90 or 110% of the resting motor threshold (RMT) reduced the amplitude of motor-evoked potentials (MEPs) in hand muscles elicited by a second TMS pulse to the contralateral M1. The effect was seen best if the interstimulus interval (ISI) was 8–10 ms. The opposite effect, facilitation of contralateral MEPs, was found by Bäumer and colleagues (2006) when they applied left PMd conditioning stimuli of lower intensity (80% active motor threshold, AMT) at ISI = 8 ms (Bäumer et al., 2006).
In the present experiments we used these methods to test the connection between the PMd and contralateral M1 during a behavioral task requiring selection of movement. We hypothesized that, if they were physiologically relevant, they would show temporally specific changes in their excitability at times in which the PMd contributes to task performance.
Materials and Methods
Subjects
Fifteen healthy volunteers (seven women and eight men; 21–35 years old) participated in this study. All subjects were right handed, based on the Edinburgh Handedness Inventory, and they all gave written informed consent for the study. The experimental procedures that were used were approved by the local Ethics Committee and were performed in accordance with the Declaration of Helsinki.
Experimental procedure
We used an auditory choice reaction time (RT) task similar to the one adopted in the study by Mochizuki et al. (2005). During all of the experiments the subjects sat relaxed in a comfortable chair, holding a 4-cm-in-diameter block on the table between the thumb and the forefinger of each hand, with the first dorsal interosseous (FDI) muscles relaxed [without any electromyographic (EMG) activity]. The subjects were required to contract the right or left FDI muscle as quickly as possible, performing a rapid isometric squeeze of the block of the left or the right hand as soon they heard a cue sound. Each trial began with an auditory warning (500 Hz, 40 ms). The reaction signal was given randomly 1–3 s later and consisted of either a high-frequency (1000 Hz, 80 ms) or low-frequency (100 Hz, 80 ms) tone pulse that indicated which hand to contract according to the instructions given to the subjects. The intertrial interval was 6 s. At the start of each block of trials the high and low tones were assigned randomly to indicate that the subjects had to react with the right or left hand; these instructions were counterbalanced within and across subjects and were written on a paper that remained in front of the subjects throughout each session (“high right, low left” or “low right, high left”). The order of different experimental blocks was counterbalanced across subjects. Before each test session at least 10 practice trials were given until at least five continuous RTs were within 150% of the mean RT.
EMG traces were recorded bilaterally and simultaneously from the FDI muscles by using 9-mm-in-diameter Ag–AgCl surface cup electrodes. The active electrode was placed over the muscle belly and the reference electrode over the metacarpophalangeal joint of the index finger. The ground electrode was placed over the left wrist. Responses were amplified with a Digitimer D360 amplifier (Welwyn Garden City, Hertfordshire, UK) through filters set at 20 Hz and 2 kHz, with a sampling rate of 5 kHz, and then were recorded by a computer with the use of Signal software (Cambridge Electronic Design, Cambridge, UK). We analyzed the onset latency of electromyography in each trial.
Experiment 1.
Ten subjects participated in this experiment. We used a paired pulse stimulation technique with two high-power Magstim 200 machines (Whitland, Dyfed, UK). The magnetic stimulus had a nearly monophasic pulse configuration, with a rise time of ∼100 μs, decaying back to zero over ∼0.8 ms. TMS was delivered over the M1 of the right hemisphere at different delays (50, 75, 100, 125, 150, 200 ms) after the cue sound (test stimulus, TS). The intensity of TS was adjusted to evoke an MEP of ∼1 mV peak to peak in the relaxed left FDI. In one-half of the trials the M1 TMS was preceded by a conditioning stimulus (CS) delivered 8 ms earlier over the contralateral PMd. The conditioning stimulator was connected to a small custom-made figure-eight-shaped coil (external diameter, 55 mm) to reduce the effective area of stimulation, and the test stimulator was connected to a standard larger figure-eight-shaped coil (external diameter, 70 mm). The coil in M1 always was placed tangentially to the scalp at a 45° angle from midline of the central sulcus, inducing a posterior–anterior current flow.
First the hand motor area of M1 was defined as the point at which stimulation evoked the largest MEP from the contralateral FDI muscle. The coil position for the left premotor TMS then was defined relative to the position of the motor hot spot for the left FDI. A positron emission tomographic study showed that the dorsal premotor cortex is located ∼2 cm anterior to the motor cortex hand area (Fink et al., 1997). To minimize motor cortex activation during premotor TMS, we calculated for each subject 8% of the distance between the nasion and inion (typically ∼3 cm) and defined the premotor area as this distance anterior to the hot spot of the motor cortex hand area (Münchau et al., 2002). The coil was held with the handle pointing laterally to induce a medially directed current in the stimulated cortex. The CS intensity was adjusted to be either high (110% of RMT) or low intensity (80% of AMT). We defined RMT as the lowest intensity that evoked five small responses (∼50 μV) in the contralateral FDI muscle in a series of 10 stimuli in which the subject kept the FDI muscles relaxed in both hands. AMT was the lowest intensity that evoked five small responses (∼200 μV) in a series of 10 stimuli in which the subject made a 5% maximal voluntary contraction. RMT and AMT were tested at the optimal site over the right M1 for eliciting MEP in the left FDI. The experiment was run in two different sessions on different days. In each session we varied the intensity of the CS (110% RMT or 80% AMT); the order of presentation varied pseudorandomly across subjects. Each session consisted of three blocks of 80 trials. In each block the CS preceded the TS in one-half of the trials. The TS was delivered at different delays (50, 75, 100, 125, 150, 200 ms) after the cue sound, and two delays were selected pseudorandomly in each block for each subject. Ten trials were performed for each condition (left or right, TS alone, or TS plus CS). Furthermore, in each session “basal” conditioning effects of PMd on contralateral M1 were measured at rest in a separate block. This block consisted of 20 trials in which the CS preceded TS in one-half of the trials. Measurements were made on each individual trial. The mean peak-to-peak amplitude of the conditioned MEP was expressed as a percentage of the mean peak-to-peak amplitude size of the unconditioned test pulse. Mean RTs also were analyzed for each condition during the task.
Experiment 2.
This control experiment was performed in eight subjects to evaluate the intracortical circuits of right M1 at the crucial delays of 75 and 100 ms, in which significant modulation of the PMd activity was found in the main experiment. ppTMS testing of both short intracortical inhibition (SICI) and intracortical facilitation (ICF) (Kujirai et al., 1993; Rothwell, 1997) was applied over the right M1 during the execution of the choice RT task in eight subjects. Subthreshold CS was set at 70% RMT while the intensity of TS was adjusted to evoke an MEP of ∼1 mV peak to peak in the relaxed left FDI. ISIs of 3 and 10 ms were used to test, respectively, SICI and ICF. The experiment was run in one session. Each session consisted of two blocks of 80 trials. In each block the CS preceded the TS in one-half of the trials. The TS was delivered at different delays (75 and 100 ms) after the cue sound. Ten trials were performed for each condition (left or right, TS alone, or TS plus CS). In one block the ISI was 3 ms and in the other 10 ms. The order of presentation of the blocks varied pseudorandomly across subjects. Measurements were made on each individual trial. The mean peak-to-peak amplitude of the conditioned MEP was expressed as a percentage of the mean peak-to-peak amplitude size of the unconditioned test pulse.
Experiment 3.
To verify whether left PMd transcallosal projections at a particular time in the task select not only which hand (left vs right) to move but also the hand muscle involved in the task, we performed another experiment in eight subjects measuring MEPs recorded from the muscle directly involved in the task (FDI) and from another muscle not activated during the response phase (abductor digiti minimi, ADM). In this experiment the task was modified slightly such that the subjects were required not to squeeze a block on the table between the thumb and the forefinger of each hand but simply to flex the index finger onto the table. This allowed all subjects to produce selective activation of FDI without exciting the ADM. TMS was delivered over M1 of the right hemisphere at the crucial delays of 75 and 100 ms, in which significant modulation of motor cortex by the premotor cortex was found in the main experiment. Two blocks of eight trials were performed. In the first, left PMd conditioning was set at 80% AMT and in the second at 110% RMT. The order of presentation was pseudorandomized across subjects. Ten trials were performed for each condition (left or right FDI and ADM, TS alone, or TS plus CS). Measurements were made on each individual trial. The mean peak-to peak amplitude of the conditioned MEP was expressed as a percentage of the mean peak-to-peak amplitude size of the unconditioned test pulse for each hand muscle (FDI and ADM).
Experiment 4.
This control experiment was similar to experiment 1, except that the right PMd–left M1 connection was investigated in nine subjects (four of whom also took part in experiment 1). TMS was delivered over the left M1 at different delays (50, 75, 100, 125, 150, 200 ms) after the cue sound (TS). The intensity of TS was adjusted to evoke an MEP of ∼1 mV peak to peak in the relaxed right FDI. In one-half of the trials the M1 TMS was preceded by a CS delivered 8 ms earlier over the right PMd. The CS intensity was adjusted to be either high (110% RMT) or low (80% AMT). The experiment was run in two different sessions on different days. In each session we varied the intensity of the CS (110% RMT or 80% AMT); the order of presentation varied pseudorandomly across subjects. Each session consisted of three blocks of 80 trials. In each block the CS preceded the TS in one-half of the trials. The TS was delivered at different delays (50, 75, 100, 125, 150, 200 ms) after the cue sound, and two delays were selected pseudorandomly in each block for each subject. Ten trials were performed for each condition (left or right, TS alone, or TS plus CS). In each session basal conditioning effects of PMd on contralateral M1 were measured at rest in a separate block. This block consisted of 20 trials in which the CS preceded the TS in one-half of the trials. Measurements were made on each individual trial. The mean peak-to-peak amplitude of the conditioned MEP was expressed as a percentage of the mean peak-to-peak amplitude size of the unconditioned test pulse.
Data analysis
In experiments 1 and 4 the conditioning effects at rest of PMd on contralateral M1 set at different intensities (80% AMT and 110% RMT) were analyzed, with paired t test performed on mean MEP amplitudes obtained from unconditioned and conditioned MEPs.
In experiments 1 and 4 to evaluate the temporal profile of M1 excitability during the execution of the task, we performed an ANOVA with time (50, 75, 100, 125, 150, 200 ms) and hand (left vs right) on the mean MEP amplitudes obtained in all sessions.
The effects of paired stimulation of the left or right PMd on the size of the MEPs recorded from the contralateral FDI were analyzed as the percentage of the mean peak-to-peak amplitude of the unconditioned TS. For the choice RT task the mean percentage values were analyzed with a repeated measures ANOVA with time (50, 75, 100, 125, 150, 200 ms), intensity (110% RMT vs 80% AMT), and hand (left vs right) as within-subjects main factors. The same analysis was conducted on mean RTs. Furthermore, four separate ANOVAs with time as main factors were run, one for each condition of PMd stimulation (high and low intensity) and for each side (left and right hand) to define the specific time course of activation of the transcallosal projections during the task. In experiment 2 the amount of SICI and ICF was assessed via an ANOVA with time (75 vs 100 ms), ISI (3 vs 10 ms), and hand (left vs right) performed on the mean percentage for each condition with respect to the mean peak-to-peak amplitude size of the unconditioned test pulse.
In experiment 3 the analysis was for focused selectivity on the crucial time points of 75 and 100 ms in which transcallosal inhibition and facilitation were seen in the main experiment. Thus for the 75 ms delay we analyzed the effects induced by low-intensity left PMd conditioning on both FDI and ADM MEP amplitudes when the subjects selected to move the left hand. For the 100 ms delay we analyzed data obtained when the left PMd was conditioned at 110% RMT and the subjects selected right hand movements. We performed an ANOVA with hand muscle (FDI vs ADM) and intensity (110% RMT vs 80% AMT) on the percentage of the mean peak-to-peak amplitude of the unconditioned TS for each hand muscle.
Mauchley’s test was used to examine for sphericity. A p value < 0.05 was considered significant. A significant main effect in the ANOVA was followed by post hoc paired t test analysis. The Greenhouse–Geisser correction was used for nonspherical data.
Results
The procedure was well tolerated by all subjects. The mean RMT across all subjects for the right M1 was 44 ± 5.6%, and AMT was 36 ± 5.6% of maximal stimulator output. In the left hemisphere mean RMT was 38 ± 6.7%, and AMT was 32 ± 4.3%. As reported previously by Mochizuki et al. (2004) and Bäumer et al. (2006) in subjects at complete rest, conditioning stimuli over the left PMd at 80% AMT increased the MEP evoked from the right M1 by 28% (control, 1.25 ± 0.38 mV, vs conditioned, 1.55 ± 0.44 mV; p = 0.01; paired t test), whereas if the intensity of the CS was increased to 110% RMT, then the MEPs were reduced in amplitude by 22% (1.05 ± 0.31 vs 0.86 ± 0.36 mV; p = 0.01; paired t test) (Fig. 1C,D).
Figure 1.
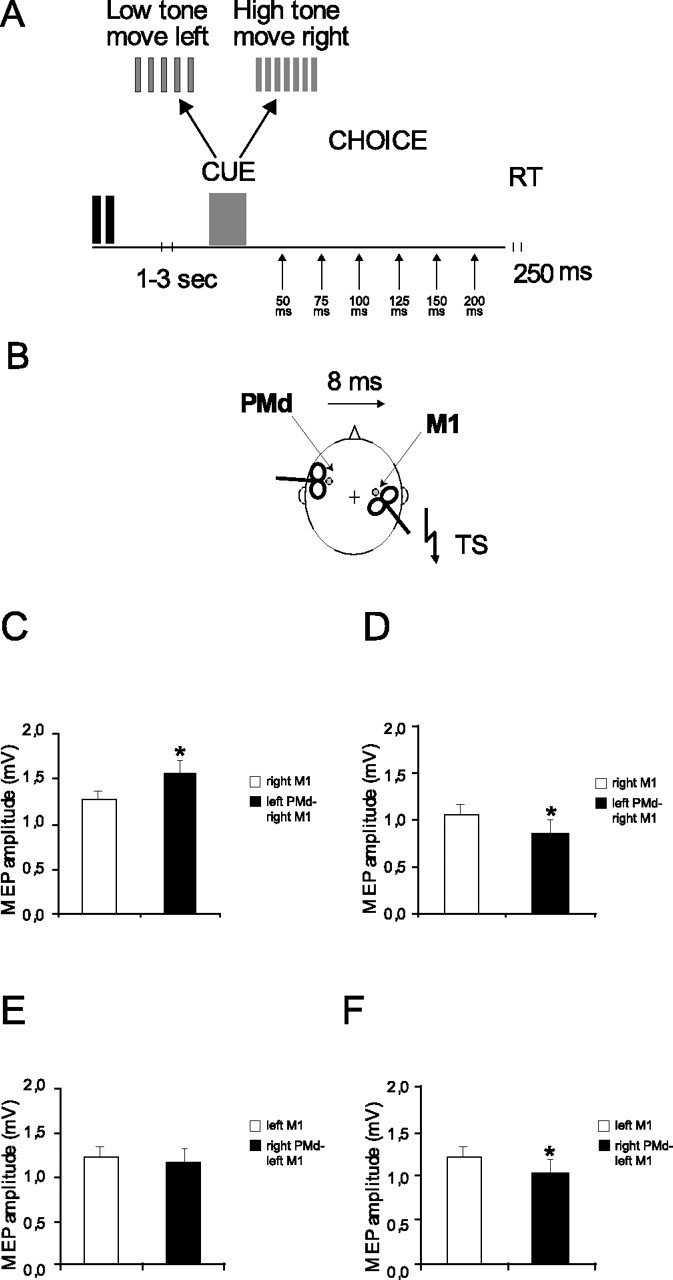
Schematic representation of the experimental procedure. A, Subjects were required to activate the right or left FDI muscle as quickly as possible, performing a rapid isometric contraction of either hand as soon they heard a cue sound. Each trial began with an auditory warning. The reaction signal was given randomly 1–3 s later and consisted of either a high- or low-frequency tone pulse that indicated which hand to contract according to the instructions given to the subjects. The intertrial interval was 6 s. At the start of each block of trials the high and low tones were assigned randomly to indicate that the subjects had to react with the right or left hand (choice RT). TMS was delivered over the left or right M1 at different delays (50, 75, 100, 125, 150, 200 ms) after the cue sound (TS). The intensity of the TS was adjusted to evoke an MEP of ∼1 mV peak to peak in the relaxed left FDI. In one-half of the trials the M1 TMS was preceded by a CS delivered 8 ms earlier over the contralateral PMd (B). At rest the CS over the left PMd at 80% AMT increased the MEPs evoked from the right M1 by 28% (C), whereas if the intensity of the CS was increased to 110% RMT, then the MEPs were reduced in amplitude by 22% (D). Conditioning the right PMd at 80% AMT had no effect on MEPs from the left M1 (E). However, conditioning stimuli at 110% RMT led to a decrease by 18% in MEPs from the left M1 (F). Asterisks indicate significance at p < 0.05 (paired t test). Error bars indicate SEM.
Experiment 1. Left PMd–right M1 during reaction time
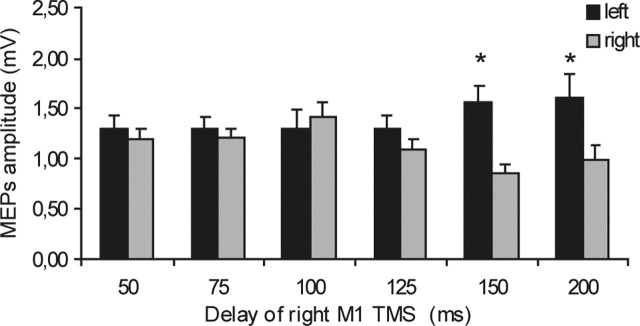
We then examined how the strength of these connections changed during the reaction task. We show first the excitability of the right motor cortex alone (i.e., unconditioned by the left PMd). Figure 2, displaying the mean data from all subjects, shows that there was a significant change in the amplitude of the MEPs evoked in the left FDI at different intervals after the reaction signal. A two-factor ANOVA revealed a significant time × hand interaction (F = 6.57; p < 0.005), although the main factors of time and hand were not significant. Post hoc paired t tests showed that MEPs in the left FDI were larger when the left hand was selected to move in comparison to the right at intervals of 150 ms (t = −4.07; p = 0.002) and 200 ms (t = −2.36; p = 0.04). There was no difference at earlier delays of 50, 75, 100, and 125 ms.
Figure 2.
Time course of the excitability of the right motor cortex at different delays from the acoustic cue during the choice RT task. Unconditioned mean MEP amplitudes from the left FDI were obtained in all sessions. Motor cortex excitability changed, depending on which hand was selected for movement. A significant difference among sides emerged at later delays of 150 and 200 ms, with an opposite trend toward increase for the left hand and toward reduction for the right hand. Asterisks indicate a significant value at paired t test; p < 0.05. Error bars indicate SEM.
Figures 3 and 4 illustrate the effect on the amplitude of these MEPs of a conditioning pulse over the left PMd during movement selection. Figure 3 shows data from the experiments in which the intensity of the CS was 80% AMT, whereas Figure 4 shows data for a CS of 110% AMT. In each figure panels A and B plot the amplitude of the test and conditioned MEP responses. Panel C plots the amplitude of the conditioned response as a percentage of the test at each interval. An ANOVA of this percentage data showed that the main factors of intensity (F = 9.54; p < 0.01), hand (F = 6.12; p < 0.05), and time (F = 3.77; p < 0.01) were all significant. The triple interaction intensity × hand × time was significant as well (F = 2.62; p < 0.05). Post hoc analysis showed that interhemispheric facilitation (using a conditioning intensity of 80% AMT) occurred selectively when tested 75 ms after the auditory reaction signal in trials in which the left hand was to move (Fig. 3C). This was confirmed in the statistical analysis, first by separate one-factor ANOVAs showing a significant main effect of time (F = 5.61; p < 0.001) for left hand, but not right hand, movements. Post hoc t tests confirmed that this was attributable to a significant (t = −3.37; p = 0.008) facilitation at 75 ms. In contrast, Figure 4C shows that interhemispheric inhibition (using a conditioning intensity of 110% RMT) occurred selectively when tested 100 ms after the auditory cue in trials in which the subjects were required to move the right hand. Thus the one-factor ANOVA showed a significant effect of time only for right hand movements (F = 3.67; p < 0.01) that was attributable to significant inhibition at 100 ms (t = −4.47; p = 0.002). The results were confirmed by conducting a paired t test on the amplitude of test and conditioned MEPs at different time intervals. There was significant facilitation at 75 ms for left hand movements (t = −3.28; p = 0.001) (Fig. 3A) and inhibition at 100 ms for right hand movements (t = −2.71; p = 0.023) (Fig. 4B).
Figure 3.
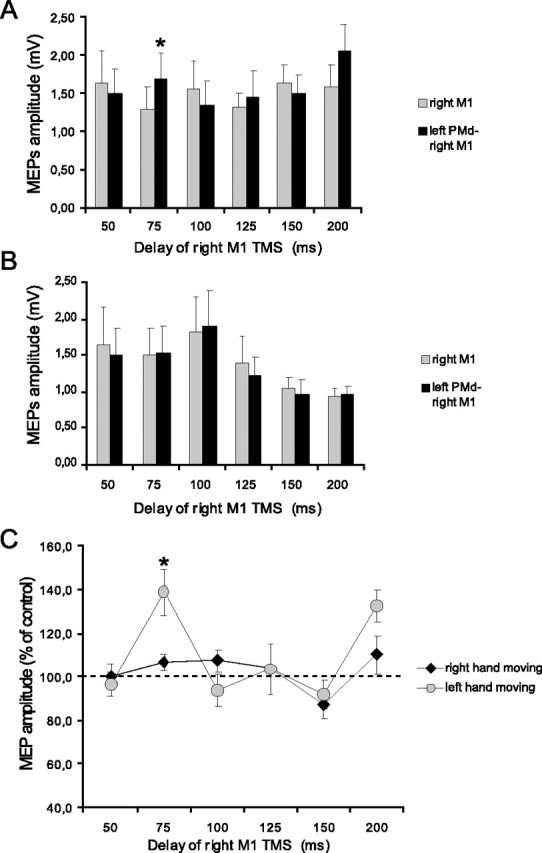
Effects of low-intensity (80% AMT) left PMd conditioning on contralateral M1 excitability at different delays after the cue signal. A, B, MEP amplitudes recorded from the left FDI during either condition (single TMS or ppTMS) at different time points at which the left (A) or the right (B) hand was selected for movement. C, Mean percentage values of the change on MEP amplitudes during left PMd conditioning. Significant transcallosal facilitation was observed only at 75 ms when the left hand was to move. Asterisks indicate a significant value at paired t test; p < 0.05. Error bars indicate SEM.
Figure 4.
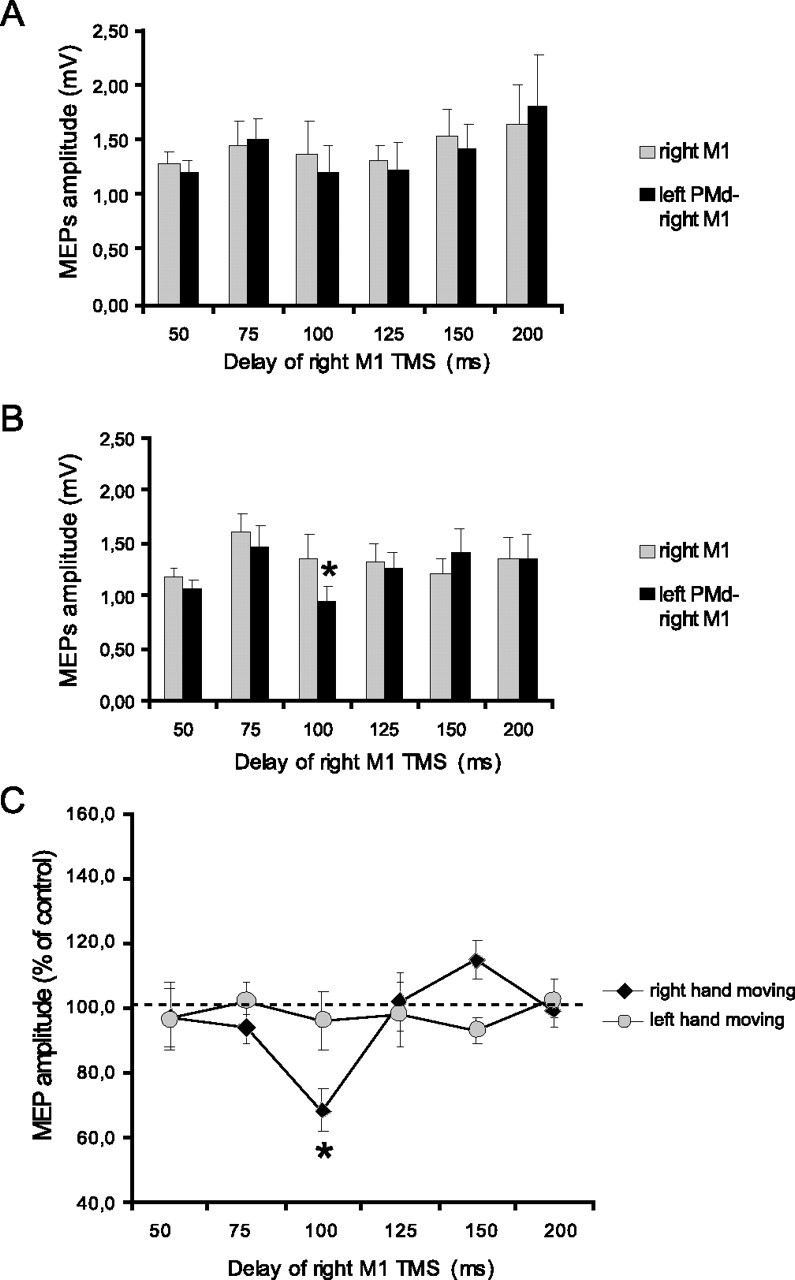
Effects of high-intensity (110% AMT) left PMd conditioning on contralateral M1 excitability at different delays after the cue signal. A, B, MEP amplitudes recorded from the left FDI during either condition (single TMS or ppTMS) at different time points at which the left (A) or the right (B) hand was selected for movement. C, Mean percentage values of the change on MEP amplitudes during left PMd conditioning. Significant transcallosal inhibition was observed only at 100 ms when the right hand was to move. Asterisks indicate a significant value at paired t test; p < 0.05. Error bars indicate SEM.
The amount of facilitation obtained at 75 ms when the left hand was to move and the amount of inhibition obtained at 100 ms when the right hand was to move did not differ significantly from data obtained at rest in the same subjects, although in both cases there was a trend toward stronger facilitation [128 ± 39% (rest) vs 139 ± 33% (task); p = 0.2; paired t test] or inhibition [78 ± 16% (rest) vs 66 ± 18% (task); p = 0.1; paired t test].
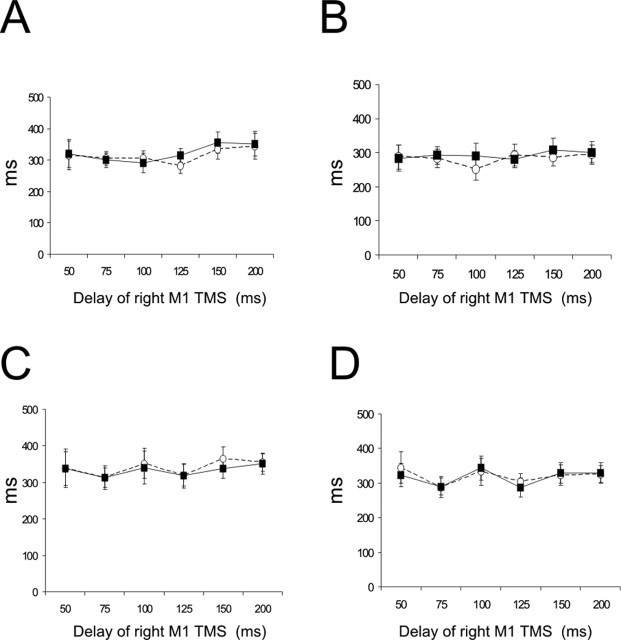
Figure 5 shows the mean RTs of all subjects in each condition as a function of the timing of the TMS pulses. There was no significant effect of TMS delay, intensity of stimulation, or side of the hand movement.
Figure 5.
Mean RTs in different experimental conditions. No significant effect was induced by PMd conditioning. A, B, Values for high-intensity stimulation (110% RMT) when the left (A) or the right (B) hand was selected for movement. C, D, Mean RT for low-intensity (80% AMT) PMd conditioning in which the left (C) or the right (D) hand had to move. Open circles indicate values obtained during the right M1 stimulation and filled circles during the paired PMd–M1 TMS. Error bars indicate SEM.
Experiment 2. M1 intracortical effects during reaction time
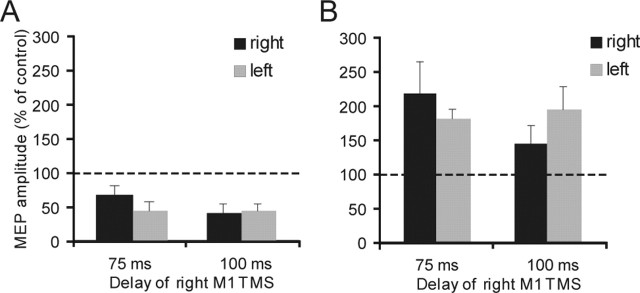
An ANOVA with time (75 vs 100 ms), ISI (3 vs 10 ms), and hand (left vs right) as main factors showed that intracortical circuits in the right M1 behaved in quite a different way from the interhemispheric connection between the left PMd and right M1. As expected, there was a significant effect of ISI (F = 31.17; p < 0.0001), although the main factors of time and hand were not significant. The triple interaction of time × ISI × hand failed to reach significance. Interestingly, strong ICF was found in this earlier phase at 75 and 100 ms after the acoustic cue, but no significant difference emerged across hands (Fig. 6).
Figure 6.
Mean percentage values of the change on MEP amplitudes for SICI at 3 ms ISI (A) and ICF at 10 ms ISI (B) obtained in experiment 2 with ppTMS of the right M1. Strong inhibition and facilitation were found, although no difference across time and sides emerged. Black bars indicate an instruction to move right; gray bars indicate an instruction to move left. Error bars indicate SEM.
Experiment 3. Muscle specificity of PMd effects
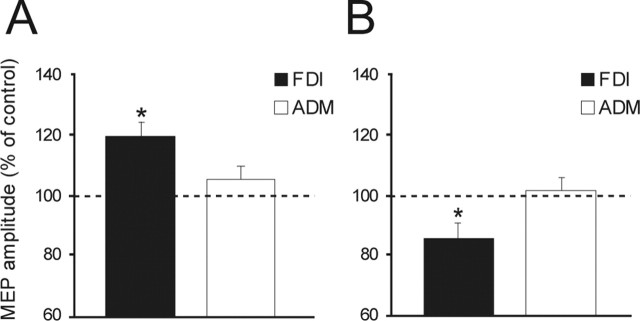
Figure 7 illustrates that the transcallosal interactions are also specific for the hand muscle used in an intended movement. An ANOVA of the data showed that the main factors of intensity (F = 4.34; p < 0.05) and the interaction of hand muscle × intensity (F = 7.21; p < 0.001) were significant. Post hoc analysis showed that interhemispheric facilitation (using a conditioning intensity of 80% AMT) occurred selectively for the FDI when tested 75 ms after the auditory reaction signal in trials in which the left hand was to move (FDI vs ADM; p < 0.001); similarly, transcallosal inhibition was found only for the FDI, but not ADM, when tested after 100 ms when the right hand was to move (FDI vs ADM; p < 0.005).
Figure 7.
Effects of interhemispheric projections on the excitability of left FDI and ADM hand muscles recorded at critical points of 75 ms after the cue sound with a low CS intensity (80% AMT) in which the left hand is selected (A) and at 100 ms delay with a high CS intensity (110% RMT) in which the right hand is chosen for movement (B). In both conditions the effects are observable only for FDI, but not for ADM. Asterisks indicate a significant value at post hoc analysis; p < 0.05. Error bars indicate SEM.
Experiment 4. Right PMd–left M1 at rest and during reaction time
In subjects at rest, conditioning the right PMd at 110% RMT led to a decrease in MEPs from the left M1 by 18% (control, 1.24 ± 0.31 mV, vs conditioned, 1.05 ± 0.35 mV; p = 0.01, paired t test). However, conditioning stimuli at 80% AMT had no effect on MEPs from the left M1 (1.23 ± 0.34 vs 1.17 ± 0.41 mV; not significant; paired t test) (Fig. 1E,F). Figures 8 and 9 illustrate the effect on the amplitude of these MEPs of a conditioning pulse over the right PMd during movement selection. Figure 8 shows data from the experiments in which the intensity of the CS was 80% AMT, whereas Figure 9 shows data for a CS of 110% RMT. In each figure panels A and B plot the amplitude of the test and conditioned MEP responses. Panel C plots the amplitude of the conditioned response as a percentage of the test at each interval. An ANOVA of this percentage data showed that the main factors of time (F = 2.62; p < 0.05) and the interaction of hand × time (F = 2.92; p < 0.05) were significant. The triple interaction of intensity × hand × time was not significant. Because we did not observe any effect at rest after conditioning the right PMd at 80% AMT, we performed two different ANOVAs for each intensity of stimulation with hand and time as main factors. In this case the analysis of data obtained from 80% AMT showed no significant effect, whereas there was a significant main effect of time (F = 3.65; p < 0.05) and a hand × time interaction, using conditioning stimuli of 110% RMT (F = 2.82; p < 0.05). Post hoc analysis showed that, as with left PMd conditioning, interhemispheric inhibition with the use of a conditioning intensity of 110% RMT over the right PMd occurred selectively when tested 100 ms after the auditory cue in trials in which the subjects were required to move the contralateral left hand (t = 3.74; p = 0.007) (Fig. 9C). The results were confirmed by conducting paired t tests on the amplitude of test and conditioned MEPs at different time intervals. There was significant inhibition only at 100 ms for left hand movements (t = −2.71; p = 0.02) (Fig. 9B). In this case the amount of inhibition obtained at 100 ms before left hand movement was significantly larger than that observed at rest in the same subjects [82.8 ± 14.9% (rest) vs 63.9 ± 23.1% (task); p = 0.02; paired t test].
Figure 8.
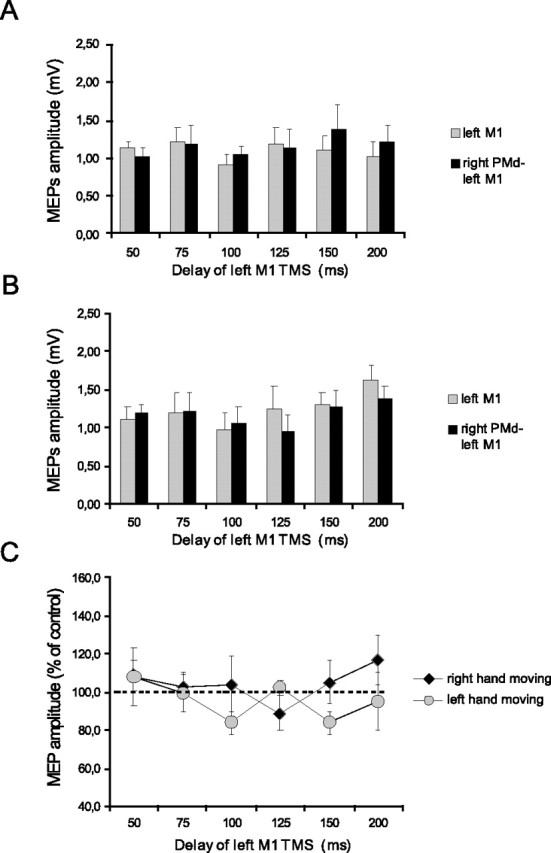
Effects of low-intensity (80% AMT) right PMd conditioning on contralateral M1 excitability at different delays after the cue signal. A, B, MEP amplitudes recorded from the right FDI during either condition (single TMS or ppTMS) at different time points at which the left (A) or the right (B) hand was selected for movement. C, Mean percentage values of the change on MEP amplitudes during right PMd conditioning. No significant effect was observed during the task. Error bars indicate SEM.
Figure 9.
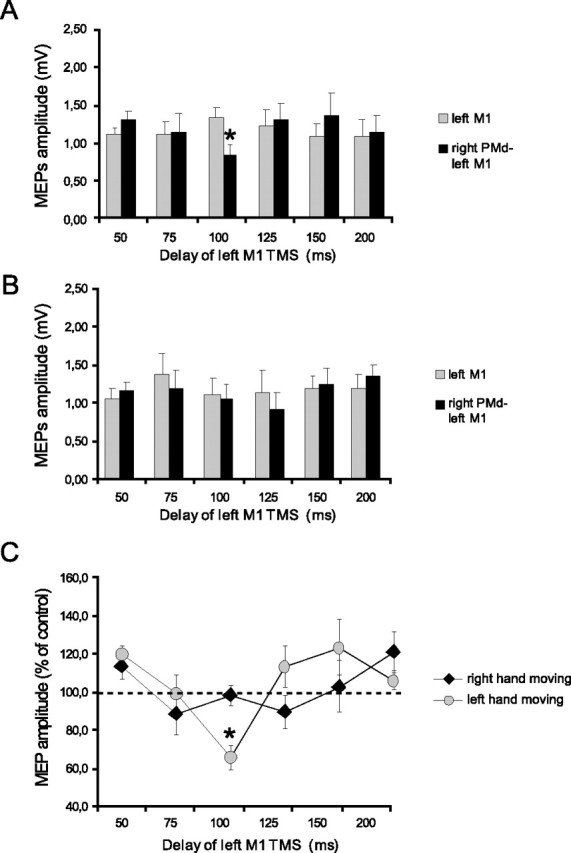
Effects of high-intensity (110% AMT) right PMd conditioning on contralateral M1 excitability at different delays after the cue signal. A, B, MEP amplitudes recorded from the right FDI during either condition (single TMS or ppTMS) at different time points at which the left (A) or the right (B) hand was selected for movement. C, Mean percentage values of the change on MEP amplitudes during right PMd conditioning. Significant transcallosal inhibition was observed only at 100 ms when the left hand was to move. Asterisks indicate a significant value at paired t test; p < 0.05. Error bars indicate SEM.
Discussion
Our results demonstrate that the interhemispheric interactions between the left PMd and the right M1 previously observed at rest change their excitability during the reaction period of an auditory cued choice reaction task. Facilitatory connections are evident 75 ms after a tone that indicates the subjects should move the left hand, whereas inhibitory connections manifest at 100 ms after a tone indicating a movement of the right hand. These connections are modulated only for muscles that might be involved in the upcoming movement; no effects are observed in noninvolved muscles. The changes occur early in the reaction period at a time in which the PMd is thought to contribute importantly to task performance. In contrast, results obtained from the right PMd conditioning the left M1 were slightly different. The interhemispheric interactions between right PMd and left M1 at rest were mainly inhibitory, and a similar profile of transcallosal inhibition as with left PMd–right M1 interactions was observed during the reaction period of the task. No facilitation was evident at any time. We suggest that the contribution of PMd to control of movements of the ipsilateral hand is attributable at least in part to activity in these pathways. The data show that the left, but not right, PMd may facilitate movements of ipsilateral hand that are about to be made and that PMd of both hemispheres also may suppress movements that have been prepared but are not used.
Changes in excitability of right M1 in the absence of conditioning stimuli to left PMd
As reported previously in both in humans and primates (Crammond and Kalaska, 1996; Reynolds and Ashby, 1999), corticospinal excitability, as assessed by the amplitude of the MEPs, increased just before the onset of movements of the left hand and decreased before movements of the right hand. However, the changes occur late in the reaction period, well after the changes in connectivity from PMd. This indicates that they have a different mechanism from, and that they cannot account for, the changes in excitability of PMd–M1 connections detected with the paired pulse method. We also tested the excitability of intracortical connectivity within the M1 at the times in which PMd connectivity was varying. SICI and ICF were unchanged at these intervals in the reaction period, again compatible with the idea that time-varying changes in connections from PMd–M1 are attributable to effects within the PMd itself rather than on circuitry that receives these connections within M1.
Timing of changes in PMd–M1 connectivity
The specific timing of PMd activation found in our study is in agreement with previous TMS investigations (Schluter et al., 1998; Johansen-Berg et al., 2002) that showed that interference with performance in a visually cued choice RT was observed when high-intensity TMS was applied over the left PMd early in the reaction period. Reaction times in both hands were increased if TMS was delivered to the left PMd 100–140 ms after the visual cue, whereas no effect occurred for later delays up to 300 ms (Schluter et al., 1998; Johansen-Berg et al., 2002). Although the effects in the present experiment occurred at a similar interval, the TMS pulses did not change the subjects’ reaction times. This is probably because the intensity of the stimuli was much lower than in the studies of Schluter and colleagues (1998), who delivered TMS at 70–80% of maximum stimulator output, and of Johansen-Berg and colleagues (2002), who stimulated PMd at 120% RMT. Higher intensities are more effective in disrupting cortical activity; we specifically used low intensities to activate specific neural pathways between the PMd and M1.
The timings were also compatible with a recent investigation of Cisek and Kalaska (2005), who showed that neural discharge in the PMd of primates initially reflects both possible options in a choice RT and then later reflects the selection between them. The critical latency at which the neural population that was studied discriminated among the two possible movements was 110 ms. On the basis of these findings, Cisek and Kalaska (2005) proposed a model in which multiple reach options are specified initially and gradually are eliminated as more information accumulates. It may be that the excitability of PMd–M1 connections changes at this time, and information about movement choice is transmitted to M1.
In addition to confirming the role of PMd in choosing between alternative actions, the data also demonstrate that PMd may be involved not only in facilitating one action but also in suppressing its alternatives. If these processes are triggered by the same circuitry, then it may explain why the subjects in the present task usually move either one or the other hand but rarely/never move both hands, even in error. This does not involve simply suppressing all movements of the left hand when the right has to move (or the opposite in case of right PMd involvement); only movements that have had advance preparation are suppressed. Thus for our index flexion task only the connections to FDI were modulated according to task, whereas those of the noninvolved ADM were unaffected. Indeed, the latter remained unresponsive throughout the whole reaction task. This result suggests that the interhemispheric projections from PMd to M1 have both a specific time course and spatial selectivity. In the primary motor cortex the intracortical circuitry as studied with SICI plays a crucial spatial and temporal role in modulating cortical output to produce the intended movement (Floeter and Rothwell, 1999; Reynolds and Ashby, 1999). It may be that interhemispheric PMd–M1 projections are equally essential in selecting between prepared alternatives in a choice reaction task.
Lack of effect of PMd stimulation at other times in the reaction period
Although significant transcallosal inhibition and facilitation occurred, as predicted, in the early phase of the task, the complete lack of any effect at the other time points was unexpected. This occurred for left PMd conditioning despite the fact that the same stimuli applied in the subjects at rest gave the appropriate amount of facilitation or inhibition. We can only speculate on why this should occur. One possibility is that, as postulated by Cisek and Kalaska (2005), presentation of the reaction cue leads initially to specification of both left and right hand movements in the PMd, and over time one of them is eliminated, corresponding to selection of the final movement. It may be that during this period connectivity with the M1 is suppressed and then opened only at the time the correct movement has been specified. This time would correspond to the peaks in excitability of inhibitory and excitatory connections that we have noted.
Lack of facilitatory right PMd–left M1 interactions
Although similar inhibitory effects were found for the high intensity of PMd stimulation of both hemispheres at rest and during the reaction period of the task, facilitation was evident only after the left PMd was conditioned. It well may be that such asymmetry could be involved in the left PMd dominance for selection of actions (Schluter et al., 2001; Rushworth et al., 2003). However, the present study is the first to investigate possible right PMd–left M1 facilitatory interactions, because in their original study Bäumer and colleagues (2006) examined only the left PMd. Therefore, although our study seems to suggest that the left PMd has a prominent role in facilitating movement of the ipsilateral hand, we cannot exclude that the lack of facilitatory interactions after right PMd conditioning depends on the fact that projections originating from the right PMd may have different patterns of excitability. Additional experiments with careful investigation of conditioning intensity and coil orientation are needed to address this possibility in detail.
Pathways responsible for conditioning effects from PMd to contralateral M1
As outlined by Mochizuki and colleagues (2004) in their original paper, PMd–M1 interhemispheric effects are thought to be attributable primarily to activity in a transcallosal pathway that leads to changes in the excitability of the M1 hand area. Such an explanation is compatible with the existence of commissural fibers from the PMd to contralateral premotor cortex, M1, and the supplementary motor area in monkeys (Marconi et al., 2003). However, Dum and Strick (2005) recently showed that M1, the PMd, and the ventral premotor cortex form a densely ipsilateral interconnected network in which the direction of information flow is as likely to be from M1 to the premotor areas as it is from the premotor areas to M1. It is possible that the effect of a premotor cortex conditioning stimulation on contralateral motor cortex could be mediated by either direct or indirect connections running via the other premotor cortex or the other motor cortex.
In conclusion, the data demonstrate that PMd either may facilitate or may inhibit prepared movements in the contralateral motor cortex. These processes have a specific time course and occur in the early stage of the decisional process. Because of the evidence that PMd plays an important role in adaptive processes after stroke (Weiller et al., 1992; Johansen-Berg et al., 2002; Fridman et al., 2004) and degenerative processes in movement disorders (Ceballos-Baumann et al., 1995; Haslinger et al., 2001; Siebner et al., 2003; Buhmann et al., 2004), understanding the functional interactions within the motor system may be helpful in studying these mechanisms of plasticity and reorganization.
Footnotes
This work was supported by the Medical Research Council, United Kingdom. M.F.D.O. was supported by the Secretary of State of Education and University, Spain. We thank Mr. Peter Asselman for his constant and helpful technical support.
References
- Bäumer T, Bock F, Koch G, Lange R, Rothwell JC, Siebner HR, Münchau A (2006). Magnetic stimulation of human premotor or motor cortex produces interhemispheric facilitation through distinct pathways. J Physiol (Lond) 572:857–868. [DOI] [PMC free article] [PubMed] [Google Scholar]
- Buhmann C, Gorsler A, Bäumer T, Hidding U, Demiralay C, Hinkelmann K, Weiller C, Siebner HR, Münchau A (2004). Abnormal excitability of premotor–motor connections in de novo Parkinson’s disease. Brain 127:2732–2746. [DOI] [PubMed] [Google Scholar]
- Ceballos-Baumann AO, Passingham RE, Warner T, Playford ED, Marsden CD, Brooks DJ (1995). Overactive prefrontal and underactive motor cortical areas in idiopathic dystonia. Ann Neurol 37:363–372. [DOI] [PubMed] [Google Scholar]
- Cisek P, Kalaska JF (2005). Neural correlates of reaching decisions in dorsal premotor cortex: specification of multiple direction choices and final selection of action. Neuron 45:801–814. [DOI] [PubMed] [Google Scholar]
- Crammond DJ, Kalaska JF (1996). Differential relation of discharge in primary motor cortex and premotor cortex to movements versus actively maintained postures during a reaching task. Exp Brain Res 108:45–61. [DOI] [PubMed] [Google Scholar]
- Dum RP, Strick PL (2002). Motor areas in the frontal lobe of the primate. Physiol Behav 77:677–682. [DOI] [PubMed] [Google Scholar]
- Dum RP, Strick PL (2005). Frontal lobe inputs to the digit representations of the motor areas on the lateral surface of the hemisphere. J Neurosci 25:1375–1386. [DOI] [PMC free article] [PubMed] [Google Scholar]
- Fink GR, Frackowiak RS, Pietrzyk U, Passingham RE (1997). Multiple nonprimary motor areas in the human cortex. J Neurophysiol 77:2164–2174. [DOI] [PubMed] [Google Scholar]
- Floeter MK, Rothwell JC (1999). Releasing the brakes before pressing the gas pedal. Neurology 53:664–665. [DOI] [PubMed] [Google Scholar]
- Fridman EA, Hanakawa T, Chung M, Hummel F, Leiguarda RC, Cohen LG (2004). Reorganization of the human ipsilesional premotor cortex after stroke. Brain 127:747–758. [DOI] [PubMed] [Google Scholar]
- Haslinger B, Erhard P, K←mpfe N, Boecker H, Rummeny E, Schwaiger M, Conrad B, Ceballos-Baumann AO (2001). Event-related functional magnetic resonance imaging in Parkinson’s disease before and after levodopa. Brain 124:558–570. [DOI] [PubMed] [Google Scholar]
- Johansen-Berg H, Rushworth MF, Bogdanovic MD, Kischka U, Wimalaratna S, Matthews PM (2002). The role of ipsilateral premotor cortex in hand movement after stroke. Proc Natl Acad Sci USA 99:14518–14523. [DOI] [PMC free article] [PubMed] [Google Scholar]
- Kujirai T, Caramia MD, Rothwell JC, Day BL, Thompson PD, Ferbert A, Wroe S, Asselman P, Marsden CD (1993). Corticocortical inhibition in human motor cortex. J Physiol (Lond) 471:501–519. [DOI] [PMC free article] [PubMed] [Google Scholar]
- Marconi B, Genovesio A, Giannetti S, Molinari M, Caminiti R (2003). Callosal connections of dorso-lateral premotor cortex. Eur J Neurosci 18:775–788. [DOI] [PubMed] [Google Scholar]
- Mochizuki H, Huang YZ, Rothwell JC (2004). Interhemispheric interaction between human dorsal premotor and contralateral primary motor cortex. J Physiol (Lond) 561:331–338. [DOI] [PMC free article] [PubMed] [Google Scholar]
- Mochizuki H, Franca M, Huang YZ, Rothwell JC (2005). The role of dorsal premotor area in reaction task: comparing the “virtual lesion” effect of paired pulse or theta burst transcranial magnetic stimulation. Exp Brain Res 167:414–421. [DOI] [PubMed] [Google Scholar]
- Münchau A, Bloem B, Irlbacher K, Trimble MR, Rothwell JC (2002). Functional connectivity of human premotor and motor cortex explored with repetitive transcranial magnetic stimulation. J Neurosci 22:554–561. [DOI] [PMC free article] [PubMed] [Google Scholar]
- Picard N, Strick PL (2001). Imaging the premotor areas. Curr Opin Neurobiol 11:663–672. [DOI] [PubMed] [Google Scholar]
- Reynolds C, Ashby P (1999). Inhibition in the human motor cortex is reduced just before a voluntary contraction. Neurology 53:730–735. [DOI] [PubMed] [Google Scholar]
- Rizzolatti G, Luppino GR (2001). The cortical motor system. Neuron 31:889–901. [DOI] [PubMed] [Google Scholar]
- Rothwell JC (1997). Techniques and mechanisms of action of transcranial stimulation of the human motor cortex. J Neurosci Methods 74:113–122. [DOI] [PubMed] [Google Scholar]
- Rushworth MF, Johansen-Berg H, Gobel SM, Devlin JT (2003). The left parietal and premotor cortices: motor attention and selection. NeuroImage 20:S89–S100. [DOI] [PubMed] [Google Scholar]
- Schluter ND, Rushworth MF, Passingham RE, Mills KR (1998). Temporary interference in human lateral premotor cortex suggests dominance for the selection of movements. A study using transcranial magnetic stimulation. Brain 121:785–799. [DOI] [PubMed] [Google Scholar]
- Schluter ND, Krams M, Rushworth MF, Passingham RE (2001). Cerebral dominance for action in the human brain: the selection of actions. Neuropsychologia 39:105–113. [DOI] [PubMed] [Google Scholar]
- Siebner HR, Filipovic SR, Rowe JB, Cordivari C, Gerschlager W, Rothwell JC, Frackowiak RS, Bhatia KP (2003). Patients with focal arm dystonia have increased sensitivity to slow-frequency repetitive TMS of the dorsal premotor cortex. Brain 126:2710–2725. [DOI] [PubMed] [Google Scholar]
- Thoenissen D, Zilles K, Toni I (2002). Differential involvement of parietal and precentral regions in movement preparation and motor intention. J Neurosci 22:9024–9034. [DOI] [PMC free article] [PubMed] [Google Scholar]
- Toni I, Thoenissen D, Zilles K (2001). Movement preparation and motor intention. NeuroImage 14:S110–S117. [DOI] [PubMed] [Google Scholar]


