

Abstract
Brain size is precisely regulated during development and involves coordination of neural progenitor cell proliferation, differentiation, and survival. The adapter protein ShcA transmits signals from receptor tyrosine kinases via MAPK (mitogen-activated protein kinase)/ERK (extracellular signal-regulated kinase) and PI3K (phosphatidylinositol 3-kinase)/Akt signaling pathways. In the CNS, ShcA expression is high during embryonic development but diminishes as cells differentiate and switches to ShcB/Sck/Sli and ShcC/N-Shc/Rai. To directly test ShcA function in brain development, we used Cre/lox technology to express a dominant-negative form of ShcA (ShcFFF) in nestin-expressing neural progenitors. ShcFFF-expressing mice display microencephaly with brain weights reduced to 50% of littermate controls throughout postnatal and adult life. The cerebrum appeared most severely affected, but the gross architecture of the brain is normal. Body weight was mildly affected with a delay in reaching mature weight. At a mechanistic level, the ShcFFF microencephaly phenotype appears to be primarily attributable to elevated apoptosis levels throughout the brain from embryonic day 10.5 (E10.5) to E12, which declined by E14.5. Apoptosis remained at normal basal levels throughout postnatal development. Proliferation indices were not significantly altered in the embryonic neuroepithelium or within the postnatal subventricular zone. In another approach with the same nestin-Cre transgene, conditional deletion of ShcA in mice with a homozygous floxed shc1 locus also showed a similar microencephaly phenotype. Together, these data suggest a critical role for ShcA in neural progenitor survival signaling and in regulating brain size.
Keywords: ShcA, survival, signaling, apoptosis, microencephaly, neural progenitors
Introduction
The size of the mammalian brain depends on a strictly controlled balance between cell proliferation and apoptosis. Mutations affecting either of these processes have dramatic effects on brain size. For example, null mutations of caspase-3 or caspase-9 (Kuida et al., 1996, 1998; Pompeiano et al., 2000) cause an enlarged forebrain because of the lack of normal neural progenitor apoptosis during development. Conversely, null mutations in the proto-oncogene Ski (Berk et al., 1997), the transcription factor AP-2 (Schorle et al., 1996), as well as the double null mutant combination of Jnk1 and Jnk2 cause an increase in apoptosis in the forebrain accompanied by a severely reduced embryonic brain size (Sabapathy et al., 1999).
Here, we present a new role for the adapter protein ShcA in the survival of neuronal progenitors. ShcA transmits extracellular signals from transmembrane surface receptors to mitogen-activated protein kinase (MAPK)/extracellular signal-regulated kinase (ERK) and phosphatidylinositol 3-kinase (PI3K)/Akt kinase signaling pathways (Luzi et al., 2000; Ravichandran, 2001). The importance of ShcA signaling during development is demonstrated by the homozygous knock-out mouse which dies by embryonic day 11.5 (E11.5) (Lai and Pawson, 2000). ShcA is expressed in three isoforms, p66, p52, and p46, which differ only at the N terminus; however, all three isoforms contain the distinctive modular organization of phosphotyrosine binding (PTB), proline-rich (CH1), and Src homology 2 (SH2) domains (Pelicci et al., 1992). On binding of the PTB domain of ShcA to phosphotyrosine residues on receptor tyrosine kinases, tyrosine residues in the CH1 domain, Y239, Y240, and Y317 (Gotoh et al., 1996; van der Geer et al., 1996), are phosphorylated, providing a docking site for the Grb2/Sos nucleotide exchange factor complex, which then initiates downstream kinase signaling cascades (Rozakis-Adcock et al., 1992).
In the brain, ShcA protein expression, determined by Western blotting, is elevated during early embryonic neural development but then decreases during later stages, and ShcA mRNA is found in proliferative areas in both embryonic and adult brains (Conti et al., 1997). In contrast, other Shc family members, ShcB/Sck/Sli and ShcC/N-Shc/Rai, are expressed in differentiated neurons of the mature adult brain (O’Bryan et al., 1996; Pelicci et al., 1996; Conti et al., 1997; Nakamura et al., 1998; Ponti et al., 2005). Thus, these data have led to the hypothesis that ShcA is important for proliferation of neural progenitors, whereas ShcB/Sck/Sli and ShcC/N-Shc/Rai are required for survival of mature neurons (Pelicci et al., 1992; Conti et al., 1997, 2001; Cattaneo and Pelicci, 1998).
In this study, we sought to directly determine brain-specific functions for ShcA. Transgenic mice harboring a STOP cassette flanked by loxP sites downstream of the elongation factor-1α (EF-1α) promoter and upstream of a dominant-negative ShcA (ShcFFF) construct (Zhang et al., 2002) were crossed with mice expressing Cre recombinase under the control of the nestin promoter and a neural specific enhancer (Tronche et al., 1999). Our results suggest that, in the CNS, ShcA has a critical role not for the proliferation of neural progenitors but rather their survival during embryogenesis.
Materials and Methods
Animals.
STOPfloxShcFFF transgenic mice, ShcAloxP/+ conditionally targeted mice (Zhang et al., 2002) and nestin-Cre transgenic mice (Tronche et al., 1999) (The Jackson Laboratory, Bar Harbor, ME) were maintained in a C57BL/6 background. Experimental animals were obtained from matings of nestin-Cre males to STOPfloxShcFFF females with the day of birth designated as postnatal day 0 (P0). Embryos were obtained from timed matings with the morning of vaginal plug detection defined as E0.5. All animals were handled in compliance with the University of Virginia's Animal Care and Use Committee guidelines.
DNA extraction and PCR.
Tail biopsies from transgenic animals were obtained at the time of weaning or experiment, and genomic DNA was extracted using the DNeasy kit (Qiagen, Valencia, CA) for genotyping via PCR. Transgenes were detected with the following primers under standard PCR conditions: cre (+), gcggtctggcagtaaaaactatc; cre (−), gtgaaacagcattgctgtcactt; ShcFFF (+), tcctaagcttgatggaattgga; ShcFFF (−), cgggaagtcattaaagaactgatggt; ShcFlox (+), cagccggccaactctaag; and ShcFlox (−), gccctcggacagagcaatcatgtc. For control PCRs, the native IL-2 gene was detected using the following primers: IL-2 (+), ctaggccacagaattgaaagatct; and IL-2 (−), gtaggtggaaattctagcatcatcc.
For DNA isolation from fixed embryonic tissue, 16- to 20-μm-thick tissue sections were dewaxed in xylenes and rehydrated through an alcohol series into 1× PBS. Using a dissection microscope for easy visualization, all non-neural tissue was carefully removed from the slide in 1× PBS using a pipette tip and moved into a Microfuge tube. The slide with the remaining neural tissue was rinsed gently in PBS to remove residual non-neural tissue. The neural tissue was then scraped from the slide in a similar manner and placed into a separate Microfuge tube. Both neural and non-neural tissues were pelleted by gentle centrifugation, and the PBS was removed. The tissue pellets were lysed in DNA extraction buffer (150 mm NaCl, 25 mm EDTA, 0.5% Tween 20, 0.5 μg/μl Proteinase K) overnight in a 55°C water bath, and then heat denatured at 80°C for 1 h with the resulting lysate used directly in PCRs. To detect the presence of the STOP cassette in ShcFFF transgene-containing mice, the following primers were used under standard PCR conditions: STOP (+), gcctcatcatcactagatgg; and STOP (−), ttacggaataccacttgcc. For control PCRs, the native IL-2 gene was detected as described above.
5-Bromo-2′-deoxyuridine injections.
Postnatal animals were injected with 5-bromo-2′-deoxyuridine (BrdU) (Sigma, St. Louis, MO) intraperitoneally in a regimen of three doses of 75 mg/kg of body weight every 2 h and killed 24 h from the first injection. Pregnant females were injected intraperitoneally with a single dose of BrdU at 100 mg/kg and killed 6 h later. Animals were killed with a lethal dose of nembutol and perfused through the left ventricle with 10 ml of 1× PBS followed by 10 ml of 70% ethanol. Embryos and postnatal brains were dissected and postfixed in 70% ethanol, embedded in paraffin, and then sectioned in the sagittal or coronal planes. Six-micrometer sections were cut on a microtome for tissue staining and 16–20 μm sections were cut for DNA isolation. For cytochrome oxidase and Cux-1 staining, 40 μm sections were cut using a freezing microtome.
Human brain samples were procured from archival autopsy tissue at the University of Virginia's Department of Pathology under an approved protocol. Brain tissue was chosen from autopsy patients with non-neurological causes of death.
Immunohistochemistry.
Paraffin sections were dewaxed, rehydrated, and blocked in either 2% normal goat or horse serum in PBS plus 0.1% Triton X-100. Primary antibodies were incubated overnight at 4°C and diluted in the blocking solution and used at the following dilutions: BrdU (1:2000; Sigma), ShcA (1:500; BD Biosciences, San Jose, CA), nestin [Rat 401, 1:50; Developmental Studies Hybridoma Bank (DSHB), University of Iowa, Iowa City, IA], cleaved caspase-3 (CC3) (1:100; Cell Signaling Technology, Beverly, MA), Cre (1:20,000; Novagen, San Diego, CA), neurofilament (2H3, 1:50; DSHB), TuJ1 (1:500; Covance, Princeton, NJ), NeuN (1:1000; Chemicon, Temecula, CA), Brn-1 (1:50; Santa Cruz Biotechnology, Santa Cruz, CA), calretinin (1:500; Chemicon), reelin (1:500; Chemicon), and Cux-1 (1:500; Santa Cruz Biotechnology). GABAA receptor subunit α2 was recognized by a rabbit antibody (1:200; Alomone Labs, Jerusalem, Israel). GABAA receptor subunit α5 was recognized by a rabbit antibody (amino acids 337–388; 8 μg/ml) (gift from Werner Sieghart, Brain Research Institute, Vienna, Austria).
For fluorescent studies, Oregon Green-conjugated goat anti-mouse and rhodamine-conjugated goat anti-rabbit secondary antibodies (Invitrogen, Eugene, OR) were used at a 1:200 dilution in the blocking solution. Counterstaining of the tissue was performed using 4′,6′-diamidino-2-phenylindole (DAPI) (Sigma) at 1 μg/ml. For color precipitate reactions, goat anti-rabbit and horse anti-mouse biotin-conjugated secondary antibodies (Sigma) were used at a 1:200 dilution in the blocking solution. Antibody detection was performed using the ABC (avidin–biotin complex) kit according to the manufacturer's instructions (Vector Laboratories, Burlingame, CA) with a brown diaminobenzidine reaction (DakoCytomation, Carpinteria, CA). Tissue sections were counterstained with hematoxylin. “No primary” antibody staining controls did not show any color precipitate.
Cytochrome oxidase staining was performed as described previously (Wong-Riley, 1979).
Sections of control littermates were chosen using embryonic (Schambra et al., 1992) or postnatal (Paxinos and Franklin, 2001) brain atlases as a guide, and then sections from ShcFFF littermates were chosen based on common morphological landmarks. Images of stained tissue were captured using Adobe Photoshop 7.0. Confocal images were captured using a PerkinElmer (Wellesley, MA) UltraviewRS system attached to a Zeiss (Oberkochen, Germany) Axiovert 200 using a 40× objective. Image manipulations were performed identically for both experimental and control images.
Morphometric measurements of brain structures and cortical layers.
Equivalent sections of ShcFFF and control littermate brains were chosen using prenatal (Schambra et al., 1992) or postnatal (Paxinos and Franklin, 2001) brain atlases as described above. Structures including the striatum, hippocampus, dentate gyrus, and lateral ventricles were identified, images were captured using a 4× objective, and their area was measured using NIH ImageJ 1.32j. For each animal, structures from each one-half of the brain were measured separately, and then averaged together. The area of the subventricular zone (SVZ) was calculated while performing BrdU counts as described below. For cortical layers, each layer was identified based on morphology of the neurons in each layer, and the transition between layers was noted. ImageJ was then used to measure the distance between each layer. Total thickness of the cortical wall was calculated by measuring from the top of layer 1 to the bottom of layer 6 using ImageJ 1.32j. Gross area analyses of whole brains were performed using ImageJ 1.32j to measure each indicated dimension.
Cell counts in tissue sections.
At embryonic time points, equivalent sections of the forebrain and hindbrain were chosen as described above. Images of each area were recorded, and positive BrdU or cleaved caspase-3 cells were counted in a manner similar to that described previously (Gambello et al., 2003). Briefly, five random, nonoverlapping counting boxes that were 200 μm in width by the thickness of the cortex were chosen for each image. To examine cortical layering, the thickness of the cortex for each of the five random counting boxes was divided equally into five sections and labeled one through five from the ventricular to the pial surface. Positive BrdU or cleaved caspase-3 cells (brown) and the total number of nuclei (blue) were counted in each subdivided area. Because cell counting data can be confounded by systematic differences in cell size, a correction factor known as Abercrombie's formula can be applied (Abercrombie, 1946). However, because our nuclear and soma measurements of ShcFFF and control mice revealed no differences between control and ShcFFF samples in either embryonic or postnatal brain, we did not need to apply this correction factor. Proliferation and apoptotic indices for each cortical bin were calculated by dividing the number of positive cells per bin by the total number of nuclei in the entire thickness of the cortex and multiplying by 100%. NeuN-positive cells were counted in a similar manner with no divisions in the cortical thickness. Total proliferation and apoptotic indices were calculated by dividing the total number of positive cells throughout the thickness of the cortex by the total number of nuclei in the cortex and multiplying by 100%.
For BrdU counts at postnatal time points, equivalent sections of the SVZ in the lateral wall of the lateral ventricle were chosen as described above. In the SVZ, cell counts for positively stained nuclei and total nuclei number or total area were performed using ImageJ 1.32j. In postnatal time points, four nonadjacent sections of the SVZ were counted per animal.
Graphs were generated using KaleidaGraph, version 4.02. Graphs and data are expressed as the mean ± SEM. Data were statistically compared and two-tailed p values were obtained using a nonpaired t test with QuickCalc online software (GraphPad, San Diego, CA). Littermate control data were combined from the animals genotyped as containing the ShcFFF transgene alone, the nestin-Cre transgene alone, and those completely wild type.
Results
To test the role of ShcA in the developing brain, we used the conditional transgenic expression of a FLAG-tagged, dominant-negative p52ShcA transgene termed ShcFFF (Zhang et al., 2002). This ShcFFF transgene has the three critical tyrosine residues, Y239, Y240, and Y317, mutated to phenylalanine and affects the activation of endogenous ShcA (Zhang et al., 2002). To prevent basal expression of the dominant-negative protein, ShcFFF is located downstream of a STOP cassette flanked by loxP sites, which are specifically recognized by Cre recombinase. Cre-mediated excision of the upstream STOP cassette allows expression of the transgene from the EF-1α promoter (supplemental Fig. 1A,B, available at www.jneurosci.org as supplemental material). Using the nestin promoter and neural specific enhancer located in the second intron, Cre expression occurs in the majority of neuronal and glial precursors (Zimmerman et al., 1994; Tronche et al., 1999; Mignone et al., 2004), thereby allowing removal of the STOP cassette specifically in these cells. This approach using the nestin-Cre transgene has been used successfully to conditionally inactivate several genes in the CNS (Tronche et al., 1999; Haigh et al., 2003; Gao et al., 2004), and reporter gene expression has been shown to occur throughout the majority of the CNS during embryonic development (Jiang et al., 2005).
ShcA, Cre, and nestin protein expression in neuroepithelium
To localize ShcA protein expression during embryonic development, we performed immunohistochemistry at various developmental time points. We find that ShcA immunoreactivity is strongly expressed throughout the neuroepithelium at E10.5 (Fig. 1A) but decreases and is diffuse throughout the developing nervous system by E12 (Fig. 1B) and with even lower expression at E14.5 (Fig. 1C). During postnatal development, some expression persists in the proliferating SVZ (Fig. 1F) as well as in blood vessels (Fig. 1E). No immunoreactivity was seen in mature neuropil or white matter (Fig. 1E), determined by staining adjacent sections with neuronal and glial markers (data not shown). This expression pattern agrees with the previously described mRNA localization and the time course agrees with Western blotting data (Conti et al., 1997).
Figure 1.
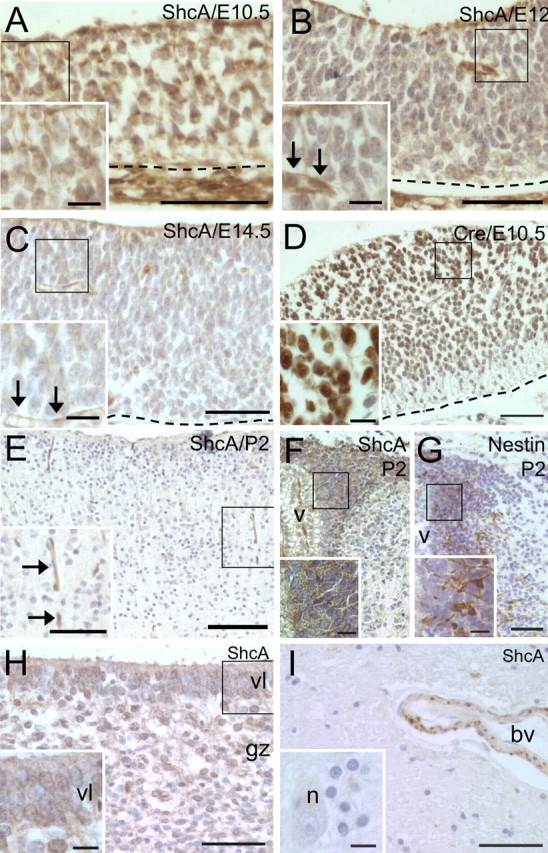
ShcA and nestin promoter-driven Cre proteins are expressed in the proliferative ventricular zone during neurogenesis and in the subventricular zone during postnatal development. ShcA protein expression in the forebrain at E10.5 (A), E12 (B), and E14.5 (C), in the cortex (E), and in the SVZ at P2 (F). Expression of Cre recombinase in the ventricular layer of a nestin-Cre transgenic mouse at E10.5 (D). Expression of nestin in the SVZ at P2 (G). ShcA protein expression in the ventricular layer (vl) and granular zone (gz) of a 23 week human fetus (H) and in the adult human cortex (I). In A–D and H, the ventricular surface is to the top, and in A–D, the dashed line indicates the pial surface. In E, the pial surface is to the top of the panel. In F and G, the horn of the SVZ is to the right. v, Ventricle; n, neuron; bv or arrows, blood vessel. In each panel, a higher-magnification view is shown in the smaller inset with a box in the larger panel indicating where the image originated, except in I. Scale bars: A–C, 50 μm; E, 100 μm; D, F–I, 200 μm; A–I, insets, 50 μm.
In the nestin-Cre transgenic mouse, Cre protein expression is found to be highest in periventricular regions (Fig. 1D). Furthermore, nestin expression (Fig. 1G) in the subventricular zone at early postnatal stages is similar to that seen for endogenous ShcA protein (Fig. 1F). These observations for nestin protein and nestin-driven Cre protein expression agree with previous descriptions of nestin promoter activity (Lendahl et al., 1990; Zimmerman et al., 1994; Tronche et al., 1999).
To compare its expression in human tissues, we stained fetal and adult brain tissue for ShcA. In human brain tissue from a 23 week fetus, ShcA immunoreactivity is found in proliferating regions such as the ventricular layer and granular zone (Fig. 1H). In the adult human brain, ShcA protein is observed only in the endothelium of blood vessels and is not found in neurons or glia of the adult cortex as determined by neuronal morphology and staining adjacent sections with the astroglial marker GFAP (Fig. 1I) (data not shown).
Excision of the STOP cassette
Mice that were doubly positive for the nestin-Cre and STOPFloxShcFFF transgenes were viable and observed at the expected mendelian ratio of 25% when sire and dam were heterozygous for the nestin-Cre transgene and the STOPFloxShcFFF transgene, respectively. However, we were unable to detect expression of the ShcFFF transgene using immunohistochemical and Western blotting techniques (data not shown).
Therefore, we designed primers to the STOP cassette of the ShcFFF transgene to detect the presence or absence of the STOP cassette in various tissues (supplemental Fig. 1, available at www.jneurosci.org as supplemental material). The generation of a PCR product from these primers depends on the presence of the STOP cassette, such as in non-neural tissues of embryos genotyped with both nestin-cre and STOPfloxShcFFF transgenes or in both neural and non-neural tissues of embryos genotyped with only the STOPfloxShcFFF transgene (supplemental Fig. 1A,C, available at www.jneurosci.org as supplemental material). A lack of a PCR product from these primers occurs when the STOP cassette is absent, such as in embryos that do not carry the STOPfloxShcFFF transgene or by excision of the STOP cassette via Cre recombinase in neural tissue of embryos genotyped with both nestin-Cre and STOPfloxShcFFF transgenes (supplemental Fig. 1B; C, asterisks; available at www.jneurosci.org as supplemental material).
Thus, DNA was isolated from neural and non-neural tissue of E12 and E14.5 embryos and tested with the STOP cassette primers and with primers to the native IL-2 gene as a control (supplemental Fig. 1C, available at www.jneurosci.org as supplemental material). We obtained the results described above indicating that at the DNA level the STOP cassette is removed from the neural tissue of embryos genotyped with both the nestin-Cre and the STOPfloxShcFFF transgenes (henceforth referred to as ShcFFF animals) allowing for transcription of the ShcFFF transgene. The inability to detect the protein product of the ShcFFF transgene is most likely attributable to a low level of expression. Using the same STOPFloxShcFFF mouse, Zhang et al. (2002) detected very low levels of ShcFFF expression compared with endogenous ShcA, yet observed a very strong phenotype in thymic development.
Microencephaly in ShcFFF-expressing animals
At P2, ShcFFF mice demonstrated microencephaly with brain weights reduced to one-half that of littermate controls (Fig. 2A,A′). This phenotype persisted throughout postnatal development (Fig. 2B,B′) and into maturity at all time points assayed including 1 year of age (Fig. 2C). Furthermore, at birth and during early postnatal development, there was a slight body weight difference between ShcFFF animals and their control littermates (Fig. 2F). This phenotype was most obvious at P21 (Fig. 2D,D′), but ShcFFF animals subsequently reached weights near those of their control littermates during maturity (Fig. 2E,E′,F). However, at these later time points, the difference in body size was more noticeable in males than in females (data not shown) (females shown in Fig. 2E,E′).
Figure 2.

Expression of the dominant-negative ShcFFF or conditional knock-out of ShcA leads to microencephaly. Brains from control littermates (A, B) and ShcFFF animals (A′, B′) at P2 (A, A′) and P127 (B, B′). C, Brain weights from control littermates (filled bars) and ShcFFF-expressing (open bars) animals at P2 (control, n = 16; ShcFFF, n = 12), P21 (control, n = 18; ShcFFF, n = 10), P127 (control, n = 4; ShcFFF, n = 5), and postnatal year 1 (control, n = 4; ShcFFF, n = 3), and from nestin-Cre; ShcAloxP/loxP animals and control littermates at P25 (control, n = 5; nestin-Cre; ShcAloxP/loxP, n = 2). Whole bodies at P21 (D) and P127 (E) of control littermates (D, E) and ShcFFF animals (D′, E′). F, Whole animal weights of ShcFFF animals at P2, P21, P127, and postnatal year 1, and from nestin-Cre; ShcAloxP/loxP animals at P25 (open bars) and their control littermates (filled bars). N values for F are the same as for C. Significant p values (p < 0.05) are in bold. Error bars indicate SEM. Scale bars: A, B, 0.5 cm; D, E, 1 cm.
Because the dominant-negative ShcFFF transgene could, in theory, perturb signaling through other Shc family members, we undertook an independent approach using the conditional disruption of the shc1 locus. To this end, we created animals in which ShcA was conditionally removed from nestin-expressing neural progenitors by crossing a nestin-Cre; ShcAloxP/+ female to a ShcAloxP/+ male. At P25, we observed a similar microencephalic phenotype in animals that are nestin-Cre; ShcAloxP/loxP (Fig. 2C). These animals also had reduced body weights (Fig. 2F) similar to the ShcFFF animals. Intriguingly, the brain size phenotype observed for the expression of ShcFFF in neural tissue was more severe than that of deleting the ShcA gene using the same nestin-Cre transgene. This might be attributable to the immediate effect of ShcFFF once it is transcribed after the STOP cassette deletion versus the potentially long half-life of the extant ShcA protein even after disruption of the shc1 locus via the nestin-Cre transgene. Nevertheless, a qualitatively similar phenotype between the ShcFFF and nestin-Cre; ShcAloxP/loxP animals provides strong evidence for a ShcA-specific role in the regulation of brain size.
Histological analysis of brains from ShcFFF animals revealed that, on a gross anatomic level, overall architecture and organization of the brain is normal despite its reduced size (Fig. 3A–H). However, on closer inspection and quantification, certain structures of these brains are more severely affected than others. Quantitative comparisons revealed differences that were statistically significant including the thickness of the cerebral cortex (Fig. 3J), the area of the subventricular zone (Fig. 3I), and the area of the striatum (Fig. 3K). However, other structures such as the area of the hippocampus at P2 (Fig. 3M), dentate gyrus (Fig. 3N), and area of the lateral ventricles (Fig. 3L) did not have statistically significant differences. Additionally, a gross area analysis of the whole brain at P2 and postnatal year 1 revealed that the size of the cerebral cortex (58% the size of control at P2) was affected more severely in ShcFFF mice than the olfactory bulb (82% the size of control at P2) (Fig. 3O–Q). Moreover, ShcFFF animals have no obvious abnormalities in their normal home cage behavior and are fertile and are able to raise healthy pups (data not shown).
Figure 3.
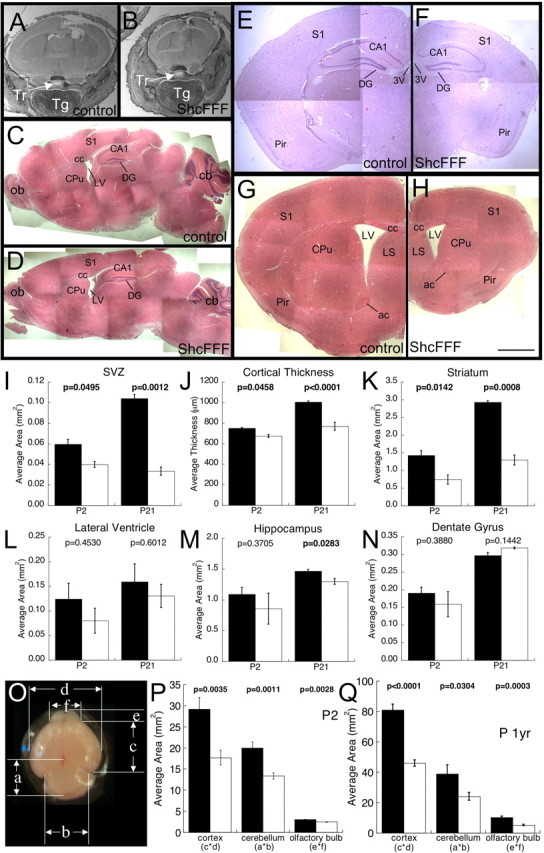
ShcFFF mice have a reduced brain size but retain normal brain architecture. Cross section through the heads of control (A) and ShcFFF (B) littermates at P2. Sagittal sections through the brains of control (C) and ShcFFF (D) littermates at P21. Cross section through the brain near –1.8 bregma at P21 in control (E) and ShcFFF (F) littermates. Cross section through the brain near 0.5 bregma at postnatal year 1 in a control littermate (G) and a ShcFFF animal (H). Measured area of the SVZ (I; P2: control, n = 3; ShcFFF, n = 2; P21: control, n = 3; ShcFFF, n = 2), cortical thickness (J; P2: control, n = 2; ShcFFF, n = 2; P21: control, n = 6; ShcFFF, n = 2), areas of striatum (K; P2: control, n = 7; ShcFFF, n = 3; P21: control, n = 3; ShcFFF, n = 2), lateral ventricle (L; P2: control, n = 6; ShcFFF, n = 3; P21: control, n = 3; ShcFFF, n = 2), hippocampus (M; P2: control, n = 5; ShcFFF, n = 3; P21: control, n = 4; ShcFFF, n = 2), and dentate gyrus (N; P2: control, n = 5; ShcFFF, n = 3; P21: control, n = 4; ShcFFF, n = 2). O, Gross area analysis of P2 brains indicating the measured parameters. a, cerebellum height; b, cerebellum width; c, cerebrum height; d, cerebrum width; e, olfactory bulb height; f, olfactory bulb width. Average area calculated for the cerebrum (c × d), cerebellum (a × b), and olfactory bulb (e × f) at P2 (P; control, n = 4; ShcFFF, n = 4) and postnatal year 1 (Q; control, n = 6; ShcFFF, n = 8). Control littermates, filled bars; ShcFFF animals, open bars. Error bars indicate SEM. Tr, Trachea; Tg, tongue; S1, primary somatosensory cortex; CA1, CA1 region of the hippocampus; DG, dentate gyrus of the hippocampus; LV, lateral ventricle; cc, corpus callosum; CPu, caudate–putamen (striatum); ob, olfactory bulb; cb, cerebellum; Pir, piriform cortex; 3V, third ventricle; ac, anterior commissure; LS, lateral septal nucleus. Scale bars: A–D, 250 μm; E–H, 100 μm.
Specific diminishment of superficial cortical layers in ShcFFF brains
To determine whether the reduction in cortical thickness was layer specific or a generalized reduction in total cortical thickness, the expression patterns of cortical layer-specific markers were examined. Brain-1 (Brn-1) (Fig. 4A,B) and Cux-1 staining (Fig. 4G,H), both of which are expressed in cortical layers II through IV (McEvilly et al., 2002; Ferrere et al., 2006) as well as reelin (Fig. 4E,F) and calretinin (Fig. 4C,D) staining in cortical layer I (Del Rio et al., 1995) were analyzed. Additionally, cytochrome oxidase (Fig. 4G,H; supplemental Fig. 2E,F, available at www.jneurosci.org as supplemental material) staining was performed to identify the barrel region of the somatosensory cortex in ShcFFF and controls. GABAA receptor α2 (supplemental Fig. 2A,B, available at www.jneurosci.org as supplemental material) and GABAA receptor α5 (supplemental Fig. 2C,D, available at www.jneurosci.org as supplemental material) were also examined in the somatosensory cortex.
Figure 4.
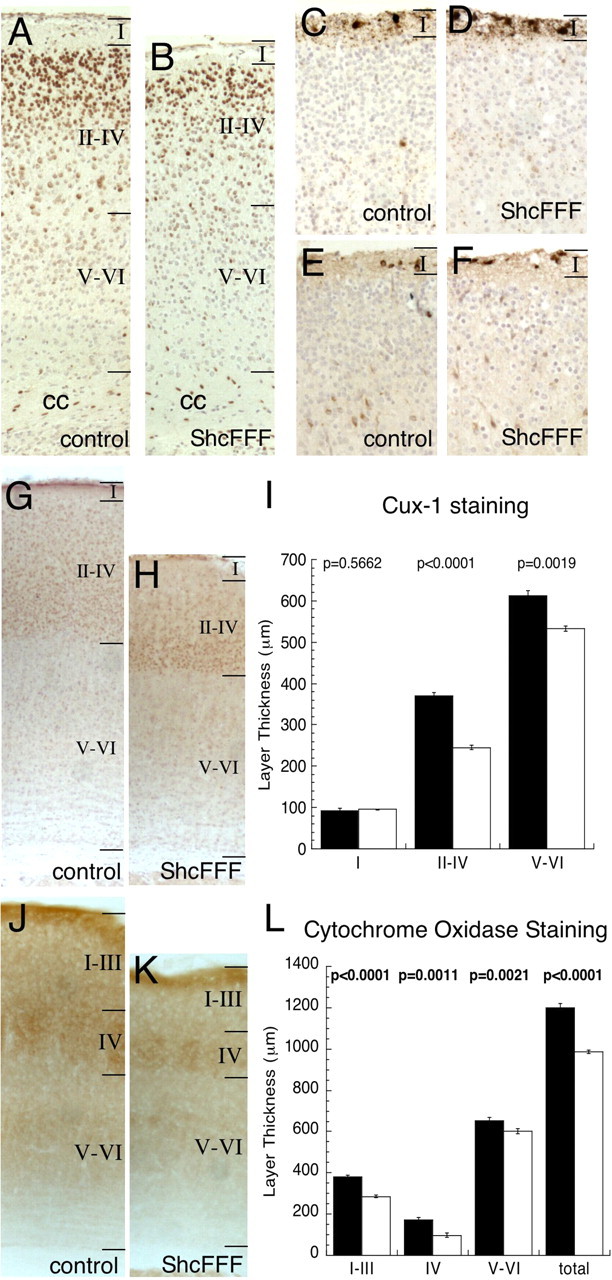
Selective diminishment of cortical layers II–IV in ShcFFF animals. Cortical layering in the primary somatosensory cortex near bregma. Brn-1 expression in control (A) and ShcFFF (B) animals. Calretinin staining in control (C) and ShcFFF (D) brains. Reelin staining in control (E) and ShcFFF (F) animals. Total number of animals examined for calretinin, reelin, and Brn-1 staining was as follows: ShcFFF, n = 6; control, n = 8. Cux-1 staining in the adult somatosensory cortex in control (G) and ShcFFF (H) animals and corresponding quantification (I). Cytochrome oxidase staining in the adult somatosensory cortex in control (J) and ShcFFF (K) brains. Quantification of cytochrome oxidase staining in the barrel layers (L) and of the total thickness of the somatosensory cortex (L). Total number of animals for cytochrome oxidase and Cux-1 staining was as follows: ShcFFF, n = 4; control, n = 5. Error bars indicate SEM. cc, Corpus callosum; str, striatum. Scale bar, 50 μm.
In the somatosensory cortex, the thickness of the Cux-1-positive area (layers II–IV) as well as Cux-1-negative regions (representing layer I and layers V–VI) were quantified in ShcFFF brains and their control littermates (Fig. 4I). Furthermore, the whisker barrels in layer IV of the somatosensory cortex were identified by staining for cytochrome oxidase activity (Fig. 4J–L; supplemental Fig. 2E,F, available at www.jneurosci.org as supplemental material). The barrels in layer IV in the somatosensory cortex as well as the cortex above (representing layers I through III) and below (representing layers V through VI) were identified and the thickness of each was measured (Fig. 4L).
These data reveal that the entire thickness of the somatosensory cortex is reduced in ShcFFF brains (reduced to <85% of controls). However, the upper cortical layers (layers II through IV) appear to be more dramatically affected (reduced by <60% of controls in layer IV) than layers V–VI (reduced by 92% of controls). A narrower swath of Brn-1 staining in layers II through IV (Fig. 4A,B) and GABAA receptor staining (supplemental Fig. 2A–D, available at www.jneurosci.org as supplemental material) in ShcFFF brains also supports this finding. Moreover, the reduction in cortical thickness in ShcFFF brains was not confined to the S1 cortex but can be seen throughout the cortex (supplemental Fig. 2G, available at www.jneurosci.org as supplemental material).
Cortical layer I does not appear to be affected in ShcFFF brains as evidenced by reelin (Fig. 4E,F) and calretinin (Fig. 4C,D) staining patterns.
Normal proliferation of neural precursors in ShcFFF mice
Microencephaly can result from diverse cellular mechanisms. To determine whether the reduced brain size in ShcFFF-expressing animals was attributable to a reduction in the proliferation of neural progenitors, we performed BrdU injections to mark proliferating cells at embryonic stages E10.5, E12, and E14.5 (Fig. 5) and at P2 and P21 (Fig. 6). During the embryonic stages, proliferation was monitored at two locations, in the frontal cortex (Fig. 5A,B,E,F,I,J) and in the pons surrounding the fourth ventricle (Fig. 5C,D,G,H,K,L). To quantify the proliferation index at these embryonic time points, the thickness of the cortex was divided in five equally sized bins, labeled 1 (nearest ventricle) through 5 (nearest pial surface), and BrdU+ cells and the total number of cells were counted in each. This was done to determine whether there was any difference in cortical layering in ShcFFF embryos during embryogenesis. Graphed data (Fig. 5A′–L′) represents this proliferation index as the number of BrdU+ nuclei in the cortical bin over the total number of nuclei throughout the entire cortical thickness. Additionally, the total proliferation index was calculated by counting the total number of BrdU+ nuclei throughout the entire thickness of the cortex and dividing this by the total number of nuclei in the cortical thickness.
Figure 5.
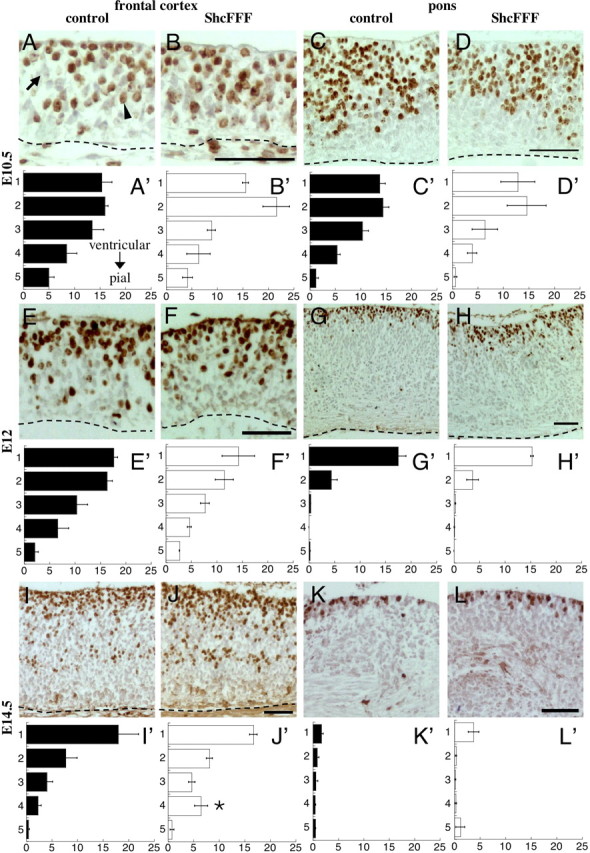
Embryonic cortical proliferation is mostly unaffected by ShcFFF. BrdU staining (brown) and hematoxylin counterstaining (blue) of the frontal cortex and the pons during embryonic development. BrdU staining of the frontal cortex (A, B) and the pons (C, D) in control littermates (A, C) and ShcFFF animals (B, D) at E10.5. Associated average binned proliferation indices (percent BrdU+ cells) for the frontal cortex (A′, B′) and the pons (C′, D′) for control littermates (filled bars, A′, C′; n = 3) and ShcFFF animals (open bars, B′, D′; n = 2). Error bars indicate SEM. BrdU staining of the frontal cortex (E, F) and the pons (G, H) in control littermates (E, G) and ShcFFF animals (F, H) at E12. Associated average binned proliferation indices for the frontal cortex (E′, F′) and the pons (G′, H′) for control littermates (filled bars, E′, G′; n = 3) and ShcFFF animals (open bars, F′, H′; n = 2). BrdU staining of the frontal cortex (I, J) and the pons (K, L) in control littermates (I, K) and ShcFFF animals (J, L) at E14.5. Associated average binned proliferation indices of the frontal cortex (I′, J′) and the pons (K′, L′) in control littermates (filled bars, I′, K′; n = 4, frontal cortex; n = 3, pons) and ShcFFF animals (open bars, J′, L′; n = 4, frontal cortex; n = 3, pons). An asterisk indicates significant p values (p < 0.05) for comparisons of data between ShcFFF and control littermates for the same cortical bin and brain locations. In all panels, the ventricle is located to the top of the panel and a dashed line indicates the pial surface. Arrow, BrdU-negative nuclei; arrowhead, BrdU-positive nuclei. Scale bars, 50 μm.
Figure 6.

The proliferation index in the postnatal subventricular zone of ShcFFF mice is not affected. BrdU staining (brown) and hematoxylin counterstaining (blue) of the SVZ at P2 in control littermates (A) and ShcFFF mice (B). C, Resulting proliferation index (BrdU+ cells per square millimeter) in the SVZ at P2 (control animals, filled bars, n = 3; ShcFFF, open bars, n = 2). BrdU staining of the SVZ at P21 in a control littermate (D) and a ShcFFF animal (E). F, Resulting proliferation index (percent BrdU+ cells; control littermates, filled bars, n = 7; ShcFFF animals, open bars, n = 5). Error bars indicate SEM. Scale bar, 50 μm.
At E10.5, there were no significant differences in the proliferation index between ShcFFF animals and their control littermates in any of the cortical bins in both the frontal cortex (Fig. 5A,A′,B,B′) and the pons (Fig. 5C,C′,D,D′). Additionally, total proliferation indices throughout the entire cortical thickness were unchanged between ShcFFF and control littermates in the frontal cortex (ShcFFF, 56.49 ± 5.34%, n = 2, vs control, 58.36 ± 2.57%, n = 3, p = 0.7414) and in the pons (ShcFFF, 38.32 ± 3.59%, n = 2, vs control, 34.71 ± 10.47%, n = 3, p = 0.8149).
Similar results were obtained between ShcFFF and control littermates at E12 for both the frontal cortex (Fig. 5E,E′,F,F′) and the pons (Fig. 5G,G′,H,H′). Total proliferation indices throughout the thickness of the entire cortex at E12 were also unchanged between ShcFFF and control animals in the frontal cortex (ShcFFF, 48.64 ± 1.74%, n = 2, vs control, 52.93 ± 4.93, n = 3, p = 0.5558) and in the pons (ShcFFF, 19.29 ± 1.26%, n = 2, vs control, 22.42 ± 2.49%, n = 3, p = 0.4190).
At E14.5, this trend between ShcFFF and control littermates is maintained in the pons (Fig. 5K,K′,L,L′). However, in the frontal cortex, there is a slight, significant increase in the proliferation rate in cortical bin 4 (Fig. 5J,J′) compared with littermate controls (Fig. 5I,I′). Yet the total proliferation index between ShcFFF and littermate controls remains unchanged in both the frontal cortex (ShcFFF, 36.77 ± 1.65%, n = 4, vs control, 32.43 ± 7.09%, n = 4, p = 0.5732) and the pons (ShcFFF, 5.71 ± 1.36%, n = 3, vs control, 3.97 ± 1.21%, n = 3, p = 0.3942).
During postnatal development, proliferation in the subventricular zone, a source of postnatal and adult neural progenitors (Alvarez-Buylla et al., 2000; Romanko et al., 2004), was examined in ShcFFF animals and compared with littermate controls at P2 and P21 (Fig. 6). The proliferation index (calculated as the number of BrdU+ nuclei divided by the total number of nuclei or the total area of the SVZ) was unchanged between ShcFFF and littermate controls at both P2 (Fig. 6A–C) and at P22 (Fig. 6D–F). We also observed that the SVZ in ShcFFF animals was smaller when compared with littermate controls at both time points (Fig. 3I).
Microencephaly in ShcFFF mice is not the result of premature neuronal differentiation
To determine whether microencephaly in ShcFFF animals is the result of premature neuronal differentiation, we examined such markers via immunohistochemical staining. We expect that if premature neuronal differentiation were occurring, we would observe aberrant staining patterns in ShcFFF animals. To this end, we stained for markers of early and late neuronal differentiation including NeuN (Fig. 7A–D), microtubule-associated protein 2 (MAP2) (Fig. 7E–H), neurofilament (Fig. 7I–L), and TuJ1 (Fig. 7M–P) at E10.5 (total number of animals observed: control, n = 3; ShcFFF, n = 2) and E12 (total number of animals observed: control, n = 5; ShcFFF, n = 3) in ShcFFF and control littermate brains. We observed these staining patterns to have a normal intensity and distribution in ShcFFF brains. Additionally, quantification of the NeuN staining pattern indicates there are no differences in the percentage of NeuN-positive nuclei between ShcFFF and control brains in either location at E10.5 (frontal cortex: ShcFFF, 0.00 ± 0.00%, n = 2, vs control, 0.14 ± 0.08%, n = 3, p = 0.2546; pons: ShcFFF, 0.52 ± 0.16%, n = 2, vs control, 0.27 ± 0.14%, n = 3, p = 0.3230) and E12 (frontal cortex: ShcFFF, 0.15 ± 0.15%, n = 3, vs control, 0.16 ± 0.07%, n = 4, p = 0.9423; pons: ShcFFF, 10.43 ± 1.22%, n = 3, vs control, 8.93 ± 2.65%, n = 4, p = 0.6680). Therefore, we conclude that premature neuronal differentiation is not the cause of the microencephaly phenotype.
Figure 7.
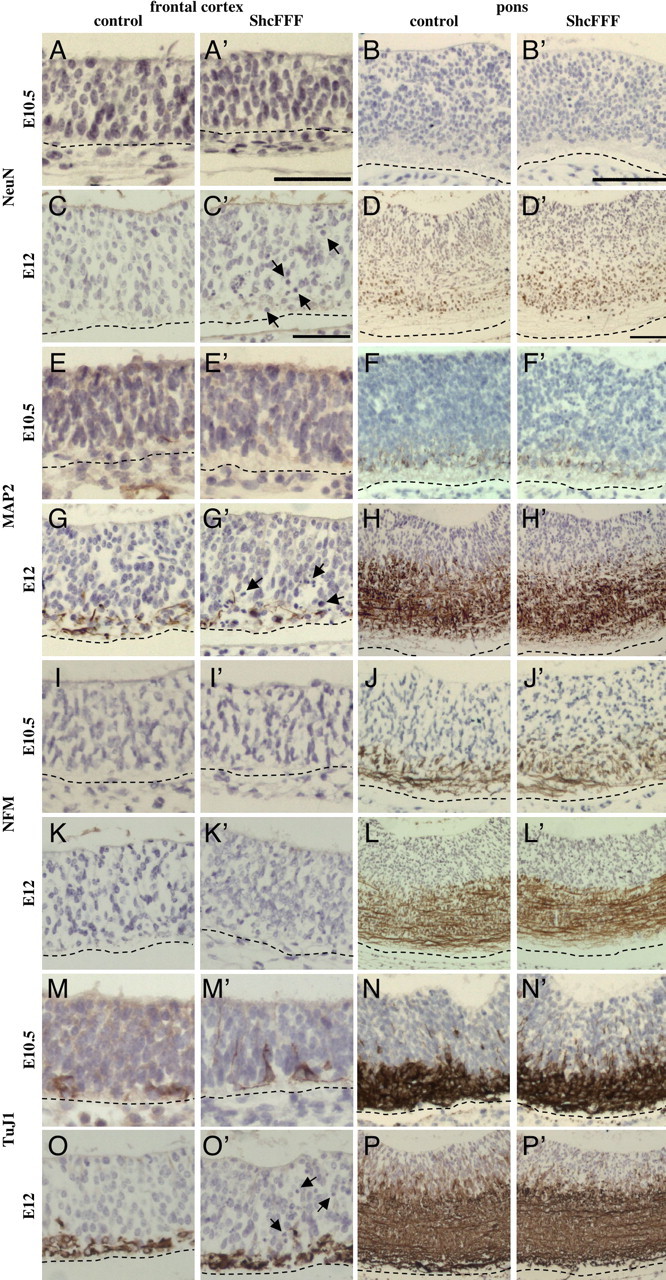
ShcFFF embryos do not exhibit premature neuronal differentiation. NeuN staining at E10.5 (A, B) and E12 (C, D) in the frontal cortex (A, C) and the pons (B, D) in control (A, B, C, D) and ShcFFF (A′, B′, C′, D′) littermates. MAP2 staining at E10.5 (E, F) and E12 (G, H) in the frontal cortex (E, G) and the pons (F, H) in control (E, F, G, H) and ShcFFF (E′, F′, G′, H′) littermates. Neurofilament (NFM) staining at E10.5 (I, J) and E12 (K, L) in the frontal cortex (I, K) and the pons (J, L) in control (I, J, K, L) and ShcFFF (I′, J′, K′, L′) littermates. TuJ1 staining at E10.5 (M, N) and E12 (O, P) in the frontal cortex (M, O) and the pons (N, P) in control (M, N, O, P) and ShcFFF (M′, N′, O′, P′) littermates. Scale bars: A, C, 50 μm; B, 100 μm; D, 75 μm. Total number of animals observed was as follows: E10.5, control, n = 3; ShcFFF, n = 2; E12, control, n = 5; ShcFFF, n = 3. Representative animals are shown. The arrows indicate pyknotic and/or fragmented nuclei. In all panels, the ventricle is located to the top of the panel, and a dashed line indicates the pial surface.
Increased apoptosis in the developing neuroepithelium of ShcFFF mice
To determine whether the reduction in brain size may be a result of an increase in apoptosis, we used antibodies to CC3, the activated form of an effector molecule of the apoptotic pathway. In the developing mouse forebrain, the expression pattern of CC3 correlates well with terminal deoxynucleotidyl transferase-mediated biotinylated UTP nick end labeling (TUNEL)-positive cells with the majority of CC3+ cells being TUNEL+ (Urase et al., 2003). However, there are reports that CC3 staining does not always correlate with apoptosis; yet, in these special cases, the CC3+ cells do not have any other characteristics consistent with apoptosis such as chromosome condensation, DNA fragmentation, or TUNEL staining (Yan et al., 2001; Lossi et al., 2004; Oomman et al., 2004).
We noted the presence of condensed and pyknotic nuclei in the nervous tissue of ShcFFF embryos but not in their control littermates (Fig. 8E–H, DAPI-stained insets; Fig. 7C′,G′,O′, arrows; supplemental Fig. 3A–D, available at www.jneurosci.org as supplemental material). We find such nuclei to be positive for CC3 (supplemental Fig. 3C–J, arrows; available at www.jneurosci.org as supplemental material). Thus, we interpret these data as CC3+ cells in ShcFFF prenatal brains being apoptotic. There are occasional pyknotic nuclei that are CC3-negative (supplemental Fig. 3E–J, arrowheads; available at www.jneurosci.org as supplemental material), indicating that CC3 staining does not necessarily mark all apoptotic cells in ShcFFF embryos. We quantified both the binned apoptotic index (Fig. 8A′–L′) and the total apoptotic index in a similar manner as for the proliferation indices.
Figure 8.
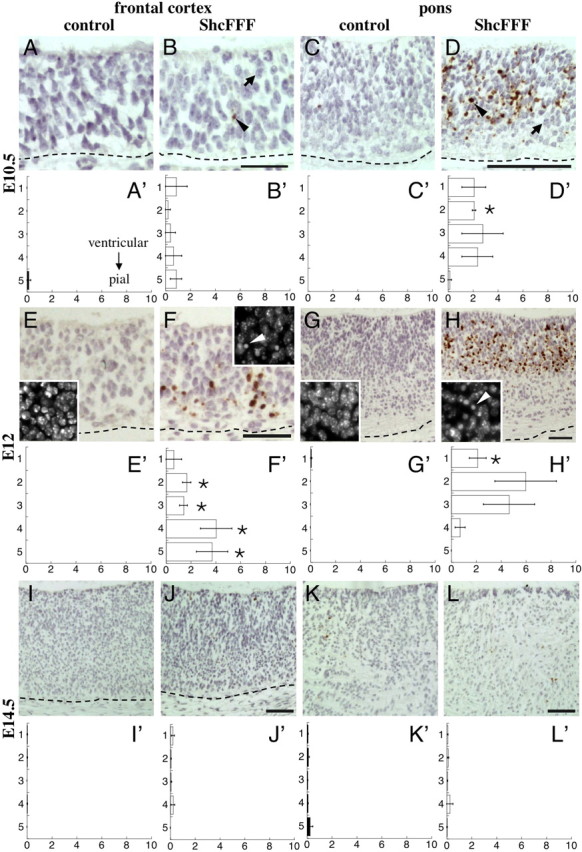
Apoptosis is increased during embryonic brain development in ShcFFF mice. Cleaved caspase-3 staining (brown) and hematoxylin counterstaining (blue) during embryonic development. CC3 staining in the frontal cortex (A, B) and the pons (C, D) of control littermates (A, C) and ShcFFF animals (B, D) at E10.5. Associated apoptotic indices (percent CC3+ cells) of the frontal cortex (A′, B′) and the pons (C′, D′) of control littermates (filled bars, A′, C′; n = 3) and ShcFFF animals (open bars, B′, D′; n = 2). Error bars indicate SEM. CC3 staining in the frontal cortex (E, F) and the pons (G, H) in control littermates (E, G) and ShcFFF animals (F, H) at E12. The smaller insets in each panel illustrate DAPI staining. Pyknotic nuclei in ShcFFF brains are indicated by the white arrowheads. Associated apoptotic indices of the frontal cortex (E′, F′) and the pons (G′, H′) in control littermates (filled bars, E′, G′; n = 3) and ShcFFF animals (open bars, F′, H′; n = 3). CC3 staining in the frontal cortex (I, J) and the pons (K, L) in control littermates (I, K) and ShcFFF animals (J, L) at E14.5. Associated apoptotic indices for the frontal cortex (I′, J′) and the pons (K′, L′) in control littermates (filled bars, I′, K′; frontal cortex, n = 3; pons, n = 4) and ShcFFF animals (open bars, J′, L′; frontal cortex, n = 4; pons, n = 4). In all panels, the ventricular surface is to the top of the panel, and the dashed line indicates the pial surface. An asterisk indicates a significant p value (p < 0.05) for comparisons of data between ShcFFF and control littermates for the same cortical bin and brain locations. The arrows indicate CC3-negative cells, and the black arrowheads indicate CC3-positive cells. Scale bars, 50 μm.
At E10.5, cells in the frontal cortex of ShcFFF animals (Fig. 8B) showed a slight, but not significant, increase in the number of CC3+ cells in each cortical bin (Fig. 8B′) and in the total apoptotic index (ShcFFF, 2.97 ± 1.38%, n = 2, vs control, 0.15 ± 0.15%, n = 3, p = 0.0741) compared with littermate controls (Fig. 8A,A′). However, in the pons surrounding the fourth ventricle, there was an even larger increase in the number of CC3+ cells in ShcFFF animals (Fig. 8D). Although these increases were not significant for all cortical bins (Fig. 8D′), the total apoptotic index showed a significant increase in ShcFFF animals (ShcFFF, 9.42 ± 3.84%, n = 2, vs control, 0.00 ± 0.00%, n = 3, p = 0.0459).
At E12, the apoptotic index appeared to reach its peak. In the frontal cortex of ShcFFF animals (Fig. 8F), the apoptotic index (Fig. 8F′) dramatically increased in all cortical bins, with the majority of apoptotic cells located from the middle of the cortex to the pial surface of the brain. In the pons of ShcFFF animals (Fig. 8H), the apoptotic index (Fig. 8H′) increased to peak levels, with the majority of apoptotic cells located in the periventricular area. Total apoptotic indices were increased significantly in both the frontal cortex (ShcFFF, 11.44 ± 2.71%, n = 3, vs control, 0.00 ± 0.00%, n = 3, p = 0.0134) and the pons (ShcFFF, 13.43 ± 4.78%, n = 3, vs control, 0.06 ± 0.06%, n = 3, p = 0.0488).
By E14.5, the apoptosis levels in ShcFFF animals were reduced to levels seen in control littermates. In the frontal cortex, the apoptotic index of ShcFFF animals (Fig. 8J,J′) was indistinguishable from that of control littermates (Fig. 8I,I′) in both the cortical bins and the total apoptotic index (ShcFFF, 0.54 ± 0.30%, n = 4, vs control, 0.08 ± 0.03%, n = 3, p = 0.1720). Similar results were obtained for the pons in ShcFFF animals (Fig. 8L,L′) compared with their littermate controls (Fig. 8K,K′) (total apoptotic index: ShcFFF, 0.51 ± 0.32%, n = 4, vs control, 0.56 ± 0.15%, n = 4, p = 0.8804).
Apoptotic cells are neural progenitors
To determine the identity and differentiated state of these apoptotic cells, double immunofluorescent staining was performed on ShcFFF embryos at E12. CC3+ cells did not stain with markers for mature, differentiated neurons, such as NeuN and neurofilament (data not shown). Additionally, CC3+ cells did not stain with the early neuronal marker, TuJ1 (Fig. 9A,B). However, the majority of CC3+ cells are nestin-positive (Fig. 9C–F). High-power confocal images (Fig. 9E,F) and stacks throughout the entire volume of these cells (supplemental movies 1 and 2, available at www.jneurosci.org as supplemental material) reveal radially arrayed, bipolar nestin-positive neural progenitors with CC3 staining. Thus, apoptotic cells in ShcFFF embryos are composed primarily of nestin-positive neural progenitors.
Figure 9.
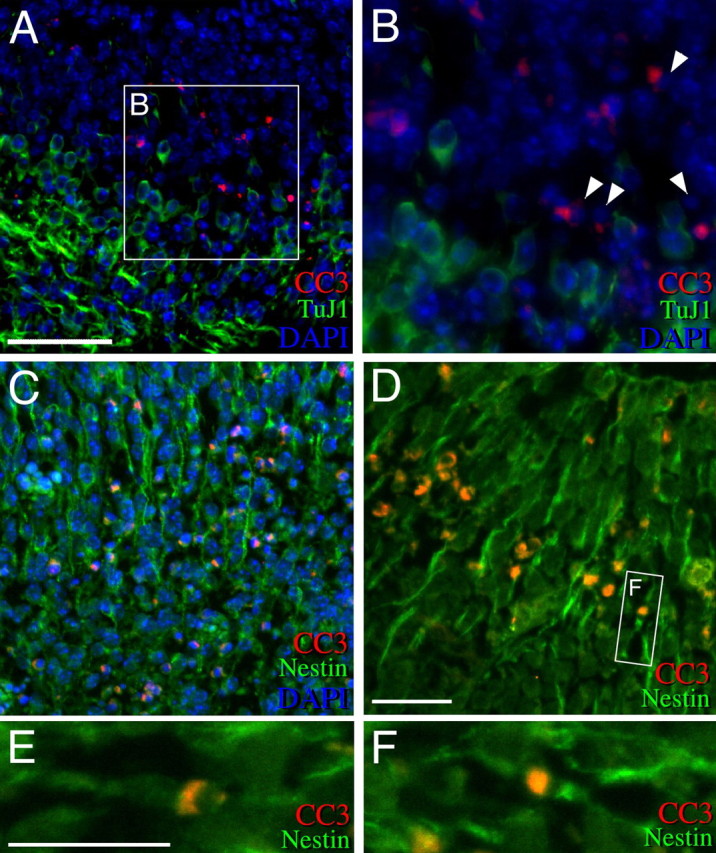
Apoptotic cells in ShcFFF embryos are nestin-positive progenitors. Double immunofluorescence of ShcFFF embryos (total number observed, n = 3) at E12 in the pons. A, Conventional fluorescent microscopic image of cleaved caspase-3 (CC3; red) and the neuron-specific tubulin (TuJ1; green) staining with DAPI counterstaining (blue). B, Higher magnification of A. C, Conventional fluorescent microscopic image of CC3 (red) and nestin (green) staining with DAPI counterstaining (blue). D, Confocal microscopic image of CC3 (red) and nestin (green) colocalization. E, F, Higher-magnification confocal views of nestin and cleaved caspase-3 colocalization within single cells. The boxed area in A indicates the magnified area in B. The arrowheads indicate CC3+ cells with pyknotic nuclei. In A–D, the ventricle is to the top of the panel, and the pial surface is out of the panel. Scale bars: A, C, 100 μm; B, D–F, 50 μm.
Discussion
Our data presented here demonstrate that ShcA has a critical role in the survival of neural progenitors during development of the nervous system. This conclusion differs from previous hypotheses that suggested that ShcA primarily plays a role in proliferation of neural precursors (Pelicci et al., 1992; Conti et al., 1997; Cattaneo and Pelicci, 1998; Conti et al., 2001).
Specificity of ShcFFF
Dominant-negative molecules can function in a nonspecific manner with regard to isoforms and family members of the target protein. Therefore, the ShcFFF transgene is capable of interfering with the function of all three ShcA isoforms and other Shc family members. However, several lines of evidence lead us to believe that disruption of the p46 and/or p52 isoforms and not the p66 isoform, which is thought to be proapoptotic, of ShcA is the cause of our observed phenotypes.
During embryonic brain development, p66Shc expression is low, whereas the p46Shc and p52Shc isoforms are more abundant (Conti et al., 1997). Additionally, mice lacking only the p66ShcA isoform, which is involved in oxidative stress-induced apoptosis (Pellegrini et al., 2005), have normal sized brains, are longer-lived than their wild-type siblings (Migliaccio et al., 1999), and are less susceptible to systemic and tissue oxidative stress when fed a high fat diet (Napoli et al., 2003). Therefore, if the expression of ShcFFF interfered with p66Shc function, we might expect cells in the developing brain to be resistant to apoptosis, which may lead to the opposite phenotype of what we have observed.
ShcFFF expression could also interfere with endogenous functions of other Shc family members, ShcB and ShcC. In the brain, both ShcB and ShcC are expressed at low levels during embryonic development and are expressed in mature neurons throughout multiple regions of the adult brain (O’Bryan et al., 1996; Pelicci et al., 1996; Conti et al., 1997; Nakamura et al., 1998; Ponti et al., 2005). Our data show that the increase in apoptosis in ShcFFF mice affects neural progenitors and not differentiating or mature neurons. Additionally, ShcB and double ShcB/ShcC knock-out mice have very subtle defects in the brain that do not affect its size (Sakai et al., 2000). Hence, these results predict that any interference in ShcB and/or ShcC function would be mild and would not lead to microencephaly.
Moreover, the spatial and temporal pattern of apoptosis in ShcFFF mice is consistent with the expression of endogenous ShcA protein. Additionally, the microencephaly observed in conditional ShcA knock-outs indicates that expression of the ShcFFF transgene can phenocopy removal of brain-specific ShcA function. Together, these data suggest that the phenotype seen by expressing ShcFFF in neural tissue results from interfering specifically with ShcA function.
ShcA functions in neural progenitor survival signaling
We considered several possibilities for the cause of the ShcFFF microencephaly phenotype. First, the disruption of ShcA could interrupt proliferation, as previous hypotheses have suggested. Second, disturbing ShcA function could cause a premature neuronal differentiation. Additionally, interference with ShcA function may disrupt survival pathways, causing increased apoptosis. Alternatively, the increase in apoptotic cells in ShcFFF embryonic brains could be caused by an interruption in the phagocytic clearance of dead cells, leading to an accumulation of apoptotic cells.
Based on our data, there are no observed differences in either proliferation or differentiation between ShcFFF animals and their littermate controls. In addition, delaying the phagocytic clearance of dead cells would not account for the major reduction in brain size. Indeed, the most likely cause for the smaller brains in ShcFFF animals is the observed increase in apoptosis of neural progenitors during embryonic development. Such an increase in progenitor apoptosis would not only remove these cells from the neural progenitor population and prevent them from differentiating further but would further reduce the pool of transiently amplifying progenitor cells. The ShcFFF phenotype is reminiscent of those results obtained from mice irradiated during specific stages of embryonic development (Kitamura et al., 2001). These mice were microencephalic, with increased levels of CC3-positive cells in their brains, in addition to a moderate decrease in body weight.
Our data therefore suggest that ShcA functions in neural progenitors as part of a prosurvival pathway. Such a pathway may use neurotrophin receptors, such as the Trk family, which regulate survival signaling of neural progenitors in vitro (Barnabe-Heider and Miller, 2003) and signal through the mitogen-activated protein kinase kinase (MEK)/ERK or PI3K/Akt pathways to elicit a prosurvival response. Additionally, in various cell types, ShcA is a part of the activated ERK pathway via EGFR (epidermal growth factor receptor) and Grb2/Sos in response to reactive oxygen stress (Huang et al., 1996; Rao, 1996; Sattler et al., 2000), which leads to phosphorylation and inactivation of the proapoptotic protein Bad via p90Rsk, a target kinase of ERK (Bonni et al., 1999; Eisenmann et al., 2003; Chen et al., 2005). Thus, in the absence of a survival signal through ShcA, the apoptotic pathway may proceed unrestrained in neural progenitors, thereby leading to the widespread activation of caspase proteins and hence apoptosis.
Additional evidence that the Ras→Erk pathway is critical for brain development comes from the recent discovery that cardio-facio-cutaneous syndrome, characterized in part by mental retardation and macrocephaly (Kavamura et al., 2002), is caused by mutations in either B-Raf, MEK1, or MEK2 (Rodriguez-Ficiana et al., 2006). These mutations lead to increased activity of the Ras/Raf/MEK/ERK pathway when transfected in vitro. Thus, precise control of the activity of Ras→ERK signaling appears to be critical for normal brain development.
Cortical organization in the ShcFFF brain
A burst of apoptotic activity during a short period of neurogenesis predicts subsequent consequences on cortical lamination during later development. The mammalian cortex forms “inside-out” with the earliest born neurons occupying deeper layers in the brain and later born neurons in more superficial layers (Kubo and Nakajima, 2003). Therefore, increased neural progenitor apoptosis at E12 would result in a reduction of later born neurons impacting the thickness of cortical layers II through IV more so than earlier born, deeper neurons. This is exactly what we observed in ShcFFF animals.
In ShcFFF embryos, apoptosis is first seen in the caudal region of the brain at E10 with little apoptosis observed in rostral regions of the brain but is then high in both regions by E12. The localization of apoptotic cells within the brain varies between each region as well. In the frontal cortex, apoptotic cells are located from the middle of the cortex to the pial surface, whereas apoptotic cells in the pons are located in the periventricular zone. Because neuronal cells undergo differentiation as they migrate away from the ventricular layer toward the pial surface and neurogenesis proceeds in a caudal to rostral gradient, the distribution of apoptotic cells may simply reflect the major migratory routes of progenitors within each brain region.
Apoptosis and human microencephaly
The ShcFFF microencephaly phenotype is also reminiscent of some human microencephaly disorders. Human primary microencephaly, clinically defined as a reduction in head circumference greater than three SDs from the age- and sex-matched population mean, is caused by a reduction of brain growth in utero and is thought to result from insufficient production of neurons during neurogenesis (Woods, 2004).
The apoptotic phenotype in ShcFFF mice suggests an alternative mechanism for some forms of human microencephaly. To date, all six of the nonsyndromic primary microencephaly disorders in humans have been mapped, and none of their chromosomal locations coincides with the location of human Shc1 at 1q21 (Huebner et al., 1994; Yulug et al., 1995; Jamieson et al., 1999; Roberts et al., 1999; Moynihan et al., 2000; Jackson et al., 2002; Bond et al., 2003; Leal et al., 2003). Although four of these disorders are associated with mutations in genes (MCPH1/Microcephalin; MCPH3/CDK5RAP2; MCPH5/ASPM; MCPH6/CENPJ) encoding proteins that are thought to affect the normal progression of the cell cycle in neural progenitors (Jackson et al., 2002; Bond et al., 2003, 2005; Kumar et al., 2004; Trimborn et al., 2004; Xu et al., 2004), the etiology and molecular identity of the remaining two primary disorders and of the numerous secondary, syndromic microencephaly disorders are unknown.
In conclusion, our work establishes that ShcA has a previously unforeseen role in the survival of neural precursors during embryogenesis. Uncontrolled neuroprogenitor apoptosis may provide an alternative mechanism for some forms of human microencephaly, possibly implicating ShcA or other members of its signaling complex.
Footnotes
This work was supported by National Institutes of Health Grant NS-047378 (J.W.M.). We thank Dr. Paul Trampont from the Ravichandran laboratory for advice and assistance with ShcFFF and ShcAloxP mice, members of the Mandell laboratory for technical support and helpful discussions, Dr. Todd Stukenberg for his assistance with confocal microscopy, and Dr. Stacey Trotter for providing the GABAA receptor antibodies.
References
- Abercrombie M (1946). Estimation of nuclear population from microtome sections. Anat Rec 94:239–247. [DOI] [PubMed] [Google Scholar]
- Alvarez-Buylla A, Herrera D, Wichterle H (2000). The subventricular zone: source of neuronal precursors for brain repair. Prog Brain Res 127:1–11. [DOI] [PubMed] [Google Scholar]
- Barnabe-Heider F, Miller F (2003). Endogenously produced neurotrophins regulate survival and differentiation of cortical progenitors via distinct signaling pathways. J Neurosci 23:5149–5160. [DOI] [PMC free article] [PubMed] [Google Scholar]
- Berk M, Desai S, Heyman H, Colmenares C (1997). Mice lacking the ski proto-oncogene have defects in neurulation, craniofacial patterning, and skeletal muscle development. Genes Dev 11:2029–2039. [DOI] [PMC free article] [PubMed] [Google Scholar]
- Bond J, Scott S, Hampshire D, Springell K, Corry P, Abramowicz M, Mochida G, Hennekam R, Maher E, Fryns J, Alswaid A, Jafri H, Rashid Y, Mubaidin A, Walsh C, Roberts E, Woods C (2003). Protein-truncating mutations in ASPM cause variable reduction in brain size. Am J Hum Genet 73:1170–1177. [DOI] [PMC free article] [PubMed] [Google Scholar]
- Bond J, Roberts E, Springell K, Lizarraga S, Scott S, Higgins J, Hampshire D, Morrison E, Leal G, Silva E, Costa S, Baralle D, Raponi M, Karbani G, Rashid Y, Jafri H, Bennett C, Corry P, Walsh C, Woods C (2005). A centrosomal mechanism involving CDK5RAP2 and CENPJ controls brain size. Nat Genet 37:353–355. [DOI] [PubMed] [Google Scholar]
- Bonni A, Brunet A, West A, Datta S, Takasu M, Greenberg M (1999). Cell survival promoted by the Ras-MAPK signaling pathway by transcription-dependent and -independent mechanisms. Science 286:1358–1362. [DOI] [PubMed] [Google Scholar]
- Cattaneo E, Pelicci P (1998). Emerging roles for SH2/PTB-containing Shc adaptor protein in the developing mammalian brain. Trends Neurosci 21:476–481. [DOI] [PubMed] [Google Scholar]
- Chen X, Lau L, Fung Y, Yu A (2005). Inactivation of bad by site-specific phosphorylation: the checkpoint for ischemic astrocytes to initiate or resist apoptosis. J Neurosci Res 79:798–808. [DOI] [PubMed] [Google Scholar]
- Conti L, De Fraja C, Gulisano M, Migliaccio E, Govoni S, Cattaneo E (1997). Expression and activation of SH2/PTB-containing ShcA adaptor protein reflects the pattern of neurogenesis in the mammalian brain. Proc Natl Acad Sci USA 94:8185–8190. [DOI] [PMC free article] [PubMed] [Google Scholar]
- Conti L, Sipione S, Magrassi L, Bonfanti L, Rigamonti D, Pettirossi V, Peschanski M, Hadded B, Pelicci P, Milanesi G, Pelicci G, Cattaneo E (2001). Shc signaling in differentiating neural progenitor cells. Nat Neurosci 4:579–586. [DOI] [PubMed] [Google Scholar]
- Del Rio J, Martinez A, Fonseca M, Auladell C, Soriano E (1995). Glutamate-like immunoreactivity and fate of Cajal-Retzius cells in the murine cortex as identified with calretinin antibody. Cereb Cortex 5:13–21. [DOI] [PubMed] [Google Scholar]
- Eisenmann K, VanBrocklin M, Staffend N, Kitchen S, Koo H-M (2003). Mitogen-activated protein kinase pathway-dependent tumor-specific survival signaling in melanoma cells through inactivation of the proapototic protein Bad. Cancer Res 63:8330–8337. [PubMed] [Google Scholar]
- Ferrere A, Vitalis T, Gingras H, Gaspar P, Cases O (2006). Expression of Cux-1 and Cux-2 in the developing somatosensory cortex of normal and barrel-defective mice. Anat Rec A Discov Mol Cell Evol Biol 288:158–165. [DOI] [PubMed] [Google Scholar]
- Gambello M, Darling D, Yingling J, Tanaka T, Gleeson J, Wynshaw-Boris A (2003). Multiple dose-dependent effects of Lis1 on cerebral cortical development. J Neurosci 23:1719–1729. [DOI] [PMC free article] [PubMed] [Google Scholar]
- Gao Q, Wolfgang M, Neschen S, Morino K, Harvath T, Shulman G, Fu X (2004). Disruption of neural signal transducer and activator of transcription 3 causes obesity, diabetes, infertility, and thermal dysregulation. Proc Natl Acad Sci USA 101:4661–4666. [DOI] [PMC free article] [PubMed] [Google Scholar]
- Gotoh N, Tojo A, Shibuya M (1996). A novel pathway from phosphorylation of tyrosine residues 239/240 of Shc, contributing to suppress apoptosis by IL-3. EMBO J 15:6197–6204. [PMC free article] [PubMed] [Google Scholar]
- Haigh J, Morelli P, Gerhardt H, Haigh K, Tsien J, Damert A, Miquerol L, Muhlner U, Klein R, Ferrara N, Wagner E, Betsholtz C, Nagy A (2003). Cortical and retinal defects caused by dosage-dependent reductions in VEGF-A paracrine signaling. Dev Biol 262:225–241. [DOI] [PubMed] [Google Scholar]
- Huang R, Wu J, Fan Y, Adamson E (1996). UV activates growth factor receptors via reactive oxygen intermediates. J Cell Biol 133:211–220. [DOI] [PMC free article] [PubMed] [Google Scholar]
- Huebner K, Kastury K, Druck T, Salcini A, Lanfrancone L, Pelicci G, Lowenstein E, Li W, Park S, Cannizzaro L, Pelicci P, Schlessinger J (1994). Chromosome locations of genes encoding human signal transduction adapter proteins, Nck (NCK), Shc (Shc1) and Grb2 (GRB2). Genomics 22:281–287. [DOI] [PubMed] [Google Scholar]
- Jackson A, Eastwood H, Bell S, Adu J, Toomes C, Carr I, Roberts E, Hampshire D, Crow Y, Mighell A, Karbani G, Jafri H, Rashid Y, Mueller R, Markhan A, Woods C (2002). Identification of microcephalin, a protein implicated in determining the size of the human brain. Am J Hum Genet 71:136–142. [DOI] [PMC free article] [PubMed] [Google Scholar]
- Jamieson C, Govaerts C, Abramovicz M (1999). Primary autosomal recessive microcephaly: homozygosity mapping of MCPH4 to chromosome 15. Am J Hum Genet 65:1465–1469. [DOI] [PMC free article] [PubMed] [Google Scholar]
- Jiang Y, de Bruin A, Caldas H, Fangusaro J, Hayes J, Conway E, Robinson M, Altura R (2005). Essential role for survivin in early brain development. J Neurosci 25:6962–6970. [DOI] [PMC free article] [PubMed] [Google Scholar]
- Kavamura M, Peres C, Alchorne M, Brunoni D (2002). CFC index for the diagnosis of cardiofaciocutaneous syndrome. Am J Hum Genet 112:12–16. [DOI] [PubMed] [Google Scholar]
- Kitamura M, Itoh K, Matsumoto A, Hayashi Y, Sasaki R, Imai Y, Itoh H (2001). Prenatal ionizing radiation-induced apoptosis of the developing murine brain with special references to the expression of some proteins. Kobe J Med Sci 47:59–73. [PubMed] [Google Scholar]
- Kubo K, Nakajima K (2003). Cell and molecular mechanisms that control cortical layer formation in the brain. Keio J Med 52:8–20. [DOI] [PubMed] [Google Scholar]
- Kuida K, Zheng T, Na S, Kuan C-Y, Yang D, Karasuyama H, Rakic P, Flavell R (1996). Decreased apoptosis in the brain and premature lethality in CPP32-deficient mice. Nature 384:368–372. [DOI] [PubMed] [Google Scholar]
- Kuida K, Haydar T, Kuan C-Y, Gu Y, Taya C, Karasuyama H, Su MS-S, Rakic P, Flavell R (1998). Reduced apoptosis and cytochrome c-mediated caspase activation in mice lacking caspase-9. Cell 94:325–337. [DOI] [PubMed] [Google Scholar]
- Kumar A, Blanton S, Babu M, Markandaya M, Girimaji S (2004). Genetic analysis of primary microcephaly in Indian families: novel ASPM mutations. Clin Genet 66:341–348. [DOI] [PubMed] [Google Scholar]
- Lai K, Pawson T (2000). The ShcA phosphotyrosine docking protein sensitizes cardiovascular signaling in the mouse embryo. Genes Dev 14:1132–1145. [PMC free article] [PubMed] [Google Scholar]
- Leal G, Roberts E, Silva E, Costa S, Hampshire D, Woods C (2003). A novel locus for autosomal recessive primary microcephaly (MCPH6) maps to 13q12.2. J Med Genet 40:540–542. [DOI] [PMC free article] [PubMed] [Google Scholar]
- Lendahl U, Zimmerman L, McKay R (1990). CNS stem cells express a new class of intermediate filament protein. Cell 60:585–595. [DOI] [PubMed] [Google Scholar]
- Lossi L, Tamagno I, Merighi A (2004). Molecular morphology of neuronal apoptosis: analysis of caspase 3 activation during postnatal development of mouse cerebellar cortex. J Mol Histol 35:621–629. [DOI] [PubMed] [Google Scholar]
- Luzi L, Confalonieri S, Di Fiore P, Pelicci P (2000). Evolution of Shc functions from nematode to human. Curr Opin Genet Dev 10:668–674. [DOI] [PubMed] [Google Scholar]
- McEvilly R, de Diaz M, Schonemann M, Hooshmand F, Rosenfeld M (2002). Transcriptional regulation of cortical neuron migration by POU domain factors. Science 295:1528–1532. [DOI] [PubMed] [Google Scholar]
- Migliaccio E, Giorgio M, Mele S, Pelicci G, Reboldi P, Pandolfi P, Lanfrancone L, Pelicci P (1999). The p66shc adaptor protein controls oxidative stress response and life span in mammals. Nature 402:309–313. [DOI] [PubMed] [Google Scholar]
- Mignone J, Kukekov V, Chiang A-S, Steindler D, Enikolopov G (2004). Neural stem and progenitor cells in Nestin-GFP transgenic mice. J Comp Neurol 469:311–324. [DOI] [PubMed] [Google Scholar]
- Moynihan L, Jackson A, Roberts E, Karbani G, Lewis I, Corry P, Turner G, Mueller R, Lench N, Woods C (2000). A third novel locus for primary autosomal recessive microcephaly maps to chromosome 9q34. Am J Hum Genet 66:724–727. [DOI] [PMC free article] [PubMed] [Google Scholar]
- Nakamura T, Muraoka S, Sanokawa R, Mori N (1998). N-Shc and Sck, two neuronally expressed Shc adapter homologs. Their differential regional expression in the brain and roles in neurotrophin and Src signaling. J Biol Chem 273:6960–6967. [DOI] [PubMed] [Google Scholar]
- Napoli C, Martin-Padura I, de Nigris F, Giorgio M, Mansueto G, Somma P, Condorelli M, Sica G, De Rosa G, Pelicci P (2003). Deletion of the p66Shc longevity gene reduces systemic and tissue oxidative stress, vascular cell apoptosis, and early atherogenesis in mice fed a high-fat diet. Proc Natl Acad Sci USA 100:2112–2116. [DOI] [PMC free article] [PubMed] [Google Scholar]
- O’Bryan J, Songyang Z, Cantley L, Der C, Pawson T (1996). A mammalian adaptor protein with conserved Src homology 2 and phosphotyrosine-binding domains is related to Shc and is specifically expressed in the brain. Proc Natl Acad Sci USA 93:2729–2734. [DOI] [PMC free article] [PubMed] [Google Scholar]
- Oomman S, Finckbone V, Dertien J, Attridge J, Henne W, Medina M, Mansouri B, Singh H, Strahlendorf H, Strahlendorf J (2004). Active caspase-3 expression during postnatal development of rat cerebellum is not systematically or consistently associated with apoptosis. J Comp Neurol 476:154–173. [DOI] [PubMed] [Google Scholar]
- Paxinos G, Franklin K (2001). In: The mouse brain in stereotaxic coordinates Ed 2 San Diego: Academic.
- Pelicci G, Lanfrancone L, Grignani F, McGlade J, Cavallo F, Forni G, Nicoletti I, Grignani F, Pawson T, Pelicci P (1992). A novel transforming protein (SHC) with an SH2 domain is implicated in mitogenic signal transduction. Cell 70:93–104. [DOI] [PubMed] [Google Scholar]
- Pelicci G, Dente L, De Giuseppe A, Verducci-Galletti B, Giuli S, Mele S, Vetriani C, Giorgio M, Pandolfi P, Cesareni G, Pelicci P (1996). A family of Shc related proteins with conserved PTB, CH1 and SH2 regions. Oncogene 13:633–641. [PubMed] [Google Scholar]
- Pellegrini M, Pacini S, Baldari C (2005). p66SHC: the apoptotic side of Shc proteins. Apoptosis 10:13–18. [DOI] [PubMed] [Google Scholar]
- Ponti G, Conti L, Cataudella T, Zuccato C, Magrassi L, Rossi F, Bonfanti L, Cattaneo E (2005). Comparative expression profiles of ShcB and ShcC phosphotyrosine adapter molecules in the adult brain. Neuroscience 133:105–115. [DOI] [PubMed] [Google Scholar]
- Pompeiano M, Blaschke A, Flavell R, Srinivasan A, Chun J (2000). Decreased apoptosis in proliferative and postmitotic regions of the caspase-3 deficient embryonic central nervous system. J Comp Neurol 423:1–12. [PubMed] [Google Scholar]
- Rao G (1996). Hydrogen peroxide induces complex formation of SHC-Grb2-SOS with receptor tyrosine kinase and activates Ras and extracellular signal-regulated protein kinases group of mitogen-activated protein kinases. Oncogene 13:713–719. [PubMed] [Google Scholar]
- Ravichandran K (2001). Signaling via Shc family adapter proteins. Oncogene 20:6322–6330. [DOI] [PubMed] [Google Scholar]
- Roberts E, Jackson A, Carradice A, Deeble V, Mannan J, Rashid Y, Jafri H, McHale D, Markham A, Lench N, Woods C (1999). The second locus for autosomal recessive primary microcephaly (MCPH2) maps to chromosome 19q13.1–13.2. Eur J Hum Genet 7:815–820. [DOI] [PubMed] [Google Scholar]
- Rodriguez-Ficiana P, Tetsu O, Tidyman W, Estep A, Conger B, Santa Cruz M, McCormick F, Rauen K (2006). Germline mutations in genes within the MAPK pathway cause cardio-facio-cutaneous syndrome. Science 311:1287–1290. [DOI] [PubMed] [Google Scholar]
- Romanko M, Rola R, Fike J, Szele F, Dizon M, Felling R, Brazel C, Levison S (2004). Roles of the mammalian subventricular zone in cell replacement after brain injury. Prog Neurobiol 74:77–99. [DOI] [PubMed] [Google Scholar]
- Rozakis-Adcock M, McGlade J, Mbamalu G, Pelicci G, Daly R, Li W, Batzer A, Thomas S, Brugge J, Pelicci P, Schlessinger J, Pawson T (1992). Association of the Shc and Grb2/Sem5 SH2-containing proteins is implicated in activation of the Ras pathway by tyrosine kinases. Nature 360:689–692. [DOI] [PubMed] [Google Scholar]
- Sabapathy K, Jochum W, Hochedlinger K, Chang L, Karin M, Wagner E (1999). Defective neural tube morphogenesis and altered apoptosis in the absence of both JNK1 and JNK2. Mech Dev 89:115–124. [DOI] [PubMed] [Google Scholar]
- Sakai R, Henderson J, O’Bryan J, Elia A, Saxton T, Pawson T (2000). The mammalian ShcB and ShcC phosphotyrosine docking proteins function in the maturation of sensory and sympathetic neurons. Neuron 28:819–833. [DOI] [PubMed] [Google Scholar]
- Sattler M, Verma S, Shrikhande G, Byrne C, Pride Y, Winkler T, Greenfield E, Salgia R, Griffin J (2000). The BCR/ABL tyrosine kinase induces production of reactive oxygen species in hematopoietic cells. J Biol Chem 275:24273–24278. [DOI] [PubMed] [Google Scholar]
- Schambra U, Lauder J, Silver J (1992). In: Atlas of the prenatal mouse brain Ed 1 San Diego: Academic. [DOI] [PubMed]
- Schorle H, Meier P, Buchert M, Jaenisch R, Mitchell P (1996). Transcription factor AP-2 essential for cranial closure and craniofacial development. Nature 381:235–238. [DOI] [PubMed] [Google Scholar]
- Trimborn M, Bell S, Felix C, Rashid Y, Jafri H, Griffiths P, Neumann L, Krebs A, Reis A, Sperling K, Neitzel H, Jackson A (2004). Mutations in microcephalin cause aberrant regulation of chromosome condensation. Am J Hum Genet 75:261–266. [DOI] [PMC free article] [PubMed] [Google Scholar]
- Tronche F, Kellendonk C, Kretz O, Gass P, Anlag K, Organ P, Bock R, Klein R, Schutz G (1999). Disruption of the glucocorticoid receptor gene in the nervous system results in reduced anxiety. Nat Genet 23:99–103. [DOI] [PubMed] [Google Scholar]
- Urase K, Kouroku Y, Fujita E, Momoi T (2003). Region of caspase-3 activation and programmed cell death in the early development of the mouse forebrain. Dev Brain Res 145:241–248. [DOI] [PubMed] [Google Scholar]
- van der Geer P, Wiley S, Gish G, Pawson T (1996). The Shc adaptor protein is highly phosphorylated at conserved, twin tyrosine residues (Y239/Y240) that mediate protein-protein interactions. Curr Biol 6:1435–1444. [DOI] [PubMed] [Google Scholar]
- Wong-Riley M (1979). Changes in the visual system of monocularly sutured or enucleated cats demonstrable with cytochrome oxidase histochemistry. Brain Res 171:11–28. [DOI] [PubMed] [Google Scholar]
- Woods C (2004). Human microcephaly. Curr Opin Neurobiol 14:112–117. [DOI] [PubMed] [Google Scholar]
- Xu X, Lee J, Stern D (2004). Microcephalin is a DNA damage response protein involved in regulation of CHK1 and BRCA1. J Biol Chem 279:34091–34094. [DOI] [PubMed] [Google Scholar]
- Yan X, Najbauer J, Woo C, Dashtipour K, Ribak C, Leon M (2001). Expression of active caspase-3 in mitotic and postmitotic cells of the rat forebrain. J Comp Neurol 433:4–22. [DOI] [PubMed] [Google Scholar]
- Yulug I, Egan S, See C, Fisher E (1995). A human SHC-related sequence maps to chromosome 17, the SHC gene maps to chromosome 1. Hum Genet 96:245–248. [DOI] [PubMed] [Google Scholar]
- Zhang L, Camerini V, Bender T, Ravichandran K (2002). A nonredundant role for the adapter protein Shc in thymic T cell development. Nat Immunol 3:749–755. [DOI] [PubMed] [Google Scholar]
- Zimmerman L, Parr B, Lendahl U, Cunningham M, McKay R, Gavin B, Mann J, Vassileva G, McMahon A (1994). Independent regulatory elements in the nestin gene direct transgene expression to neural stem cells or muscle precursors. Neuron 12:11–24. [DOI] [PubMed] [Google Scholar]