

Abstract
Neurotransmission during development regulates synaptic maturation in neural circuits, but the contribution of different neurotransmitter systems is unclear. We investigated the role of GABAA receptor-mediated Cl− conductances in the development of synaptic responses in the Xenopus visual system. Intracellular Cl− concentration ([Cl−]i) was found to be high in immature tectal neurons and then falls over a period of several weeks. GABAergic synapses are present at early stages of tectal development and, when activated by optic nerve stimulation or visual stimuli, induce sustained depolarizing Cl− conductances that facilitate retinotectal transmission by NMDA receptors. To test whether depolarizing GABAergic inputs cooperate with NMDA receptors during activity-dependent maturation of glutamatergic synapses, we prematurely reduced [Cl−]i in tectal neurons in vivo by expressing the Cl− transporter KCC2. This blocked the normal developmental increase in AMPA receptor-mediated retinotectal transmission and increased GABAergic synaptic input to tectal neurons. Therefore, depolarizing GABAergic transmission plays a pivotal role in the maturation of excitatory transmission and controls the balance of excitation and inhibition in the developing retinotectal circuit.
Keywords: synaptic development, activity-dependent, intracellular chloride, GABAergic transmission, glutamatergic transmission, visual system
Introduction
The strength, distribution, and type of synaptic inputs determine the behavior of a neuron within a neural circuit. For instance, experiments in sensory systems illustrate that the balance of excitatory and inhibitory connections dictates how a neuron integrates and processes information (Wehr and Zador, 2003; Gabernet et al., 2005). The mechanisms controlling the development of excitatory and inhibitory inputs are still unclear, but it is widely believed that neural activity is important. Activation of NMDA receptors (NMDARs) plays a central role in the development of excitatory synapses and circuits, including the retinotectal system (Rajan et al., 1999; Aamodt et al., 2000). During glutamatergic synaptic development, NMDARs are thought to be present and functional at nascent synapses, whereas AMPA receptors (AMPARs) are trafficked to, and stabilized at, synaptic sites as the cell matures (Wu et al., 1996; Isaac et al., 1997; Xiao et al., 2004). Trafficking AMPARs into NMDAR-only synapses requires NMDAR activity, Ca2+ influx, and calcium/calmodulin-dependent kinase II activity (Pettit et al., 1994; Shi et al., 1999; Zhu and Malinow, 2002). Because of the voltage-dependent Mg2+ block of the NMDAR, one open question concerns the source of membrane depolarization required for NMDAR activity under conditions when AMPAR activity is low.
During development, GABAA receptor (GABAAR) activation by GABA, the traditional inhibitory transmitter, can provide significant membrane depolarization (Ben-Ari, 2002; Owens and Kriegstein, 2002). This depolarization results from the immature expression of Cl− transporters that generate a relatively positive Cl− reversal potential (ECl−), and its consequences depend on the degree of depolarization and the nature of other active conductances. For instance, in immature hippocampus, exogenous application of GABAAR agonists can decrease the Mg2+ block of single NMDARs and increase NMDAR-mediated Ca2+ influx (Leinekugel et al., 1997). Therefore, during network activity in the developing brain, postsynaptic depolarizing GABAergic Cl− conductances may provide a source of membrane depolarization that relieves the NMDAR Mg2+ block and may be required for NMDAR-mediated developmental increases in AMPAR-mediated transmission.
In vivo pharmacological and genetic manipulation experiments indicate that GABAergic activity is required for synaptic circuit development (Hensch et al., 1998; Tao and Poo, 2005). Here we investigate the impact of postsynaptic GABAergic conductances on synaptic development in the retinotectal system of Xenopus laevis. We show that ECl− is depolarizing around the time of retinal afferent innervation and that retinal activity evokes robust GABAAR-mediated Cl− conductances that are ideally suited to facilitate NMDAR transmission. Recent experiments in dissociated neurons reveal that early expression of the Cl− transporter KCC2 can shift ECl− (Lee et al., 2005) and augments GABAergic synaptic development (Chudotvorova et al., 2005). To test whether depolarizing GABAergic Cl− conductances are required for normal synaptic development in the retinotectal circuit, we manipulated ECl− in vivo by premature expression of KCC2. Tectal neurons that had a mature [Cl−]i imposed failed to develop normal glutamatergic inputs but acquired a stronger contribution from GABAergic inputs. These experiments support a model in which early GABAergic inputs cooperate with NMDARs to mediate developmental plasticity of glutamatergic synapses and the balance of excitatory and inhibitory circuits within the retinotectal system.
Materials and Methods
Electrophysiology.
Albino X. laevis tadpoles were reared under controlled conditions (20°C, 12 h light/dark cycle), and embryo stages were consistent with published criteria (Nieukoop and Faber, 1994) (4 d, stage 40; 8 d, stage 47; 16 d, stage 48/49; 32 d, stage 50/51). For whole-brain recordings, tadpole brains were prepared as described previously (Wu et al., 1996). Animals were anesthetized in 0.02% tricaine methanesulphonate (MS-222), and brains were cut along the dorsal midline to expose the ventricular surface and dissected into extracellular saline (115 mm NaCl, 2 mm KCl, 3 mm CaCl2, 1.5 mm MgCl2, 5 mm HEPES, 10 mm glucose, and 10 μm glycine, pH 7.2, osmolality of 255 mOsm). Brains were laid flat in a submerged perfusion chamber and maintained at room temperature (20–22°C). For electrical stimulation experiments, a bipolar stimulating electrode (Frederick Haer Company, Bowdoinham, ME) was placed in the optic chiasm to activate retinal ganglion cell (RGC) axons that terminate in the tectum. For in vivo recordings, tadpoles were deeply anesthetized in MS-222, transferred to extracellular saline containing 2 μg/ml α-bungarotoxin (Calbiochem, San Diego, CA) to prevent eye movements, and then stabilized with dissecting pins, and the tectal lobes were exposed by removing the overlying skin (Zhang et al., 1998; Aizenman et al., 2003). Visual stimuli consisted of monocular whole-field flashes from a computer-controlled green light-emitting diode (λmax 567 nm; Allied Electronics, Fort Worth, TX) presented to the contralateral eye. Responses were recorded to 1 s OFF stimuli, presented at a frequency of 0.05 Hz.
To compare across different ages, we recorded from neurons that were rostral of the proliferative zone, in the central 50% of the tectum. Recordings were made using glass micropipettes (5–9 MΩ) filled with the appropriate intracellular solution (pH 7.2, osmolality of 255 mOsm). All reported voltages were corrected for the liquid junction potential (LJP) that was measured between the intracellular and extracellular solution. A stabilized microelectrode holder was used to minimize pipette drift (G23 Instruments, London, UK). Neurons had input resistances in the range 1–4 GΩ and series resistances <50 MΩ, which were monitored throughout the experiments. Signals were measured with an Axopatch 200B, Axoclamp 2B, or Multiclamp 700A amplifier (all from Molecular Devices, Palo Alto, CA) and digitized using a Digidata 1200 or 1322A analog-to-digital board (Molecular Devices). Stimulation and data acquisition was performed with pClamp8 software (Molecular Devices) and digitized at 10 kHz. Data was analyzed off-line using custom Matlab software (MathWorks, Natick, MA) and pClamp9 (Molecular Devices). Unless otherwise stated, drugs and other reagents were obtained from Sigma (St. Louis, MO). As required, the following antagonists and blockers were added to the extracellular solution: CNQX (20 μm; Tocris Cookson, Ballwin, MO), SR95531 [2-(3-carboxypropyl)-3-amino-6-(4-methoxyphenyl)pyridazinium bromide] (5 μm; Tocris Cookson), APV (100 μm; Tocris Cookson), strychnine (60 μm), tetrodotoxin (TTX) (1 μm; Alomone Labs, Jerusalem, Israel), and CGP55845 [(±)-amino-4-carboxy-methyl-phenylacetic acid] (50 μm; Tocris Cookson). QX-314 [2(triethylamino)-N-(2,6-dimethylphenyl) acetamine] (2 mm; Alomone Labs) was added to the intracellular recording solution. Data were tested for normality using a Kolmogorov–Smirnov test. Those deemed normal were compared using parametric tests (t test, ANOVA), and those deemed non-normal were compared using nonparametric tests (Mann–Whitney U test, Kruskal–Wallis test). All tests were two-tailed.
Gramicidin recordings.
For gramicidin recordings, we used a K+-based intracellular solution with either low [Cl−]i [solution 1 (in mm): 114 K-gluconate, 1 MgCl2, 20 HEPES, 10 EGTA, 2 ATP, and 0.3 GTP (LJP of 12 mV)] or high [Cl−]i [solution 2 (in mm): 114 KCl, 1 MgCl2, 20 HEPES, 10 EGTA, 2 ATP, and 0.3 GTP (LJP of 4 mV)]. These intracellular solutions generate a substantial shift in ECl− on moving from perforated to whole-cell mode. Gramicidin (Calbiochem) was dissolved in dimethylsulfoxide to produce a stock solution (5 mg/ml). Every 3 h, 4 μl of this stock was added to 1 ml of prefiltered intracellular solution and sonicated for 30 s to produce a final gramicidin concentration of 20 μg/ml. TTX was added to the extracellular solution to block voltage-gated sodium currents and action-potential activity. After formation of a tight membrane seal, perforation was evaluated by monitoring the decrease in access resistance, which usually stabilized between 8 and 20 min (Kyrozis and Reichling, 1995). After measurement of ECl−, the integrity of the perforated patch was confirmed by applying suction to rupture the underlying plasma membrane and observing both a decrease in access resistance and a shift in ECl− that was consistent with the intracellular solution. In both perforated and whole-cell recordings, access resistance was determined by analyzing transient responses to voltage-clamp steps, and all membrane potential (Vm) measurements were subsequently corrected for the voltage drop across the series resistance. ECl− was calculated from the amplitude of muscimol-evoked (30 μm) or GABA-evoked (50 μm; Tocris Cookson) currents at different command potentials. We assumed that, unlike with nyastatin and amphotericin, gramicidin patches lacked a permeant anion on either side of the sealed membrane and therefore a Donnan potential was unlikely to develop (Kyrozis and Reichling, 1995). Repeated agonist application can influence the apparent ECl−, particularly in immature neurons in which Cl− regulation mechanisms are less effective (Ehrlich et al., 1999). Therefore, the interval between agonist applications was made sufficiently long (30–60 s) to avoid shifts in ECl−, even in the youngest neurons (data not shown). Agonists were applied through a patch pipette connected to a picospritzer (5–10 psi for 20–50 ms; General Valve, Fairfax, NJ), adjusted such that current amplitudes did not exceed 200 pA. Peak currents were plotted as a function of voltage, and ECl− was defined as the x-intercept value of the current–voltage curve. Recordings were performed in HEPES-buffered saline, and EGABAA was confirmed as an appropriate measure of ECl− by establishing that the EGABAA measured in whole-cell configuration with different intracellular Cl− solutions was predicted by the Nernst equation. Separate experiments in a bicarbonate-buffered extracellular solution revealed a similar developmental shift in EGABAA in the tadpole tectum, supporting the conclusion that high [Cl−]i underlies and dominates the depolarizing GABAAR responses in immature tectal neurons (data not shown). Resting membrane potential (RMP) was measured in whole-cell current-clamp recordings with intracellular solution 2, minus gramicidin.
Isolating conductances.
Synaptically evoked glutamate receptor currents and Cl− currents were recorded using a Cs+-based intracellular solution [solution 3 (in mm): 114 Cs-methane sulfonate, 1.5 MgCl2, 3 tetraethylammonium-Cl, 20 HEPES, 10 EGTA, 2 ATP, and 0.3 GTP (LJP of 10 mV)] and were isolated by voltage clamping at the reversal potential of the currents. Cl− conductances were isolated and measured as outward currents at a holding potential (Vh) of 0 mV (the reversal potential for glutamatergic currents under these conditions). Meanwhile, AMPA conductances were isolated and measured as inward currents at a Vh of −70 mV (just above the reversal potential for Cl− currents and at which NMDARs exhibit strong open channel block by external Mg2+). To reveal AMPA–GABAA sequences within the same trial (see Fig. 2C), we added APV extracellularly and recorded at a Vh intermediate to the glutamatergic and Cl− current reversal potentials (−40 mV). When AMPA, GABAA, and NMDA conductances were isolated in the same cell (see Fig. 4A), we recorded AMPA and GABAA conductances (Vh of −70 and 0 mV, respectively), and then applied SR95531 extracellularly and recorded the combined AMPA and (unblocked) NMDA conductance as an outward current at a Vh of +45 mV. In experiments in which NMDA responses were isolated from all other conductances and recorded at voltages between −80 and +50 mV (see Figs. 4B, 5D), CNQX, SR95531, and strychnine were added to the extracellular solution and QX-314 was added to the intracellular solution. CGP55845 was added extracellularly in some experiments but had no effect on the evoked currents. For all experiments using bursts of afferent stimulation (one to three stimuli, 50 Hz), for each cell, the stimulation intensity was set such that a single stimulus evoked a monosynaptic AMPA current of 50–100 pA at a Vh of −70 mV. For minimal stimulation experiments, the stimulus intensity was gradually increased from zero to the point at which stable, nonfailures of transmission were observed. These synaptic responses are believed to represent the transmission from a single retinal axon, although each axon can make multiple synaptic contacts with a single tectal cell (Wu et al., 1996). Current onset latencies were defined as the time from the stimulus artifact to 5% of the peak current. Conductances were calculated by dividing the current by the driving force.
Figure 2.
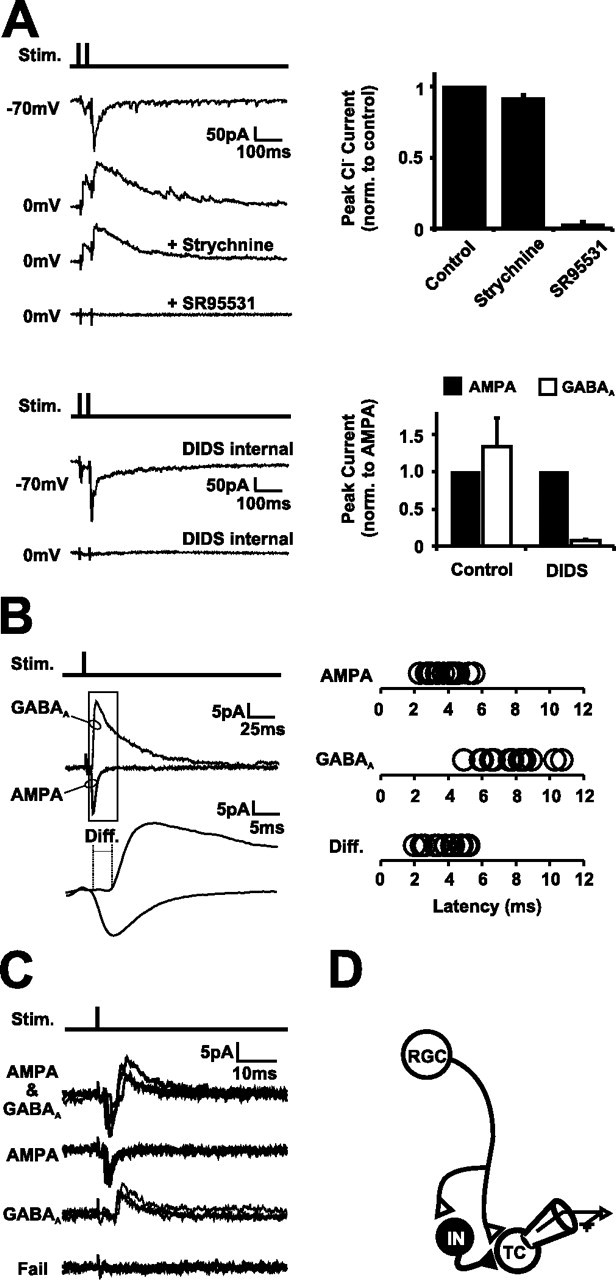
Retinal activity drives a feedforward GABAergic circuit. A, Retinotectal synaptic responses were evoked by stimulation of RGC axons in the optic chiasm. SR95531, a GABAAR antagonist, blocked the synaptically evoked Cl− currents (n = 6 cells), but strychnine, a glycine receptor antagonist, did not. The Cl− conductance was also blocked by intracellular dialysis of a recording solution containing DIDS (n = 12 and 10 cells for control and DIDS solutions, respectively). The stimulus artifact in the example traces and, in the following examples, has been truncated for clarity. B, GABAA synaptic currents evoked by retinal afferent stimulation are delayed compared with AMPA currents. A single stimulus to the optic chiasm evoked a monosynaptic AMPA response (Vh of −70 mV) that was followed by a delayed GABAA response (Vh of 0 mV) in the same tectal neuron (n = 15 cells). C, Minimal stimulation of the optic chiasm while recording tectal cell responses at an intermediate command potential (Vh of −40 mV) evoked AMPA–GABAA sequences as well as trials in which the AMPA, the GABAA, or both components of the response failed (n = 8 cells). D, These data are consistent with the existence of a disynaptic feedforward GABAergic circuit at these early stages of retinotectal development (4 dpf). Retinal afferents (RGC) provide direct monosynaptic glutamatergic input to tectal cells (TC), and GABAergic interneurons (IN) within this population of cells provide a source of feedforward GABAergic input.
Figure 4.
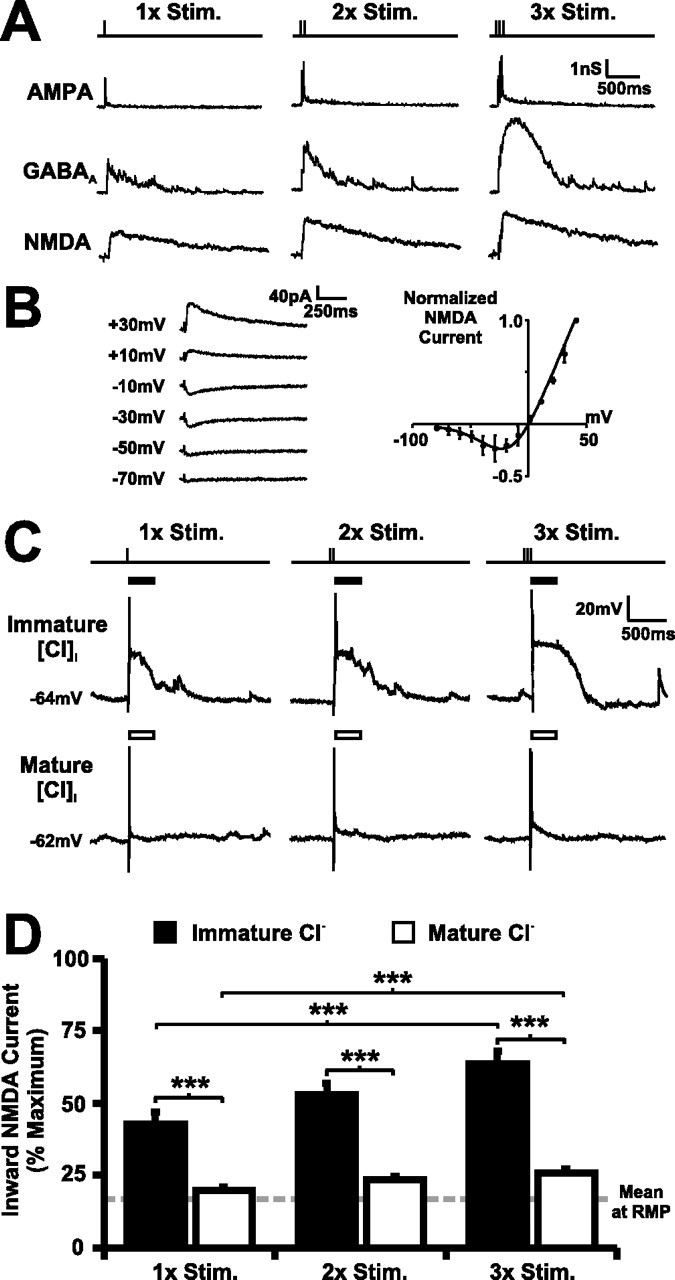
Cl− conductances are well placed to modulate NMDAR transmission in the immature retinotectal circuit. A, Isolated AMPA, GABAA, and NMDA synaptic conductances in a 4 dpf tectal neuron shown for one, two, and three stimuli trains delivered to the optic chiasm (50 Hz). The sustained GABAA conductance has a temporal profile similar to the NMDA conductance. B, Synaptically evoked NMDA responses in 4 dpf tectal neurons (n = 11 cells) show classic voltage-dependent block by extracellular Mg2+, and the relationship between NMDA current and membrane potential can be described by an exponential function (see Materials and Methods). C, Voltage traces from two neighboring 4 dpf tectal cells after imposing a mature (bottom) or immature (top) [Cl−]i by dialysis of different intracellular recording solutions. Inward NMDAR current was estimated from the voltage waveforms over a 250 ms window after stimulation (bars). D, The 4 dpf cells that had an immature [Cl−]i imposed (n = 13 cells) showed large NMDA currents that approached the maximal inward NMDA current. In contrast, 4 dpf cells that had a mature [Cl−]i imposed (n = 14 cells) showed small inward NMDA currents that were close to those measured at RMP (14.6% of maximal inward NMDA current). The difference between immature and mature [Cl−]i was highly significant (∗∗p < 0.001), with the increase in NMDA unblock over rest being fivefold greater in cells with immature [Cl−]i than in cells with mature [Cl−]i. Error bars indicate SEM. ∗∗∗p < 0.001.
Figure 5.
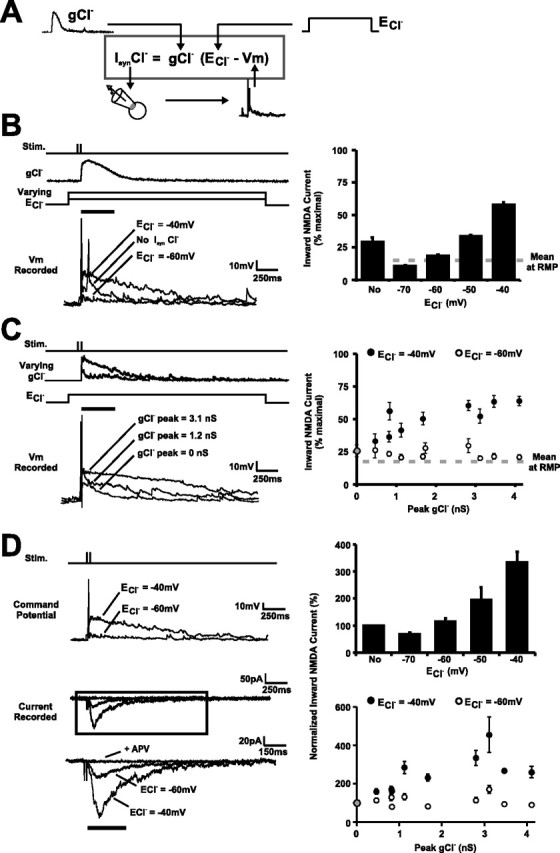
Developmental shifts in [Cl−]i impact NMDAR transmission in the retinotectal circuit. A, Synaptic Cl− currents (IsynCl−) were simulated using dynamic clamp and paired with responses evoked by RGC afferent stimulation. Waveforms for gCl− were taken from real GABAA conductances (see Fig. 3B). B, Voltage traces (left) from a 4 dpf tectal cell showing responses to RGC afferent stimulation (2 stimuli, 50 Hz) paired with no IsynCl−, a dynamic IsynCl− with an ECl− of −40 mV, or a dynamic IsynCl− with an ECl− of −60 mV. The waveform for gCl− was the median GABAA conductance, after ranking by peak amplitude (Fig. 3B). Summary graph (right) shows estimated NMDA inward current in response to RGC afferent stimulation paired with a dynamic IsynCl− with different ECl− values (−70, −60, −50, and −40 mV) or no IsynCl− (No). ECl− had a highly significant effect on inward NMDA current (p < 0.001; n = 18 cells). C, Voltage traces (left) from a 4 dpf tectal cell showing responses to RGC afferent stimulation combined with a dynamic IsynCl− whose peak gCl− was 0 nS (no IsynCl−), 1.2 nS, or 3.1 nS. ECl− was −40 mV. Summary graph (right) shows the estimated inward NMDA current after paired RGC afferent stimulation and dynamic IsynCl− with different peak gCl− values (n = 14 cells). ECl− was −40 mV (immature) for filled symbols and −60 mV (mature) for open symbols. D, Measuring synaptic NMDA currents under Vm waveforms shaped by different IsynCl−. NMDA currents in a 4 dpf tectal cell (left) were pharmacologically isolated (see Materials and Methods) and evoked by pairing RGC afferent stimulation (2 stimuli, 50 Hz) with different command potential waveforms derived from the dynamic-clamp experiments in B and C. The synaptically evoked current was blocked by APV, confirming that it was carried by NMDARs. Summary graphs (right) compare NMDA currents recorded under Vm waveforms in which peak gCl− and ECl− had been systematically varied (n = 14 cells). Values are expressed as percentage of NMDA inward current recorded under Vm waveforms in which there had been no IsynCl− (corresponding to “No” and 0 nS). Error bars indicate SEM.
Dialysis and dynamic-clamp experiments.
To impose an “immature” or “mature” [Cl−]i by dialysis, two different intracellular solutions were used: the first with 26 mm Cl− [solution 4 (in mm): 90 K-gluconate, 18 KCl, 5 NaCl, 1.5 MgCl2, 20 HEPES, 10 EGTA, 2 ATP, and 0.3 GTP (LJP of 10 mV)] and the second with 11 mm Cl− [solution 5 (in mm): 104 K-gluconate, 3 KCl, 5 NaCl, 1.5 MgCl2, 20 HEPES, 10 EGTA, 2 ATP, and 0.3 GTP (LJP of 11 mV)]. For dynamic-clamp recordings, we blocked GABAARs only in the recorded cell by using a K+-based intracellular solution containing 4,4′-diisothiocyanatostilbene-2,2′-disulfonic acid (DIDS) and F− [solution 5 (in mm): 105 potassium fluoride, 8 KCl, 20 HEPES, 10 EGTA, and 0.5–1 DIDS (LJP of 7 mV)] (Nelson et al., 1994). DIDS was made as a 500 mm stock in DMSO, and 1–2 μl was added to 1 ml of intracellular solution. DIDS was used at the earliest developmental stages and therefore was unlikely to affect any endogenous KCC2 activity. Control experiments established the ability of the DIDS to block GABAARs by confirming that it attenuated synaptically evoked Cl− currents (94% block; 12 cells) (see Fig. 2A). Recordings of muscimol-evoked currents at different holding potentials supported the observation that the DIDS solution reduced the GABAAR conductance (90% block; nine cells; data not shown). In some cells, dynamic clamp was performed with intracellular solution 4, and GABAARs were blocked extracellularly with SR95531. For dialysis and dynamic-clamp experiments, neurons had input resistances in the range 1–4 GΩ and were only used if the series resistances was <25 MΩ. RGC stimulation intensity was first set in voltage clamp such that a single stimulus generated a monosynaptic AMPA current of 50–100 pA at a Vh of −70 mV. Recordings were then switched to current clamp to monitor the membrane potential of the cell during activation of the retinotectal circuit. In the dynamic-clamp experiments, RGC afferent stimulation was paired with “real” synaptic Cl− conductances [delivered 10 ms after afferent stimulation (taken from Fig. 3B)], which were simulated by a custom-made analog multiplying amplifier (10 MHz bandwidth, AD734; Analog Devices, Norwood, MA) that injected current (IsynCl−) dynamically as a function of the conductance (gCl−) and driving force (ECl− − Vm), according to the following equation: IsynCl− = gCl−(ECl− − Vm). The resulting voltage waveforms were used to estimate how synaptic Cl− conductances impacted NMDAR transmission. The current–voltage relationship for the NMDAR was derived from recordings of pharmacologically isolated NMDA responses in 4 day post-fertilization (dpf) tectal neurons (see Fig. 4) and was described with the following equation: I(t) = [Vm(t) − ENMDA]/[1 + K1exp(−K2 Vm(t)), where K1 = 0.3, K2 = 0.07, Vm is the membrane potential, and ENMDA is the reversal potential of the NMDAR (Ascher and Nowak, 1988; Jahr and Stevens, 1990). Estimated NMDA currents are reported as the fraction of maximal net inward current over a 250 ms window immediately after retinal afferent stimulation, during which NMDARs on tectal cells are known to be activated by glutamate (see Fig. 4). Similar results were obtained for 100 and 500 ms windows.
Figure 3.
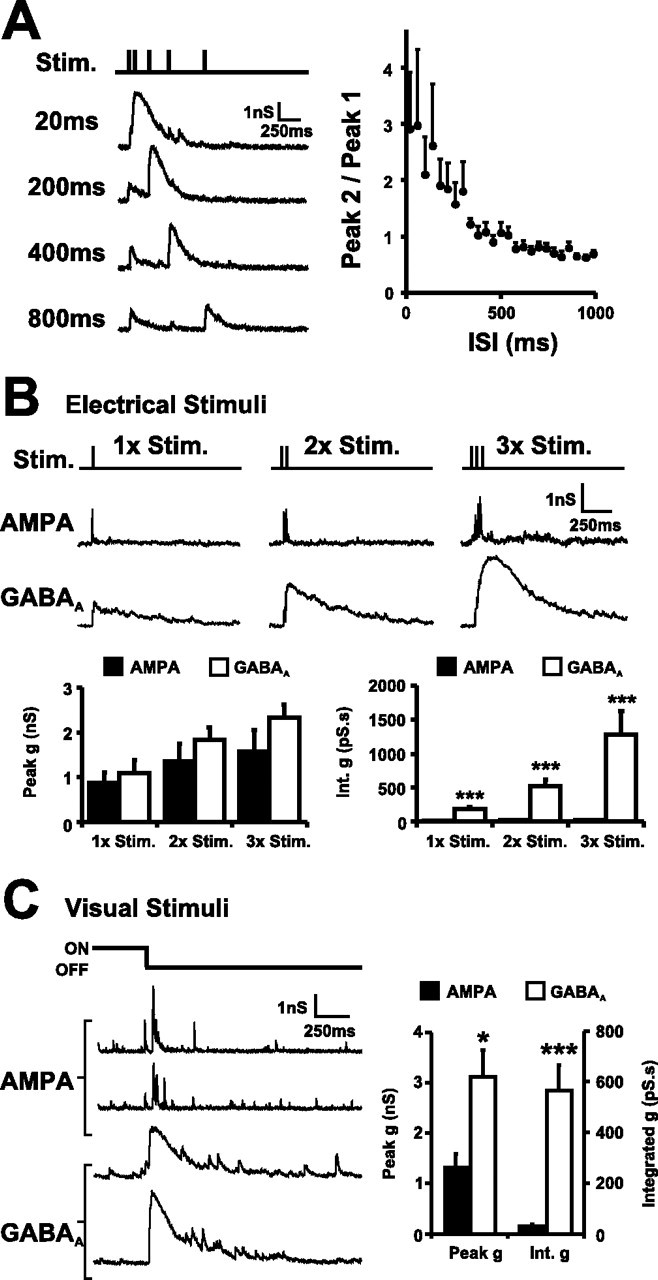
GABAergic inputs are recruited by retinal afferent activity. A, GABAergic activity was substantially enhanced in response to stimuli delivered in close succession. GABAA conductances (Vh of 0 mV) were evoked by pairs of optic nerve stimuli delivered at different intervals (ISI of 20, 200, 400, and 800 ms; n = 12 cells). B, The integrated conductance for GABAA synaptic responses evoked by trains of afferent stimulation (1–3 stimuli, 50 Hz) was substantially larger than AMPA responses in the same neuron, although peak conductances were comparable. AMPA (Vh of −70 mV) and GABAA (Vh of 0 mV) responses are displayed as conductances (n = 9 cells). C, Visual stimuli recruit substantial GABAergic activity in stage 40 tadpoles. In vivo recordings show that OFF visual stimuli produce fast AMPA conductances and sustained GABAA conductances in tectal cells comparable with those evoked by short bursts of electrical stimuli to the RGC afferents (n = 16 cells). Error bars indicate SEM. ∗p < 0.05; ∗∗∗p < 0.001 for this and all subsequent figures.
Quantification of synaptic development.
Parameters of synaptic development were measured with intracellular solution 3. AMPA/NMDA ratios, “silent” synapses, evoked AMPA amplitudes, and paired pulse facilitation (PPF) were calculated from monosynaptic responses to retinotectal stimulation in the presence of SR95531. AMPA/NMDA ratios were calculated from monosynaptic currents recorded at −70 mV (AMPA; 1 ms window at peak; 30–150 trials) and +55 mV (NMDA; 10 ms window 20 ms after peak AMPA; 30–150 trials). PPF was calculated as the peak AMPA amplitude ratio (response2/response1) to pairs of stimuli (25Hz; 25–50 trials). Percentage of silent synapses was calculated as described previously (Wu et al., 1996) by comparing failure rates at −70 and +45 mV under minimal stimulation conditions (30–100 trials at each Vh). Evoked AMPA amplitudes were derived from the nonfailure events at −70 mV. For all miniature postsynaptic current (mPSC) recordings, TTX and APV were added extracellularly. To improve event detection and avoid interference between conductances, AMPA and GABAA mPSCs were pharmacologically isolated and thus recorded from different cells. AMPA mPSCs were recorded as inward currents at −70 mV in SR95531, and GABAA mPSCs were recorded as outward currents at 0 mV in CNQX. Three to 10 min of recordings were analyzed from each cell, and mPSCs (peak amplitude, >3 pA) were detected with a template-matching algorithm. Total AMPA or GABAA input (in picosiemens) was calculated as the area under the average mPSC (in picosiemens per second) multiplied by the mini frequency (in hertz) and is a measure of the mean input to the cell at any one moment. On entering whole-cell mode, we allowed 10 min for dialysis of the intracellular solution before collecting data. Under these whole-cell recording conditions, the reversal potential for glutamatergic and Cl−-mediated currents, and therefore their driving force, were equivalent across the different conditions: the reversal potential for AMPAR-mediated glutamatergic currents was comparable in nontransfected cells (1.2 ± 0.6 mV; 25 cells) and in cells transfected with green fluorescent protein (GFP) (0.8 ± 1.0 mV; 20 cells), Y1087D (0.8 ± 1.2 mV; 8 cells), or KCC2 (0.9 ± 1.0 mV; 22 cells). Equally, the reversal potential for GABAAR-mediated currents under whole-cell recording conditions was comparable in nontransfected cells (−75.8 ± 5.8 mV; 16 cells) and in cells transfected with GFP (−77.4 ± 3.5 mV; 12 cells), Y1087D (−78.6 ± 3.3 mV; 13 cells), or KCC2 (−77.1 ± 2.9 mV; 18 cells). Off-line analyses also confirmed that the frequency and amplitude of synaptic currents was stable over the period of data collection.
DNA constructs and transfections.
The cDNA clone for rat KCC2 was a generous gift from Kai Kaila (University of Helsinki, Helsinki, Finland). The Xenopus expression plasmid was a bidirectional PCS2 vector (containing two cytomegalovirus promoters, one on each strand) and was a generous gift from David Turner (University of Michigan, Ann Arbor, MI). One multiple cloning site contained enhanced GFP (Clontech, Palo Alto, CA) and the other multiple cloning site contained (1) the open reading frame of KCC2 (“KCC2”), (2) the Y1087D mutation of KCC2 (“Y1087D”), or (3) was empty and served as a control (“GFP”). Y1087D was generated by replacing the tyrosine residue at position 1087 of KCC2 with an aspartate residue. This mutation inhibits basal transport activity of KCC2 in Xenopus oocytes by 80% and completely inhibits hypotonic-induced KCC2 activity (Strange et al., 2000). The mutation was made with the QuickChange XL Site-Directed Mutagenesis kit (Stratagene, La Jolla, CA) and confirmed with DNA sequencing. Tadpoles at 3.5–4.5 dpf were anesthetized (0.02% MS-222), and tectal neurons were transfected by microinjecting a DNA solution into the brain ventricle (∼100 nl; 2 μg/μl) and then targeting brief voltage pulses across the tectum (five exponential pulses, 1 s interval, time constant of 70 ms, field strength of 200–400 V/cm). Animals recovered from anesthesia within 10 min, and, 36 h later, GFP was detected and expression of KCC2 and Y1087D was confirmed by immunohistochemistry. Under these conditions, only a small minority of neurons distributed across the ventricular surface of the tectum (0.5–3%) were transfected, and no transfected neurons were observed in the retina. For immunohistochemistry, tadpoles were fixed in 4% paraformaldehyde, and 30 μm horizontal sections were cut. Sections were incubated with a rabbit anti-rat KCC2 polyclonal antibody (1:200), which was a generous gift from John Payne (University of California, Davis, CA; Upstate, Charlottesville, VA) and then a goat anti-rabbit Alexa Fluor-594 secondary antibody (1:1000; Invitrogen, Carlsbad, CA) and were mounted in 4′,6′-diamidino-2-phenylindole Vectashield (Vector Laboratories, Burlingame, CA).
Results
Early Cl− conductances in the retinotectal system are depolarizing
Axons of RGCs in X. laevis first innervate the optic tectum and form synapses with the dendrites of tectal neurons at 3–4 dpf (Holt, 1984; Zhang et al., 1998). This is followed by a period of structural and functional development of the retinotectal circuit during which the strength and characteristics of synaptic transmission mature (see Fig. 6) (Wu et al., 1996, 1999). We tested whether synaptic Cl− conductances, such as those carried by GABAARs or glycine receptors, contribute to this period of retinotectal circuit development. First, to determine [Cl−]i and thus the driving force on Cl− conductances, gramicidin perforated patch recordings were made from whole-brain preparations at different stages of development (Fig. 1). Gramicidin, unlike amphotericin and nyastatin, is a cation-specific ionophore and therefore offers voltage control of the cell while leaving the [Cl−]i intact (Kyrozis and Reichling, 1995). Focal application of exogenous GABA or muscimol induced GABAAR-mediated currents in all neurons tested (n = 87 neurons), including those from 3–4 dpf tadpoles, the earliest age studied. ECl− was ascertained by voltage clamping the tectal neuron at different command potentials (see Materials and Methods). Having recorded the ECl− of the cell, the integrity of the perforated patch was confirmed by breaking into whole-cell mode and monitoring a rapid decrease in the ECl− (to −96 ± 0.6 mV) caused by dialysis of a low Cl− intracellular recording solution (2 mm; see Materials and Methods).
Figure 6.
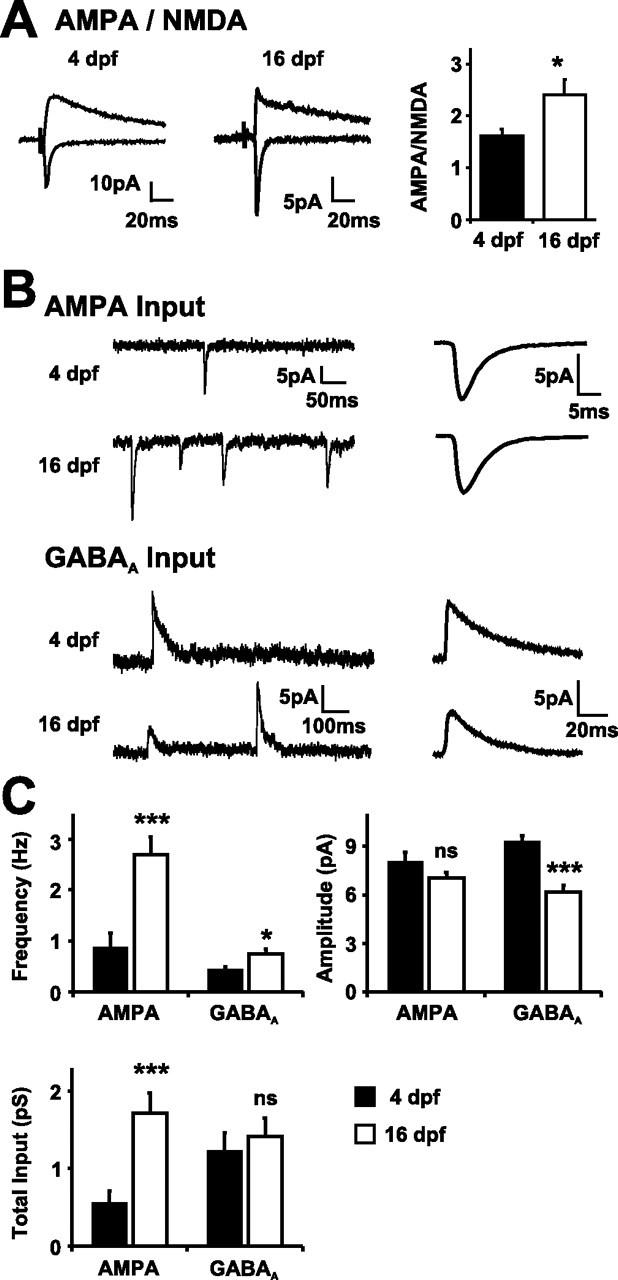
Maturation of synaptic properties in the retinotectal system parallels the developmental shift in [Cl−]i. A, AMPA/NMDA ratios increase between 4 and 16 dpf. Traces (averages of 50) showing glutamatergic currents recorded at +45 and −70 mV from a tectal cell at 4 dpf (left) and 16 dpf (right). The summary graph shows a significant increase in AMPA/NMDA ratio (p < 0.05). B, Total AMPA input to tectal cells increases between 4 and 16 dpf. Total GABAA input to tectal cells is consistent between 4 and 16 dpf. AMPA and GABAA sample recordings (left) and the aligned and averaged mPSC (right) recorded from representative 4 dpf (top) and 16 dpf (bottom) tectal cells are shown. C, Summary graphs of AMPA and GABAA mPSC frequency, amplitude, and total input compared at 4 dpf (filled bars) and 16 dpf (open bars). There was no statistical difference in the AMPA amplitude at the two ages (p = 0.16), but a dramatic increase in frequency generated a threefold increase in total AMPA input (∗∗∗p < 0.001; n = 31 and 42 cells at 4 and 16 dpf, respectively). There was a significant increase in GABAA mPSC frequency with age (∗p < 0.05) but a concomitant decrease in the amplitude (∗∗∗p < 0.001) such that the total GABAA input did not change over this window of development (p = 0.67; n = 29 and 47 cells at 4 and 16 dpf, respectively). Error bars indicate SEM. ns, Not significant.
Figure 1.

Xenopus tectal neurons show a developmental shift in [Cl−]i. Gramicidin perforated patch voltage-clamp recordings were performed on tectal neurons at different developmental stages. Currents were evoked by focal application of the GABAA agonist muscimol (arrowheads) and the membrane was clamped at different command potentials (−100 to 0 mV). Having recorded the ECl− of the cell in perforated mode (open symbols), the integrity of the perforated patch was confirmed by breaking into whole-cell mode and monitoring a decrease in the ECl− caused by dialysis of a low Cl− intracellular recording solution (filled symbols). ECl− was defined as the x-intercept value of the muscimol-induced peak current. Representative recordings are shown from a tadpole at 4 dpf corresponding to stage 40 (A) and a tadpole at 32 dpf corresponding to stage 50 (B). Population data show the developmental shift in ECl− (C) and the [Cl−]i (D) across four different ages: 4 dpf (stage 40; n = 29 cells), 8 dpf (stage 47; n = 22 cells), 16 dpf (stage 48/49; n = 30 cells), and 32 dpf (stage 50/51; n = 6 cells). Bars indicate SEM. ECl− decreased between 4 and 32 dpf with the major shift occurring between 4 and 16 dpf (p < 0.001).
Gramicidin recordings revealed a robust and statistically significant shift in the mean ECl− over the period between 4 and 32 dpf (p < 0.001). The major developmental shift occurred between 4 and 16 dpf when the mean ECl− became ∼20 mV more hyperpolarized, from −40.5 ± 1.0 mV (n = 29 cells) to −59 ± 0.9 mV (n = 30 cells). After an additional 2 weeks, the mean ECl− at 32 dpf was −62.7 ± 2.1 mV (n = 6 cells) and had not shown an additional significant decrease from 16 dpf (p = 0.12). The 20 mV negative shift in ECl− corresponds to a shift from ∼26 to ∼11 mm [Cl−]i. Over the period that [Cl−]i changed, the mean RMP remained stable (RMP at 4 dpf, −61.7 ± 2.7 mV; RMP at 16 dpf, −62.5 ± 2.3 mV). The RMP was substantially more hyperpolarized than the ECl− at 4 dpf but not at 16 dpf. These data establish that [Cl−]i is high in immature tectal neurons and that ECl− is depolarized relative to RMP at 4 dpf but not 16 dpf.
GABAergic inputs are recruited by visual stimuli and underlie synaptic Cl− conductances in the developing retinotectal system
For Cl− conductances to impact the activity-dependent development of these young tectal neurons, the appropriate circuits would have to be present at these early stages, be activated by physiologically relevant stimuli, and the resulting Cl− conductances would be expected to contribute significantly to the activity patterns of a cell. We characterized the synaptic pharmacology, circuitry, and temporal properties of immature Cl− conductances in neurons from 4 dpf tadpoles to determine whether these criteria are met. Recordings were done in the whole-brain preparation, which preserves the neural circuitry while allowing direct access for both stimulation and pharmacological manipulation of the retinotectal system. We tested whether GABAergic synaptic connections are recruited by retinal axon stimulation. Synaptic currents were evoked in 4 dpf tectal cells by delivering single or short bursts of stimuli to the optic nerve. By making whole-cell voltage-clamp recordings with a relatively low intracellular Cl− solution, we were able to separate glutamatergic currents from currents carried by Cl− (see Materials and Methods). Recordings at the reversal potential for AMPA currents allowed us to monitor Cl− currents, whereas recordings at ECl− allowed us to monitor AMPA currents. Under these conditions, almost all tectal cells at 4 dpf (n = 27 of 28) that exhibited monosynaptic AMPA currents resulting from activation of RGC afferents also exhibited synaptically evoked outward currents at the AMPA reversal that were consistent with being carried by Cl−. Pharmacological experiments (Fig. 2A) in which glycine receptor and GABAAR blockers were added to the bath demonstrated that, whereas the addition of 30 μm strychnine had little effect on these currents (8.1 ± 2.1% reduction), they were entirely blocked by the addition of the GABAAR blocker SR95531 (97.1 ± 1.8% reduction; n = 6 cells). Consistent with this data, the Cl− currents were selectively blocked by intracellular dialysis with a recording solution containing DIDS (94 ± 1.1% reduction compared with control solution; n = 12 and 9 cells, respectively) (Fig. 2A), a method that has been used previously to selectively block GABAA conductances only in the recorded cell (Nelson et al., 1994). These experiments demonstrated that GABAergic synaptic connections are already present at 4 dpf and that they provide input onto the vast majority of tectal cells.
To further characterize the nature of these immature GABAergic synapses, we applied single stimuli to the optic chiasm and again isolated AMPA and GABAA synaptic currents by recording at their respective reversal potentials. A single stimulus to the optic chiasm evoked AMPA and GABAA currents in the same tectal neuron, and the onset of the GABAA response showed a consistent delay relative to the AMPA current (3.94 ± 0.27 ms; n = 15 cells) (Fig. 2B). Both currents were blocked by the addition of the AMPAR blocker CNQX (data not shown). We also performed minimal stimulation experiments (n = 8 cells) in which the amplitude of the electrical stimulus was reduced to the point at which complete failures of transmission were observed and in which one or a very small number of RGC axons are likely to be activated (Fig. 2C). Under these stimulation conditions and in the presence of the NMDAR blocker APV, voltage-clamp recordings at a Vh intermediate to the GABAA and AMPA reversal potentials led to trials in which an AMPA–GABAA sequence was evoked, plus trials in which one or both components of the response failed. Together, these experiments indicate that, at this early stage of retinotectal development, RGC activity recruits GABAergic input onto tectal cells in a manner that is consistent with a canonical feedforward circuit (Fig. 2D) (Pouille and Scanziani, 2001; Gabernet et al., 2005).
GABAergic synaptic responses are efficiently recruited with multiple “burst-like” stimuli delivered to the optic nerve, and the resulting GABAAR-mediated conductances are both large and sustained. Pairs of stimuli delivered with varying interstimulus intervals (ISIs) showed that GABAergic input was enhanced if the optic nerve was activated sequentially within several hundred milliseconds and that this response was maximal for closely spaced stimuli such as might occur during a burst of retinal activity (Fig. 3A) (Tao et al., 2001). At an ISI of 20 ms, the response to a second stimulus was almost three times larger (2.9 ± 0.9-fold) than the response to one stimulus, but, at an ISI of 500 ms, there was no difference. Responses to trains of stimuli (one to three stimuli, 50 Hz) were used to directly compare the magnitude of GABAA and AMPA conductances onto the same 4 dpf tectal neurons (Fig. 3B). Peak GABAA conductance (mean of 1.1, 1.8, and 2.3 nS for one, two, and three stimuli, respectively) was slightly larger than the peak AMPA conductance (mean of 0.9, 1.3, and 1.6 nS, respectively), although not statistically significant (p = 0.68, 0.51, and 0.39 for one, two, and three stimuli, respectively; n = 9 cells). However, because of the sustained nature of the evoked GABAA conductance, a dramatic difference was apparent in the integral of the two conductances. The GABAA integrated conductance (mean of 177.8, 524.4, and 1277.5 pS.s for one, two, and three stimuli, respectively) was substantially larger than the AMPA (mean of 4.6, 8.6, and 15.8 pS.s, p < 0.001, 0.001, and 0.001 for one, two, and three stimuli, respectively; n = 9 cells). Interestingly, the ratio of GABAA/AMPA integrated conductance was larger for burst stimuli than for single stimuli (GABAA/AMPA of 38.7, 60.9, and 80.9 for one, two, and three stimuli, respectively), indicating that, under strong retinal activity, tectal cells become increasingly dominated by the GABAA conductance.
To test whether GABAergic inputs are activated by physiologically relevant stimuli and to compare responses between different stimuli, we performed in vivo recordings in which we presented visual stimuli to the intact retina of 4 dpf tadpoles (Fig. 3C). Whole-field dimming stimuli (OFF stimuli) were presented to the contralateral retina, and AMPA and GABAA currents were isolated in tectal cells, as described above. Visual stimulation evoked robust AMPA and GABAA responses that were comparable with those evoked by bursts of stimuli delivered to the optic nerve. The peak of the visually evoked GABAA conductance (3.1 ± 0.5 nS) was larger than the peak AMPA conductance (1.3 ± 0.3 nS; p < 0.05; n = 16 cells), and the mean integral of the visually evoked GABAA conductance (569.0 ± 101.1 pS.s) was substantially larger than the integrated AMPA conductance (28.6 ± 7.5 pS.s), a difference that was highly statistically significant (p < 0.001; n = 16 cells). Note that the size of the visually evoked conductances were comparable with those evoked by brief bursts of two to three stimuli delivered to the optic nerve (Fig. 3B).
In summary, these experiments demonstrate that, at these early stages of retinotectal development, feedforward GABAergic circuitry is recruited by physiologically relevant stimuli and, when activated, induces large Cl− conductances in tectal cells. These sustained GABAA currents and the depolarized ECl− suggest that early Cl− conductances are well placed to modulate the Vm during periods of synaptic activity. Of particular interest to developmental plasticity in the retinotectal system is the impact these depolarizing Cl− conductances could have on the voltage-dependent Mg2+ block of the NMDAR. The NMDAR has been implicated in structural and functional plasticity in the retinotectal system, and, once glutamate is bound to NMDARs, transmission through these receptors is regulated by Vm (Mayer et al., 1984; Schiller et al., 2000).
GABAergic conductances in developing tectal neurons modulate voltage-dependent NMDAR block
Addition of SR95531 during the experiments described above (Fig. 3B) enabled us to record a combined AMPA and NMDA conductance as an outward current at a positive Vh (+45 mV). Subtracting the AMPA conductance (recorded at −70 mV) from the combined AMPA and NMDA conductance allowed us to isolate the three major synaptic conductances in the retinotectal circuit (AMPA, NMDA, and GABAA) within an individual neuron. A comparison of the three conductances revealed that the unblocked NMDA conductance at this age exhibits a much longer duration than the AMPA conductance and more closely parallels the temporal profile of the GABAA conductance (Fig. 4A). Consequently, the GABAA conductance at this stage of development has the appropriate temporal properties to modulate the Vm during the period that glutamate is bound to the NMDAR. NMDA responses in retinotectal synapses at 4 dpf exhibit the same voltage-dependent open channel block by external Mg2+ as has been observed in a variety of other systems (Fig. 4B). Peak inward current through the NMDAR was observed between −40 and −20 mV, which reflects the membrane potentials at which maximal net influx of permeable cations (Na+, K+, and Ca2+) occurs and is close to the membrane potential at which peak Ca2+ influx occurs (Kovalchuk et al., 2000). The current–voltage relationship of the NMDAR in tectal cells was fit with an exponential (Fig. 4B) (see Materials and Methods), and this function was used to estimate the net inward current through the NMDAR from voltage waveforms recorded during periods of retinotectal circuit activity.
To test how developmental changes in [Cl−]i impact NMDAR transmission, we adopted two different approaches that were designed to preserve all other conductances in the network while selectively manipulating Cl− conductances only in the recorded cell. First, we dialyzed different intracellular Cl− solutions into tectal cells and recorded their voltage responses during retinotectal circuit activity (Fig. 4C,D). Second, we used the dynamic-clamp recording technique (Robinson and Kawai, 1993; Sharp et al., 1993) to simulate realistic GABAA conductances with different ECl−, thereby simulating the developmental shift in [Cl−]i within the same tectal cell (Fig. 5). The findings from both sets of experiments indicate that early Cl− conductances are a key regulator of NMDAR transmission in the retinotectal system.
Whole-cell current-clamp recordings were made from 4 dpf tectal neurons with different internal solutions, either with an immature [Cl−]i of 26 mm or with a mature [Cl−]i of 11 mm (Fig. 1). No receptor blockers were present in these experiments. Stimulation of RGC afferents was used to activate the retinotectal circuit, and the resulting voltage responses (Fig. 4C) were used to estimate the NMDA currents under the two different [Cl−]i conditions. In cells dialyzed with their normal immature [Cl−]i (Fig. 4C, top), retinal afferent stimulation evoked action potentials followed by long “plateau” depolarizations that were ideally timed to remove the Mg2+ block. In contrast, for cells dialyzed with a mature [Cl−]i (Fig. 4C, bottom), afferent stimulation evoked transient depolarizations that included action potentials, but that were then rapidly “clamped” close to the resting potential, presumably as a consequence of the now hyperpolarizing GABAA conductances. An immature [Cl−]i strongly facilitated the NMDA current (42.9, 52.7, and 63.7% of maximal inward NMDA current for one, two, and three stimuli, respectively; n = 13 cells) when compared with that calculated at the RMP (14.6%). In contrast, cells that had a mature [Cl−]i imposed (n = 14 cells) were predicted to have much lower NMDA inward current (20.0, 23.5, and 25.6%; n = 14 cells), which was close to that measured at the RMP (14.6%). For one, two, or three stimuli trains, NMDA current was significantly greater in cells with immature [Cl−]i than with mature [Cl−]i (p < 0.001 in each case). Furthermore, the difference in NMDA transmission between immature and mature [Cl−]i increased under stronger afferent activation (p < 0.001), consistent with the observation that GABAA conductances become increasingly dominant with stronger network activity.
To further explore the contribution of [Cl−]i to the Vm and NMDAR transmission during periods or retinotectal circuit activity, we selectively blocked GABAergic conductances in the recorded cell and used dynamic clamp to impose synaptic Cl− currents (IsynCl−) (Fig. 5A) (see Materials and Methods). This recording configuration allowed systematic control of the Cl− reversal potential (ECl−) and the amplitude of synaptic Cl− conductances (gCl−) within the same neuron. Realistic GABAA conductance waveforms recorded at the same age, and under the same stimulation conditions (Fig. 3B), were paired with RGC afferent stimulation. Stimulus intensity was set in voltage clamp, and recordings were then switched to dynamic clamp to investigate how ECl− impacts the voltage response of cells during activation of the retinotectal circuit (Fig. 5B). ECl− had a clear impact on Vm during bouts of retinotectal circuit activity, inducing a sustained depolarization when the ECl− was immature (ECl− of −40 mV) but rapidly hyperpolarizing and clamping Vm close to RMP when the ECl− was mature (ECl− of −60 mV). Inward NMDA currents recorded with an immature ECl− were predicted to be 58.3 ± 1.3% of the maximal current, whereas with the mature ECl−, this value fell to 18.8 ± 0.6%, which was close to the NMDA current predicted at RMPs (14.6 ± 1%). This represented a highly significant difference between immature and mature ECl− values (p < 0.001; n = 18 cells). Furthermore, the fact that the estimated NMDA current was significantly larger (p < 0.001) with an immature ECl− than with no IsynCl− (29.5 ± 3.3%) indicates that the immature Cl− conductance actively facilitates NMDAR transmission.
Experiments with a series of different real gCl− waveforms (Fig. 5C) demonstrated that the impact of ECl− on NMDA transmission was evident for the amplitudes of gCl− associated with a single RGC stimulus (peak, <1 nS) but was most pronounced for the larger gCl− (peak, >1 nS) recorded during brief bursts of retinal activity and visually evoked activity. To support estimates of the NMDA current, we conducted voltage-clamp experiments to measure the NMDA current during voltage responses shaped by different IsynCl− (Fig. 5D). NMDA currents were pharmacologically isolated (as in Fig. 4B) except that, rather than pairing RGC stimulation with a nonvarying command potential, we paired RGC afferent stimulation with command potential waveforms derived from the dynamic-clamp experiments (Fig. 5B,C). These experiments confirmed that NMDA currents are strongly modulated by developmental changes in [Cl−]i and increase in amplitude and duration as gCl− increases. The summary graphs (Fig. 5D) show that NMDA currents recorded with the immature ECl− waveforms were typically threefold larger than those recorded with a mature ECl−, a difference that was highly significant (p < 0.001).
Synaptic development in the retinotectal circuit correlates with the shift in [Cl−]i
The experiments described above support the conclusion that the time course and reversal potential of the early Cl− conductances places them in a key position to modulate the Mg2+ block of synaptic NMDARs. Given that NMDAR act-ivity and the associated influx of Ca2+ are widely believed to play a central role in the formation of synaptic circuits (Constantine-Paton et al., 1990), we tested whether the developmental change in [Cl−]i affects synaptic development in the retinotectal system. Before doing this, we characterized normal synaptic development during the period that [Cl−]i shifts from high to low levels (4–16 dpf). Whole-cell recordings demonstrated that, during this period, the ratio of AMPAR- to NMDAR-mediated currents at glutamatergic synapses increases (Fig. 6A). Monosynaptic retinotectal glutamatergic responses were evoked by stimulating the optic chiasm and recording the amplitude of AMPA and NMDA synaptic components at −70 and +45 mV, respectively. The AMPA/NMDA ratio increased significantly (p < 0.05) from 1.62 ± 0.12 at 4 dpf (n = 34 cells) to 2.41 ± 0.29 at 16 dpf (n = 21 cells). This is consistent with previous data from the retinotectal system (Wu et al., 1996) and other developing systems (Isaac et al., 1997), which indicate that immature glutamatergic synapses often contain principally NMDARs and that AMPARs are added as circuits mature. To test this further, we used recordings of AMPA-mediated spontaneous mPSCs to estimate the total AMPA input at 4 and 16 dpf (Fig. 6B,C) (see Materials and Methods) (Liu, 2004). Total AMPA synaptic input increased significantly (p < 0.001) from 0.55 ± 0.16 pS at 4 dpf (n = 31 cells) to 1.71 ± 0.26 pS at 16 dpf (n = 42 cells). Mean peak amplitude of the AMPA mPSCs was stable over this period of development, and the increase in total AMPA input was the result of a threefold increase in the frequency of AMPA mPSCs, from 0.88 ± 0.28 Hz at 4 dpf to 2.70 ± 0.35 Hz at 16 dpf.
A similar analysis of GABAAR-mediated mPSCs revealed a different profile of GABAergic synaptic development in the retinotectal circuit (Fig. 6B,C). Between 4 and 16 dpf, there was no net increase in the total GABAA input to tectal cells, measuring 1.23 ± 0.23 pS at 4 dpf (n = 29 cells) and 1.41 ± 0.23 pS at 16 dpf (p = 0.67; n = 47 cells). Underlying this was a decrease in the amplitude of GABAergic inputs (p < 0.001) but a concomitant increase in their frequency (p < 0.05). GABAA mPSCs peak amplitude fell from 9.28 ± 0.39 pA at 4 dpf to 6.17 ± 0.4 pA at 16 dpf, whereas GABAA mPSCs frequency increased from 0.43 ± 0.07 Hz at 4 dpf to 0.74 ± 0.09 Hz at 16 dpf. Together, the data indicate that, during the developmental period that [Cl−]i is shifting, synaptic circuits in the retinotectal system are forming, maturing, and reorganizing: not only do glutamatergic synapses undergo the well described phenomenon of “AMPAfication” during this period, but the relative balance of GABAergic and glutamatergic inputs shifts significantly during this period from a mean AMPA/GABAA ratio of ∼0.45 at 4 dpf to ∼1.2 at 16 dpf (see Fig. 9). However, it is not known whether early depolarizing postsynaptic Cl− conductances contribute to these synaptic changes in the retinotectal circuit.
Figure 9.

Low [Cl−]i impairs the developmental balance of glutamatergic and GABAergic synaptic inputs in the retinotectal circuit in vivo. A, Total AMPA input was significantly reduced in KCC2 cells (n = 42 cells) compared with nontransfected, GFP, and Y1087D cells (n = 49, 25, and 47 cells, respectively). Traces (left) show sample recordings and averaged AMPA mPSCs recorded from representative cells. Three graphs (right) show the decrease in frequency (∗p < 0.05), amplitude (∗p < 0.05), and total AMPA input (∗∗p < 0.005) in cells expressing KCC2. B, Total GABAA input to tectal cells was significantly increased in KCC2 cells (n = 31 cells) compared with nontransfected, GFP, and Y1087D cells (n = 39, 25, and 24 cells, respectively). Traces (left) show sample recordings and averaged GABAA mPSCs recorded from representative cells. Three graphs (right) show the increase in frequency (∗∗p < 0.005), amplitude (∗∗∗p < 0.001), and total GABAA input (∗∗∗p < 0.001) in cells expressing KCC2. Error bars indicate SEM. The overall input (total AMPA plus total GABAA; C) and the ratio of AMPA to GABAA inputs (total AMPA/total GABAA; D) were calculated from the population averages and compared with the values at 4 dpf. KCC2 cells exhibited the highest overall input but the lowest ratio of AMPA to GABAA inputs.
Shifting [Cl−]i prematurely in developing tectal neurons in vivo
To test whether depolarizing Cl− conductances are important in the synaptic development of the retinotectal circuit, we used targeted electroporation in vivo to express the Cl− transporter KCC2 in small numbers of tectal neurons. This enabled us to manipulate [Cl−]i in the postsynaptic cell without directly affecting presynaptic input or other cells throughout the retinotectal circuit (Fig. 7A). Immunohistochemistry for KCC2 performed 36 h after electroporation at 3–4 dpf demonstrated that KCC2 protein levels were elevated selectively in cells that expressed KCC2 and GFP from the same expression plasmid (Fig. 7B). To test the effect of KCC2 expression on ECl−, 36–48 h after electroporation, gramicidin recordings were made from transfected neurons that were identified by their GFP expression. Having recorded the ECl− of the cell, the integrity of the perforated patch was confirmed by breaking into whole-cell mode and monitoring an increase in the ECl− (to −0.5 ± 2.1 mV) caused by dialysis of a high Cl− intracellular recording solution (116 mm; see Materials and Methods). Gramicidin recordings from KCC2-transfected cells showed a robust negative shift in ECl− when compared with cells expressing only GFP or nontransfected control cells from animals of the same age (p < 0.001) (Fig. 7C,D). The average ECl− in KCC2 cells was −63.6 ± 2.2 mV (n = 20 cells) compared with −41.7 ± 1.3 mV in GFP cells (n = 18 cells) and −43.0 ± 0.9 mV in nontransfected cells (n = 15 cells). To confirm the transport activity of KCC2 and to serve as an additional control, we used site-directed mutagenesis to introduce a mutation into KCC2 that dramatically reduces the activity of the transporter (Strange et al., 2000). Immunohistochemistry indicated that the mutant KCC2 protein Y1087D had a similar distribution pattern to wild-type KCC2 (data not shown). However, the mean ECl− in Y1087D neurons was −42.2 ± 1.0 mV (n = 16 cells), which was significantly more positive than KCC2 cells (p < 0.001) and not different from GFP or nontransfected control cells (p > 0.05).
Figure 7.

Premature KCC2 overexpression shifts [Cl−]i in developing tectal neurons. A, Experimental design showing that [Cl−]i was manipulated in a small number of tectal cells (TC, white cell) that were part of an otherwise normal retinotectal circuit. IN, Interneuron. B, At 36–48 h after electroporation, KCC2 expression increased KCC2 protein levels in transfected tectal cells. DAPI, 4′,6′-Diamidino-2-phenylindole. Scale bar, 10 μm. C, Gramicidin recordings of the ECl− in a representative KCC2 cell (left), GFP cell (center), and Y1087D cell (right). Having recorded the ECl− of the cell in perforated mode (open symbols), the integrity of the perforated patch was confirmed by breaking into whole-cell mode and monitoring an increase in the ECl− caused by dialysis of a high Cl− intracellular recording solution (filled symbols). D, Premature expression of KCC2 in vivo caused a robust shift in ECl− compared with GFP, Y1087D, and nontransfected (Non) control cells, consistent with a significant decrease in the [Cl−]i (p < 0.001). The average ECl− in KCC2 cells was −63.6 ± 2.2 mV (n = 20 cells) compared with −41.7 ± 1.3 mV in GFP (n = 18 cells), −42.2 ± 1.0 mV in Y1087D cells (n = 16 cells), and −43.0 ± 0.9 mV in nontransfected neurons (n = 15 cells).
A premature shift in [Cl−]i disrupts aspects of glutamatergic synaptic development
Expression of KCC2 provided a tool with which to test the effect of a premature shift in [Cl−]i on the synaptic development of the retinotectal circuit in vivo. Tectal cells were transfected by electroporation with KCC2 at 3–4 dpf, and the tadpoles were allowed to develop to 16 dpf. This time window corresponds to the period that [Cl−]i levels shift in the normal tadpole tectum (Fig. 1) and when there are developmental changes in synaptic circuits (Fig. 6). We first examined the effects of expressing KCC2 prematurely on glutamatergic transmission. Although we found that the AMPA/NMDA ratio in KCC2 cells (2.34 ± 0.24; n = 32 cells) was comparable with that seen in nontransfected cells (2.22 ± 0.24; n = 34 cells) or GFP cells (2.20 ± 0.32; n = 21 cells) (Fig. 8A), minimal stimulation experiments indicated that AMPA-mediated transmission was reduced in KCC2 cells. For these minimal stimulation recordings, stimulus intensity was gradually increased from zero to the point at which stable nonfailures of transmission were observed. These synaptic responses are believed to represent the transmission from a single RGC axon, although each axon can make multiple synaptic contacts with a single tectal cell (Wu et al., 1996). Under these conditions, the mean amplitude of monosynaptic glutamatergic responses was found to be significantly reduced in KCC2 cells (p < 0.001) (Fig. 8B). The peak AMPA current measured at −70 mV in KCC2 cells was 6.4 ± 0.6 pA (n = 20 cells) compared with 9.9 ± 0.6 pA in nontransfected cells (n = 25 cells) and 11.3 ± 1.0 pA in GFP cells (n = 17 cells). In a subset of these cells, we also recorded responses at +45 mV under minimal stimulation conditions and used the rates of transmission failure at hyperpolarized and depolarized potentials to calculate the percentage of NMDA-only (silent) synapses (see Materials and Methods). Consistent with the observation that AMPA/NMDA ratios are unchanged in KCC2 cells, the percentage of NMDA-only (silent) synapses was found to be comparable in KCC2 and control cells (p = 0.75) (Fig. 8C). The percentage of silent synapses was 43.2 ± 6.9% in KCC2 cells (n = 12 cells), 47.9 ± 8.1% in nontransfected cells (n = 9 cells), and 47.9 ± 8.2% in GFP cells (n = 8 cells). Also, consistent with the observations that AMPA/NMDA ratios are unchanged in KCC2 cells (Fig. 8A) but that AMPA responses are reduced (Fig. 8B), the amplitude of NMDA currents measured under minimal stimulation conditions were smaller in KCC2 cells (p < 0.05; KCC2, 3.1 ± 0.7pA; nontransfected, 6.9 ± 2.2 pA; GFP, 6.9 ± 1.1 pA). Together, these data indicate that, although the ratio of AMPA and NMDA components appear unchanged in KCC2 cells, these cells receive reduced glutamatergic input. This effect could reflect a postsynaptic reduction in glutamatergic input onto the tectal cell and/or a generalized decrease in presynaptic function. The fact that the failure rates measured under minimal stimulation conditions were not significantly higher (p = 0.9) in KCC2 cells (KCC2, 54.3 ± 7.6%; nontransfected, 50.5 ± 7.3%; GFP, 50.5 ± 8.2%) indicates that there was not a dramatic reduction in presynaptic function. Also, measurements of PPF, which is thought to reflect presynaptic function, did not reveal any differences at glutamatergic synapses onto KCC2 and control cells (p = 0.85) (Fig. 8D). PPF was 1.82 ± 0.10 in KCC2 cells (n = 19), 1.93 ± 0.23 in nontransfected cells (n = 17), and 1.83 ± 0.10 in GFP cells (n = 11), suggesting that KCC2 cells do not exhibit a generalized decrease in presynaptic function but rather a postsynaptic reduction in glutamatergic synaptic inputs.
Figure 8.
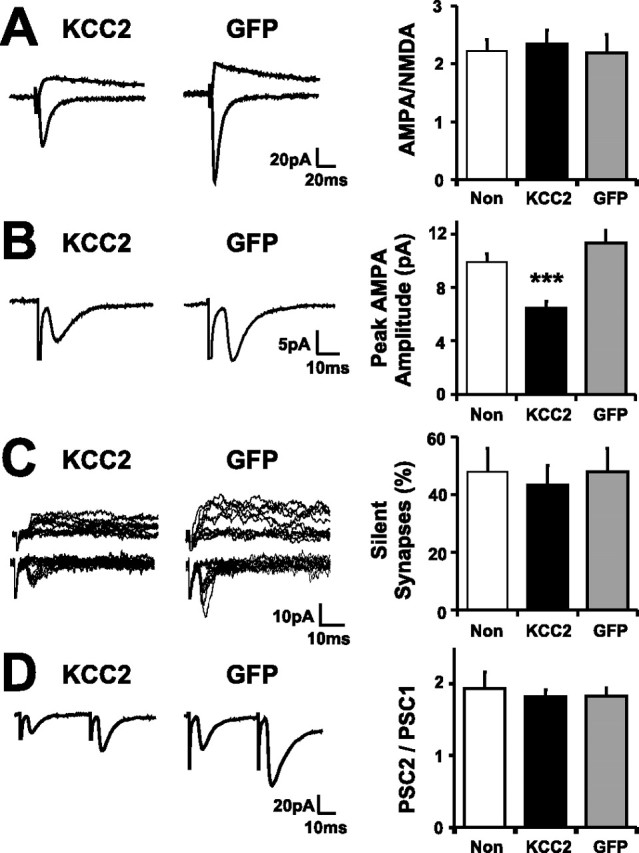
Low [Cl−]i impairs the development of aspects of glutamatergic transmission in the retinotectal circuit in vivo. A, AMPA/NMDA ratios are comparable in KCC2 cells, GFP cells, and nontransfected cells (Non) (p = 0.9). Example traces are averages of 20–30 responses. B, The amplitude of AMPA-mediated retinotectal transmission under minimal stimulation conditions was highly significantly reduced in KCC2 cells compared with nontransfected or GFP cells (∗∗∗p < 0.001; n = 20, 25, and 17 cells, respectively). C, The fraction of synapses mediated solely by NMDARs (Silent Synapses) was comparable in KCC2 cells, nontransfected cells, and GFP cells (p = 0.87). D, Paired pulse facilitation, defined as the ratio of the peak evoked currents (PSC2/PSC1; 25 Hz), was comparable in KCC2, nontransfected, and GFP cells (p = 0.85; n = 19, 17, and 11 cells, respectively). Error bars indicate SEM.
A premature shift in [Cl−]i disrupts the balance of glutamatergic and GABAergic synaptic development
Given that the balance of total glutamatergic and GABAergic synaptic inputs changes over the same period that [Cl−]i decreases (Fig. 6), we next tested whether a premature shift in [Cl]i by expression of KCC2 affected the balance of AMPA and GABAA inputs (Fig. 9). As before, tectal cells were transfected by electroporation at 3–4 dpf, and the tadpoles were allowed to develop to 16 dpf. Consistent with measurements of evoked glutamatergic responses (Fig. 8), the total AMPA input onto KCC2 cells (0.86 ± 0.18 pS; n = 42 cells) was significantly less than that onto nontransfected cells recorded in the same tectum (1.49 ± 0.20 pS; n = 49 cells; p < 0.005). This difference was also apparent when KCC2 cells were compared with cells from separate tadpoles that had expressed either GFP only (1.67 ± 0.36 pS; n = 25 cells) or the Y1087D mutant KCC2 from 4 to 16 dpf (1.85 ± 0.33 pS; n = 47 cells) (Fig. 9A). A very different observation was made when the total GABAA input was measured; KCC2 cells had significantly increased GABAergic input when compared with control groups (p < 0.005) (Fig. 9B). The total GABAA input recorded in KCC2 cells was 3.63 ± 0.59 pS (n = 31 cells), which was more than double the 1.50 ± 0.28 pS recorded in nontransfected cells (n = 39 cells) and also more than double the 1.32 ± 0.20 pS recorded in GFP cells (n = 25 cells) and the 1.41 ± 0.18 pS recorded in cells that expressed Y1087D from 4 to 16 dpf (n = 24 cells). Combining average values across experiments supported the conclusion that KCC2 expression did not prevent a developmental increase in overall synaptic input (total AMPA plus total GABAA) but shifted the balance of AMPA to GABAA inputs (Fig. 9C,D). The AMPA/GABAA input ratio was more than fourfold lower in KCC2 cells than in control cells (mean of 0.24, 1.06, 1.26, and 1.31 in KCC2, nontransfected, GFP, and Y1087D cells, respectively) and was closer to the ratio observed in normal 4 dpf tectal cells (mean of 0.44).
Discussion
Our results show that, soon after retinal afferents innervate the optic tectum of Xenopus tadpoles, the Vm of tectal cells is modulated by depolarizing Cl− conductances that are mediated by GABAergic circuits and recruited by patterned retinal afferent activity. The reversal potential and temporal properties of these early Cl− conductances makes them ideally suited to cause sustained depolarizations that facilitate NMDAR signaling in the postsynaptic cell, a process strongly implicated in retinotectal circuit formation, synapse maturation, and synaptic plasticity (Zhang et al., 1998; Rajan et al., 1999; Ruthazer et al., 2003). Acutely imposing a mature ECl− on an immature tectal neuron decreased NMDAR transmission by hyperpolarizing the Vm and increasing the voltage-dependent Mg2+ block. Chronically imposing a mature ECl− by expression of the Cl− transporter KCC2 disrupted synaptic circuit development, resulting in tectal neurons with reduced glutamatergic synaptic input but elevated GABAergic input. Together, these data demonstrate that early postsynaptic depolarizing GABAergic inputs regulate the balanced development of excitatory and inhibitory synaptic inputs in the retinotectal circuit.
Depolarizing Cl− conductances regulate retinotectal synaptic circuit formation
Gramicidin perforated patch recordings, which preserve [Cl−]i, revealed a robust shift in ECl− during tectal development. These findings parallel data from the hippocampus (Ben-Ari et al., 1989), cortex (Owens et al., 1996), spinal cord (Rohrbough and Spitzer, 1996), and brainstem (Ehrlich et al., 1999) and support the idea that elevated [Cl−]i is a fundamental property of immature neurons (Ben-Ari, 2002). The period during which [Cl−]i changes represents a time of formation, reorganization, and maturation of synaptic circuits (Wu et al., 1999; Wu and Cline, 2003; Tao and Poo, 2005). According to our measurements of spontaneous synaptic currents during this period, tectal cells are initially dominated by GABAergic input, and, as they develop, they experience a relative increase in their glutamatergic synaptic input. The addition of AMPARs to NMDAR-only synapses is likely to contribute to the developmental increase in the frequency of glutamatergic mPSCs (Wu et al., 1996). Also, the fact that the AMPA/NMDA ratio increases by 1.5-fold but the mPSC frequency increases by threefold suggests other changes may contribute. Newly added glutamatergic synapses could contribute to the increase in mPSC frequency, particularly because the dendritic complexity of tectal cells increases during this period and it seems likely that new synapses are added with this growth (Wu et al., 1999; Niell et al., 2004). Presynaptic changes in glutamate release could also contribute to the developmental increase in mPSCs, although failure rates measured at NMDAR synapses under minimal stimulation conditions appear to be stable during tectal cell development (Wu et al., 1996).
We found that using KCC2 expression to prematurely shift ECl− so that it was no longer depolarizing prevented the normal maturation of synaptic circuits in the tectum; spontaneous synaptic currents revealed an increase in GABAergic inputs, at the same time as a decrease in glutamatergic inputs. Recordings of evoked currents supported the observation that glutamatergic synaptic input was attenuated, revealing that, whereas AMPA/NMDA ratios and the percentage of silent synapses were unchanged in KCC2 cells, the glutamatergic response associated with an individual RGC was reduced. Because individual RGCs are thought to form multiple synapses per tectal neuron (Wu et al., 1996; Tao and Poo, 2005), the most likely postsynaptic explanation for the spontaneous and evoked data are that there was a reduction in the number of glutamatergic synapses. However, a reduction in presynaptic glutamate release could also account for these effects, and there are several examples in the literature that support activity-dependent changes in presynaptic function (Murthy et al., 2001; Thiagarajan et al., 2002). As a test of presynaptic function, we measured PPF in KCC2 and control cells and found it to be comparable, as were the rates of transmission failure in KCC2 cells. Together, these data support the conclusion that there is a change in the number of glutamatergic synapses, although we cannot exclude the contribution of presynaptic changes in transmission in concert with postsynaptic changes. Finally, the fact that prematurely shifting ECl− did not affect the ratio of AMPARs to NMDARs at glutamatergic retinotectal synapses indicates that either early depolarizing GABAergic inputs are not essential for this aspect of glutamatergic synaptic development or compensatory mechanisms can adjust the AMPA/NMDA ratio (Zhu and Malinow, 2002; Watt et al., 2004).
We were able to use the early expression of the Cl− transporter KCC2 in vivo to prematurely shift ECl− without affecting [Cl−]i in neighboring cells. These data are consistent with knockdown approaches that have demonstrated that KCC2 underlies the shift in ECl− (Rivera et al., 1999; Hubner et al., 2001) and with evidence that KCC2 expression is sufficient to accelerate the shift (Chudotvorova et al., 2005; Lee et al., 2005). Expression of KCC2 in dissociated embryonic hippocampal neurons has been reported to increase GABAergic synaptic input without affecting glutamatergic inputs (Chudotvorova et al., 2005). This difference with the present study may reflect the types of cell investigated or may reflect differences in the patterns of network activity and the balance of synaptic inputs when comparing in vitro and in vivo systems. Our experiments demonstrate that glutamatergic input is reduced and GABAergic input is increased in the retinotectal circuit only when the active KCC2 Cl− transporter is expressed. Tectal neurons that expressed an inactive mutant form of KCC2 (Y1087D) did not exhibit a premature shift in ECl− and, when allowed to develop to 16 dpf, showed a normal balance of AMPA and GABAergic inputs. These data support the conclusion that it is the premature shift toward hyperpolarizing ECl− that underlies the abnormal development of synaptic inputs in KCC2-expressing cells, and it is consistent with studies that have identified the developmental coregulation of glutamatergic and GABAergic inputs as an activity-dependent process (Liu, 2004; Tao and Poo, 2005). The effect of altering ECl− once it has reached mature levels was not tested here, but future work could examine the consequences of prolonging the period of depolarizing GABAergic activity, perhaps by selectively reducing KCC2 activity in developmentally mature neurons.
Balancing glutamatergic and GABAergic inputs during development
The dissection of postsynaptic conductances in tectal cells revealed that, whereas a mature [Cl−]i strongly curtails NMDAR transmission, immature [Cl−]i facilitates sustained depolarizations that move the Vm close to the point of maximal NMDA inward current. NMDAR transmission plays a key role in the development of the retinotectal system, and the degree of NMDAR activation has been implicated in activity-dependent plasticity of both glutamatergic and GABAergic inputs during development (McLean et al., 1996; Aamodt et al., 2000). Our data are in agreement with previous experiments that define a critical difference between “high” and “low” NMDAR transmission. For glutamatergic synapses, it has been shown that, when NMDARs are partially blocked or the Vm of the postsynaptic cell is held close to −70 mV, bursts of afferent activity lead to a lasting reduction in input. However, the same afferent activity leads to increased glutamatergic input when NMDARs are not blocked or when the Vm of the postsynaptic cell is held close to −40 mV (Artola et al., 1990; Cummings et al., 1996).
For GABAergic synapses, it has been shown that bursts of afferent activity lead to a reduction in GABAergic transmission via an NMDAR-dependent mechanism but only when [Cl−]i is high and GABAergic input is depolarizing (McLean et al., 1996). Thus, periods of early network activity that recruit depolarizing Cl− conductances and facilitate high NMDAR transmission appear to favor a strengthening of glutamatergic inputs over GABAergic inputs and may be required to balance these inputs during development. It is therefore interesting that chronic “low-level” NMDAR activation in the developing superior colliculus (the mammalian homolog of the tectum) leads to decreased glutamatergic input but increased GABAergic input (Aamodt et al., 2000; Shi et al., 2001), a similar phenotype to that observed here, when the ECl− was prematurely shifted to hyperpolarized levels and GABAergic conductances attenuated NMDAR transmission.
The balanced development of excitatory and inhibitory inputs has been identified as an activity-dependent process (Liu, 2004; Tao and Poo, 2005). Our data indicate that early depolarizing GABAergic conductances and the underlying [Cl−]i represent important components in this process. The fact that the levels, and the activity, of Cl− transporters may be modulated by network activity (Khalilov et al., 2003; Woodin et al., 2003; Rivera et al., 2004) raises the possibility that dynamic control of [Cl−]i normally enables a developing cell to self-regulate the balance of its synaptic inputs. Ultimately, these activity-dependent mechanisms of synaptic circuit formation must be expressed at the level of proteins. It is therefore interesting that recent work has revealed a group of molecules, the β-neurexins and the neuroligins, that are involved in the formation of both GABAergic and glutamatergic synapses in vitro (Graf et al., 2004; Prange et al., 2004; Chih et al., 2005). Future studies may examine how global or local changes in [Cl−]i, and the associated changes in synaptic activity, relate to these signaling pathways and whether they represent molecular mechanisms for translating patterns of developmental synaptic activity into circuit formation.
Footnotes
C. J. Akerman's present address: Department of Pharmacology, Oxford University, Mansfield Road, Oxford OX1 3QT, UK.
C.J.A. was supported by a Wellcome Trust International Fellowship, and H.T.C. received support from the National Science Foundation, the National Eye Institute, and the National Institutes of Health Director's Pioneer Award. We thank the members of the Cline Laboratory for comments on previous versions of the manuscript. We also thank Zach Mainen and Michael Hausser for helpful discussions, Alex Reyes for advice on dynamic clamp, Peter O'Brien for help in constructing the analog circuit, and Kim Bronson for excellent technical assistance.
References
- Aamodt SM, Shi J, Colonnese MT, Veras W, Constantine-Paton M (2000). Chronic NMDA exposure accelerates development of GABAergic inhibition in the superior colliculus. J Neurophysiol 83:1580–1591. [DOI] [PubMed] [Google Scholar]
- Aizenman CD, Akerman CJ, Jensen KR, Cline HT (2003). Visually driven regulation of intrinsic neuronal excitability improves stimulus detection in vivo. Neuron 39:831–842. [DOI] [PubMed] [Google Scholar]
- Artola A, Brocher S, Singer W (1990). Different voltage-dependent thresholds for inducing long-term depression and long-term potentiation in slices of rat visual cortex. Nature 347:69–72. [DOI] [PubMed] [Google Scholar]
- Ascher P, Nowak L (1988). The role of divalent cations in the N-methyl-d-aspartate responses of mouse central neurones in culture. J Physiol (Lond) 399:247–266. [DOI] [PMC free article] [PubMed] [Google Scholar]
- Ben-Ari Y (2002). Excitatory actions of GABA during development: the nature of the nurture. Nat Rev Neurosci 3:728–739. [DOI] [PubMed] [Google Scholar]
- Ben-Ari Y, Cherubini E, Corradetti R, Gaiarsa JL (1989). Giant synaptic potentials in immature rat CA3 hippocampal neurones. J Physiol (Lond) 416:303–325. [DOI] [PMC free article] [PubMed] [Google Scholar]
- Chih B, Engelman H, Scheiffele P (2005). Control of excitatory and inhibitory synapse formation by neuroligins. Science 307:1324–1328. [DOI] [PubMed] [Google Scholar]
- Chudotvorova I, Ivanov A, Rama S, Hubner CA, Pellegrino C, Ben-Ari Y, Medina I (2005). Early expression of KCC2 in rat hippocampal cultures augments expression of functional GABA synapses. J Physiol (Lond) 566:671–679. [DOI] [PMC free article] [PubMed] [Google Scholar]
- Constantine-Paton M, Cline HT, Debski E (1990). Patterned activity, synaptic convergence, and the NMDA receptor in developing visual pathways. Annu Rev Neurosci 13:129–154. [DOI] [PubMed] [Google Scholar]
- Cummings JA, Mulkey RM, Nicoll RA, Malenka RC (1996). Ca2+ signaling requirements for long-term depression in the hippocampus. Neuron 16:825–833. [DOI] [PubMed] [Google Scholar]
- Ehrlich I, Lohrke S, Friauf E (1999). Shift from depolarizing to hyperpolarizing glycine action in rat auditory neurones is due to age-dependent Cl− regulation. J Physiol (Lond) 520:121–137. [DOI] [PMC free article] [PubMed] [Google Scholar]
- Gabernet L, Jadhav SP, Feldman DE, Carandini M, Scanziani M (2005). Somatosensory integration controlled by dynamic thalamocortical feed-forward inhibition. Neuron 48:315–327. [DOI] [PubMed] [Google Scholar]
- Graf ER, Zhang X, Jin SX, Linhoff MW, Craig AM (2004). Neurexins induce differentiation of GABA and glutamate postsynaptic specializations via neuroligins. Cell 119:1013–1026. [DOI] [PMC free article] [PubMed] [Google Scholar]
- Hensch TK, Fagiolini M, Mataga N, Stryker MP, Baekkeskov S, Kash SF (1998). Local GABA circuit control of experience-dependent plasticity in developing visual cortex. Science 282:1504–1508. [DOI] [PMC free article] [PubMed] [Google Scholar]
- Holt CE (1984). Does timing of axon outgrowth influence initial retinotectal topography in Xenopus? J Neurosci 4:1130–1152. [DOI] [PMC free article] [PubMed] [Google Scholar]
- Hubner CA, Stein V, Hermans-Borgmeyer I, Meyer T, Ballanyi K, Jentsch TJ (2001). Disruption of KCC2 reveals an essential role of K-Cl cotransport already in early synaptic inhibition. Neuron 30:515–524. [DOI] [PubMed] [Google Scholar]
- Isaac JT, Crair MC, Nicoll RA, Malenka RC (1997). Silent synapses during development of thalamocortical inputs. Neuron 18:269–280. [DOI] [PubMed] [Google Scholar]
- Jahr CE, Stevens CF (1990). Voltage dependence of NMDA-activated macroscopic conductances predicted by single-channel kinetics. J Neurosci 10:3178–3182. [DOI] [PMC free article] [PubMed] [Google Scholar]
- Khalilov I, Holmes GL, Ben-Ari Y (2003). In vitro formation of a secondary epileptogenic mirror focus by interhippocampal propagation of seizures. Nat Neurosci 6:1079–1085. [DOI] [PubMed] [Google Scholar]
- Kovalchuk Y, Eilers J, Lisman J, Konnerth A (2000). NMDA receptor-mediated subthreshold Ca2+ signals in spines of hippocampal neurons. J Neurosci 20:1791–1799. [DOI] [PMC free article] [PubMed] [Google Scholar]
- Kyrozis A, Reichling DB (1995). Perforated-patch recording with gramicidin avoids artifactual changes in intracellular chloride concentration. J Neurosci Methods 57:27–35. [DOI] [PubMed] [Google Scholar]
- Lee H, Chen CX, Liu YJ, Aizenman E, Kandler K (2005). KCC2 expression in immature rat cortical neurons is sufficient to switch the polarity of GABA responses. Eur J Neurosci 21:2593–2599. [DOI] [PMC free article] [PubMed] [Google Scholar]
- Leinekugel X, Medina I, Khalilov I, Ben-Ari Y, Khazipov R (1997). Ca2+ oscillations mediated by the synergistic excitatory actions of GABAA and NMDA receptors in the neonatal hippocampus. Neuron 18:243–255. [DOI] [PubMed] [Google Scholar]
- Liu G (2004). Local structural balance and functional interaction of excitatory and inhibitory synapses in hippocampal dendrites. Nat Neurosci 7:373–379. [DOI] [PubMed] [Google Scholar]
- Mayer ML, Westbrook GL, Guthrie PB (1984). Voltage-dependent block by Mg2+ of NMDA responses in spinal cord neurones. Nature 309:261–263. [DOI] [PubMed] [Google Scholar]
- McLean HA, Caillard O, Ben-Ari Y, Gaiarsa JL (1996). Bidirectional plasticity expressed by GABAergic synapses in the neonatal rat hippocampus. J Physiol (Lond) 496:471–477. [DOI] [PMC free article] [PubMed] [Google Scholar]
- Murthy VN, Schikorski T, Stevens CF, Zhu Y (2001). Inactivity produces increases in neurotransmitter release and synapse size. Neuron 32:673–682. [DOI] [PubMed] [Google Scholar]
- Nelson S, Toth L, Sheth B, Sur M (1994). Orientation selectivity of cortical neurons during intracellular blockade of inhibition. Science 265:774–777. [DOI] [PubMed] [Google Scholar]
- Niell CM, Meyer MP, Smith SJ (2004). In vivo imaging of synapse formation on a growing dendritic arbor. Nat Neurosci 7:254–260. [DOI] [PubMed] [Google Scholar]
- Nieukoop PD, Faber J (1994). In: Normal table of Xenopus laevis (Daudin) New York: Garland.
- Owens DF, Kriegstein AR (2002). Is there more to GABA than synaptic inhibition? Nat Rev Neurosci 3:715–727. [DOI] [PubMed] [Google Scholar]
- Owens DF, Boyce LH, Davis MB, Kriegstein AR (1996). Excitatory GABA responses in embryonic and neonatal cortical slices demonstrated by gramicidin perforated-patch recordings and calcium imaging. J Neurosci 16:6414–6423. [DOI] [PMC free article] [PubMed] [Google Scholar]
- Pettit DL, Perlman S, Malinow R (1994). Potentiated transmission and prevention of further LTP by increased CaMKII activity in postsynaptic hippocampal slice neurons. Science 266:1881–1885. [DOI] [PubMed] [Google Scholar]
- Pouille F, Scanziani M (2001). Enforcement of temporal fidelity in pyramidal cells by somatic feed-forward inhibition. Science 293:1159–1163. [DOI] [PubMed] [Google Scholar]
- Prange O, Wong TP, Gerrow K, Wang YT, El-Husseini A (2004). A balance between excitatory and inhibitory synapses is controlled by PSD-95 and neuroligin. Proc Natl Acad Sci USA 101:13915–13920. [DOI] [PMC free article] [PubMed] [Google Scholar]
- Rajan I, Witte S, Cline HT (1999). NMDA receptor activity stabilizes presynaptic retinotectal axons and postsynaptic optic tectal cell dendrites in vivo. J Neurobiol 38:357–368. [DOI] [PubMed] [Google Scholar]
- Rivera C, Voipio J, Payne JA, Ruusuvuori E, Lahtinen H, Lamsa K, Pirvola U, Saarma M, Kaila K (1999). The K+/Cl− co-transporter KCC2 renders GABA hyperpolarizing during neuronal maturation. Nature 397:251–255. [DOI] [PubMed] [Google Scholar]
- Rivera C, Voipio J, Thomas-Crusells J, Li H, Emri Z, Sipila S, Payne JA, Minichiello L, Saarma M, Kaila K (2004). Mechanism of activity-dependent downregulation of the neuron-specific K-Cl cotransporter KCC2. J Neurosci 24:4683–4691. [DOI] [PMC free article] [PubMed] [Google Scholar]
- Robinson HP, Kawai N (1993). Injection of digitally synthesized synaptic conductance transients to measure the integrative properties of neurons. J Neurosci Methods 49:157–165. [DOI] [PubMed] [Google Scholar]
- Rohrbough J, Spitzer NC (1996). Regulation of intracellular Cl− levels by Na+-dependent Cl− cotransport distinguishes depolarizing from hyperpolarizing GABAA receptor-mediated responses in spinal neurons. J Neurosci 16:82–91. [DOI] [PMC free article] [PubMed] [Google Scholar]
- Ruthazer ES, Akerman CJ, Cline HT (2003). Control of axon branch dynamics by correlated activity in vivo. Science 301:66–70. [DOI] [PubMed] [Google Scholar]
- Schiller J, Major G, Koester HJ, Schiller Y (2000). NMDA spikes in basal dendrites of cortical pyramidal neurons. Nature 404:285–289. [DOI] [PubMed] [Google Scholar]
- Sharp AA, O'Neil MB, Abbott LF, Marder E (1993). The dynamic clamp: artificial conductances in biological neurons. Trends Neurosci 16:389–394. [DOI] [PubMed] [Google Scholar]
- Shi J, Aamodt SM, Townsend M, Constantine-Paton M (2001). Developmental depression of glutamate neurotransmission by chronic low-level activation of NMDA receptors. J Neurosci 21:6233–6244. [DOI] [PMC free article] [PubMed] [Google Scholar]
- Shi SH, Hayashi Y, Petralia RS, Zaman SH, Wenthold RJ, Svoboda K, Malinow R (1999). Rapid spine delivery and redistribution of AMPA receptors after synaptic NMDA receptor activation. Science 284:1811–1816. [DOI] [PubMed] [Google Scholar]
- Strange K, Singer TD, Morrison R, Delpire E (2000). Dependence of KCC2 K-Cl cotransporter activity on a conserved carboxy terminus tyrosine residue. Am J Physiol Cell Physiol 279:C860–C867. [DOI] [PubMed] [Google Scholar]
- Tao HW, Poo MM (2005). Activity-dependent matching of excitatory and inhibitory inputs during refinement of visual receptive fields. Neuron 45:829–836. [DOI] [PubMed] [Google Scholar]
- Tao HW, Zhang LI, Engert F, Poo M (2001). Emergence of input specificity of ltp during development of retinotectal connections in vivo. Neuron 31:569–580. [DOI] [PubMed] [Google Scholar]
- Thiagarajan TC, Piedras-Renteria ES, Tsien RW (2002). alpha- and betaCaMKII. Inverse regulation by neuronal activity and opposing effects on synaptic strength. Neuron 36:1103–1114. [DOI] [PubMed] [Google Scholar]
- Watt AJ, Sjostrom PJ, Hausser M, Nelson SB, Turrigiano GG (2004). A proportional but slower NMDA potentiation follows AMPA potentiation in LTP. Nat Neurosci 7:518–524. [DOI] [PubMed] [Google Scholar]
- Wehr M, Zador AM (2003). Balanced inhibition underlies tuning and sharpens spike timing in auditory cortex. Nature 426:442–446. [DOI] [PubMed] [Google Scholar]
- Woodin MA, Ganguly K, Poo MM (2003). Coincident pre- and postsynaptic activity modifies GABAergic synapses by postsynaptic changes in Cl− transporter activity. Neuron 39:807–820. [DOI] [PubMed] [Google Scholar]
- Wu G, Malinow R, Cline HT (1996). Maturation of a central glutamatergic synapse. Science 274:972–976. [DOI] [PubMed] [Google Scholar]
- Wu GY, Cline HT (2003). Time-lapse in vivo imaging of the morphological development of Xenopus optic tectal interneurons. J Comp Neurol 459:392–406. [DOI] [PubMed] [Google Scholar]
- Wu GY, Zou DJ, Rajan I, Cline H (1999). Dendritic dynamics in vivo change during neuronal maturation. J Neurosci 19:4472–4483. [DOI] [PMC free article] [PubMed] [Google Scholar]
- Xiao MY, Wasling P, Hanse E, Gustafsson B (2004). Creation of AMPA-silent synapses in the neonatal hippocampus. Nat Neurosci 7:236–243. [DOI] [PubMed] [Google Scholar]
- Zhang LI, Tao HW, Holt CE, Harris WA, Poo M (1998). A critical window for cooperation and competition among developing retinotectal synapses. Nature 395:37–44. [DOI] [PubMed] [Google Scholar]
- Zhu JJ, Malinow R (2002). Acute versus chronic NMDA receptor blockade and synaptic AMPA receptor delivery. Nat Neurosci 5:513–514. [DOI] [PubMed] [Google Scholar]