

Abstract
Loss of mitochondrial complex I catalytic activity in the electron transport chain (ETC) is found in multiple tissues from individuals with sporadic Parkinson's disease (PD) and is a property of some PD model neurotoxins. Using special ETC subunit-specific and complex I immunocapture antibodies directed against the entire complex I macroassembly, we quantified ETC proteins and protein oxidation of complex I subunits in brain mitochondria from 10 PD and 12 age-matched control (CTL) samples. We measured nicotinamide adenine dinucleotide (NADH)-driven electron transfer rates through complex I and correlated these with complex I subunit oxidation levels and reductions of its 8 kDa subunit. PD brain complex I shows 11% increase in ND6, 34% decrease in its 8 kDa subunit and contains 47% more protein carbonyls localized to catalytic subunits coded for by mitochondrial and nuclear genomes We found no changes in levels of ETC proteins from complexes II–V. Oxidative damage patterns to PD complex I are reproduced by incubation of CTL brain mitochondria with NADH in the presence of rotenone but not by exogenous oxidant. NADH-driven electron transfer rates through complex I inversely correlate with complex I protein oxidation status and positively correlate with reduction in PD 8 kDa subunit. Reduced complex I function in PD brain mitochondria appears to arise from oxidation of its catalytic subunits from internal processes, not from external oxidative stress, and correlates with complex I misassembly. This complex I auto-oxidation may derive from abnormalities in mitochondrial or nuclear encoded subunits, complex I assembly factors, rotenone-like complex I toxins, or some combination.
Keywords: complex I, Parkinson's disease, electron transport chain, protein oxidation, oxygenase, mitochondria
Introduction
Parkinson's disease (PD) is a neurodegenerative disease that produces diffuse protein aggregation pathology but relatively selective death of substantia nigra dopaminergic neurons, resulting in the movement abnormalities first described by James Parkinson in 1817 that are treated by dopaminergic therapies. Rare familial forms of parkinsonism transmitted in autosomal dominant or recessive patterns have been traced to mutations in multiple genes. For some of these autosomal forms of parkinsonism, mitochondrial dysfunction is emerging as a common theme of pathogenesis (Ved et al., 2005).
Neurotoxins like rotenone (Greenamyre et al., 2003; Panov et al., 2005) and MPTP (Przedborski and Vila, 2003; Przedborski et al., 2004) used to create PD models act by inhibiting the electron transport chain (ETC) at complex I. Impaired catalytic activity of complex I is found in multiple PD tissues (Parker and Swerdlow, 1998; Shults, 2004), suggesting a systemic ETC impairment. Expression in a neural cell cybrid model of mitochondrial DNA from platelets of living PD patients partially reproduces the complex I deficit (Swerdlow et al., 1996), increases oxidative stress (Swerdlow et al., 1996), and spontaneously produces protein aggregates with the biochemical and microscopic properties of Lewy bodies (Trimmer et al., 2004). The oxidative stress in PD cybrids drives stress-associated cell signaling, yielding caspase-mediated decreased survival (Onyango et al., 2005a). These cybrid findings implicate PD mtDNA as playing a significant pathogenic role in reducing complex I activity and increasing oxidative stress and spontaneous cell death.
Complex I is the largest of the ETC macrocomplexes and consists of 46 subunits, seven of which are coded for by mtDNA. The remaining 39 subunits are coded by nuclear genes, imported into mitochondria, and assembled with the mtDNA-encoded subunits in a complicated process (Antonicka et al., 2003; Ugalde et al., 2004; Vogel et al., 2005). The seven mtDNA-encoded subunits are hydrophobic and believed to be assembled with seven nuclear subunits into a catalytically active “minimal essential ensemble” physically located in the inner membrane arm of an L-shaped complex. Complex I activity can be impaired by genetic defects in mtDNA and nuclear DNA-encoded subunits or any factors that impair macromolecular assembly.
We undertook the present study to understand how PD brain complex I is impaired. We used an immunocapture technique that allows isolation of catalytically active ETC complexes to display complex I subunits (Murray et al., 2003). We observed that PD brain complex I is oxidatively damaged, and that the most damaged subunits are represented by members of the minimal essential ensemble. The pattern of oxidative damage to PD brain complex I cannot be completely reproduced by exogenous oxidant but is reproduced by blockade with rotenone at the quinone reduction site and inversely correlates with rates of electron flux through complex I. Complex I in PD brain is misassembled or labile, as reflected by a significant loss of its 8 kDa subunit. Our findings suggest that PD brain complex I oxidatively damages its own catalytic subunits through as yet unclear mechanisms, contributing to instability of its macroassembly and loss of bioenergetic function.
Materials and Methods
Enriched mitochondrial fraction preparation.
Enriched human brain mitochondrial fractions were prepared by a modification of the method of Lai and Clark (Lai and Clark, 1978). Slow-frozen cortical ribbon samples from neuropathologically confirmed control (CTL) and Parkinson's disease (PD) cases were obtained from the University of Virginia Brain Resource Facility, which collected these cases under an Institutional Review Board-approved protocol. Tissue was stored in air-tight containers at −70°C from autopsy until time of use. Two to 7 g of frontal cortex were minced in ice-cold isolation buffer (0.15 m KCl, 20 mm K phosphate, 1 mm EDTA, pH 7.6), homogenized by 50 passes using a Dounce homogenizer (0.05 mm clearance) in 7 volumes of isolation buffer, and centrifuged at 4° for 3 min at 1300 × g. Supernatants were saved on ice, and the pellets homogenized by 30 passes in 6 volumes of isolation buffer, then centrifuged 3 min at 1300 × g. Supernatants were combined and centrifuged for 20 min at 17,000 × g at 4°C. P2 pellet was washed with isolation buffer and centrifuged again. For gradient purified mitochondria, the P2 pellet resuspended in 10 ml of isolation buffer using 10 passes in a glass-Teflon homogenizer (0.15 mm clearance), layered on gradients of 12 ml of 10% Ficoll and 10 ml of 7.5% Ficoll (w/v in isolation buffer), and ultracentrifuged for 40 min at 85,470 × g at 4°C. Final pellets were resuspended in 200 μl for gradient purified samples or 500 μl of intracellular buffer (125 mm KCl, 20 mm HEPES, 2 mm KH2PO4, 5 mm MgCl2, 10 mm EGTA, pH 7.0) for mitochondrial enriched fractions. Protein concentrations were determined using DC Protein Assay (Bio-Rad, Hercules, CA). Mitochondrial fractions not used for AmplexRed assay were divided, and both samples were centrifuged for 10 min at 21,000 × g at 4°C. One pellet was resuspended in mitochondrial freezing buffer (50 mm imidazole/HCl, 15% glycerol, 250 mm sucrose, 50 mm NaCl) and stored at −80°C. Remaining mitochondrial pellet and a portion of the crude pellet were resuspended in modified radioimmunoprecipitation assay (RIPA) buffer [50 mm Tris HCl, pH 7.4; 1% NP40, 0.25% sodium deoxycholate, 150 mm sodium chloride, 1 mm EGTA, 1 mm sodium orthovanadate, 1 mm sodium fluoride, 1 mm PMSF, and 1:100 Protease Inhibitor Cocktail Set I (Calbiochem, La Jolla, CA)], sonicated for 2 min, held on ice for 30 min with vortexing every 5 min, centrifuged at 15,000 × g for 10 min, and the supernatant was stored at −80°C for later SDS-PAGE.
SDS-PAGE immunoblot analysis of mitochondrial fraction purity.
Protein concentrations of mitochondrial and crude pellet fractions resuspended in modified RIPA buffer were determined using Micro BCA Protein Assay Kit (Pierce, Rockford, IL). Protein (50 μg) of each sample were dissolved in Laemmli sample buffer (Bio-Rad) with 5% 2-mercaptoethanol, and then boiled 5 min and electrophoresed on 10–20% Tris-HCl Criterion gels (Bio-Rad). SDS-PAGE gels were equilibrated in transfer buffer [25 mm Tris-base, 192 mm glycine, 20% (v/v) ethanol, 0.05% (w/v) SDS], and proteins were electrophoretically transferred to polyvinylidene difluoride membranes, washed with Tris-buffered saline (TBS) and with 0.05% Tween 20 (T-TBS), and blocked for 1 h in 5% powder milk in T-TBS. Overnight primary antibody incubations used a cocktail of 1:2500 mouse anti-N-cadherin (BD Biosciences, Franklin Lakes, NJ), 1:250 mouse anti-GM 130 (BD Biosciences), 0.05 μg/ml mouse anti-Hsp 60 (heat shock protein 60) (Stressgen, Victoria, British Columbia, Canada), 4 μg/ml mouse anti-tetrapeptide (Stressgen), 1 μg/ml mouse anti-syntaxin 13 (Stressgen), and 1.75 μg/ml mouse anti-porin in blocking buffer. After an additional 2 h incubation at room temperature, blots were washed six times in T-TBS, incubated for 1 h in 1:25,000 donkey anti-mouse IgG (heavy plus light) HRP (Jackson ImmunoResearch, West Grove, PA) in blocking buffer, washed three times in T-TBS, three times in TBS and incubated 4 min in SuperSignal West Dura (Pierce). Chemiluminescence was detected for 5 min in a Bio-Rad Fluor-S MultiImager.
SDS-PAGE immunoblot analysis of mitochondrial complex I/oxidative phosphorylation subunits.
Twenty micrograms of each mitochondrial protein sample were loaded into wells of a 10–20% SDS-PAGE gradient gel. After 1.5 h 150 V electrophoresis, samples were transferred in CAPS electroblotting transfer buffer [10 mm CAPS (C2632; Sigma, St. Louis, MO), 10% methanol, pH 11] from gel to polyvinylidene difluoride membranes (0.45 μm pore size; Millipore, Bedford, MA) using 150 mA for 2 h. All primary antibodies were purchased from MitoSciences (Eugene, OR) and diluted to the proper concentration, as listed below. The secondary antibody used was a goat anti-mouse HRP (Bio-Rad) with detection using ECL+ plus Western blotting detection system (GE Healthcare UK, Little Chalfont, UK).
Immunocapture of complex I.
Protein concentrations of mitochondrial fractions resuspended in freezing buffer were determined using Micro BCA Protein Assay Kit (Pierce). Five milligrams of mitochondrial fraction protein were diluted to 900 μl in buffer A [50 mm Tris-HCl, pH 7.5, 1:100 Protease Inhibitor Cocktail Set I (Calbiochem), 1 mm PMSF, pH 7.5] with 100 μl of 10% n-dodecyl β-d-maltoside added, incubated for 30 min on ice, and centrifuged for 30 min at 21,000 × g at 4°C. Complex I Capture Matrix (MitoSciences) was added and incubated overnight at 4°C, followed by 2 h incubation at room temperature. After being centrifuged 3 min at 3200 × g, 4°C, the pellet was washed two times for 5 min with buffer A, and then the pellet was resuspended in 40 μl of 1% SDS and incubated 10 min at room temperature. After being centrifuged 3 min at 3200 × g, 4°C, the supernatant was saved, 5 μl of washed protein A/G plus agarose (Santa Cruz Biotechnology, Santa Cruz, CA) was added, incubated 1 h at room temperature, and centrifuged as before; the supernatant was saved. Protein concentrations in the released immunocaptured complex I samples were determined using Micro BCA Protein Assay Kit (Pierce).
SDS-PAGE immunoblot analysis of complex I protein carbonyls.
Samples of immunocaptured complex I released from capture beads were derivatized by adding saturated SDS to 10 μg of immunocaptured complex I, and then 2,4-dinitrophenylhydrazine (DNPH) solution (OxyBlot Kit) was added and incubated 15 min at room temperature. Neutralization solution (OxyBlot Kit) was added to stop the reaction; 2-mercaptoethanol was added, and samples were eletrophoresed on 10–20% Tris-HCl Criterion gels (Bio-Rad). SDS-PAGE gels were transferred to PVDF membranes and developed as above using a primary antibody against DNPH. The images generated by chemiluminescence were captured with a Bio-Rad Fluor-S MultiImager and analyzed using Quantity One software (version 4.4.1; Bio-Rad). This software automatically detected bands, subtracted background values from band intensities, and assigned molecular weights (MWs) based on standards. To compare DNPH band intensities across the two gels needed to hold all samples, protein-DNPH standards were run on each gel. The intensity of the band from DNPH-trypsin inhibitor (see Fig. 3) was used as a standard to compare intensities of DNPH immunostaining in CTL and PD mitochondrial immunocaptured complex I samples across gels.
Figure 3.

Protein carbonyl levels in immunocaptured complex I samples. The same mitochondrial preparations from frontal cortex were used for all figures. Shown are immunoblots derived from 10 μg protein samples of immunocaptured complex I from three CTL (Ctl) and six PD brains after derivatization with DNPH, SDS-PAGE, transfer, and immunostaining for DNPH. The band on the far left (“DNPH”) shows the location and relative intensity of the DNPH protein standards. The arrow points to DNPH-trypsin inhibitor band, which was used as a standard to normalize all the other detected bands. MW marker bands are not shown. See Materials and Methods for details.
Sample preparation for mass spectrometry analysis.
Immunocaptured complex I samples were derivatized and electrophoresed as for complex I protein carbonyl analysis. The resulting gel was fixed for 1 h in 50% methanol/7% acetic acid, washed 15 min in water, and stained overnight in SYPRO Ruby Protein Gel Stain (Invitrogen, Eugene, OR). The gel was destained for 30 min in 10% methanol/7% acetic acid and washed with water, and bands of interest were excised with scalpel blades. Mass spectrometry (MS) analysis was performed by the W.M. Keck Biomedical Mass Spectrometry Laboratory (Dr. N. Sherman, Director) at the University of Virginia. Gel bands of interest were destained for 2 h in 50% methanol, reduced for 30 min with 10 mm dithiothreitol in 0.1 m ammonium bicarbonate (Ambic), and alkylated for 30 min with 50 mm iodoacetamide in Ambic. Gel pieces were dried by SpeedVac (Savant, Hicksville, NY) before digestion with 20 ng/μl Promega (Madison, WI) trypsin in Ambic for 18 h. Peptides were extracted twice with 50% acetonitrile/5% formic acid (combined) and evaporated to 20 μl for liquid chromatography (LC)-MS analysis on a Thermo Electron (Pittsburgh, PA) LTQ-FT hybrid ion trap (IT)-ion cyclotron resonance (ICR) mass spectrometer system with a Protana nanospray ion source interfaced to a self-packed 8 cm × 75 μm inner diameter Phenomenex (Torrance, CA) Jupiter 10 μm C18 reversed-phase capillary column. One microliter of peptide extract was injected, and peptides were eluted from column by an acetonitrile/0.1 m acetic acid gradient at a flow rate of 0.3 μl/min over 30 min. Nanospray ion source was operated at 2.8 kV. Digests were analyzed using a method that acquired one full-scan mass spectrum (ICR, 100 K resolution) followed by 10 product ion spectra (IT). This analysis produced ∼1500 product ion spectra ranging in abundance over several orders of magnitude. Data were analyzed by database search using the Sequest algorithm against the NR (National Center for Biotechnology Information) database. Final results were manually verified.
Nicotinamide adenine dinucleotide-driven superoxide production.
Rates of nicotinamide adenine dinucleotide (NADH)-driven electron flux through complex I were measured using a variation of the Amplex Red method for detection of mitochondrial hydrogen peroxide (Starkov and Fiskum, 2003). The final reaction volume of 200 μl in 96-well plates contained brain mitochondria (see above) at a final protein level of 0.4 mg/ml in intracellular buffer, superoxide dismutase 1 (SOD-1) (40 U/ml), HRP (5 U/ml), and Amplex Red (5 μm). Variable additions included β-NADH (125 μm), p-hydroxymercuribenzoate (60 μm), capsaicin (20 μm), rotenone (10 μm), or decylubiquinone (60 μm). The reaction mixture was incubated in quadruplicate at 37° with readings taken every 5 min at 550 nm excitation and 580 nm emission. Rates of Amplex Red oxidation were calculated over the first 20 min.
NADH-driven complex I oxidation.
Mitochondrial preparations (18–27 mg of protein) from CTL brain samples in intracellular buffer were incubated at 37 degrees for 60–75 min in the presence of either 125 μm or 1.25 mm NADH, 60 μm decylubiquinone, without or with p-hydroxymercuribenzoate (60 μm), capsaicin (20 μm), or rotenone (10 μm). All incubations contained protease inhibitors and PMSF. After incubation, mitochondria were pelleted, washed, and solubilized for complex I immunocapture and protein carbonyl detection as above.
Complex I catalytic activity.
Rates of rotenone-sensitive NADH oxidation were measured at 37° in 0.1 m K-PO4 buffer, pH 7.4, containing Coenzyme Q1 (0.1 mm), KCN (1 mm), and NaN3 (2 mm). The reaction was initiated by addition of 0.25 mg of mitochondrial protein and β-NADH (0.3 mm). Absorbance at 340 nm was followed for 180 s, and then rotenone (1 μm) was added and the reaction followed for an additional 180 s.
Results
Isolation of human frontal cortex mitochondria
We isolated mitochondria as P2 pellets from frontal cortex samples of 12 CTL and 10 PD postmortem brain samples. Each of the PD frontal cortex samples was reviewed by a staff neuropathologist and found to be free of other degenerative processes such as Alzheimer's disease (B. Miller, University of Virginia, Charlottesville, VA, personal communication). There were no significant differences in age at death [PD, 75.1 ± 9.2 (SD); CTL, 67.8 ± 13.1; p = 0.14] or postmortem interval until dissected tissue was placed into the freezer [PD, 13.1 ± 3.8 h; CTL, 11.4 ± 8.2, p = 0.54]. The CTL cases had six males and six females. The PD cases had seven males and three females, consistent with the male predominance (∼1.5×) of PD. Known clinical characteristics of the PD patients are shown in Table 1; in most cases, medication histories were not available. The semipurified mitochondrial preparations had similar ratios of band densities for porin (mainly mitochondrial outer membrane) to N-cadherin (mainly plasma membrane) in PD (1.0 ± 0.5 SD) and CTL (1.2 ± 0.4 SD) (p = 0.3), indicating comparable degrees of mitochondrial enrichment. We did not find any significant differences in porin band densities between PD and CTL mitochondrial preparations (data not shown).
Table 1.
Clinical characteristics of Parkinson's disease cases
| Case | Sex | Age (years) | PMI | Clinical histories |
|---|---|---|---|---|
| 166 | M | 52 | 14.5 | Severe, rapidly progressive PD; IDDM; CRF; depression |
| 168 | F | 73 | 15.5 | 23 year hx of PD; depression; cortical plaques at autopsy did not meet criteria for AD |
| 170 | M | 76 | 12.75 | TURP 11 years before death; orthostatic hypotension; no evidence of MSA at post |
| 171 | M | 83 | 5.5 | 4 year hx of PD; hypothyroidism; silent aspiration; no evidence of AD or MSA at post |
| 172 | M | 84 | 10 | 12 year hx of PD (symptoms 6 years before dx); depression; no evidence of AD or MSA at post |
| 174 | F | 82 | 13.5 | Depression; discoid lupus erythematosus |
| 175 | M | 79 | 16.5 | 10 year hx of PD; possible chronic lymphocytic leukemia; neurogenic bladder; no AD at post |
| 182 | M | 77 | 15 | 37 year hx of PD; tonic-clonic seizures; visual hallucinations; focal spongiform vacuolizations |
| 187 | F | 73 | 9.5 | >20 year hx of PD |
| 203 | M | 72 | 18 | 26 year hx of PD; s/p CABG × 5; hx of smoking |
M, Male; F, female; CABG, coronary artery bypass grafting; CRF, chronic renal failure; hx, history; dx, diagnosis; IDDM, insulin-dependent diabetes mellitus; MSA, multisystem atrophy; PMI, postmortem interval (hours); post, postmortem examination; TURP, transurethral resection of the prostate; s/p, status post.
Complex I catalytic activity is reduced in PD frontal cortex mitochondrial preparations
We assayed traditional complex I catalytic activity (NADH:ubiquinone oxidoreductase) by measuring the rotenone-sensitive rate of NADH consumption in the presence of Coenzyme Q1. Because of the extensive use of mitochondrial preparations for other experiments, we were only able to examine complex I catalytic activity in 6 of the CTL but in all 10 of the PD samples. After removing one PD outlier sample that was 2.5 times the mean CTL values and 2.5 times as large as its closest PD neighbor, the nine remaining PD samples showed an overall reduction of 32% with p = 0.06 when expressed per milligram of mitochondrial protein. We also had four CTL and seven PD samples in which we were able to assay both complex I catalytic activity and relative porin levels (by Western blot) as a marker of outer mitochondrial membrane mass. When normalized to porin band densities, these PD samples showed a 30% reduction in complex I activity with p = 0.05.
PD and CTL brain mitochondria have similar levels of proteins from complexes II–V
We used a mixture of monoclonal antibodies directed against various proteins in complexes of the ETC. Quantitative band densitometry of the Western blot image did not reveal any differences between PD and CTL samples for proteins from complexes II–V (Fig. 1).
Figure 1.
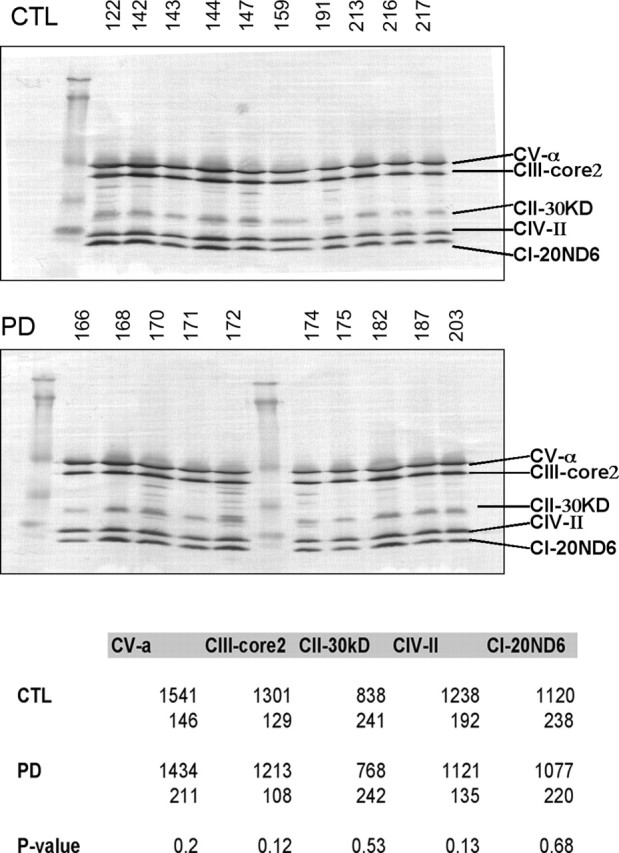
Western blot of CTL and PD brain mitochondrial ETC subunits. The same mitochondrial preparations from frontal cortex samples were used for all figures. The blot images are shown for CTL and PD mitochondrial samples. The table at the bottom gives the actual mean band densities with the SDs underneath. p values for comparing the CTL and PD groups did not demonstrate any significant differences. See Materials and Methods for details. CI–CV, Complex I–V.
PD brain mitochondria have slightly increased ND6 protein and reduced 8 kDa subunit from complex I
In a Western blot for complex I subunits, band densitometry revealed that PD brain mitochondria showed a small (11%) but significant (p = 0.005) increase in levels of 20 kDa ND6 protein, which is one of seven mtDNA-encoded complex I proteins (Fig. 2). More impressive was the 33% reduction (p = 0.0004) in levels of the 8 kDa subunit of complex I in PD brain mitochondria.
Figure 2.
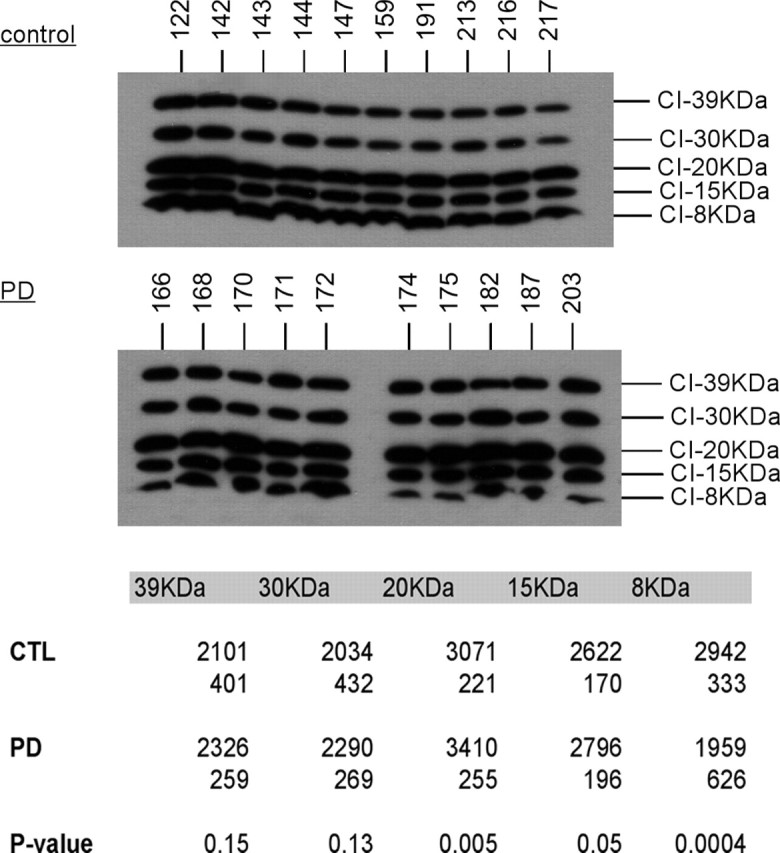
Western blot of CTL and PD mitochondria for complex I subunits. The same mitochondrial preparations from frontal cortex samples were used for all figures. The blot images are shown for CTL and PD mitochondrial samples, and localization of the complex I subunit bands was performed as described previously (Triepels et al., 2001; Murray et al., 2003). The table at the bottom gives the actual mean band densitites with the SDs underneath. p values indicated highly significant differences for the 20 and 8 kDa subunits. See Materials and Methods for details.
Protein carbonyls are increased in PD complex I
We used an immunocapture technique to isolate the complete complex I macroassembly in mitochondria isolated from 10 PD and 12 CTL frontal cortex samples. Equal amounts (10 μg) of immunocaptured complex I protein released from the beads were then derivatized with dinitrophenylhydrazine (DNPH) to reveal protein carbonyls, as an indication of oxidative damage. The DNPH-derivatized proteins were then separated on SDS-PAGE, blotted, and immunolocalized with anti-DNPH antibody. An example of such a blot is shown in Figure 3. Quantitative analysis of total lane densities showed that the total DNPH reactivity was increased 47% in PD compared with CTL samples (p < 0.001). Twelve individual DNPH bands were consistently discernible across all samples on the immunoblots by our software. Analysis of the densities of these individual bands revealed that the ratio of PD/CTL intensities varied from 0.95 to 1.56. For five bands, the increased intensities of DNPH reactivity in the PD samples were statistically significantly different from those in the CTL samples. The data from these bands are presented in Table 2.
Table 2.
DNPH reactivity of complex I subunits immunocaptured from PD brain mitochondria
| Band | MW (∼kDa) | PD/CTL | p value (t test) | Peptides found (n) |
|---|---|---|---|---|
| 1 | 13 | 1.2 | 0.02 | Not assayed |
| 2 | 15 | 1.2 | 0.08 | |
| 3 | 16 | 1.0 | ||
| 4 | 18 | 1.0 | ||
| 5 | 21 | 1.1 | ||
| 6 | 26 | 1.3 | 0.04 | NDUFB5 (2) |
| NDUFB6 (8) | ||||
| NDUFB7 (2) | ||||
| 7 | 35 | 1.1 | ||
| 8 | 45 | 1.0 | ||
| 9 | 48 | 1.2 | 0.03 | ND4 (1) |
| ND5 (10) | ||||
| NDUFS2 (8) | ||||
| NDUFV1 (19) | ||||
| 10 | 76 | 1.1 | ||
| 11 | 94 | 1.6 | 0.02 | NDUFS1 (43) |
| 12 | 232 | 1.3 | 0.02 | Not assayed |
Complex I macroassemblies were immunocaptured from PD and CTL brain mitochondrial preparations, and then derivatized with DNPH, electrophoresed, and immunoblotted for DNPH as described in Materials and Methods. DNPH(+) bands were quantitated by Quantity One software (Bio-Rad). In a separate gel, bands corresponding to those seen in DNPH blots at ∼26, ∼48, and ∼94 kDa were cut out and analyzed by mass spectrometry. The mass spectrometry output is available as individual Excel files in the supplemental data (available at www.jneurosci.org as supplemental material).
Identification of complex I subunits corresponding to DNPH bands
To identify which complex I subunits were present in the bands that showed increased oxidative damage in PD brain mitochondria, we stained simultaneously run SDS-PAGE gels with DNPH derivatized complex I proteins with SyproRuby fluorescent protein stain, removed three bands, and analyzed them by LC-MS mass spectrometry. The results are presented in Table 2 and show that we could identify two mtDNA-encoded subunits (ND4, ND5) and six nuclear DNA-encoded subunits (NDUFS1, NDUFS2, NDUFV1, NDUFB5, NDUFB6, NDUFB7). Details of the mass spectrometry protein identification are provided as supplemental data (available at www.jneurosci.org as supplemental material).
Kinetics of NADH-driven superoxide production
We exposed isolated mitochondria to NADH to determine the rate of flux of electrons through complex I under basal conditions and during inhibition of electron transfer at varying points within complex I (Fig. 4). The underlying principle is that NADH-derived electrons leaving complex I at several potential electron transfer points react with ambient oxygen to form superoxide that is then converted to hydrogen peroxide by endogenous SOD-2 and added exogenous SOD-1. Formed hydrogen peroxide in the presence of added peroxidase (HRP) oxidizes nonfluorescent AmplexRed dye to a fluorescent form, which is then detected. The SOD-1/HRP/AmplexRed system thus serves as a trap for any formed superoxide and captures superoxide formed from electrons leaving complex I at any point. An additional consideration is that any hydrogen peroxide formed can also be degraded by mitochondrial matrix glutathione peroxidase. Thus, the rates of AmplexRed oxidation are likely to be significantly less than NADH oxidation measured by traditional complex I catalytic assays.
Figure 4.

Top, Examples of NADH-driven AmplexRed oxidation experiments. Shown are typical results from incubation of 0.4 mg/ml mitochondrial protein isolated from human frontal cortex and incubated at 37° with the indicated additions. Results from a CTL brain are on the left, and those from a PD brain are on the right. Bottom, Diagram of electron flow through complex I. mitos, Mitochondria; IM, OM, inner and outer mitochondrial membranes; FMN, flavin mononucleotide; N-(x), Fe-S clusters; Q, coenzyme Q. Adapted from Genova et al. (2004).
An example of typical kinetic data are shown in Figure 4. We found that the basal rate of oxidation of AmplexRed in absence of mitochondria but with NADH present was 5% or less than that with mitochondria and NADH present. The rates of increase in oxidized AmplexRed were generally linear over, at minimum, the first 30 min, and rates of AmplexRed oxidation were calculated over the first 20 min. Table 2 summarizes the results of two groups of groups of experiments performed in September–October, 2004 (five CTL, six PD) and with different samples in March, 2005 (five CTL, four PD). To allow normalization of Amplex Red oxidation rates across experimental sets, the values in each experimental set were normalized to mean CTL values from each set. By this approach, the PD samples had an average overall reduction of NADH-driven electron flux of 27% (p = 0.003) with NADH alone and a reduction of 24% (p = 0.02) when decylubiquinone was added as a terminal electron acceptor.
We examined the effect of inhibiting electron transfer at varying points within complex I on rates of NADH-driven AmplexRed oxidation (Table 3). We used an inhibitor of Fe-S clusters (p-hydroxymercuribenzoic acid), a “type B” inhibitor (rotenone) of electron transfer from Fe-S cluster N-2 to oxidized quinone, and a “type C” inhibitor (capsaicin) of quinone reduction to QH2, as well as adding decylubiquinone as a terminal electron acceptor (Fig. 4). We normalized the rates of NADH-driven AmplexRed oxidation in the presence of these inhibitors as percentage of that observed with the mitochondria of each sample in the presence of NADH alone. We observed no differences in the effects of these inhibitors between PD and CTL samples, with the exception that PD brain mitochondria were less sensitive to inhibition by capsaicin. (Table 3). Note that addition of rotenone had minimal overall effects on NADH-driven AmplexRed oxidation rates, which points out that this assay is measuring a different phenomenon than traditional complex I catalytic assays, which rely on initial NADH oxidation rates when ubiquinone is the sole electron acceptor. Our rates of AmplexRed oxidation expressed in terms of H2O2 formed were between ∼200 and ∼300 pmol/mg/min, very comparable with values reported for rat brain mitochondria respiring on complex I substrates (Starkov and Fiskum, 2003). However, since our mitochondria were isolated from frozen postmortem samples, it is unlikely that any true respiration (electron transport coupled to oxygen consumption) was taking place.
Table 3.
Effects of complex I electron transfer inhibitors on NADH-driven AmplexRed oxidation in CTL and PD brain mitochondria
| Additions | CTL | PD | p value (t test) |
|---|---|---|---|
| NADH | 100% | 73% of CTL | 0.003 |
| NADH + decylubiquinone | 100% | 76% of CTL | 0.02 |
| % NADH only | |||
| NADH + pOH Hg benzoate | 80 | 74 | 0.53 |
| NADH + capsaicin | 57 | 71 | 0.03 |
| NADH + rotenone | 88 | 94 | 0.62 |
| NADH + decylubiquinone | 104 | 107 | 0.61 |
| NADH + decylUB + rotenone | 117 | 120 | 0.77 |
NADH-driven ROS production detected with AmplexRed was assayed in PD and CTL mitochondrial preparations as described in Materials and Methods. Various inhibitors of electron transfer within complex I were added as indicated. decylUB, Decylubiquinone.
We isolated mitochondria from SH-SY5Y neuroblastoma cells and examined the effects of freezing/thawing on the ability of the above inhibitors to alter NADH-driven AmplexRed oxidation. We also obtained a specimen of fresh temporal cortex from an individual undergoing temporal lobe resection for epilepsy treatment. We isolated mitochondria from this fresh brain tissue and also flash-froze and stored overnight a portion of this specimen, then isolated mitochondria from it. For mitochondria isolated from both SH-SY5Y cells and temporal cortex, freezing/thawing of mitochondrial preparations, or freezing of brain tissue before mitochondrial isolation did not change rates of NADH-driven AmplexRed oxidation, nor did it qualitatively change the effects of inhibitors or stimulation by addition of decylubiquinone. However, freezing consistently reduced slightly the stimulation by added decylubiquinone of NADH-driven AmplexRed oxidation (not shown).
Relationship between degrees of complex I oxidative damage and rates of NADH-driven electron flow through complex I
We explored the relationship between the levels of oxidative damage to brain mitochondrial complex I, determined by DNPH analysis of protein carbonyl content in immunocaptured complex I, and the rates of NADH-driven electron flow through complex I measured in mitochondrial fractions. The results are presented in Figure 5 and show that degree of oxidative damage is inversely related to rates of NADH-driven electron flow. There were no correlations among degrees of complex I protein oxidation and age at death or postmortem interval (data not shown).
Figure 5.

Mitochondrial rates of NADH-driven AmplexRed oxidation are inversely correlated with protein carbonyl levels in complex I bands. Shown are plots of rates of NADH-driven mitochondrial AmplexRed oxidation (expressed as % CTL values) versus optical densities of protein carbonyls (as different DNPH bands from SDS-PAGE gels) in immunocaptured complex I. CTL samples are circles and PD samples are squares; R values for linear regression fitting and p values for the regression fit are shown.
Production of PD pattern of complex I oxidation by NADH plus rotenone
Our results to this point indicated that PD brain complex I exhibited greater oxidative damage to a number of complexes encoded by mitochondrial and nuclear genomes, that these complexes were catalytically important, and that this oxidative damage appeared to inhibit NADH-stimulated electron flow through complex I. We then tested the hypothesis that the elevated complex I oxidative damage in PD arose internally from impaired electron transfer. We incubated CTL brain mitochondria with NADH and decylubiquinone in the absence or presence of the various inhibitors of electron transfer within complex I and examined immunocaptured complex I for oxidative damage patterns. As shown in Figure 6A, incubation with 125 μm NADH did not increase DNPH reactivity in immunocaptured complex I until rotenone was added. Then a pattern of DNPH reactivity was produced that was similar to that observed spontaneously in PD brain. This was particularly notable for the band at ∼50 kDa that was found to contain the mtDNA-encoded subunits ND4 and ND5, in addition to two catalytically important nuclear DNA-encoded subunits NDUFS2 and NDUFV1. Exposure of CTL brain mitochondria to exogenous oxidant (hydrogen peroxide) did not reproduce completely the pattern observed in PD brain (Fig. 6A). We then repeated this experiment with mitochondrial preparations from two other CTL brains and exposed the mitochondria to a 10-fold higher [NADH] (1.25 mm) in the absence (lanes 1 and 3) or presence (lanes 2 and 4) of rotenone. This [NADH] has been shown to produce oxidative damage to catalytic subunits of bovine complex I (Chen et al., 2005) and caused intense DNPH labeling of the ∼50 kDa band that was not increased further by rotenone (Fig. 6B). Rotenone incubation increased DNPH labeling in the ∼26 kDa band in immunocaptured complex I from both CTL mitochondrial preparations.
Figure 6.
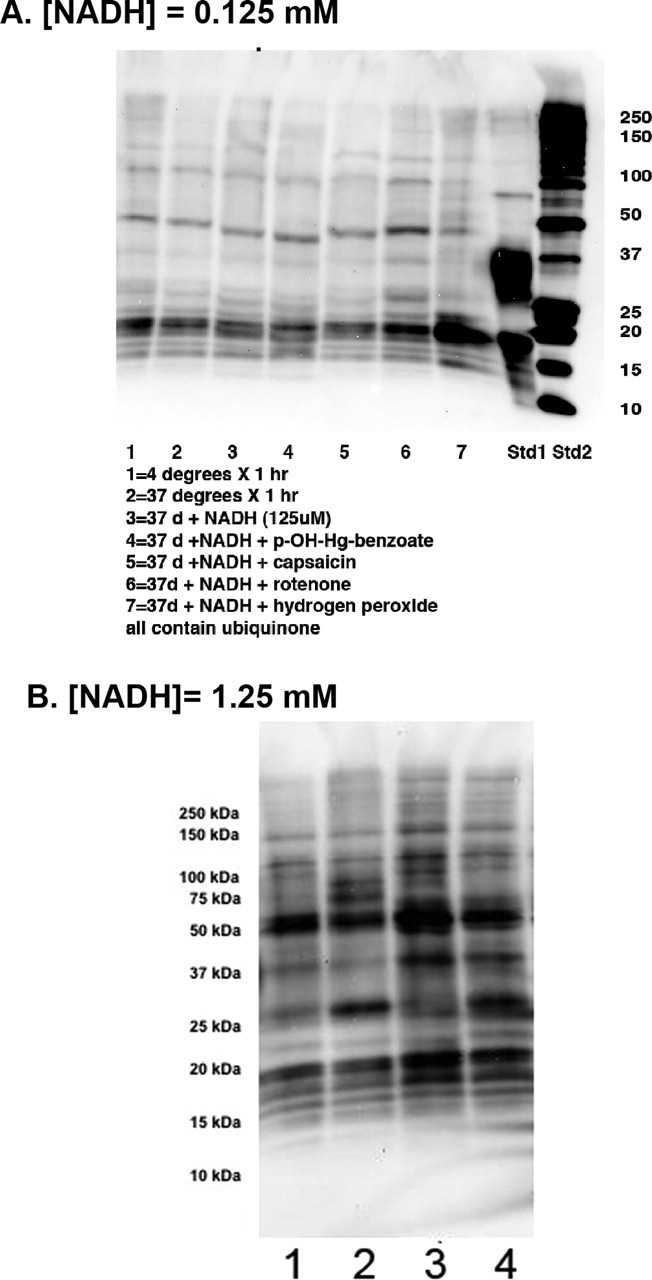
NADH plus rotenone increases oxidative damage to complex I subunits. Mitochondria from a CTL frontal cortex samples were incubated for 75 min with constituents added as indicated, washed, and then complex I was immunocaptured and analyzed for protein carbonyls as described in Materials and Methods. A, With [NADH] = 125 μm, rotenone (10 μm) appears to increase DNPH reactivity in bands at 18, 21, 26, 37, 50, and 94 kDa. Hydrogen peroxide only increased DNPH reactivity in the ∼20 kDa band. B, In two other CTL brain mitochondrial fractions incubated with a 10-fold higher [NADH] of 1.25 mm (lanes 1 and 3), the increased DNPH density of the ∼50 kDa band from immunocaptured complex I is not further increased with rotenone (10 μm, lanes 2 and 4), but that of the ∼26 kDa band is clearly increased by rotenone. Lanes 1 and 3 are derived from separate CTL brain mitochondrial preparations incubated with 1.25 mm NADH. Lanes 2 and 4 are derived from the CTL mitochondrial preparations used to generate lanes 1 and 3, but after addition of 10 μm rotenone.
Reduced levels of 8 kDa complex I subunit correlate with complex I oxidative damage and NADH-driven AmplexRed oxidation rates in PD brain mitochondria
We then explored the relationships among the levels of 8 kDa subunits and oxidative damage to complex I, and NADH AmplexRed oxidation rates in the PD and CTL frontal cortex mitochondrial samples. As shown in Figure 7, the distribution of levels of 8 kDa complex I subunit was restricted in the CTL samples and nearly completely separate from that of the PD samples. In addition, the levels of 8 kDa complex I subunit positively correlated with rates of NADH-driven AmplexRed oxidation and negatively correlated with levels of oxidative damage to immunocaptured complex I in the PD brain mitochondria (Fig. 7).
Figure 7.

Correlations between levels of 8 kDa complex I subunit and NADH-driven AmplexRed oxidation rates (left) and protein carbonyl levels in complex I (right) in PD (square) and CTL (round) brain mitochondria. R values for linear regression fitting and p values for the regression fit are shown.
Discussion
In this study, we have used mitochondrial preparations from PD and CTL frontal cortex samples matched for age at death and postmortem intervals to examine complex I protein composition, electron transfer function, and oxidation state. We find evidence that, in PD brain, complex I has approximately half again as much oxidative damage as in CTL, reflected in increased protein carbonyl content, and that this increased oxidation is localized to several bands that contain catalytic subunits encoded by both nuclear and mitochondrial genomes. It is important to note that our data do not define exactly which complex I catalytic subunits have oxidative damage. That will require a detailed proteomic analysis of each subunit to identify oxidatively modified amino acids. Rather, our limited analysis provides a list of complex I subunits potentially damaged by ROS, and it was of interest that all of the complex I subunits we identified in the bands containing increased protein carbonyls belong to the minimum essential ensemble, a group of 14 hydrophobic proteins believed to form the catalytic core of complex I. In addition, we did not immunocapture other ETC complexes, so we do not yet know whether the pattern of increased protein carbonyl content observed by us in PD complex I is restricted to complex I.
The pattern of subunit band oxidation of complex I in PD brain, particularly that involving the ∼26 and ∼50 kDa subunits, was not reproduced by exposure of mitochondria to exogenous oxidant (hydrogen peroxide) but could be reproduced by using NADH to drive electrons through complex I and blocking with rotenone the transfer of electrons from Fe-S cluster N-2 to oxidized quinone, but not by blocking electron transfer at other points within complex I. This suggests that the complex I oxidation pattern we observed in PD brain arises from ROS production internally, not from oxidant produced outside of complex I.
Complex I is felt to be the major source of superoxide production in the electron transport chain (Kudin et al., 2004; Lambert and Brand, 2004), and superoxide formed from NADH incubated with purified bovine NADH dehydrogenase has been shown to oxidatively modify the 51 kDa subunit at the FMN binding site, leading to reduced rates of electron transport (Chen et al., 2005). We have not yet identified the specific residues in the ∼50 kDa subunits that are oxidatively damaged in PD brain mitochondrial complex I, but our preliminary results suggest that a similar process may be occurring and that a more detailed mass spectrometric analysis of protein oxidation would be of value.
The level of oxidative damage to immunocaptured complex I inversely correlated with the rate of NADH-driven electron transfer through complex I, demonstrating a functional correlate of the oxidative damage that appeared to occur to catalytic subunits. Although our results do not define the sequence of events relating oxidative damage to complex I and impairment of its internal electron transfer function, a plausible explanation is that impairment of the function of the catalytic core initiates internal ROS production, leading to oxidative damage and more impairment of the catalytic core, in a feedforward paradigm. If correct, this paradigm requires understanding the origin of the initial catalytic impairment. If similar findings of oxidative damage to complex I are present in PD cybrid cells, then an mtDNA-based inheritance is likely and could involve defective ND4 or ND5 subunits, which we identified as potential candidates for oxidative damage. In that regard, clustered mutations in the N-terminal region of ND5 were shown to predict prospectively the identity of brain samples as coming from PD patients (Parker and Parks, 2005).
We also observed a significant loss of the 8 kDa subunit of complex I in PD brain mitochondria to the extent that the PD and CTL populations were nearly completely separable and had overlap with only one PD sample. Whereas the levels of 8 kDa subunit in the CTL brain mitochondria clustered together tightly, those in the PD population had greater variability and correlated positively with the rates of NADH-driven AmplexRed oxidation and negatively with the levels of complex I subunit oxidation. In a study of fibroblast mitochondria from individuals with complex I deficits mostly on the basis of mutations in nuclear complex I genes, the levels of the 8 kDa subunit were reduced the most (Triepels et al., 2001), implying that it is among the most sensitive markers for complex I misassembly. It is of interest to determine whether a similar pattern of loss of 8 kDa complex I subunits is demonstrable in accessible peripheral tissues of PD patients (e.g., platelets, white blood cells), and if so, whether this finding is specific to PD compared with other adult neurodegenerative conditions and at what point in the evolution of PD the reduction of 8 kDa subunits becomes apparent.
In conclusion, we present the most detailed analysis of complex I composition and function in PD brain reported to date. Our requirements for aliquots of grams of tissue to perform mitochondrial isolations in the quantities needed for all our assays precluded the use of substantia nigra samples, and our findings indicate that PD is a brainwide mitochondrial disease in which complex I dysfunction is likely to play a significant pathogenic role. The origins of the increased complex I protein oxidation in PD brain remain to be determined, particularly as to whether it derives primarily from genetic mutations in nuclear or mitochondrial complex I genes or environmental rotenone-like toxins, or some combination. Also, it is not clear what the “genesis” event is in bringing about these complex I alterations. Based on the multitude of abnormalities produced by expression of PD mtDNA in cybrids (Swerdlow et al., 1996; Gu et al., 1998; Trimmer et al., 2004; Onyango et al., 2005a,b), it is tempting to speculate that mutations in catalytic mitochondrial complex I genes are driving the ROS production, oxidative damage, and complex I misassembly we observe in brain samples after years of clinical symptoms. Whether such events also take place in PD substantia nigra, and at what rate relative to other brain regions, is also an important future question to address.
Footnotes
This work was supported by National Institute of Health Grant NS39788 Morris Udall Parkinson's Disease Research Center of Excellence. We thank Dr. Nick Sherman for assistance with mass spectrometry protein analysis.
References
- Antonicka H, Ogilvie I, Taivassalo T, Anitori RP, Haller RG, Vissing J, Kennaway NG, Shoubridge EA (2003). Identification and characterization of a common set of complex I assembly intermediates in mitochondria from patients with complex I deficiency. J Biol Chem 278:43081–43088. [DOI] [PubMed] [Google Scholar]
- Chen YR, Chen CL, Zhang L, Green-Church KB, Zweier JL (2005). Superoxide generation from mitochondrial NADH dehydrogenase induces self-inactivation with specific protein radical formation. J Biol Chem 280:37339–37348. [DOI] [PubMed] [Google Scholar]
- Genova ML, Pich MM, Bernacchia A, Bianchi C, Biondi A, Bovina C, Falasca AI, Formiggini G, Castelli GP, Lenaz G (2004). The mitochondrial production of reactive oxygen species in relation to aging and pathology. Ann NY Acad Sci 1011:86–100. [DOI] [PubMed] [Google Scholar]
- Greenamyre JT, Betarbet R, Sherer TB (2003). The rotenone model of Parkinson's disease: genes, environment and mitochondria. Parkinsonism Relat Disord 9:[Suppl 2], S59–S64. [DOI] [PubMed] [Google Scholar]
- Gu M, Cooper JM, Taanman JW, Schapira AH (1998). Mitochondrial DNA transmission of the mitochondrial defect in Parkinson's disease. Ann Neurol 44:177–186. [DOI] [PubMed] [Google Scholar]
- Kudin AP, Bimpong-Buta NY, Vielhaber S, Elger CE, Kunz WS (2004). Characterization of superoxide-producing sites in isolated brain mitochondria. J Biol Chem 279:4127–4135. [DOI] [PubMed] [Google Scholar]
- Lai JC, Clark JB (1978). Isocitrate dehydrogenase and malate dehydrogenase in synaptic and non-synaptic rat brain mitochondria: a comparison of their kinetic constants. Biochem Soc Trans 6:993–995. [DOI] [PubMed] [Google Scholar]
- Lambert AJ, Brand MD (2004). Inhibitors of the quinone-binding site allow rapid superoxide production from mitochondrial NADH:ubiquinone oxidoreductase (complex I). J Biol Chem 279:39414–39420. [DOI] [PubMed] [Google Scholar]
- Murray J, Zhang B, Taylor SW, Oglesbee D, Fahy E, Marusich MF, Ghosh SS, Capaldi RA (2003). The subunit composition of the human NADH dehydrogenase obtained by rapid one-step immunopurification. J Biol Chem 278:13619–13622. [DOI] [PubMed] [Google Scholar]
- Onyango IG, Tuttle JB, Bennett JP Jr (2005a). Activation of p38 and N-acetylcysteine-sensitive c-Jun NH2-terminal kinase signaling cascades is required for induction of apoptosis in Parkinson's disease cybrids. Mol Cell Neurosci 28:452–461. [DOI] [PubMed] [Google Scholar]
- Onyango IG, Tuttle JB, Bennett JP Jr (2005b). Brain-derived growth factor and glial cell line-derived growth factor use distinct intracellular signaling pathways to protect PD cybrids from H2O2-induced neuronal death. Neurobiol Dis 20:141–154. [DOI] [PubMed] [Google Scholar]
- Panov A, Dikalov S, Shalbuyeva N, Taylor G, Sherer T, Greenamyre JT (2005). Rotenone model of Parkinson disease: multiple brain mitochondria dysfunctions after short term systemic rotenone intoxication. J Biol Chem 280:42026–42035. [DOI] [PubMed] [Google Scholar]
- Parker WD Jr, Parks JK (2005). Mitochondrial ND5 mutations in idiopathic Parkinson's disease. Biochem Biophys Res Commun 326:667–669. [DOI] [PubMed] [Google Scholar]
- Parker WD Jr, Swerdlow RH (1998). Mitochondrial dysfunction in idiopathic Parkinson disease. Am J Hum Genet 62:758–762. [DOI] [PMC free article] [PubMed] [Google Scholar]
- Przedborski S, Vila M (2003). The 1-methyl-4-phenyl-1,2,3,6-tetrahydro-pyridine mouse model: a tool to explore the pathogenesis of Parkinson's disease. Ann NY Acad Sci 991:189–198. [PubMed] [Google Scholar]
- Przedborski S, Tieu K, Perier C, Vila M (2004). MPTP as a mitochondrial neurotoxic model of Parkinson's disease. J Bioenerg Biomembr 36:375–379. [DOI] [PubMed] [Google Scholar]
- Shults CW (2004). Mitochondrial dysfunction and possible treatments in Parkinson's disease–a review. Mitochondrion 4:641–648. [DOI] [PubMed] [Google Scholar]
- Starkov AA, Fiskum G (2003). Regulation of brain mitochondrial H2O2 production by membrane potential and NAD(P)H redox state. J Neurochem 86:1101–1107. [DOI] [PubMed] [Google Scholar]
- Swerdlow RH, Parks JK, Miller SW, Tuttle JB, Trimmer PA, Sheehan JP, Bennett JP Jr, Davis RE, Parker WD Jr (1996). Origin and functional consequences of the complex I defect in Parkinson's disease. Ann Neurol 40:663–671. [DOI] [PubMed] [Google Scholar]
- Triepels RH, Hanson BJ, van den Heuvel LP, Sundell L, Marusich MF, Smeitink JA, Capaldi RA (2001). Human complex I defects can be resolved by monoclonal antibody analysis into distinct subunit assembly patterns. J Biol Chem 276:8892–8897. [DOI] [PubMed] [Google Scholar]
- Trimmer PA, Borland MK, Keeney PM, Bennett JP Jr, Parker WD Jr (2004). Parkinson's disease transgenic mitochondrial cybrids generate Lewy inclusion bodies. J Neurochem 88:800–812. [DOI] [PubMed] [Google Scholar]
- Ugalde C, Vogel R, Huijbens R, Van Den Heuvel B, Smeitink J, Nijtmans L (2004). Human mitochondrial complex I assembles through the combination of evolutionary conserved modules: a framework to interpret complex I deficiencies. Hum Mol Genet 13:2461–2472. [DOI] [PubMed] [Google Scholar]
- Ved R, Saha S, Westlund B, Perier C, Burnam L, Sluder A, Hoener M, Rodrigues CM, Alfonso A, Steer C, Liu L, Przedborski S, Wolozin B (2005). Similar patterns of mitochondrial vulnerability and rescue induced by genetic modification of {alpha}-synuclein, parkin, and DJ-1 in Caenorhabditis elegans. J Biol Chem 280:42655–42668. [DOI] [PMC free article] [PubMed] [Google Scholar]
- Vogel RO, Janssen RJ, Ugalde C, Grovenstein M, Huijbens RJ, Visch HJ, van den Heuvel LP, Willems PH, Zeviani M, Smeitink JA, Nijtmans LG (2005). Human mitochondrial complex I assembly is mediated by NDUFAF1. FEBS J 272:5317–5326. [DOI] [PubMed] [Google Scholar]