

Abstract
Neuronal Ca2+ signaling through inositol triphosphate receptors (IP3R) and ryanodine receptors (RyRs) must be tightly regulated to maintain cell viability, both acutely and over a lifetime. Exaggerated intracellular Ca2+ levels have been associated with expression of Alzheimer's disease (AD) mutations in young mice, but little is known of Ca2+ dysregulations during normal and pathological aging processes. Here, we used electrophysiological recordings with two-photon imaging to study Ca2+ signaling in nontransgenic (NonTg) and several AD mouse models (PS1KI, 3xTg-AD, and APPSweTauP301L) at young (6 week), adult (6 months), and old (18 months) ages. At all ages, the PS1KI and 3xTg-AD mice displayed exaggerated endoplasmic reticulum (ER) Ca2+ signals relative to NonTg mice. The PS1 mutation was the predominant “calciopathic” factor, because responses in 3xTg-AD mice were similar to PS1KI mice, and APPSweTauP301L mice were not different from controls. In addition, we uncovered powerful signaling interactions and differences between IP3R- and RyR-mediated Ca2+ components in NonTg and AD mice. In NonTg mice, RyR contributed modestly to IP3-evoked Ca2+, whereas the exaggerated signals in 3xTg-AD and PS1KI mice resulted primarily from enhanced RyR-Ca2+ release and were associated with increased RyR expression across all ages. Moreover, IP3-evoked membrane hyperpolarizations in AD mice were even greater than expected from exaggerated Ca2+ signals, suggesting increased coupling efficiency between cytosolic [Ca2+] and K+ channel regulation. We conclude that lifelong ER Ca2+ disruptions in AD are related to a modulation of RyR signaling associated with PS1 mutations and represent a discrete “calciumopathy,” not merely an acceleration of normal aging.
Keywords: Alzheimer, ryanodine receptor, calcium [Ca], cortex, imaging, inositol trisphosphate, age, presenilin, β-amyloid
Introduction
Neuronal Ca2+ signaling is tightly controlled to ensure proper functioning of numerous Ca2+-dependent processes (Berridge et al., 1998, 2000). Two major sources contribute to cytosolic Ca2+ signals: an extracellular pool entering through plasma membrane channels and an internal reservoir in the ER liberated through IP3R and RyR channels. The activation of IP3R and RyR channels is promoted by cytosolic Ca2+, resulting in a regenerative process of Ca2+-induced Ca2+ release (CICR), which enables interactions between these pathways (Finch et al., 1991; Friel and Tsien, 1992; Fagni et al., 2000).
Growing evidence implicates Ca2+ signaling disruptions in the etiology of neurological diseases (Mattson et al., 2000; LaFerla, 2002; Stutzmann, 2005). In particular, presenilin (PS) mutations associated with AD increase IP3R-evoked Ca2+ release in cell-based models (Guo et al., 1996; Leissring et al., 1999) and in cortical brain slices (Stutzmann et al., 2004). The latter studies used mutant PS1 knock-in mice, which despite their failure to develop the hallmark β-amyloid (Aβ) plaques and neurofibrillary tangles, nonetheless, have provided valuable insights into possible mechanisms underlying AD. The recent development of the 3xTg-AD mice [expressing mutant PS1, amyloid β protein precursor (APP), and tau], which develop both plaques and tangles in an age- and region-dependent manner (Oddo et al., 2003a,b), enable us to compare neuronal Ca2+ signaling in control, PS1KI, and 3xTg-AD mice at varying ages to determine the age progression and respective contributions of the different AD mutations. Our results indicate that the PS1 mutation is the predominant determinant underlying the exaggerated IP3-evoked Ca2+ signals at all ages.
Most studies of AD Ca2+ disruptions focused on responses evoked by elevating intracellular IP3, either directly via flash photolysis of caged IP3 (Leissring et al., 1999; Stutzmann et al., 2004) or indirectly by agonist application (Guo et al., 1996; Etcheberrigaray et al., 1998), and did not explicitly address the role of RyR. Nevertheless, there is evidence pointing to RyR involvement. RyR expression levels are increased in cultured neurons expressing mutant PS1 (Chan et al., 2000; Smith et al., 2005b), the RyR blocker dantrolene reverses elevated carbachol-induced Ca2+ release in human neuroblastoma SH-SY5Y cells expressing mutant PS1 (Popescu et al., 2004), and the RyR agonist caffeine evokes larger Ca2+ liberation in neurons cultured from AD mouse models (Smith et al., 2005b). Moreover, we observed elevated RyR levels throughout the lifetime of the PS1KI and 3xTg-AD mice, paralleling the pattern of enhanced IP3-evoked ER Ca2+ release.
We thus explored RyR function in both normal neuronal physiology and during Ca2+ signaling disruptions associated with AD. We show that RyR activation contributes modestly to Ca2+ signals in NonTg mice but accounts for most of the exaggerated ER Ca2+ signals in the PS1KI and 3xTg-AD mice at young and old ages. Moreover, in all groups, IP3-dependent membrane hyperpolarizations are regulated primarily through RyR, and the transgenic mice show hyperpolarizing responses even greater than expected from the enhanced Ca2+ signals.
Materials and Methods
Transgenic mice and slice preparation.
The derivation and characterization of the PS1KI and 3xTg-AD mice have been described previously (Guo et al., 1999; Oddo et al., 2003a). NonTg mice were of the same background strain (129/C57BL/6). These mice have been crossed only to other homozygous 129/B6 mice to minimize strain differences and are considered excitotoxic-resistant strains, thereby reducing confounding differences. Brain slices were prepared as described previously (Stutzmann et al., 2003), in adherence with protocols approved by the University of California Irvine Institutional Animal Care and Use Committee. Whole-cell patch-clamp recording was performed using an infrared/differential interference contrast setup. Slices were superfused with artificial CSF (in mm: 125 NaCl, 2.5 KCl, 1.25 NaH2PO4, 10 d-glucose, 25 NaHCO3, 2 CaCl2, 1.2 MgSO4, pH 7.3–7.4) bubbled with 95% O2/5% CO2 at room temperature (22–24°C). Patch pipettes (4–5 MΩ) were filled with intracellular solution containing the following (in mm): 135 K-methlysulfonate, 10 HEPES, 10 Na-phosphocreatine, 2 MgCl2, 4 NaATP, and 0.4 NaGTP, pH adjusted to 7.3–7.4 with 12 KOH, including 50 μm fura-2 and 10 μm caged IP3 (Invitrogen, Eugene, OR). Membrane potentials were recorded in current-clamp mode acquired at 1 kHz with an Axopatch 1C amplifier and analyzed using pClamp 8.1 (Molecular Devices, Union City, CA). Depolarizing current injections (0.1–0.2 nA) for 500 ms were used to evoke trains of five to seven action potentials.
Ca2+ imaging and flash photolysis.
Imaging was performed using a custom-made video-rate two-photon microscope, as described previously (Nguyen et al., 2001; Stutzmann et al., 2003; Stutzmann and Parker, 2005). In brief, excitation was provided by trains (80 MHz) of ∼100 fs pulses at 780 nm from a Ti:sapphire laser (Tsunami; Spectra-Physics, Mountain View, CA). The laser beam was scanned at 30 fps and focused through a 40× water-immersion objective (numerical aperture, 0.8). Emitted fluorescence light was detected by a wide-field photomultiplier to derive a video signal that was captured and analyzed by the MetaMorph package (Universal Imaging, Westchester, PA). Images and traces of fura-2 fluorescence are expressed as inverse pseudoratios so that increases in [Ca2+] correspond to increasing ratios. Photolysis of caged IP3 was accomplished by flashes of UV light (340–400 nm) derived from a 100 W Hg arc lamp coupled to an electronically controlled shutter (Uniblitz). The irradiance at the specimen was ∼50 mW/mm2, focused as a uniform circle (radius, ∼50 μm) centered on the imaging field. Stimulus strength was regulated by the flash duration. On the basis of previous calibration (Parker and Ivorra, 1992), a flash of 10 ms duration would photolyse ∼4% of the total caged IP3.
Immunoblot analysis.
Whole-brain homogenates were prepared from 4- to 6-week-old (NonTg), PS1M146V knock-in (PS1KI), and triple transgenic (3xTg-AD) mice. Detailed Western blot methodology has been described previously (Smith et al., 2005b). Protein extracts were monitored by quantitative immunoblotting. Three to four samples were analyzed for each group, and all samples were normalized to β-actin levels. Antibody sources and dilutions were as follows: anti-calsenilin, 1:100 (Zymed Laboratories, San Francisco, CA); anti-calbindin, 1:5000 (Chemicon, Temecula, CA); anti-IP3 against all receptor subtypes, 1:200 (Sigma, St. Louis, MO); anti-SERCA 2b, 1:45,000 and anti-RyR, 1:1000 (Affinity Bioreagents, Golden, CO). Secondary antibodies were obtained from Sigma (anti-rabbit, 1:20,000; anti-mouse, 1:50,000).
Data analysis.
Data are presented as mean ± 1 SEM, where n is the number of neurons examined. Student's t tests were performed as a measure of statistical significance when two different samples were compared, and a one-way ANOVA was used to compare the samples. Scheffé's post hoc analysis was subsequently performed on ANOVA results to determine significance.
Results
Two lines of transgenic mice expressing human AD-linked mutations (PS1KI and 3xTg-AD) (Guo et al., 1999; Oddo et al., 2003) and a nontransgenic control (NonTg) on the same background strain were used to examine the relationship between aging and AD mutations on neuronal Ca2+ signaling and the respective contributions of IP3R and RyR to the Ca2+ signals. Three age points were selected (6 weeks, 6 months ± 1 month, and 1.5 years ± 3 months) based, respectively, on previous studies of Ca2+ signaling (Stutzmann et al., 2003, 2004), the age of onset of early Aβ pathology, and extensive subsequent plaque and tangle deposition in the 3xTg-AD mice (Oddo et al., 2003). In addition, by backcrossing the 3xTg-AD mice to NonTg mice, it was possible to replace the mutant PS1 allele with the mouse wild-type version, essentially generating double transgenic mouse expressing mutant APP and tau (APPTau mice); these mice were evaluated in this study at the 6-week time point to assess the relative contribution of the PS1 mutation to the overall Ca2+ dysregulation. Lack of older mice precluded age-dependent comparisons.
Electrophysiology and imaging
Pyramidal neurons from the prefrontal cortex were chosen for this study based on their vulnerability in AD (Pearson et al., 1985) and importance for cognitive and memory functions (Goldman-Rakic, 1995). Passive membrane properties of membrane potential, input resistance, and number of cells for each age/transgenic group are listed in Table 1. No significant differences were observed in these variables between the transgenic animals or across different ages (p > 0.05).
Table 1.
Electrophysiological properties of cortical pyramidal neurons from control and transgenic mice at different ages
| RMP (mV) | Ri (MΩ) | |
|---|---|---|
| 6 weeks | ||
| NonTg (15) | 64.3 ± 0.9 | 182.6 ± 7.0 |
| PS1KI(6) | 66.5 ± 3.3 | 186.6 ± 27.6 |
| 3xTg-AD (9) | 66.4 ± 2.4 | 177.7 ± 19.5 |
| 2xTg (9) | 63.1 ± 2.0 | 197.6 ± 15.8 |
| 6 months | ||
| NonTg (17) | 66.8 ± 1.1 | 185.9 ± 13.2 |
| PS1KI(11) | 64.8 ± 1.0 | 217.3 ± 18.6 |
| 3xTg-AD (10) | 64.0 ± 1.1 | 200.0 ± 9.4 |
| 1.5 years | ||
| NonTg (11) | 70.3 ± 1.9 | 165.5 ± 8.1 |
| PS1KI(4) | 69 ± 1.5 | 193.3 ± 5.2 |
| 3xTg-AD (8) | 60 ± 1.8 | 200.0 ± 11.2 |
The number of neurons examined in each group is given in parentheses. RMP, Resting membrane potential; Ri, input resistance.
Neurons were loaded with caged IP3 and fura-2 by dialysis through the patch pipette, and flashes of UV light of varying durations were applied to photorelease IP3. The resulting liberation of Ca2+ from the ER was monitored by imaging fura-2 fluorescence in the soma (excluding the nucleus) and by measuring changes in membrane potential resulting from activation of Ca2+-dependent K+ channels (Sah, 1996; Stutzmann et al., 2003). In addition, depolarizing current pulses were applied to evoke action potentials and accompanying entry of Ca2+ through voltage-gated Ca2+ channels (VGCCs).
Patterns of IP3- and spike-evoked Ca2+ signals in NonTg, APPTau, PS1KI, and 3xTg-AD neurons
Ca2+ signals in representative neurons from 6-week-old NonTg, APPTau, PS1KI, and 3xTg-AD mice are illustrated in Figure 1, demonstrating some of the key similarities and differences among these groups. Compared with the NonTg controls (Fig. 1A) and the APPTau neurons (Fig. 1B), photoreleased IP3 consistently evoked larger responses in the PS1KI (Fig. 1C) and 3xTg-AD (Fig. 1D) neurons. In contrast, Ca2+ signals during action potential trains were similar across all three groups (Fig. 1E–H).
Figure 1.
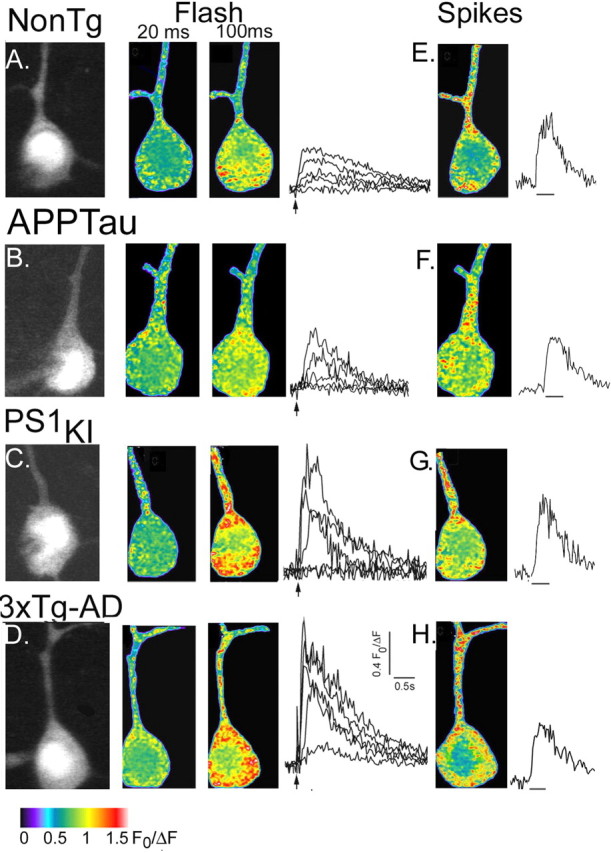
Imaging IP3- and spike-evoked Ca2+ signals in NonTg and Tg neurons. A, Fura-2 fluorescence in a neuron from a 6-week-old NonTg mouse. The left panel shows resting fluorescence (F0) levels. The middle panels show pseudocolored images of Ca2+ signals evoked after photolysis of caged IP3 (20 and 100 ms flash durations, as indicated). Each panel is an average of ∼10 sequential video frames around the time of maximal signal; different colors correspond to fluorescence ratio changes as indicated by the bar. Superimposed traces to the right show increasing somatic fluorescence ratio signals evoked by flashes of 10, 20, 30, 50, and 100 ms. Ca2+ signals were measured from the soma (excluding the nucleus). B–D, Corresponding Ca2+ images and traces obtained, respectively, in a representative 6-week-old APPTau neuron, a 6-week-old PS1KI neuron, and a 6-week-old 3xTg-AD neuron. E–H, Ca2+ images (average of 15 frames) captured during a train of action potentials and time courses of somatic Ca2+ signal during these action potential trains, from the corresponding neurons in A–D.
Effects of age and AD-linked mutations on IP3- and spike-evoked Ca2+ signals
We quantified measurements of somatic Ca2+ signals evoked by increasing amounts of photoreleased IP3 (linearly proportional to photolysis flash duration) in neurons from the different transgenic animals at different ages. For clarity, we present these data arranged in two ways: grouped according to age (Fig. 2A–D, left column) and according to transgene (Fig. 2E–H, right column). The graphs also include measurements of Ca2+ signals evoked in the soma by trains of action potential spikes.
Figure 2.
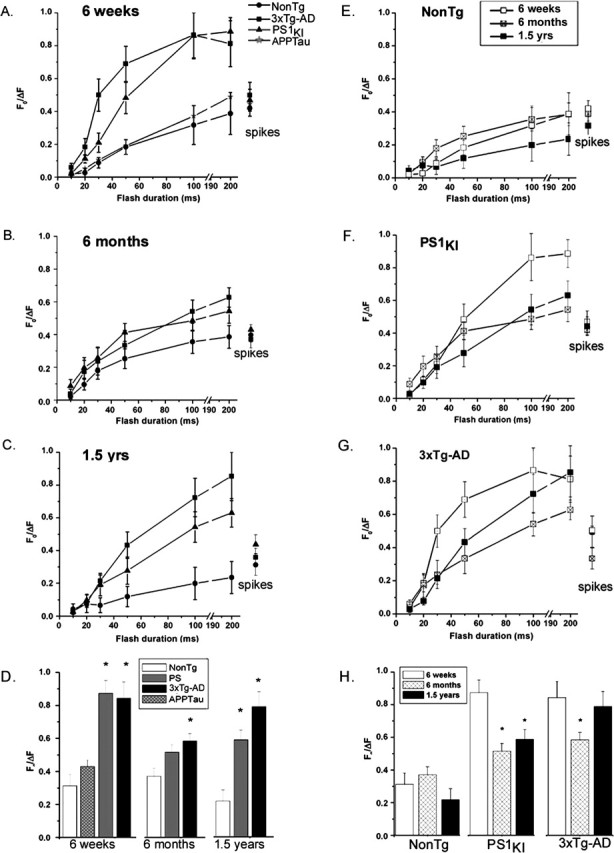
ER Ca2+ signaling remains elevated throughout the lifetime of PS1 mutant-expressing mice. Panels show identical data grouped by age (A–D) and by transgene (E–H). A, IP3-evoked Ca2+ signals in cortical neurons from NonTg (•), PS1KI (▴), 3xTg-AD (▪), and APPTau (★) mice at 6 weeks of age. Data points show mean fluorescence ratio changes evoked by photolysis flashes of increasing durations and (at right) signals evoked by trains of action potentials. B, Corresponding data from 6-month-old mice. C, Corresponding data from 1.5-year-old mice. D, Summary histograms, showing maximal IP3-evoked Ca2+ responses (pooled 100 and 200 ms flash data) for each of the transgenic groups at 6 weeks, 6 months, and 1.5 years of age. Asterisks indicate significant differences (*p < 0.05) from the NonTg controls within each age group. E–G, IP3- and spike-evoked Ca2+ signals grouped by transgene (respectively, in neurons from NonTg, PS1KI, and 3xTg-AD mice). In each panel, data points show mean responses from 6-week-old (□), 6-month-old (⊠), and 1.5-year-old (▪) mice. H, Summary histograms, showing maximal IP3-evoked Ca2+ responses (pooled 100 and 200 ms flash data) for each age within the different transgenic groups. Asterisks indicate significant differences (∗p < 0.05) from the response at 6 weeks within each transgenic group. Error bars represent SEM.
Considering first the results at different ages, the data from 6-week-old mice (Fig. 2A) confirm our previous findings (Stutzmann et al., 2004) in that the PS1KI neurons showed greatly (twofold to threefold) exaggerated IP3-evoked Ca2+ signals at all flash durations compared with NonTg controls. Most importantly, we now show that mean Ca2+ signals in the 3xTg-AD neurons were essentially indistinguishable from those in the PS1KI neurons, whereas signals in the APPTau neurons were no greater than in controls (Fig. 2D). At this young age, we thus conclude that the AD-linked mutation in the PS1 gene is the primary factor responsible for exaggerated ER Ca2+ signaling, and that mutant forms of APP and tau do not affect Ca2+ signals when coexpressed either with wild-type or mutant PS1.
Neurons from 6-month-old NonTg mice (Fig. 2B) showed no appreciable differences in IP3-evoked Ca2+ signals compared with 6-week-old NonTg mice. In contrast, signals in both the PS1KI and 3xTg-AD neurons were uniformly smaller than at 6 weeks, so that the exaggeration of Ca2+ signals by these mutants was appreciably diminished at this age. A significant difference remained, however, when comparing pooled maximal responses to 100 and 200 ms flash durations (Fig. 2D).
In the 1.5-year-old animals, the IP3-evoked Ca2+ signals in NonTg neurons were reduced (to ∼60%) versus the 6 week and 6 month age groups (Fig. 2C,D). Maximal signals in the PS1KI animals were also reduced ∼34% compared with the 6 week age group (Fig. 2C,D), although the 3xTg-AD neurons showed amplitudes that had recovered close to that in the 6 week group (Fig. 2C,D). Thus, expression of mutant PS1KI again resulted in a large exaggeration of Ca2+ signals in 1.5-year-old mice, although this effect was muted at 6 months.
Summarizing next the results from the perspective of differences among the transgenes (Fig. 2E–H), the principal finding is that IP3-evoked Ca2+ signals in PS1KI and 3xTg-AD neurons were exaggerated compared with NonTg controls across all ages examined, but this exaggeration was most marked in 6-week-old animals, reduced appreciably at 6 months, and recovered substantially at 1.5 years of age. To test for statistical significance for age- and transgene-related changes in IP3-evoked Ca2+ signals and possible interactions between these factors, we performed a two-way ANOVA on pooled responses evoked by strong (100 and 200 ms) photolysis flashes. There was no overall effect of age as a variable when the different transgenic groups were collapsed together (p > 0.05); however, there was a significant main effect of transgene (F(2,104) = 8.05; p < 0.05) with the PS1KI and 3xTg-AD mice having significantly larger Ca2+ signals than the NonTg mice. There was no significant interaction between age and transgene.
Ca2+ signals evoked by spike trains showed no appreciable differences across either transgenic group or age group (Fig. 2A–C,E–G). Thus, it appears that the age- and transgene-related changes in IP3-evoked Ca2+ signals are specific to ER Ca2+ signaling and do not reflect, for example, changes in cytosolic Ca2+ buffering or resting Ca2+ levels. In support of this, baseline Ca2+ fluorescence measurements were not different in older mice regardless of transgene expression (p > 0.05; data not shown).
Decay rates of the spike and IP3-evoked Ca2+ transients were also analyzed as a measure of Ca2+ resequestration and extrusion from the cytosol. The time constants of exponential fits to the data were not significantly different across age or transgene (p > 0.05; data not shown).
Effects of age and AD mutations on Ca2+-mediated membrane hyperpolarizations
Cytosolic Ca2+ signals play a major role in neuronal function by activating K+ channels that modulate membrane excitability (Sah, 1996). To explore age- and transgene-related changes in Ca2+-dependent K+ channel activation, we first measured the afterhyperpolarization (AHP) after trains of six to nine action potentials generated by a depolarizing current pulse (0.2 nA; 500 ms). The peak AHP occurred ∼200 ms after the termination of the pulse (Fig. 3A), approximately corresponding to the time course of the medium-IAHP resulting from Ca2+ entry through voltage-gated plasma membrane Ca2+ channels (Sah, 1996). Within each age group, the presence or absence of AD-related alleles had no significant effect on the AHP amplitude (Fig. 3B) (p > 0.05). However, as the mice aged, the AHP amplitude increased significantly (almost twofold from 6 weeks to 1.5 years) in both control and transgenic animals.
Figure 3.

Amplitude of the spike-evoked AHP in NonTG, PS1KI, and 3xTg-AD mice at different ages. A, Representative spike train and subsequent AHP. Resting potential was −62 mV; action potential peaks are clipped. The gray area indicates regions of traces shown in B. B, Representative AHPs recorded in 3xTg-AD neurons at 6 weeks, 6 months, and 1.5 years of age. C, Bar graphs plot mean AHP amplitudes in NonTg and AD-Tg mice at 6 weeks (right), 6 months (middle), and 1.5 years (left) of age. Numbers of cells in each group are indicated within parentheses. Asterisks indicate a significant increase in AHP amplitude relative to the 6 week measurement within each transgene group (NonTg, F(2,37) = 3.7, p < 0.05; PS1, F(2,29) = 3.3, p ≤ 0.05; 3xTg-AD, F(2,31) = 3.8, p < 0.05). Error bars represent SEM.
A different pattern emerged for membrane potential hyperpolarizations resulting from IP3-evoked Ca2+ release, comparing responses evoked in 3xTg-AD neurons at different ages (Fig. 4A–C). Across all age groups, PS1KI and 3xTg-AD transgenic mice had consistently larger IP3-evoked membrane hyperpolarizations compared with the NonTg controls. However, within each transgenic group, the amplitude of the IP3-evoked hyperpolarization changed little with age.
Figure 4.

Amplitude of the IP3-evoked hyperpolarization is increased by expression of PS1 mutation but does not increase with age. A, The inset shows a representative IP3-evoked hyperpolarization evoked by a 100 ms photolysis flash (arrows) in a neuron from a 6-week-old mouse. Resting potential was −62 mV in all groups. Bar graphs show mean IP3-evoked hyperpolarizations for each transgenic groups at 6 weeks. The asterisk indicates significant increases in IP3-evoked hyperpolarizations with respect to NonTg controls at this age (∗p < 0.05). B, C, Corresponding hyperpolarizing responses and mean data from 6-month-old and 1.5-year-old mice, respectively. Error bars represent SEM.
RyR expression is elevated in AD transgenic mice
Western blots were prepared to examine whether the enhanced ER-Ca2+ release in PS1KI and 3xTg-AD neurons may be attributed to increased expression levels of Ca2+ signaling-related proteins. We found no significant differences in IP3R, SERCA-2b, calsenilin, calbindin-D, or calreticulin levels between age-matched NonTg and AD-transgenic brains (p > 0.05; data not shown). However, RyR levels were significantly increased in the PS1KI and 3xTg-AD brains relative to NonTg controls at the 6 week group (Fig. 5A) and 1.5 year group (Fig. 5C); at 6 months, the differences were less pronounced, and at this age, only the 3xTg-AD brains showed significantly elevated RyR levels (Fig. 5B).
Figure 5.
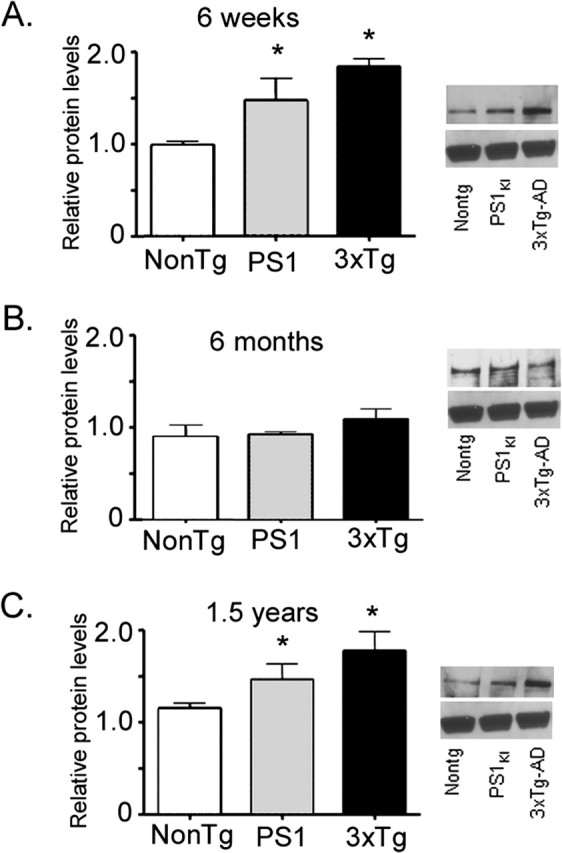
Expression levels of brain RyR protein at different ages and across transgenic groups. In each panel, histograms show mean (±1 SEM; n = 3 replicates) RyR immunoblot density relative to β-actin expression for NonTg (left), PS1KI (middle), and 3xTg-AD (right) brains. Asterisks mark significant (∗p < 0.05) differences from NonTg controls. Representative immunoblots of RyR protein (top) and representative β-actin levels (bottom) are shown at the right of each age tested. Data are shown from brains from 6-week-old (A), 6-month-old (B), and 1.5-year-old (C) mice.
Enhanced RyR-mediated Ca2+ release predominates in ER-Ca2+ dysregulation
We obtained an independent and direct measure of Ca2+ flux through RyR channels by bath applying the RyR agonist caffeine (20 mm). Ca2+ flux was assayed by measuring the maximal slope of sigmoidal curves fitted to the rising phase of the responses (Fig. 6A, left). The rate of rise of Ca2+ in the soma of both PS1KI and 3xTg-AD neurons was appreciably greater than in NonTg controls but was not significantly different between the two AD transgenic groups. After pooling data from these AD Tg groups (n = 9), the caffeine-evoked Ca2+ rise was 2.8 times faster than in NonTg controls (n = 10; p < 0.05) (Fig. 6A, right).
Figure 6.

Caffeine-evoked Ca2+ liberation through RyR is potentiated in PS1KI and 3xTg-AD neurons. A, Superimposed traces at the left show representative Ca2+ signals evoked in the soma of NonTg (gray) and 3xTg-AD (black) neurons by bath application of 20 mm caffeine. Rates of rise were measured from the maximal slope of sigmoid curves fitted to the data (dashed curves). The bar graph at the right plots mean rates of rise of caffeine-evoked fluorescent signals in the soma of NonTg (gray bar; n = 10) and Tg (black bar; n = 9) neurons. B, IP3-evoked Ca2+ signals are reduced by the RyR blocker dantrolene. Traces show Ca2+ responses evoked by a 50 ms flash in control conditions (black) and in the presence of bath-applied dantrolene (gray) in representative NonTg (left) and 3xTg-AD (right) neurons. C, Mean percentage reductions in amplitudes of IP3-evoked Ca2+ responses (50 ms flash duration) and spike-evoked Ca2+ signals resulting from application of dantrolene (10 μm) in NonTg (n = 6), PS1KI (n = 6), and 3xTg-AD (n = 7) neurons. D, Effect of dantrolene on the dose–response relationship of IP3-evoked Ca2+ signals. Points show measurements from NonTg neurons (n = 12; squares) and pooled measurements from 3xTg-AD and PS1KI neurons (Tg, n = 25; circles) before (filled symbols) and after (open symbols) applying dantrolene. Data at the right show respective spike-evoked Ca2+ signals. E, Filled symbols show mean amplitudes of IP3- and spike-evoked Ca2+ signals measured from pooled Tg neurons (n = 12) with ryanodine (30 μm) included in the pipette solution). For comparison, open symbols reproduce the measurements in C from Tg neurons exposed to dantrolene. Error bars represent SEM.
To ascertain the relative contribution of the RyR-mediated component to the total IP3-evoked Ca2+ signal (Fig. 6B,C), we compared somatic signals evoked by photoreleased IP3 before and after bath-applying 10 μm dantrolene to block RyR (Xu et al., 1998). In NonTg neurons, dantrolene caused a modest (20 ± 7%; n = 6) reduction in signals evoked by 50 ms flashes, and action potential-evoked Ca2+ signals were reduced by 15 ± 5%. In marked contrast, dantrolene substantially reduced the IP3-evoked Ca2+ responses in PS1KI neurons (by 59 ± 11%; n = 6; p < 0.01) and in 3xTg-AD neurons (by 71 ± 9%; n = 7; p < 0.01). However, similar to NonTg neurons, dantrolene produced only modest (15–20%) reductions of the spike-evoked Ca2+ signals.
The effects of dantrolene on the dose–response relationship for IP3-evoked Ca2+ signals are shown in Figure 6D. Responses in PS1KI and 3xTg-AD neurons were not significantly different from one another (p > 0.05), and we therefore combined these data (Tg) for analysis. Dantrolene strongly suppressed Ca2+ signals in the pooled Tg neurons (n = 19) across the full range of flash durations tested (Fig. 6D, circles), whereas the reduction in NonTg neurons (n = 6) was less pronounced (Fig. 6D, squares). Importantly, there were no significant differences (p > 0.05) between Tg and NonTg groups in the Ca2+ signals remaining in the presence of dantrolene, suggesting that Ca2+ flux through the IP3R channels themselves is not appreciably enhanced by the AD-linked mutations, but rather that larger responses in the Tg neurons arise principally from greater CICR through RyR. In contrast to the IP3-evoked Ca2+ signals, spike-evoked Ca2+ signals were reduced to a similar extent in both the NonTg and Tg neurons.
IP3-evoked membrane hyperpolarization is driven by Ca2+ liberation through RyR
IP3 evokes a membrane hyperpolarization in cortical neurons via activation of Ca2+-dependent K+ channels (Sah, 1996; Stutzmann et al., 2003), and this hyperpolarization is enhanced in PS1KI mice (Stutzmann et al., 2004). Here, we sought to determine whether the K+ channel regulation primarily involves Ca2+ liberated through the IP3R channels themselves or is consequent to CICR through RyR channels.
Representative membrane potential responses to photorelease of IP3 in NonTg and 3xTg-AD neurons are shown in Figure 7A and were appreciably smaller and of lower sensitivity in the NonTg cells. These differences did not arise through alterations in initial resting membrane potential (set to −60 mV by current injection) or input resistance (Table 1). Strikingly, all responses were substantially abolished by dantrolene (Fig. 7A, bottom traces), even in the 3xTg-AD neuron after a strong (100 ms) flash. Mean data for NonTg and Tg neurons in control and dantrolene conditions are plotted in Figure 7B (main graph). Hyperpolarizing responses in both NonTg and Tg neurons increased with increasing photorelease of IP3 but, for a given flash duration, the responses in Tg neurons were nearly three times as large (3.04-fold with 50 ms flashes, p < 0.01, and 2.7-fold with 100 ms flashes, p ≤ 0.01). After adding dantrolene, only small IP3-evoked hyperpolarizations remained with the strongest flashes and were not significantly different between NonTg and Tg neurons (p > 0.05). We were also able to replicate the effects of dantrolene by preincubating slices in ryanodine (30 μm) to block RyR (Fig. 7B, inset).
Figure 7.

IP3-evoked membrane hyperpolarizations are strongly suppressed by dantrolene. A, Traces show changes in membrane potential in representative neurons from NonTg (left) and 3xTg-AD mice (right) after photolysis flashes of 100 ms duration in control conditions (top) and after adding 10 μm dantrolene (bottom). B, Relationships between photolysis flash duration and magnitude of the IP3-evoked hyperpolarization. The main graph shows data from NonTg (n = 17; black squares) and Tg (n = 31; gray circles) neurons before (filled symbols) and during (open symbols) dantrolene application. The inset shows mean data comparing effects of ryanodine in Tg neurons (n = 16; closed circles) with dantrolene in Tg neurons (open squares; same data as in the main graph). C, IP3-mediated reduction in spiking frequency is suppressed by dantrolene. The top trace shows spikes evoked by periodic injections of depolarizing current. A photolysis flash (100 ms) was delivered at the arrow to photorelease IP3, resulting in a reduced spiking frequency for several seconds. The bottom trace was obtained using the same protocol in the same neuron while continually superfusing dantrolene (10 μm). Error bars represent SEM.
IP3-evoked changes in membrane conductance strongly regulate spiking patterns, and photorelease of IP3 caused a long-lasting reduction in the numbers of action potentials evoked by depolarizing current pulses (Fig. 7C, top trace). This modulation was abolished by dantrolene (Fig. 7C, bottom trace). Moreover, similar results were obtained using ryanodine (n = 8; data not shown). Dantrolene did not appear to affect other membrane properties (action potential threshold, spike amplitude, and afterhyperpolarization), suggesting that that the IP3 modulation of spike frequency specifically involves RyR.
AD-linked mutations affect the coupling between RyR and membrane K+ channels
The greater IP3-evoked membrane hyperpolarization seen in neurons expressing AD-linked mutations might arise directly as a consequence of the enhanced ER Ca2+ release. However, this appears not to be the sole mechanism, because scatter graphs plotting the relationship between IP3-evoked hyperpolarization amplitude (−ΔmV) and the accompanying IP3-evoked Ca2+ signals (F0/ΔF) revealed markedly different slopes between NonTg and Tg neurons for both soma (Fig. 8A) and dendrite (Fig. 8B). That is to say, a given cytosolic Ca2+ signal was associated with a larger membrane hyperpolarization in Tg neurons, suggesting that the AD-linked mutations modulate the “coupling efficiency” between cytosolic Ca2+ signals and activation of membrane K+ conductance, as well as enhancing the Ca2+ signals.
Figure 8.

The relationship between the IP3-evoked Ca2+ signal and membrane hyperpolarization is steeper in Tg than in NonTg neurons. A, Scatter plot showing the relationship between IP3-evoked Ca2+ signal in the soma and the magnitude of the accompanying membrane hyperpolarization in neurons from NonTg mice (n = 14; open symbols; gray line) and Tg mice (n = 23; closed symbols; black line). Points show means ±1 SEM obtained after binning over selected ranges of fluorescence amplitudes. B, Corresponding data for measurements in the proximal dendrites. C, Corresponding data in dantrolene (10 μm) obtained after pooling data from soma and dendrites. D, Dantrolene strongly reduces the slope of the relationship between IP3-evoked membrane hyperpolarization and Ca2+ fluorescence signal in Tg neurons but has negligible effect in NonTg neurons. Slope data were derived from the plots in A–C. E, Bar graphs show the amplitudes of IP3-evoked Ca2+ signals (left) and membrane hyperpolarizations (right) in Tg neurons as percentages of those in NonTg neurons (dashed line). Data are shown for PS1KI (gray) and 3xTg-AD neurons (black) before (solid bars; n = 55 and 81, respectively) and after (striped bars; n = 20 and 31) adding dantrolene.
To explore the mechanism underlying this effect, we constructed a similar scatter plot of hyperpolarization versus Ca2+ signal amplitude after adding dantrolene to block RyR (Fig. 8C). As noted above, both Ca2+ and membrane potential signals were strongly reduced, requiring pooled measurements from the soma and dendrite to obtain sufficient data points. Regression lines showed a slope for NonTg neurons that was not appreciably different from that in control conditions without dantrolene, whereas in Tg neurons, the slope was dramatically reduced as a result of blocking RyR. Our findings are further summarized in Figure 8, D and E. Key points are as follows: (1) the slope of the relationship between membrane hyperpolarization (−ΔV) and Ca2+ (F0/ΔF) was steeper (5.9) in Tg than in NonTg neurons (3.15); (2) the slope in Tg neurons was greatly reduced by dantrolene but was almost unchanged in NonTg neurons; (3) the amplitudes of IP3-evoked Ca2+ signals (measured from the soma, averaged across all flash durations) in Tg neurons were approximately double that in NonTg neurons, whereas membrane hyperpolarizations were more than three times larger; and (4) in the presence of dantrolene, there was no significant difference between Ca2+ signals in Tg and NonTg neurons (Fig. 8E, striped bars). Thus, RyRs are critically involved in mediating the hyperpolarizing response evoked by IP3. Moreover, AD-linked mutations appear to result in greater hyperpolarizing responses not only because they enhance the Ca2+ signals but also as a result of enhanced coupling efficiency between RyR and Ca2+-activated K+ conductance.
Discussion
Age-dependent changes in neuronal Ca2+ signaling
Long-term elevations of cytosolic [Ca2+] leave neurons vulnerable to metabolic stressors, consistent with the Ca2+ hypothesis of AD (Khachaturian, 1994; Toescu and Verkhratsky, 2003). We examined Ca2+ liberation from the ER and Ca2+ influx through voltage-gated channels, and in each case measured cytosolic Ca2+ transients and Ca2+-dependent membrane hyperpolarizations. In control (NonTg) mice, there were no significant changes in Ca2+ signals evoked by IP3 or action potentials at ages between 6 weeks and 1.5 years, and IP3-evoked membrane hyperpolarizations also showed no consistent change. However, the afterhyperpolarization following trains of action potentials nearly doubled with age. Given that membrane potential and input resistance were similar between groups (Table 1), this suggests an age-dependent increase in K+ channel activation underlying the increased AHP. It seems unlikely that the enhanced K+ current results from increased K+ channel density, because IP3-evoked hyperpolarizations did not increase with age. An alternative mechanism, as proposed in hippocampal neurons, is that the density of VGCCs coupled to K+ currents increases with age (Landfield and Pitler, 1984; Landfield, 1996; Thibault and Landfield, 1996). Although we did not find any concomitant increase in Ca2+ signals during action potentials in older mice, it remains possible that the fluorescence signals do not reflect the Ca2+ entry that activates the AHP; for example, the K+ channels may be located predominantly in the dendrites (Sah and Bekkers, 1996), whereas our measurements were confined to the soma.
Ca2+ signaling disruptions and AD-linked mutations
The results with PS1KI mice replicate our previous findings (Stutzmann et al., 2004) and further demonstrate that the potentiation of IP3-evoked Ca2+ signals associated with PS mutations persists throughout the lifespan of the animal. Most importantly, we now demonstrate that PS1 is solely involved in causing the observed exaggeration of IP3-evoked Ca2+ signals. The 3xTg-AD mice showed Ca2+ signals that were similar to the PS1KI mice, whereas mice expressing mutant APP and Tau displayed signals no greater than NonTg controls. Thus, it appears that the presence of APP and Tau mutations does not disrupt neuronal Ca2+ signals. Moreover, the appearance of overt AD histopathology, such as intracellular Aβ and tangle deposition between 6 and 18 months, failed to exacerbate the exaggeration of IP3-evoked Ca2+ signals.
The mechanisms by which PS1 mutations exaggerate ER Ca2+ signals remain unresolved (Smith et al., 2005a). In agreement with results from cultured embryonic neurons expressing PS1 mutations (Chan et al., 2000; Smith et al., 2005b), we demonstrate a selective increase in RyR expression in the PS1KI and 3xTg-AD neurons in the intact adult brain and further show this upregulation persists into old age. Notably, the increased RyR levels parallel the age-dependent pattern of Ca2+ signaling alterations. These findings also support our conclusion that the exaggeration of IP3-evoked Ca2+ signals arises in large part through increased Ca2+-induced Ca2+ release through RyR and not simply because of increased Ca2+ flux through the IP3R.
AD pathology may well involve alterations in Ca2+ homeostasis beyond those measured here. An important caveat is that our recordings at later ages were made from selected “healthy” neurons to facilitate whole-cell patching and may thus have excluded cells displaying more profound neuropathology.
Involvement of RyR in IP3-mediated signaling in neuronal physiology and pathophysiology
The functional roles of neuronal Ca2+ stores are becoming increasingly recognized and include modulation of membrane excitability (Davies et al., 1996; Stutzmann et al., 2003), synaptic activity and plasticity (Fujii et al., 2000; Nakamura et al., 2000), and gene transcription (Mellstrom and Naranjo, 2001). However, to gain a better understanding of intracellular Ca2+ signaling disruptions in neuropathology, we attempted to parse the IP3R and RyR components to identify interactions between these channels, as well as compartmentalize specific functions ascribed to each.
Here, we show that IP3-evoked Ca2+ release in neurons from NonTg mice arises primarily through IP3 receptors themselves, with a modest component added by RyR. The relative weights of these two components change dramatically in AD transgenic mice. Presenilin mutations are known to exaggerate ER Ca2+ signaling in many cell types, but this has implicitly been assumed to arise from increased flux through IP3R channels (Guo et al., 1996; Leissring et al., 2000; Stutzmann et al., 2004). Instead, our results demonstrate that Ca2+ flux through RyR accounts for the great majority of the exaggerated IP3-evoked Ca2+ response in AD transgenic mice. Consistent with this, neurons from AD transgenic mice showed larger Ca2+ signals in response to caffeine and enhanced expression of RyR levels. Interestingly, in the PS1KI and 3xTg-AD transgenic mice, the RyR component associated with VGCC activation was not different from the NonTg.
The RyR-mediated component of the intracellular Ca2+ signals almost certainly arises because CICR through RyR is triggered by, and amplifies, Ca2+ liberated through IP3R. Increased RyR expression provides a likely explanation for the exaggerated IP3-evoked Ca2+ signals. Moreover, CICR may be further enhanced by PS1 mutations to enhance Ca2+ filling of ER stores (Leissring et al., 2000; Mattson et al., 2000), because elevated lumenal [Ca2+] is known to increase the sensitivity of RyR to both cytosolic Ca2+ and caffeine (Shmigol et al., 1996; Koizumi et al., 1999). Although increased store filling might also be expected to result in greater Ca2+ flux through IP3R, as has been observed in Xenopus oocytes, which lack RyR (Leissring et al., 1999, 2001), our present results may be reconciled if Ca2+ stores are enhanced sufficiently to sensitize RyR, while causing only a modest increase in Ca2+ flux through IP3R. Questions remain, however, as to why the Ca2+ signals evoked by action potentials show relatively little RyR-mediated contribution and why there is no appreciable enhancement of these signals in the AD transgenic mouse models. Possibly, the voltage-gated Ca2+ channels in the plasma membrane are located more distantly from RyR than are the IP3R channels and are thus relatively ineffective in inducing CICR.
The mechanisms by which PS mutations result in RyR upregulation and exaggerated ER Ca2+ release are presently unclear. One explanation draws on evidence showing that the PS mutations result in altered γ-secretase activity, which is responsible for the proteolysis of APP (LaFerla, 2002). APP proteolysis generates several fragments, including the APP-intracellular domain fragment (AICD), which has been shown to regulate IP3-mediated Ca2+ signaling by possible transcriptional mechanisms (Cao and Sudhof, 2001; Leissring et al., 2002). Although the target proteins are not known, altered AICD transcriptional activity may influence expression or function of the RyR. This mechanism appears to require mutant PS, because the APPTau mice, which would be expected to express increased AICD levels, exhibit normal Ca2+ signaling at 6 weeks of age.
Electrical excitability is modulated by RyR
Previously, we found that hyperpolarizing responses to IP3 are enhanced in PS1KI neurons (Stutzmann et al., 2004), and we now show a similar exaggeration in 3xTg-AD neurons. We further demonstrate that in 3xTg-AD, PSKI, and NonTg mice, these membrane responses are mediated primarily by RyR rather than through IP3R. In particular, blocking RyR greatly reduced IP3-evoked hyperpolarizations in both NonTg and Tg neurons, resulting in almost identical membrane responses to a given flash duration.
The larger hyperpolarizing responses in the Tg neurons could simply be a direct consequence of the greater Ca2+ signal. However, this does not appear to be the sole explanation, because membrane responses accompanying Ca2+ signals of a given size were approximately twice as large in Tg versus NonTg neurons; in other words, the Tg neurons showed a greater “coupling efficiency” between cytosolic Ca2+ and activation of Ca2+-dependent K+ current. This may result if RyRs are closer to the Ca2+-dependent K+ channels than are the IP3R. On this basis, the disproportionate hyperpolarization in Tg neurons arises because most of their exaggerated Ca2+ signal arises through RyR; whereas after blocking RyR, both Tg and NonTg neurons show comparably small hyperpolarizations that are driven by the remaining IP3R-mediated Ca2+ liberation.
Conclusions
The age progression of various AD markers and related Ca2+-dependent functions is shown schematically in Figure 9. This highlights the persistent exaggeration of RyR expression levels, ER Ca2+ release, and IP3-evoked hyperpolarization in the PS1KI and 3xTg-AD mice as contrasted with the later appearance of plaques, tangles, and abrupt cognitive decline (as measured by spatial learning tasks) in the 3xTg-AD mice.
Figure 9.
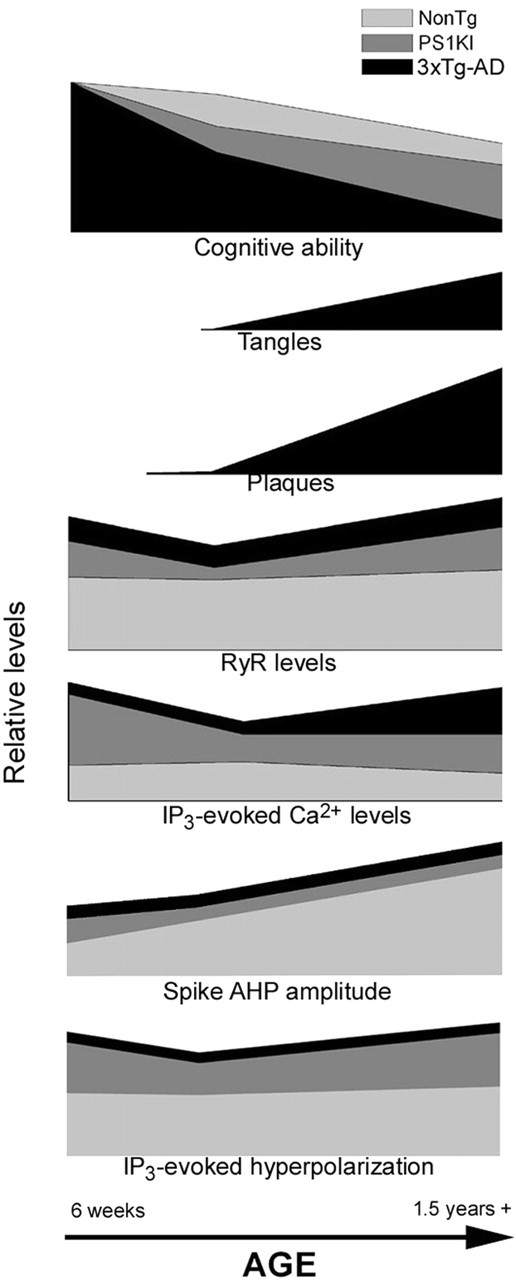
Schematic time line illustrating changes in AD-linked pathology during aging of NonTg, PS1KI, and 3xTg-AD mice. Data on cognitive abilities are from studies by Verbitsky et al. (2004), Billings et al. (2005), and Janus et al. (2000), and data on appearance of plaques and tangles are from the studies by Oddo et al. (2003a,b).
Our results reveal important new aspects of Ca2+ signaling disruptions associated with AD. Specifically, exaggeration of IP3-evoked neuronal Ca2+ signals is principally linked to mutations in PS and is largely independent of expression of Aβ plaques or neurofibrillar tangles; these exaggerated signals are manifest throughout life and do not represent an acceleration of a normal aging process and arise principally through enhanced Ca2+ flux through RyR, not IP3R. Although the familial AD-linked mutations account for a minority of total AD cases, the progression of neuronal pathology is thought to be the same as in sporadic AD, and therefore, understanding consequences of pathogenic cellular signaling can generate insight into mechanisms underlying AD pathology in all cases. Although additional studies are needed, these findings further strengthen the growing consensus that a calciumopathy may be partly responsible for neuronal degeneration in AD (LaFerla, 2002; Smith et al., 2005a).
Footnotes
This work was supported by National Institutes of Health Grant GM48071 and National Institute on Aging Grant AG16573. We thank Heather Rose for editorial comments and Judy Samattasribootr and Imithri De Silva for technical assistance and help in the preparation of this manuscript.
References
- Berridge M, Bootman M, Lipp P (1998). Calcium–a life and death signal. Nature 395:645–649. [DOI] [PubMed] [Google Scholar]
- Berridge M, Lipp P, Bootman M (2000). The versatility and universality of calcium signaling. Mol Cell Biology 1:11–21. [DOI] [PubMed] [Google Scholar]
- Billings LM, Oddo S, Green KN, McGaugh JL, LaFerla FM (2005). Intraneuronal Abeta causes the onset of early Alzheimer's disease-related cognitive deficits in transgenic mice. Neuron 45:675–688. [DOI] [PubMed] [Google Scholar]
- Cao X, Sudhof TC (2001). A transcriptively active complex of APP with Fe65 and histone acetyltransferase Tip60. Science 293:115–120. [DOI] [PubMed] [Google Scholar]
- Chan S, Mayne M, Holden C, Geiger J, Mattson M (2000). Presenilin-1 mutations increase levels of ryanodine receptors and calcium release in PC12 cells and cortical neurons. J Biol Chem 275:18195–18200. [DOI] [PubMed] [Google Scholar]
- Davies P, Ireland D, McLachlan E (1996). Sources of Ca2+ for different Ca2+-activated K+ conductances in neurones of the rat superior cervical ganglion. J Physiol (Lond) 495:353–366. [DOI] [PMC free article] [PubMed] [Google Scholar]
- Etcheberrigaray R, Hirashima N, Nee L, Prince J, Govoni S, Racchi M, Tanzi R, Alkon D (1998). Calcium responses in fibroblasts from asymptomatic members of Alzheimer's disease families. Neurobiol Dis 5:37–45. [DOI] [PubMed] [Google Scholar]
- Fagni L, Chavis P, Ango F, Bockaert J (2000). Complex interactions between mGluRs, intracellular Ca2+ stores and ion channels in neurons. Trends Neurosci 23:80–88. [DOI] [PubMed] [Google Scholar]
- Finch E, Turner T, Goldin S (1991). Calcium as a coagonist of inositol 1,4,5-triphosphate-induced calcium release. Science 252:443–446. [DOI] [PubMed] [Google Scholar]
- Friel DD, Tsien RW (1992). A caffeine- and ryanodine-sensitive Ca2+ store in bullfrog sympathetic neurones modulates effects of Ca2+ entry on [Ca2+]i J Physiol (Lond) 450:217–246. [DOI] [PMC free article] [PubMed] [Google Scholar]
- Fujii S, Matsumoto M, Igarashi K, Kato H, Mikoshiba K (2000). Synaptic plasticity in hippocampal CA1 neurons of mice lacking type 1 inositol-1,4,5-trisphosphate receptors. Learn Mem 7:312–320. [DOI] [PMC free article] [PubMed] [Google Scholar]
- Goldman-Rakic P (1995). Architecture of the prefrontal cortex and the central executive. Ann NY Acad Sci 769:71–83. [DOI] [PubMed] [Google Scholar]
- Guo Q, Furukawa K, Sopher B, Pham D, Xie J, Robinson N, Martin G, Mattson M (1996). Alzheimer's PS-1 mutation perturbs calcium homeostasis and sensitizes PC12 cells to death induced by amyloid beta-peptide. NeuroReport 8:379–383. [DOI] [PubMed] [Google Scholar]
- Guo Q, Fu W, Holtsberg FW, Steiner SM, Mattson MP (1999). Superoxide mediates the cell-death-enhancing action of presenilin-1 mutations. J Neurosci Res 56:457–470. [DOI] [PubMed] [Google Scholar]
- Janus C, D'Amelio S, Amitay O, Chishti MA, Strome R, Fraser P, Carlson GA, Roder JC, St George-Hyslop P, Westaway D (2000). Spatial learning in transgenic mice expressing human presenilin 1 (PS1) transgenes. Neurobiol Aging 21:541–549. [DOI] [PubMed] [Google Scholar]
- Khachaturian ZS (1994). Calcium hypothesis of Alzheimer's disease and brain aging. Ann NY Acad Sci 747:1–11. [DOI] [PubMed] [Google Scholar]
- Koizumi S, Lipp P, Berridge M, Bootman M (1999). Regulation of ryanodine receptor opening by lumenal Ca2+ underlies quantal Ca2+ release in PC12 cells. J Biol Chem 274:33327–33333. [DOI] [PubMed] [Google Scholar]
- LaFerla FM (2002). Calcium dyshomeostasis and intracellular signalling in Alzheimer's disease. Nat Rev Neurosci 3:862–872. [DOI] [PubMed] [Google Scholar]
- Landfield P (1996). Aging-related increase in hippocampal calcium channels. Life Sci 59:399–404. [DOI] [PubMed] [Google Scholar]
- Landfield P, Pitler T (1984). Prolonged Ca2+-dependent afterhyperpolarizations in hippocampal neurons of aged rats. Science 226:1089–1092. [DOI] [PubMed] [Google Scholar]
- Leissring M, Akbari Y, Fanger C, Cahalan M, Mattson M, LaFerla F (2000). Capacitative calcium entry deficits and elevated luminal calcium content in mutant presenilin-1 knockin mice. J Cell Biol 149:793–798. [DOI] [PMC free article] [PubMed] [Google Scholar]
- Leissring M, LaFerla F, Callamaras N, Parker I (2001). Subcellular mechanisms of presenilin-mediated enhancement of calcium signaling. Neurobiol Dis 8:469–478. [DOI] [PubMed] [Google Scholar]
- Leissring M, Murphy M, Mead T, Akbari Y, Sugarman M, Jannatipour M, Anliker B, Muller U, Saftig P, De Strooper B, Wolfe M, Golde T, LaFerla F (2002). A physiologic signaling role for the gamma-secretase-derived intracellular fragment of APP. Proc Natl Acad Sci USA 99:4697–4702. [DOI] [PMC free article] [PubMed] [Google Scholar]
- Leissring MA, Paul BA, Parker I, Cotman CW, LaFerla FM (1999). Alzheimer's presenilin-1 mutation potentiates inositol 1,4,5-trisphosphate-mediated calcium signaling in Xenopus oocytes. J Neurochem 72:1061–1068. [DOI] [PubMed] [Google Scholar]
- Mattson M, LaFerla F, Chan S, Leissring M, Shepel P, Geiger JD (2000). Calcium signaling in the ER: its role in neuronal plasticity and neurodegenerative disorders. Trends Neurosci 23:222–229. [DOI] [PubMed] [Google Scholar]
- Mellstrom B, Naranjo J (2001). Mechanisms for Ca2+-dependent transcription. Curr Opin Neurobiol 11:312–319. [DOI] [PubMed] [Google Scholar]
- Nakamura T, Nakamura K, Lasser-Ross N, Barbara JG, Sandler VM, Ross WN (2000). Inositol 1,4,5-triphosphate (IP3)-mediated Ca2+ release evoked by metabotropic agonists and backpropagating action potentials in hippocampal CA1 pyramidal neurons. J Neurosci 20:8365–8376. [DOI] [PMC free article] [PubMed] [Google Scholar]
- Nguyen Q, Callamaras N, Parker I (2001). Construction of a two-photon microscope for video-rate Ca2+ imaging. Cell Calcium 30:383–393. [DOI] [PubMed] [Google Scholar]
- Oddo S, Caccamo A, Shepherd JD, Murphy MP, Golde TE, Kayed R, Metherate R, Mattson MP, Akbari Y, LaFerla FM (2003a). Triple-transgenic model of Alzheimer's disease with plaques and tangles: intracellular Abeta and synaptic dysfunction. Neuron 39:409–421. [DOI] [PubMed] [Google Scholar]
- Oddo S, Caccamo A, Kitazawa M, Tseng BP, LaFerla FM (2003b). Amyloid deposition precedes tangle formation in a triple transgenic model of Alzheimer's disease. Neurobiol Aging 24:1063–1070. [DOI] [PubMed] [Google Scholar]
- Parker I, Ivorra I (1992). Characteristics of membrane currents evoked by photoreleased inositol trisphosphate in Xenopus oocytes. Am J Physiol 263:C154–C165. [DOI] [PubMed] [Google Scholar]
- Pearson R, Esiri M, Hiorns R, Wilcock G, Powell TP (1985). Anatomical correlates of the distribution of the pathological changes in the neocortex in Alzheimer's disease. Proc Natl Acad Sci USA 82:4531–4534. [DOI] [PMC free article] [PubMed] [Google Scholar]
- Popescu B, Cedazo-Minguez A, Benedikz E, Nishimura T, Winblad B, Ankarcrona M, Cowburn RF (2004). Gamma-secretase activity of presenilin 1 regulates acetylcholine muscarinic receptor-mediated signal transduction. J Biol Chem 279:6455–6464. [DOI] [PubMed] [Google Scholar]
- Sah P (1996). Ca2+-activated K+ currents in neurones: types, physiological roles and modulation. Trends Neurosci 19:150–154. [DOI] [PubMed] [Google Scholar]
- Sah P, Bekkers JM (1996). Apical dendritic location of slow afterhyperpolarization current in hippocampal pyramidal neurons: implications for the integration of long-term potentiation. J Neurosci 16:4537–4542. [DOI] [PMC free article] [PubMed] [Google Scholar]
- Shmigol A, Svichar N, Kostyuk P, Verkhratsky A (1996). Gradual caffeine-induced Ca2+ release in mouse dorsal root ganglion neurons is controlled by cytoplasmic and luminal Ca2+ Neuroscience 73:1061–1067. [DOI] [PubMed] [Google Scholar]
- Smith IF, Green KN, LaFerla FM (2005a). Calcium dysregulation in Alzheimer's disease: recent advances gained from genetically modified animals. Cell Calcium 38:427–437. [DOI] [PubMed] [Google Scholar]
- Smith IF, Hitt B, Green KN, Oddo S, LaFerla FM (2005b). Enhanced caffeine-induced Ca2+ release in the 3xTg-AD mouse model of Alzheimer's disease. J Neurochem 94:1711–1718. [DOI] [PubMed] [Google Scholar]
- Stutzmann G, LaFerla F, Parker I (2003). Ca2+ signaling in mouse cortical neurons studied by two-photon imaging and photoreleased inositol triphosphate. J Neurosci 23:758–765. [DOI] [PMC free article] [PubMed] [Google Scholar]
- Stutzmann G, Caccamo A, LaFerla F, Parker I (2004). Dysregulated IP3 signaling in cortical neurons of knock-in mice expressing an Alzheimer's-linked mutation in presenilin1 results in exaggerated Ca2+ signals and altered membrane excitability. J Neurosci 24:508–513. [DOI] [PMC free article] [PubMed] [Google Scholar]
- Stutzmann GE (2005). Calcium dysregulation, IP3, and Alzheimer's disease. Neuroscientist 11:110–115. [DOI] [PubMed] [Google Scholar]
- Stutzmann GE, Parker I (2005). Dynamic multi-photon imaging: a live view from cells to systems. Physiology 20:15–21. [DOI] [PubMed] [Google Scholar]
- Thibault O, Landfield P (1996). Increase in single L-type calcium channels in hippocampal neurons during aging. Science 272:1017–1020. [DOI] [PubMed] [Google Scholar]
- Toescu EC, Verkhratsky A (2003). Neuronal ageing from an intraneuronal perspective: roles of endoplasmic reticulum and mitochondria. Cell Calcium 34:311–323. [DOI] [PubMed] [Google Scholar]
- Verbitsky M, Yonan AL, Malleret G, Kandel ER, Gilliam TC, Pavlidis P (2004). Altered hippocampal transcript profile accompanies an age-related spatial memory deficit in mice. Learn Mem 11:253–260. [DOI] [PMC free article] [PubMed] [Google Scholar]
- Xu L, Tripathy A, Pasek D, Meissner G (1998). Potential for pharmacology of ryanodine receptor/calcium release channels. Ann NY Acad Sci 853:130–148. [DOI] [PubMed] [Google Scholar]