

Abstract
In the cerebral cortex of mammals, horizontal connections link cells up to several millimeters apart. In primary visual cortex (V1) of mammals with orientation maps, horizontal connections ramify in periodic patches across the cortical surface, connecting cells with similar orientation preferences. Rodents have orientation-selective cells but lack orientation maps, raising questions about relationships of horizontal connections to functional maps and receptive field properties. To address these questions, we studied anatomy of horizontal connections and characterized horizontal functional interactions in V1 of the gray squirrel, a highly visual rodent. Long-range intrinsic connections in squirrel V1 extended 1–2 mm but were not patchy or periodic. This result suggests that periodic and patchy connectivity is not a universal organizing principle of cortex, and the existence of patchy and periodic connectivity and functional maps may be linked. In multielectrode and intracellular recordings, we found evidence of unselective local interactions among cells, similar to pinwheel centers of carnivores. These data suggest that, in mammals with and without orientation maps, local connections link near neighbors without regard to orientation selectivity. In single-unit recordings, we found length-summing and end-stopped cells that were similar to those in other mammals. Length-summing cell surrounds were orientation selective, whereas surrounds of end-stopped cells were not. Receptive field response classes are quite similar across mammals, and therefore patchy and columnar connectivity may not be essential for these properties.
Keywords: orientation maps, visual cortex, squirrel, functional architecture, horizontal connections, retrograde labeling
Introduction
In mammalian neocortex, horizontal connections link neurons with their nearby neighbors and with neurons millimeters away. In many sensory and higher-level areas, horizontal connections are known to ramify in periodic, patchy columns across the cortical surface (Gilbert and Wiesel, 1983; Lund et al., 1993). These connections have been best studied in primary visual cortex (V1), in which cells respond to bars or edges at a particular orientation (Hubel and Wiesel, 1959). In many mammals such as primates, carnivores, and tree shrews, orientation-selective neurons are arranged spatially in smooth, repeating maps, and long-range horizontal connections link groups of cells with similar orientation preferences (Hubel et al., 1978; Gilbert and Wiesel, 1989; Malach et al., 1993; Bosking et al., 1997). In addition, cells make massive interconnections with their close neighbors, which typically have similar orientation preferences. Horizontal connections have been proposed to play a role in development of orientation maps (Callaway and Katz, 1990; Ruthazer and Stryker, 1996; Shouval et al., 2000), contribute to orientation selectivity and contrast invariance (Ben-Yishai et al., 1995; Somers et al., 1995), and mediate surround response modulation (Bolz and Gilbert, 1989; Hirsch and Gilbert, 1991; Chisum et al., 2003).
In rodent V1, spatial organization is quite different. Although individual cells show orientation selectivity with tuning widths similar to other mammals, there is no map of orientation selectivity, and adjacent neurons often show different orientation preferences (Tiao and Blakemore, 1976; Metín et al., 1988; Ohki et al., 2005; Van Hooser et al., 2005). The absence of orientation maps in rodents raises questions about fundamental principles of horizontal connectivity in cortex and its influence on functional properties. Do all mammals have patchy and periodic connectivity, or do patchy connections and functional maps go hand-in-hand? Previous work suggests that squirrels do have patchy connections (Kaas et al., 1989) despite lacking orientation maps. Are local connections orientation selective? In rodents, cells cannot simultaneously make connections with close neighbors and with cells having similar orientation preferences, so which rule applies? Finally, are functional properties such as length tuning, a form of horizontal integration, similar in mammals with and without maps?
To better understand principles of horizontal connections, we characterized anatomical connections, functional interactions, and spatial integration in V1 of the gray squirrel, a highly visual diurnal rodent with good acuity and V1 size comparable with ferret (Hall et al., 1971).
We found horizontal connections in squirrel extended 1–2 mm but were not periodic or patchy. In multielectrode and intracellular recordings, we did not find orientation-selective interactions between cells. Many cells exhibited length-summing or end-stopped responses like other mammals, and length-summing cell surrounds were orientation selective. All mammals may have long-range connections in V1, but periodic/patchy connectivity is not a universal organizing feature of cortex, and the existence of this connectivity and functional maps may be linked. V1 cells innervate local neighbors without regard to orientation selectivity, but some long-range connections may be orientation specific. Finally, functional classes such as length-summing or end-stopped cells are similar across mammals, so orientation maps, periodic/patchy connectivity, and locally orientation-selective connections cannot be critical for their computation.
Materials and Methods
Surgical preparation.
For anatomy experiments, squirrels (Sciurus carolinensis) were anesthetized with ketamine/xylazine/acepromazine (26 mg/ml ketamine, 1.4 mg/ml xylazine, 0.25 mg/ml acepromazine maleate; 1.8 ml/kg initial dose) that was supplemented with 0.1 ml intramuscular injections of 100 mg/ml ketamine. A 1.5 × 1.5 mm craniotomy was made over monocular V1, 3–5 mm lateral from the midline and between 6 and 12 mm posterior from bregma. The craniotomy location is several millimeters from the V2 border so we could be sure injections and labeled cells were in V1 without electrophysiology. We did not measure receptive field (RF) locations for our injections, but we would expect receptive fields at this location to be located 30–90° horizontally offset from the line of decussation (Hall et al., 1971). Dura was left intact. After tracer injections, the skin was sutured and the animal recovered on a heated blanket. For physiology, we used an anesthetized preparation that has been described previously (Van Hooser et al., 2003; Heimel et al., 2005). Squirrels were initially anesthetized with a mixture of ketamine and acepromazine maleate, maintained with isoflurane, and paralyzed with gallamine triethiodide. EEG and heart rate were monitored to ensure adequate anesthesia.
Anatomy.
Pipettes filled with 1–2 μl of red latex microspheres (LumaFluor, Naples, FL) were lowered into the brain, and 0.2–0.5 μl was pressure-injected using several pulses over a span of ∼3 min using a PicoSpritzer II (General Valve, Fairfield, NJ). Injections were restricted to layer 2/3 by injecting at depths of 400–650 μm or layers 2/3–5 by injecting at depths between 400 and 1400 μm. Up to two injections were made in each hemisphere, offset by at least 5 mm along the anterior/posterior axis. Pipettes remained in place 10 min after injecting. Consistent with previous reports in older animals (LumaFluor instructions), we found red microspheres superior to green microspheres for retrograde transport.
After 2–5 d survival, animals were anesthetized with ketamine/acepromazine and perfused with 0.9% saline, followed by 4% paraformaldehyde (PFA). The brain was removed and stored in 4% PFA overnight. A small area of cortex was dissected out and stored in 20% sucrose overnight, and 60 μm cryostat sections were cut (Van Hooser et al., 2003). For horizontal slices, tissue was flattened between glass slides while in sucrose. We analyzed horizontal sections between 120 and 480 μm deep, which we assumed corresponded to layer 2/3.
Some sections were counterstained with anti-neuronal-specific nuclear protein (NeuN) (Chemicon, Temecula, CA). Sections were collected in 0.1 m PBS, washed once in PBS, blocked with 1% normal goat serum, 3% of 30% H2O2, and 0.1% Triton X-100 in PBS, and agitated overnight with 1:2000 dilution of anti-NeuN in PBS. The next day, slices were washed twice in PBS and stained for 1 h in a 1:400 or 1:800 dilution of Alexa 488 goat anti-mouse (Invitrogen, Carlsbad, CA) in PBS. Slices were washed twice in PBS and mounted and coverslipped with Fluromount-G (Electron Microscopy Sciences, Ft. Washington, PA).
Sections were scanned at 10–20× on a confocal microscope (TCS SC2; Leica, Nussloch, Germany). MAX projections were combined using GraphicConverter (Lemke Software, Peine, Germany) into a montage. Cell locations were marked in NIH ImageJ. Z stacks were frequently consulted to resolve ambiguities about the presence or absence of a cell in the MAX image.
We computed cluster index (CI) and peak density following Ruthazer and Stryker (1996). Briefly, we drew a region of interest tightly around the data points to eliminate edge artifacts, and a 300–500 μm circle around each injection site was excluded. We then calculated the cluster index in a 1 mm2 window that was moved over the dataset in 0.1 mm steps. The cluster index was calculated by the following algorithm. We generated points xi randomly and computed the distance Wi between xi and its nearest neighbor in the dataset nxi. This distance was compared with the distance Di between nxi and its nearest neighbor in the dataset nnxi. The ratio sum(Wi2)/sum(Di2) will tend to 1 if the dataset consists of randomly scattered points because picking a random point xi would be statistically the same as picking a point in the dataset. However, the ratio will tend to infinity for highly clustered data because the distance between a random point and the nearest neighbor in the data would often be large, whereas the distance between nearest neighbors in the dataset would often be small. CI is defined as log (sum(Wi2)/sum(Di2)), and, for randomly generated datasets, this statistic is nearly Gaussian with mean 0 (Ruthazer and Stryker, 1996). At each window location, the CI was computed for 10 sets of randomly generated points that were the same size as the dataset, and the median value of CI over all window locations was taken to be the final CI value for the injection. Peak density was calculated by dividing space around the injection into 100 × 100 μm bins and computing density in each bin. Peak density was measured in circles from diameter 700–4000 μm in 100 μm steps.
For Fourier analysis, injections were rotated so the principle axis (from principle component analysis) was horizontal, and cells were approximated as Gaussian points (σ11 = σ22 = 14.14 μm). Cells near the injection site (300–500 μm) were excluded. We computed mean Fourier coefficients over lines parallel to the principle axis within 0.5 mm of the injection site. Excluding points around the injection site introduces periodicity, so injections were divided into halves and analyzed separately. Coefficients were normalized by dividing by DC (zero frequency coefficient).
Recording.
To record neurons simultaneously in cortex for cross-correlation analysis, we used two electrodes (10 MΩ; Frederick Haer Company, Bowdoinham, ME) on different manipulators, bundles of five to eight electrodes that had been glued together under a microscope (4–5 MΩ; Frederick Haer Company), or manufactured matrix electrodes (4–5 MΩ, eight electrodes, 3 × 3 configuration with one open channel; Frederick Haer Company) with spacings of 115 or 240 μm between adjacent channels. After inserting electrodes, warm agar (3% in saline) was applied to protect the brain. We advanced electrodes until single units were evident on two or more channels. Typically, two or three units could be isolated simultaneously using these bundles, although occasionally four or five units were recorded. Spikes were extracted using a multiple-window discriminator. We focused on layer 2/3 and advanced only 900 μm on each penetration.
For intracellular recordings, pipettes (tip size, ∼1.5 μm) were filled with either of two potassium gluconate-based internal solutions described previously (Chung et al., 2002; Maffei et al., 2004). Recordings were made using the blind patch technique (Ferster and Jagadeesh, 1992; Margrie et al., 2002). Our intention was to record cells in layers 2/3 and 4 so pipettes were only advanced until a depth of 1200 μm. We analyzed spike and potential responses separately, and spikes were cut out of the potential data by linearly interpolating between the values before and after each spike. Mean membrane resistance was 73 ± 12 MΩ and mean series resistance was 104 ± 9 MΩ, in good agreement with what is expected for adult animals (Margrie et al., 2002).
For extracellular single-unit recordings, we used high impedance electrodes (10 MΩ; Frederick Haer Company) that were coated in DiI (Invitrogen) to aid track identification (Snodderly and Gur, 1995; DiCarlo et al., 1996). At the end of each penetration, three electrolytic lesions (9 μA, 3 s, tip negative) were made along the tracks to permit laminar reconstruction. After the experiment, animals were deeply anesthetized with ketamine/acepromazine and transcardially perfused with 0.1 m PBS, followed by 4% paraformaldehyde. Coronal sections (50 μm) were prepared on a cryostat, and sections were Nissl stained to identify the cortical layers, as described previously (Heimel et al., 2005).
Experimental protocols.
Stimulation was provided by a Macintosh computer (Apple Computers, Cupertino, CA) running Matlab and the Psychophysics Toolbox (MathWorks, Natick, MA) (Brainard, 1997; Pelli, 1997). The frame rate was 120 Hz. All stimuli were drifting sinusoidal gratings.
For cross-correlation recordings, orientation preferences of the neurons were assessed with full screen gratings [0.2 cycles per degree (cpd), 4 Hz]. If two or more neurons showed selectivity [orientation modulation (OM) index >0.4], additional tuning curves were measured at spatial frequencies of 0.1 and 0.4 cpd and temporal frequencies of 2 and 8Hz. Neurons were then stimulated for 1–2 h by repeating the tuning curve measurements. One stimulus was shown at any one time. Spike shapes were monitored carefully to ensure good isolation.
Intracellular orientation tuning curves were measured at the optimal spatial and temporal frequency of the cell.
For examining RF integration, small gratings of optimal orientation (5° × 5° square) were shown at nine overlapping positions around the RF of the cell to identify the center. We then studied length summation and end inhibition by varying the length (orthogonal to the drift direction) of the gratings.
Measures of orientation selectivity.
To examine orientation-tuning widths, we fit mean responses with two Gaussians following Carandini and Ferster (2000):
where O is the drift direction, R0 is the nonselective response, Rp is the response to the preferred orientation Op, Rn is the response to the opposite drift direction, σ2 is the variance, and Ang(θ) represents angular values modulo 180. We fit the mean response (F0) and modulated response (F1) together and took σ  to be the half-width at half height (HWHH). For visualization of intracellular data in Figure 5A, we combined points measured with different angle steps by averaging neighboring data points to produce an estimated curve at angle offsets of [−90, −63.75, −26.25, 0, 26.25, 63.75, 90]°. The orientation modulation index was defined as OM = (Rp − Ro)/Rp, where Rp is the response to the preferred orientation, and Ro is the average response at orientations orthogonal to the preferred. The orientation selectivity (OS) index was defined as
where {θkcheck if accented character} are the angles of orientations that were shown, and R(θk) is the response at each angle. Mean rates were used for spikes, and the mean response above resting potential was used for intracellular recordings.
Figure 5.

Examining interactions in pairs of simultaneously recorded squirrel V1 neurons. A, Example orientation tuning curves and distances between cells for two cell pairs. The covariogram is the difference between the raw measured correlation and the expected correlation for two cells with average firing rates equal to those measured for each pair, which is a measure of interaction compared with what one would expect for two independent neurons. The top two cells have similar orientation preferences, and their spiking activity shows little covariation. In contrast, the bottom two cells have different orientation preferences, and their spiking activity shows a strong interaction. The distribution of covariation strengths was highly skewed (B). Following Ts’o et al. (1986), covariograms were divided into four categories based on covariation strength, and representatives of each category are shown in C.
Correlation analysis.
There are many methods for evaluating cross-correlation strengths (Perkel et al., 1967; Palm et al., 1988; Aertsen et al., 1989; Brody, 1999). We were most interested in comparing our results with those of Ts’o et al. (1986) and followed them by computing cross-covariograms normalized to baseline correlation, computing strength values for these covariograms, and then ranking them. Finally, we divided the ranked covariograms into four groups (1–4) visually based on correlation strength. We computed time-lagged covariograms (Brody, 1999) in 1 ms bins over the interval [−50, 50] ms, averaging over both stimuli and trials. The cross-correlogram, or the amount of raw correlation between the spike trains, was defined to be
where S is the number of stimuli, Ts is the number of trials for each stimulus s, t0 is the beginning time of each trial and tend is the end, and Ri is the spike response for each cell. We subtracted the expected correlation for two independent cells with average responses equal to the measured cells:
where 〈 〉 represents averaging over trials. The covariogram is then Cv(τ) = C(τ) − E(τ). For baseline, we computed the mean value of the covariogram over the intervals [−50, −45] ms and [45, 50] ms. To ensure that sufficient numbers of spikes were recorded, we ignored pairs of cells with baselines <1.0 spike per bin. The strength index (SI) was defined as
where b is the baseline, and E(t) is the expected correlation.
Results
We used four techniques to study horizontal connectivity and interactions in squirrel V1. First, we examined connectivity of layer 2/3 with small injections of retrograde tracers to see whether horizontal connections are periodic and patchy in a mammal that lacks orientation maps. Second, we studied functional interactions in pairs of simultaneously recorded cells at various horizontal distances to look for evidence of interactions between cells that had similar orientation preferences, between cells that were close neighbors, or both. Third, we measured orientation tuning curves intracellularly to see whether subthreshold membrane potential tuning was relatively selective, which might imply that cells receive functional input primarily from cells with similar properties, or relatively broad, which might suggest functional input from cells with a variety of orientation preferences. Finally, we examined receptive field properties of single cells in response to gratings that would activate surrounding cortex to see whether length-tuning responses in squirrels were similar to those in mammals with orientation maps.
Anatomy of connections in layer 2/3
In many mammals, patchy and periodic horizontal connections in layer 2/3 link domains in the orientation map that have similar orientation preferences. In squirrel V1, a previous study that used large injections of anterograde and retrograde tracers to study inter-area connectivity did report patchy connections within V1 (Kaas et al., 1989). The recent discovery that squirrels do not have orientation maps, combined with the fact that, to our knowledge, there has not been any quantitative study of patchiness in rodent V1, prompted us to take a closer look at local connections of layer 2/3 cells using quantitative methods. To examine the extent of horizontal connections and the degree of clustering, we made small injections (spanning <500 μm) of latex microspheres in layer 2/3 or in layers 2/3–5 to label cells that projected to the injection site. Four injections in layer 2/3 and four injections in layers 2/3–5 were selected for analysis, and labeled cells were reconstructed in tangential sections taken from layer 2/3.
Figure 1 shows reconstructions of labeled cells from three different injections that were restricted to layer 2/3. Labeled cells are scattered diffusely up to 2 mm from each injection site. In some animals, we verified that retrograde tracer could be observed in distal structures such as in the lateral geniculate nucleus (Fig. 1, bottom) or in contralateral V1 to ensure that the transport distance of the latex microspheres was not a limiting factor of our assay. Peak cell densities are plotted as a function of distance from the injection site in Figure 2, bottom right. The number of labeled neurons falls rapidly after 1 mm and drops to nearly 0 at a distance of 2 mm. The higher cell counts for injections that spanned layers 2/3–5 compared with those that were restricted to layer 2/3 are likely attributable to the fact that a larger volume of tracer was used. The distribution of labeled neurons showed a slight anisotropy. The most distal cell along the principle axis was offset 1.81 mm on average, whereas the most distal cell along the orthogonal axis was on average offset 1.38 mm, a difference of 24%. The total span of horizontal connections in squirrel V1 is a bit narrower than the 2.5–3 mm connections that have been reported in the slightly smaller tree shrew (Bosking et al., 1997, 2000) and the 4 mm connections that have been observed in the comparably sized ferret (Ruthazer and Stryker, 1996).
Figure 1.
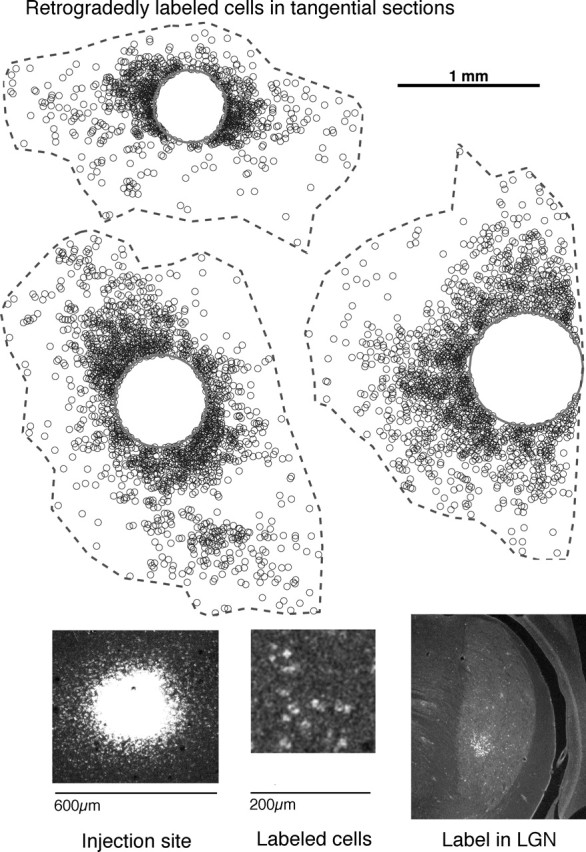
Example reconstructions of retrogradely labeled cells in layer 2/3. Top, Three example reconstructions of cells labeled with latex microspheres at ∼400 μm injection sites in layer 2/3. Sections were cut parallel to the surface of flattened cortex, and the sections above are from layer 2/3. Cells are labeled up to 2 mm away, but, unlike carnivores, primates, and tree shrews, no periodic and patchy organization is apparent. Boundary indicates region of interest for quantitative analysis. Bottom left and middle, Confocal images at 10× of injection site and labeled cells located ∼1 mm away. Bottom right, Retrogradely labeled cells in lateral geniculate nucleus (LGN) from a cortical injection that included layers 2/3–5. The label in lateral geniculate nucleus indicates that microspheres could be transported over long distances.
Figure 2.

No evidence of periodic and patchy connections in quantitative analysis of anatomical connections in layer 2/3 of squirrel V1. Left, Mean Fourier coefficients along the principle axis of labeled cells for squirrel injections restricted to layer 2/3 or injections in layers 2/3–5 (top) and the same analysis for a previously published tree shrew injection (Bosking et al., 2000) in layers 2/3–5 (bottom). The squirrel coefficients show a smooth roll-off with no evidence of periodicity, whereas the tree shrew data exhibits a clear peak between 1.5 and 1.9 cycles/mm that is consistent with the 550 μm hypercolumn size reported in that animal. Top right, Cluster analysis (Ruthazer and Stryker, 1996) for eight injections. Injections 1–4 were placed in layer 2/3, and injections 5–8 spanned layers 2/3–5. The mean cluster index was not different from 0, indicating that there was little patchiness of connections in layer 2/3. Bottom right, Peak cell density in layer 2/3 as a function of horizontal distance from the injection site. Peak cell density drops rapidly at a distance of 1 mm, and few connections are observed beyond 2 mm.
Horizontal connections linking orientation domains in animals with orientation maps are both periodic and patchy, so we quantified periodicity of labeled cells with Fourier analysis and quantified “patchiness” using the CI of Ruthazer and Stryker (1996). Fourier coefficients of injections that included only layer 2/3 or layers 2/3–5 are plotted in Figure 2, top left. The coefficients roll off from DC and show no evidence of periodicity. Figure 2, bottom left, shows the same analysis applied to a previously published injection in tree shrew (Bosking et al., 2000). A peak between 1.5 and 1.9 cycles/mm is evident, which is consistent with the 550 μm hypercolumn size reported in tree shrew (Humphrey and Norton, 1980; Bosking et al., 1997). The CI of Ruthazer and Stryker (1996) is positive when the data points exhibit more clustering than would be expected compared with an equal number of randomly distributed points (see Materials and Methods). The mean and SE CI for eight injections was 0.027 ± 0.064, and this value was not significantly different from 0 (p = 0.68). Thus, we did not find evidence of periodic and patchy connectivity similar to that found in tree shrews (Bosking et al., 2000), cats (Callaway and Katz, 1990), and ferrets (Ruthazer and Stryker, 1996).
In other examined mammals (Gilbert and Wiesel, 1983; Casagrande and Kaas, 1994; Mooser et al., 2004), horizontal connections are primarily made via cells in layers 2/3, 5, and 6. Given the lack of periodic, patchy connections in squirrel V1, it is reasonable to ask whether the laminar distribution of horizontal connections is similar to those of other mammals. We examined laminar inputs to layer 2/3 by making injections of red latex microspheres as above, cutting parasagittal slices, and labeling cell bodies in green with anti-NeuN to identify the cortical layers. Two reconstructions are shown in Figure 3A–C. Although there was input to layer 2/3 from all layers, only layer 2/3, layer 5, and lower layer 6b made substantial horizontal projections. Projections from layer 4, layer 6a, and upper layer 6b were primarily from the region immediately inferior to the injection site. Average cell counts and 95th percentiles of the distributions of horizontal offsets from the injection center are plotted in Figure 3D. The lack of horizontal connections in layer 4 is further revealed in Figure 3E, which shows inputs to an injection site in layer 4. The injection labeled many cells along the vertical axis, and few labeled cells were horizontally offset.
Figure 3.

Laminar distribution of inputs to layer 2/3 cells in squirrel V1. A, Confocal MAX images of labeled cells after an injection in L2/3 (left) and neurons stained with anti-NeuN (right). B, Reconstruction of labeled cells for injection in A. Solid line indicates injection site. Layer 2/3 receives horizontally offset input from layer 2/3, layer 5, and lower layer 6b. Input from layer 4, layer 6a, and upper layer 6b is primarily restricted to the area directly beneath the injection site. C, Same for another injection. D, Average number of labeled cells (left) and the 95th percentile of the distance of each cell from the horizontal center for each layer (right). Layers 2/3, 5, and 6b have the largest horizontal offsets, and layer 4 has the smallest. E, In contrast to layer 2/3, an injection in layer 4 shows mostly vertical input and little horizontal input.
Functional horizontal interactions between V1 cells
In primates, carnivores, and tree shrews, cells make massively recurrent connections with local neurons and distal cells in nearby iso-orientation domains (Gilbert and Wiesel, 1989; Malach et al., 1993; Weliky et al., 1995; Bosking et al., 1997). Because these animals have orientation maps, a majority of local connections (<300 μm) are thought to be among cells with similar orientation preferences (Fig. 4A). However, at map singularities called pinwheel centers, where neighboring neurons do not necessarily share similar orientation preferences, studies have shown that local (<300 μm) connections are not selective (Das and Gilbert, 1999; Schummers et al., 2002; Marino et al., 2005). It could be the case that connectivity at pinwheel centers is an exception to a general rule of local orientation-selective connectivity. Alternatively, neurons might unselectively target their near neighbors as a general rule. Under this second view, any local orientation-selective connectivity is merely a coincidence because of the structure of the orientation map. Squirrels do not have orientation maps and neighboring neurons have different orientation preferences, so local neurons cannot simultaneously contact neighboring cells and cells with similar orientation preferences (Fig. 4B). Therefore, an examination of local connection selectivity in squirrel might allow us to distinguish between these connectivity rules.
Figure 4.

Selected models of horizontal connectivity in mammalian visual cortex. A, Known connectivity in carnivores. Local connections are commonly orientation selective, and long-range connections ramify in patches corresponding to neighboring iso-orientation columns. B, Two possible models for local connectivity in rodents. In the orientation-selective model, cells primarily contact other cells with similar orientation preferences regardless of whether these cells are close neighbors. In the local/unselective model, cells generally contact close neighbors without regard to orientation selectivity. Although connectivity in mammals with orientation maps can be local and selective simultaneously, only one of these principles can dominate in mammals lacking maps.
Horizontal connectivity is reflected in horizontal interactions that have been assessed by measuring correlations in spiking activity in pairs of simultaneously recorded neurons in V1. One such study of 115 cell pairs recorded in cat by Ts’o et al. (1986) found that cell pairs often (75%) showed high correlations if the cells had similar orientation preferences, even if the cells were separated by >1 mm. In contrast, pairs that differed in orientation preference by >60° never showed high correlations. Here, we made similar measurements in squirrel V1 by recording 124 pairs of neurons simultaneously and computing time-lagged correlations between the spiking activities of the cells. We measured the orientation selectivity of each cell and recorded the horizontal distance between each pair. Figure 5A shows example orientation tuning curves and correlations for two pairs of cells. We restricted our search to layer 2/3 cells by only advancing to a depth of 900 μm to focus on cells with substantial horizontal connections.
Correlations between pairs of spike trains can give important information about interactions among cells (Perkel et al., 1967; Brody, 1999). We computed raw correlations between spike trains and subtracted correlations expected based on the average responses of the cells to each stimulus (Fig. 5A). The resulting function, called the cross-covariogram or just covariogram, is the correlation relative to that expected for two independent neurons. It is important to recognize that there are many ways two neurons can be dependent on one another (Brody, 1999), and only in some systems is it possible to unambiguously infer synaptic connectivity from a covariogram. If one cell makes a particularly strong monosynaptic connection onto the other, such as in connections from neurons in the lateral geniculate nucleus to layer IV in V1, a large, narrow peak with a time lag of 2–5 ms can be observed in the covariogram (Reid and Alonso, 1995). However, in this study, as in other studies of horizontal interactions such as that by Ts’o et al. (1986), the vast majority of covariogram peaks were broad (median half-width at half height, 7.5 ms), so it is likely that polysynaptic interactions, common input to the two cells, and monosynaptic connections all contribute to these covariograms. This ambiguity is not a problem in the present investigation, because our goal here was to compare gross horizontal interactions in squirrel visual cortex with the gross horizontal interactions that have been described previously in the cat. We followed Ts’o et al. (1986) and divided the covariograms into four categories (Fig. 5B,C) based on covariation strength.
We found little evidence of a relationship between orientation preferences and high covariation strength. Histograms of covariation strength as a function of pair difference in orientation preferences are shown in Figure 6A. Most correlations were weak, and cells that differed in orientation preference by less than 30° were no more likely to show strong covariation than cells that differed in orientation preference by more than 30° (χ2 test, p = 0.33). If we examine orientation preference differences only for cell pairs with covariation strengths in class 4, as in Figure 6C, it is apparent that even among strong covariations there is no relationship between orientation preference and covariation strength. The lack of a relationship between correlations and orientation preference is markedly different from findings in cat (Michalski et al., 1983; Ts’o et al., 1986).
Figure 6.

Relationships between covariation strength, orientation tuning, and distance for pairs of simultaneously recorded V1 neurons. A, Histograms of covariation strength as a function of differences in orientation preference between cell pairs. There is no strong relationship between orientation preference differences and covariation strength (p = 0.33). B, Histograms of covariation strength as a function of distance between cells. Cells closer than 300 μm were more likely to show strong covariations, and there were few strong covariations at longer distances (p < 0.05). C, Histogram of orientation differences for cell pairs with covariograms in the highest category. Even pairs with strong covariations do not indicate a relationship between covariation strength and orientation preference.
We did find a strong and significant relationship (χ2 test, p = 0.005) between pair distance and covariation strength (Fig. 6B). Cells closer than 300 μm were much more likely to show class 3 or class 4 covariation strength than cells separated by 300–600 μm and cells separated by more than 600 μm. This distance dependency is very similar to results reported in cat V1 by Das and Gilbert (1999), who examined correlations in pairs of neurons at relatively short distances (most separations <600 μm) but is different from Michalski et al. (1983), who specifically targeted cells in adjacent orientation columns separated by up to 1 mm and reported that 40% of such cell pairs showed significant interactions. The lack of high correlations at longer distances in squirrel is in good agreement with the anatomical data that shows a rapid drop-off in the number of connections with distance and a lack of patchy regions at long distances that might have shown strong functional interactions. The high degree of covariation observed across iso-orientation domains separated by long distances (>1 mm) in studies of carnivore V1 (Michalski et al., 1983; Ts’o et al., 1986; Chiu and Weliky, 2001) likely reflects the high degree of polysynaptic interaction within and among local iso-orientation domains, whereas an animal lacking patchy connectivity would not be expected to show strong covariation at long distances very frequently. For example, if one imagines that polysynaptic interactions two or three synapses away might be observable in these correlations, there are likely to be many paths between two cells separated by 1 mm in neighboring iso-orientation domains in cat, whereas in squirrel there are probably few such paths between cells separated by 1 mm. The distance dependence also suggests that our finding of a lack of a relationship between orientation preference and correlation strength in squirrel is most meaningful for relatively local connections (<300 μm), and these results say less about interactions among cells at longer distances. That is, it is clear that interactions among cells closer than 300 μm are unselective, but it is not clear whether interactions among cells separated by more than 300 μm are selective or unselective.
The relationships between covariation strength and orientation tuning and distance are shown in scatter plot form in supplemental Figure 1 (available at www.jneurosci.org as supplemental material).
Subthreshold orientation tuning in V1 neurons
Previous studies of membrane potential orientation tuning in cat V1 neurons found heterogeneity of tuning across the orientation map (Schummers et al., 2002; Monier et al., 2003). In regions where orientation preferences change smoothly (domains), membrane potential orientation tuning is relatively narrow, whereas near singularities in the map (pinwheel centers), membrane potential orientation tuning is less selective. Although the membrane potential is influenced by the total input to a cell, it has been suggested that the broad subthreshold selectivity near pinwheel centers may primarily reflect horizontal input from nearby cells with different orientation preferences because, for both domain and pinwheel center cells, the potential is well predicted by spatially integrating the surrounding orientation map (Schummers et al., 2002). In rodents such as squirrels, which lack orientation maps, nearby neurons often have different orientation preferences (Girman et al., 1999; Ohki et al., 2005; Van Hooser et al., 2005). Therefore, if a cell receives significant excitatory horizontal input from its local neighbors, membrane potential tuning curves might be relatively unselective, like those of cells near map singularities in the cat. Conversely, if cells primarily receive strong input from other cells that have similar orientation preferences, membrane potential tuning curves could resemble those in cat studies in which recordings were made without specific knowledge of the orientation map.
We recorded orientation tuning curves intracellularly in 20 squirrel V1 cells that showed maximum firing rates above 1 Hz and maximum mean or modulated voltage responses of at least 0.9 mV. Like many diurnal mammals such as macaques (Bullier and Henry, 1980) and tree shrews (Humphrey and Norton, 1980), the squirrel has a minority population of unoriented cells (Heimel et al., 2005), and, in some analyses, we examined only 16 cells that had some orientation bias (orientation modulation index for spikes >0.4).
We computed three measures of orientation selectivity. Tuning width, defined as half-width at half height, is a measure of the range of stimuli to which the cell responds particularly well, i.e., within a factor of two of its maximum rate. We used two other measures, the OM and OS indices, to quantify how much the cell fires to its preferred stimulus compared with how much it fires to orthogonal stimuli or all stimuli, respectively.
Most cells showed orientation-selective spiking output, but membrane potential responses were much less selective. Two example intracellular orientation tuning curves are plotted in Figure 7. The fairly typical simple cell on the left showed strong mean and modulated responses, and, for both of these components, spiking output was selective whereas the membrane potential still responded at approximately half its maximum value for orthogonal orientations. The complex cell on the right had strong mean responses and very weak modulated responses, and the mean membrane potential response was extremely unselective, responding at ∼80% of its maximum at orthogonal orientations. Figure 7A shows normalized mean firing rate and membrane potential tuning curves for 16 cells that showed an orientation bias. Although, on average, cells spiked at low rates for stimuli orthogonal to the preferred orientation, they showed membrane potential responses that were approximately half as large as the responses at the preferred orientation. These responses are very similar to those observed by Schummers et al. (2002) at pinwheel centers in cat V1.
Figure 7.
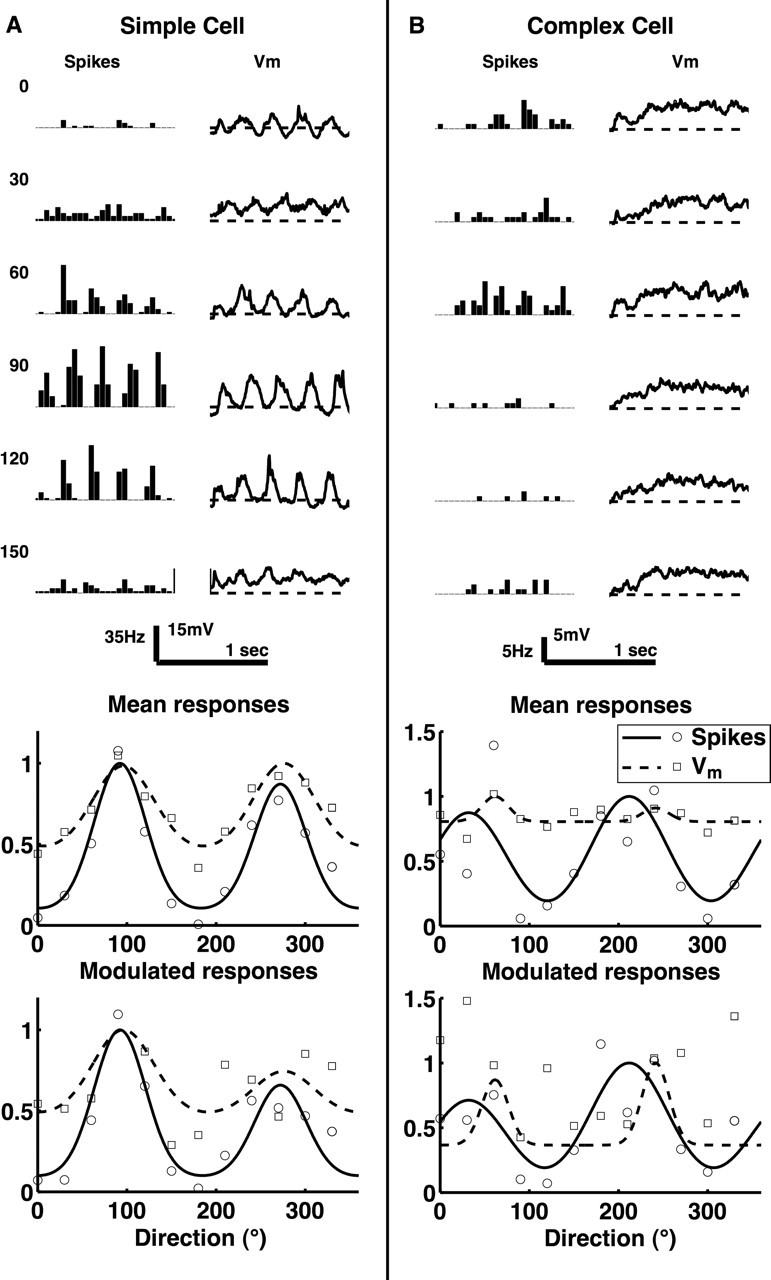
Example orientation responses measured intracellularly. A, Top, Mean spike and membrane potential responses to sinusoidal gratings drifting in directions shown. Bottom, Normalized fits and data points for mean responses and responses modulated at the stimulus frequency. This cell is representative of responses in squirrel V1 in that, although the spiking output is selective for stimulus orientation, the membrane potential response is rather unselective, being large even at orthogonal orientations. B, Same plots for a complex cell with particularly unselective membrane potential responses.
Measures of orientation selectivity are plotted in Figure 8B. Consistent with reports in cats (Carandini and Ferster, 2000; Schummers et al., 2002), OM and OS indices are slightly higher for firing rate output than for membrane potential, and tuning width is slightly wider for membrane potential than for spike output. The mean ± SEM for OM for firing rate and membrane potential were 0.79 ± 0.17 and 0.53 ± 0.21, respectively, and mean OS for firing rate and membrane potential were 0.35 ± 0.2 and 0.17 ± 12. The mean OM and OS for spiking activity are similar to values in cats reported by Schummers et al. (2002), which, combining cells at pinwheel centers and domains from their Figure 4, were 0.79 and 0.37, respectively. In addition, the mean OS index for the membrane potential was very similar to the value Schummers et al. (2002) reported for cat cells recorded at pinwheel centers (0.20), but OM in squirrel V1 neurons was slightly higher than the 0.33 reported at pinwheel centers.
Figure 8.

Squirrel V1 neurons showed narrow orientation selectivity in spike output but broad selectivity in membrane potential. A, Left, Mean normalized responses to oriented gratings for spike output. Right, Same for membrane potential. Response for membrane potential was mean change from rest. B, Left, middle, OM and OS indices of orientation selectivity for spike output and membrane potential. Right, Tuning width for spike output and membrane potential. Subthreshold responses in squirrel V1 cells resemble those of cat V1 cells located at pinwheel centers. OT, Cells with orientation bias (OM >0.4).
We ran into issues of sampling when calculating orientation-tuning widths. Our relatively coarse stimulation angle step of either 30 or 22.5° meant that we could not reliably identify tuning widths narrower than 17.7° (σ = 15°) or 13.28° (σ = 11.25°), so, following Carandini and Ferster (2000), we assigned a tuning width of 17.7 or 13.28° to any fit that had a tuning width lower than the minimum detectable value. Mean orientation-tuning widths for spike output and the membrane potential were 26 ± 17 and 33 ± 18°, respectively, which is very comparable with 23 and 38° reported by Carandini and Ferster (2000) in cat. It is perhaps not surprising that membrane potential tuning widths in squirrel are similar to cats because, in extracellular recordings, orientation-tuning widths do not vary widely across mammals (Heimel et al., 2005) and do not vary widely within the orientation map of cats (Maldonado et al., 1997; Schummers et al., 2002). Instead, the major difference between cat orientation domains and either cat pinwheel centers or squirrel cortex is in subthreshold tuning curve flanks (OM and OS).
Length-summing and end-stopped receptive fields in V1
In visual cortex of monkeys, cats, and tree shrews, stimuli located outside the classical receptive field can modulate responses to stimuli within the classical receptive field (Schiller et al., 1976; Gilbert, 1977; DeAngelis et al., 1994; Chisum et al., 2003). Some cells are inhibited by stimuli in the receptive field surround, whereas some other cells increase their firing as the length of the stimulus increases. This spatial integration might be quite different in a mammal like the squirrel that lacks orientation maps (Van Hooser et al., 2005) and patchy and periodic connectivity.
We measured responses to gratings of increasing length and observed two basic types of length-tuned responses. Many cells, such as the cell shown at the top of Figure 9A, behaved like end-stopped cells and showed a pronounced inhibition when the grating length became large. Others, such as the other examples in Figure 9A, showed no such inhibition and increased their firing for longer stimuli. Some of these cells continued to show increased firing for the longest gratings that we showed (middle example), whereas others reached a plateau and did not show additional increases in firing (bottom example). We quantified these differences by defining a cell to be “length summing” if the slope of a regression line fit across all stimulus lengths was significantly positive (p < 0.05) and by defining a cell to be “end stopped” if there was a high length cutoff at which the response dropped below half the maximum.
Figure 9.

Receptive field integration in squirrel V1 neurons. A, Examples of length tuning. Top cell was strongly inhibited as grating became longer. Middle cell fired more vigorously for longer gratings. Bottom cell showed increased firing for longer gratings and reached a plateau. B, Length summation across the cortical layers. Length summation was less common in layer 4. C, End-stopped behavior was most common in layer 2/3. D, Median optimal response lengths. Optimal lengths were shortest in layer 4. E, Orientation selectivity of receptive field surround. Left, Stimulus consisted of an 8° center grating of the preferred orientation of the cell at the center of a 21° grating with variable orientation. Right, Orientation tuning curves for 26 length-summing cells and nine end-stopped cells. Length-summing cells showed significant orientation selectivity with a preferred angle equal to that of the center, whereas end-stopped cells showed little orientation tuning.
Of 145 cells for which length tuning was tested, 42% were length summing and 16% were end stopped. Figure 9, B and C, shows length-summing and end-stopped cells across the cortical layers. Length summation was significantly less common in layer 4 (p < 0.05), whereas end-stopped cells were less common in layer 4 and most common in layer 2/3. The overall percentage of end-stopped cells is lower than has been reported in the cat, in which 24–35% of cells are end stopped if one applies our definition to data from Gilbert (1977) and DeAngelis et al. (1994). Similar to the cat, squirrel layer 2/3 cells have a higher percentage of end-stopped cells than other layers (Gilbert, 1977), but unlike the cat, layer 6 cells in squirrel sometimes exhibit end-stopped behavior. The percentage of end-stopped cells in squirrel is also lower than in macaque, in which 37% of cells are end stopped (Orban et al., 1986). The fraction of length-summing cells is much higher than in layer 2/3 of cat, in which length summation is primarily restricted to layer 6 (Gilbert, 1977). However, length summation in squirrel layer 2/3 is less common than in the tree shrew, in which all layer 2/3 cells tested showed length summation (Chisum et al., 2003).
Figure 9D shows median optimal response lengths across all layers. Cells in layer 4 had the shortest optimal lengths, whereas cells in the supragranular and infragranular layers had longer optimal lengths. Given the length responses observed, it is possible that horizontal connections in layers 2/3, 5, or 6b contribute to length summation in squirrel. The median optimal length of layer 2/3 cells was 13°, and, if one considers that the inverse magnification factor in squirrel V1 is of the order of 4–6°/mm (Hall et al., 1971; Van Hooser et al., 2005), then horizontal anatomical connections up to 2 mm are in the ballpark to mediate length summation.
Length-summing and end-stopped cells were found at all receptive field eccentricities tested. In addition, there were not dramatic differences in rates of occurrence across the visual field. In the central 30° of visual space, 39% of 109 cells were length summing, whereas in the periphery, 51% of 37 cells were length summing. In central vision, 13% of cells were end stopped, and, in the periphery, 24% of cells were end stopped.
In animals with orientation maps, length-summing cells and end-stopped cells show orientation selectivity in the surround that is similar to that of the center. In cats, end-stopped cells generally show inhibition only when the orientation presented in the surround is close to the preferred orientation of the cell as measured at the receptive field center (DeAngelis et al., 1994). Similarly, in tree shrews, length-summing cells show the strongest length summation when the orientation in the surround matches the preferred orientation of the cell (Chisum et al., 2003). We examined orientation selectivity in the surround of length-summing cells and end-stopped cells in the squirrel to see whether the same surround selectivity was present in an animal without orientation maps. We stimulated the center of the receptive field with a drifting grating at the preferred orientation of the cell that was 8° square and stimulated the surround with a drifting grating of variable orientation that was 21° square. The strict definition of the classical receptive field center of a cell is the region in which visual stimulation can evoke action potentials. We did not try to precisely define this region with computerized stimuli; however, for several cells that were tested explicitly, we noted that manual stimulation restricted to outside the 8° center area did not produce spiking activity. Surround orientation tuning curves are shown in Figure 9E. Length-summing cells exhibit clear orientation selectivity in the surround and fire most when the orientation of the surround is equal to the preferred orientation of the center. End-stopped cells, in contrast, do not show a strong dependence on the orientation of the surround. If length-summation and end-stopped behavior are mediated via intrinsic horizontal connections, then this result is indirect evidence that the sparse long-range excitatory connections may be orientation selective.
Discussion
Horizontal connections
In many sensory and high-level cortical areas, including V1 of primates (Malach et al., 1993), carnivores (Gilbert and Wiesel, 1983), and tree shrews (Rockland et al., 1982), long-range horizontal axons ramify in periodic, patchy patterns across the cortical surface. This clustered connectivity is evident in both anterograde axonal staining (Gilbert and Wiesel, 1979; Rockland et al., 1982; Bosking et al., 1997) and retrograde labeling of cells that project to a small area of V1 (Callaway and Katz, 1990; Ruthazer and Stryker, 1996; Bosking et al., 2000). In squirrel, we found 1–2 mm horizontal connections, but there was little evidence of patchy and periodic connectivity in quantitative analyses of retrogradely labeled cells. Kaas et al. (1989) also examined squirrel horizontal connections and found 1–2 mm connections and some limited evidence for patchy intrinsic connections in V1. Although patchy (but not periodic) connectivity appears striking in one anterograde injection using wheat germ agglutinin–horseradish peroxidase from that study, patchy connectivity is not obvious in other injections. Kaas et al. (1989) did find clear retrogradely labeled patches in V1 after injecting other visual cortical areas, and the authors hypothesized that these patches might reflect modular organization such as orientation maps. However, a subsequent study did not find orientation maps in squirrels (Van Hooser et al., 2005), and, whereas the results from Kaas et al. (1989) do suggest that there is some organization of projection neurons in V1, there seems to be little overall evidence for patchy and periodic intrinsic connections within squirrel V1. Two studies of layer 2/3 horizontal connections in rat visual cortex also did not find patchy connectivity (Burkhalter, 1989; Rumberger et al., 2001). There are now a handful of examples of the co-occurrence of orientation maps and patchy horizontal connections: primates, carnivores, and tree shrews have orientation maps and patchy connections in V1, whereas rats and squirrels do not have orientation maps and do not have patchy horizontal connections. It is possible that these properties are functionally linked.
In carnivores (Callaway and Katz, 1990; Ruthazer and Stryker, 1996), modestly patchy horizontal connections are present before eye opening and before development of orientation selectivity in V1. After eye opening, patchy connections are rapidly refined as orientation selectivity develops (Chapman and Stryker, 1993; Ruthazer and Stryker, 1996). It is possible that patchy connectivity either forms or does not form as a result of balances between conflicting developmental mechanisms, and it would be informative to know what is different about the development of horizontal connections in rodents. One idea is that horizontal connections do not form until after orientation selectivity develops. Alternatively, connections might form early but not undergo clustering. Finally, connections might form clusters early but lose this clustering as the animal matures. Developmental studies of horizontal connections in mammals lacking patchy connections and maps could shed light on mechanisms underlying their formation in mammals that do.
Functional interactions
One might imagine two views of connectivity rules among local cortical neurons given studies of horizontal connections in mammals with orientation maps. In the first, a majority of neurons contact cells with similar orientation preferences (e.g., models by Ben-Yishai et al., 1995; Somers et al., 1995), although there are exceptional cells near pinwheel centers that contact cells with different properties. In the second, all neurons make unselective dense local contacts (<300 μm), and any selectivity in local connections is a coincidence of local map structure (Das and Gilbert, 1999; Marino et al., 2005). Our data are most consistent with the latter view. Squirrels have no map structure, and we found unselective interactions in multielectrode recordings and broad membrane potential tuning in intracellular recordings.
Some investigators have suggested that orientation maps exist to minimize cortical wiring (Hubel and Wiesel, 1977). According to one model by Koulakov and Chklovskii (2001), orientation maps with pinwheels minimized wiring if connectivity was required to be orientation selective, whereas a random arrangement was optimal if connectivity was unselective. Their prediction of unselective interactions among rodent V1 neurons is supported by our data, but it is unclear whether there is no map because connectivity is unselective or whether connectivity is unselective because there is no map.
Orientation tuning of the membrane potential
In squirrel V1, sensitivity to the preferred stimulus assessed by orientation-tuning width was narrow for both spike output and membrane potential and was similar to cat V1. However, membrane potential selectivity, assessed by OM and OS, was quite broad and resembled cat neurons at pinwheel centers (Schummers et al., 2002).
At cat pinwheel centers and in squirrel cells, broad selectivity of the membrane potential is not reflected in spiking output (Schummers et al., 2002), raising questions about the influence of horizontal connections on spiking activity. Brain slice studies and in vivo correlation studies have suggested that vertical inputs are denser and have greater impact on firing rate than horizontal inputs (Toyama et al., 1981a,b; Hirsch and Gilbert, 1991; Yoshimura et al., 2000). Also, in tree shrew visual cortex, in which layer 2/3 cells exhibit length-summing behavior, it is not possible to activate neurons by visually stimulating cells in neighboring orientation domains; activation of underlying layer 4 neurons appears necessary (Chisum et al., 2003). Therefore, horizontal input may be modulatory whereas vertical input may provide principle drive (Hirsch and Gilbert, 1991), or horizontal input could be strong but excitation and inhibition might be balanced at orthogonal orientations (Marino et al., 2005), and this type of input itself could modulate driving input (Chance et al., 2002). Finally, horizontal inputs may be strong in orientation domains but relatively weak near pinwheel centers or in animals without maps. Future studies will be needed to address the contribution of horizontal inputs to spiking output.
Receptive field integration
Functional response classes of V1 cells are remarkably similar in animals with and without orientation maps and periodic/patchy connections. Cells in squirrel show contrast-invariant orientation selectivity with tuning widths comparable with other mammals (Heimel et al., 2005; Van Hooser et al., 2005). Here, we showed that two classes of length-tuning cells that have been reported in other animals, end-stopped cells and length-summing cells, are found in squirrel V1. Therefore, length-tuning properties, which may be mediated in part by integration across the cortical surface, are relatively similar across mammals (Gilbert, 1977; Oliveira et al., 2002; Chisum et al., 2003). These results suggest that orientation maps, patchy/periodic connectivity, and orientation-selective connectivity are not necessary for these receptive field properties.
Squirrel length-summing cells show selectivity in the surround. This is consistent with the idea that some (perhaps most) long-range excitatory connections within rodent V1 connect cells with similar orientation preferences (Burkhalter, 1989). We did not see direct evidence of these connections in multielectrode recordings, but any long-range interactions would be difficult to find using multielectrode recordings given that long-range connections in squirrel are diffuse and not patchy.
Although it seems likely that orientation selectivity and length summing do not depend critically on map structure, maps might influence inhibitory suppression. In cats, end inhibition depends on orientation preferences of neighboring neurons (DeAngelis et al., 1994; Das and Gilbert, 1999). Das and Gilbert (1999) showed that a flanking stimulus provided the strongest inhibitory suppression to a cell when its orientation matched that of the neighboring cells in the orientation map. Consistent with this idea, we did not find surround orientation selectivity of end-stopped cells in squirrel. Layer 6 cells in cat contribute to inhibitory tuning (Bolz and Gilbert, 1986), and it is possible that tuning in cats and lack of tuning in squirrels is the result of vertical net inhibitory connections that are made from underlying cells without regard to orientation preferences.
General principles of horizontal connections
Although all examined mammals have long-distance horizontal connections in V1, there is a key difference in horizontal wiring across mammals: in animals with orientation maps, there is a patchy, columnar organization with a high level of interconnectedness within and among nearby columns with similar functional properties. In animals without maps, nearby cells with different functional properties are interconnected, and long-range connections are relatively sparse and diffuse. This suggests that patchy, modular connectivity is not a universal organizing principle of cortex. Patchy connectivity has been found in several sensory and higher cortical areas in primates and carnivores (LeVay and Nelson, 1991; Lund et al., 1993), and it is an interesting open question as to whether all of cortex is modular in animals that have functional modular organization in areas like V1.
Despite differences in V1 architecture, major functional properties thought to depend on horizontal connectivity, including contrast-invariant orientation selectivity, length summation, and end-stopped behavior, are conserved across mammals with and without patchy connectivity. Individual cell properties are very similar across mammals regardless of whether or not they have orientation maps (Girman et al., 1999; Van Hooser et al., 2005), patchy and periodic connectivity, or ocular dominance bands (Gordon and Stryker, 1996). Thus, periodic and patchy connectivity joins other features of V1 columnar architecture, including ocular dominance columns (Adams and Horton, 2003) and orientation maps (Van Hooser et al., 2005), in failing to provide significant insight into receptive field properties of individual cells (Horton and Adams, 2005).
Footnotes
We thank Alexis Hattox for help with microspheres and anti-NeuN and Alfredo Fontanini and Arianna Maffei for help with intracellular recording. We thank Daniel Felch for the image of LGN. We also thank Andreas Burkhalter, David Fitzpatrick, Leah Krubitzer, James Schummers, and Mriganka Sur for helpful discussions and Matteo Carandini for analysis code.
References
- Adams DL, Horton JC (2003). Capricious expression of cortical columns in the primate brain. Nat Neurosci 6:113–114. [DOI] [PubMed] [Google Scholar]
- Aertsen AM, Gerstein GL, Habib MK, Palm G (1989). Dynamics of neuronal firing correlation: modulation of “effective connectivity.”. J Neurophysiol 61:900–917. [DOI] [PubMed] [Google Scholar]
- Ben-Yishai R, Bar-Or RL, Sompolinsky H (1995). Theory of orientation tuning in visual cortex. Proc Natl Acad Sci USA 92:3844–3848. [DOI] [PMC free article] [PubMed] [Google Scholar]
- Bolz J, Gilbert CD (1986). Generation of end-inhibition in the visual cortex via interlaminar connections. Nature 320:362–365. [DOI] [PubMed] [Google Scholar]
- Bolz J, Gilbert CD (1989). The role of horizontal connections in generating long receptive fields in the cat visual cortex. Eur J Neurosci 1:263–268. [DOI] [PubMed] [Google Scholar]
- Bosking WH, Zhang Y, Schofield B, Fitzpatrick D (1997). Orientation selectivity and the arrangement of horizontal connections in tree shrew striate cortex. J Neurosci 17:2112–2127. [DOI] [PMC free article] [PubMed] [Google Scholar]
- Bosking WH, Kretz R, Pucak ML, Fitzpatrick D (2000). Functional specificity of callosal connections in tree shrew striate cortex. J Neurosci 20:2346–2359. [DOI] [PMC free article] [PubMed] [Google Scholar]
- Brainard DH (1997). The psychophysics toolbox. Spat Vis 10:433–436. [PubMed] [Google Scholar]
- Brody CD (1999). Correlations without synchrony. Neural Comput 11:1537–1551. [DOI] [PubMed] [Google Scholar]
- Bullier J, Henry GH (1980). Ordinal position and afferent input of neurons in monkey striate cortex. J Comp Neurol 193:913–935. [DOI] [PubMed] [Google Scholar]
- Burkhalter A (1989). Intrinsic connections of rat primary visual cortex: laminar organization of axonal projections. J Comp Neurol 279:171–186. [DOI] [PubMed] [Google Scholar]
- Callaway EM, Katz LC (1990). Emergence and refinement of clustered horizontal connections in cat striate cortex. J Neurosci 10:1134–1153. [DOI] [PMC free article] [PubMed] [Google Scholar]
- Carandini M, Ferster D (2000). Membrane potential and firing rate in cat primary visual cortex. J Neurosci 20:470–484. [DOI] [PMC free article] [PubMed] [Google Scholar]
- Casagrande VA, Kaas JH (1994). The afferent, intrinsic, and efferent connections of primary visual cortex in primates. In: Cerebral cortex, Vol 10, Primary visual cortex of primates (Peters A, Rockland K, eds) pp. 201–259. New York: Plenum.
- Chance FS, Abbott LF, Reyes AD (2002). Gain modulation from background synaptic input. Neuron 35:773–782. [DOI] [PubMed] [Google Scholar]
- Chapman B, Stryker MP (1993). Development of orientation selectivity in ferret visual cortex and effects of deprivation. J Neurosci 13:5251–5262. [DOI] [PMC free article] [PubMed] [Google Scholar]
- Chisum HJ, Mooser F, Fitzpatrick D (2003). Emergent properties of layer 2/3 neurons reflect the collinear arrangement of horizontal connections in tree shrew visual cortex. J Neurosci 23:2947–2960. [DOI] [PMC free article] [PubMed] [Google Scholar]
- Chiu C, Weliky M (2001). Spontaneous activity in developing ferret visual cortex in vivo. J Neurosci 21:8906–8914. [DOI] [PMC free article] [PubMed] [Google Scholar]
- Chung S, Li X, Nelson SB (2002). Short-term depression at thalamocortical synapses contributes to rapid adaptation of cortical sensory responses in vivo. Neuron 34:437–446. [DOI] [PubMed] [Google Scholar]
- Das A, Gilbert CD (1999). Topography of contextual modulations mediated by short-range interactions in primary visual cortex. Nature 399:655–661. [DOI] [PubMed] [Google Scholar]
- DeAngelis GC, Freeman RD, Ohzawa I (1994). Length and width tuning of neurons in the cat’s primary visual cortex. J Neurophysiol 71:347–374. [DOI] [PubMed] [Google Scholar]
- DiCarlo JJ, Lane JW, Hsiao SS, Johnson KO (1996). Marking microelectrode penetrations with fluorescent dyes. J Neurosci Methods 64:75–81. [DOI] [PubMed] [Google Scholar]
- Ferster D, Jagadeesh B (1992). EPSP–IPSP interactions in cat visual cortex studied with in vivo whole-cell patch recording. J Neurosci 12:1262–1274. [DOI] [PMC free article] [PubMed] [Google Scholar]
- Gilbert CD (1977). Laminar differences in receptive field properties of cells in cat primary visual cortex. J Physiol (Lond) 268:391–421. [DOI] [PMC free article] [PubMed] [Google Scholar]
- Gilbert CD, Wiesel TN (1979). Morphology and intracortical projections of functionally characterised neurones in the cat visual cortex. Nature 280:120–125. [DOI] [PubMed] [Google Scholar]
- Gilbert CD, Wiesel TN (1983). Clustered intrinsic connections in cat visual cortex. J Neurosci 3:1116–1133. [DOI] [PMC free article] [PubMed] [Google Scholar]
- Gilbert CD, Wiesel TN (1989). Columnar specificity of intrinsic horizontal and corticocortical connections in cat visual cortex. J Neurosci 9:2432–2442. [DOI] [PMC free article] [PubMed] [Google Scholar]
- Girman SV, Sauve Y, Lund RD (1999). Receptive field properties of single neurons in rat primary visual cortex. J Neurophysiol 82:301–311. [DOI] [PubMed] [Google Scholar]
- Gordon JA, Stryker MP (1996). Experience-dependent plasticity of binocular responses in the primary visual cortex of the mouse. J Neurosci 16:3274–3286. [DOI] [PMC free article] [PubMed] [Google Scholar]
- Hall WC, Kaas JH, Killackey H, Diamond IT (1971). Cortical visual areas in the grey squirrel (Sciurus carolinesis): a correlation between cortical evoked potential maps and architectonic subdivisions. J Neurophysiol 34:437–452. [DOI] [PubMed] [Google Scholar]
- Heimel JA, Van Hooser SD, Nelson SB (2005). Laminar organization of response properties in primary visual cortex of the gray squirrel (Sciurus carolinensis). J Neurophysiol 94:3538–3554. [DOI] [PubMed] [Google Scholar]
- Hirsch JA, Gilbert CD (1991). Synaptic physiology of horizontal connections in the cat’s visual cortex. J Neurosci 11:1800–1809. [DOI] [PMC free article] [PubMed] [Google Scholar]
- Horton JC, Adams DL (2005). The cortical column: a structure without a function. Philos Trans R Soc Lond B Biol Sci 360:837–862. [DOI] [PMC free article] [PubMed] [Google Scholar]
- Hubel DH, Wiesel TN (1959). Receptive fields of single neurones in the cat’s striate cortex. J Physiol (Lond) 148:574–591. [DOI] [PMC free article] [PubMed] [Google Scholar]
- Hubel DH, Wiesel TN (1977). Ferrier lecture. Functional architecture of macaque monkey visual cortex. Proc R Soc Lond B Biol Sci 198: pp. 1–59. [DOI] [PubMed] [Google Scholar]
- Hubel DH, Wiesel TN, Stryker MP (1978). Anatomical demonstration of orientation columns in macaque monkey. J Comp Neurol 177:361–380. [DOI] [PubMed] [Google Scholar]
- Humphrey AL, Norton TT (1980). Topographic organization of the orientation column system in the striate cortex of the tree shrew (Tupaia glis). I. Microelectrode recording. J Comp Neurol 192:531–547. [DOI] [PubMed] [Google Scholar]
- Kaas JH, Krubitzer LA, Johanson KL (1989). Cortical connections of areas 17 (V-I) and 18 (V-II) of squirrels. J Comp Neurol 281:426–446. [DOI] [PubMed] [Google Scholar]
- Koulakov AA, Chklovskii DB (2001). Orientation preference patterns in mammalian visual cortex: a wire length minimization approach. Neuron 29:519–527. [DOI] [PubMed] [Google Scholar]
- LeVay S, Nelson SB (1991). Columnar organization of the visual cortex. In: The neural basis of visual function (Leventhal AG, ed.) pp. 266–315. London: Macmillan.
- Lund JS, Yoshioka T, Levitt JB (1993). Comparison of intrinsic connectivity in different areas of macaque monkey cerebral cortex. Cereb Cortex 3:148–162. [DOI] [PubMed] [Google Scholar]
- Maffei A, Nelson SB, Turrigiano GG (2004). Selective reconfiguration of layer 4 visual cortical circuitry by visual deprivation. Nat Neurosci 7:1353–1359. [DOI] [PubMed] [Google Scholar]
- Malach R, Amir Y, Harel M, Grinvald A (1993). Relationship between intrinsic connections and functional architecture revealed by optical imaging and in vivo targeted biocytin injections in primate striate cortex. Proc Natl Acad Sci USA 90:10469–10473. [DOI] [PMC free article] [PubMed] [Google Scholar]
- Maldonado PE, Godecke I, Gray CM, Bonhoeffer T (1997). Orientation selectivity in pinwheel centers in cat striate cortex. Science 276:1551–1555. [DOI] [PubMed] [Google Scholar]
- Margrie TW, Brecht M, Sakmann B (2002). In vivo, low-resistance, whole cell recordings from neurons in the anaesthetized and awake mammalian brain. Pflügers Arch 444:491–498. [DOI] [PubMed] [Google Scholar]
- Marino J, Schummers J, Lyon DC, Schwabe L, Beck O, Wiesing P, Obermayer K, Sur M (2005). Invariant computations in local cortical networks with balanced excitation and inhibition. Nat Neurosci 8:194–201. [DOI] [PubMed] [Google Scholar]
- Metín C, Godement P, Imbert M (1988). The primary visual cortex in the mouse: receptive field properties and functional organization. Exp Brain Res 69:594–612. [DOI] [PubMed] [Google Scholar]
- Michalski A, Gerstein GL, Czarkowska J, Tarnecki R (1983). Interactions between cat striate cortex neurons. Exp Brain Res 51:97–107. [DOI] [PubMed] [Google Scholar]
- Monier C, Chavane F, Baudot P, Graham LJ, Fregnac Y (2003). Orientation and direction selectivity of synaptic inputs in visual cortical neurons: a diversity of combinations produces spike tuning. Neuron 37:663–680. [DOI] [PubMed] [Google Scholar]
- Mooser F, Bosking WH, Fitzpatrick D (2004). A morphological basis for orientation tuning in primary visual cortex. Nat Neurosci 7:872–879. [DOI] [PubMed] [Google Scholar]
- Ohki K, Chung S, Ch’ng YH, Kara P, Reid RC (2005). Functional imaging with cellular resolution reveals precise micro-architecture in visual cortex. Nature 433:597–603. [DOI] [PubMed] [Google Scholar]
- Oliveira L, Volchan E, Pessoa L, Pantoja JH, Joffily M, Souza-Neto D, Marques RF, Rocha-Miranda CE (2002). Contour integration in the primary visual cortex of the opossum. NeuroReport 13:2001–2004. [DOI] [PubMed] [Google Scholar]
- Orban GA, Kennedy H, Bullier J (1986). Velocity sensitivity and direction selectivity of neurons in areas V1 and V2 of the monkey: influence of eccentricity. J Neurophysiol 56:462–480. [DOI] [PubMed] [Google Scholar]
- Palm G, Aertsen AM, Gerstein GL (1988). On the significance of correlations among neuronal spike trains. Biol Cybern 59:1–11. [DOI] [PubMed] [Google Scholar]
- Pelli DG (1997). The VideoToolbox software for visual psychophysics: transforming numbers into movies. Spat Vis 10:437–442. [PubMed] [Google Scholar]
- Perkel DH, Gerstein GL, Moore GP (1967). Neuronal spike trains and stochastic point processes. II. Simultaneous spike trains. Biophys J 7:419–440. [DOI] [PMC free article] [PubMed] [Google Scholar]
- Reid RC, Alonso JM (1995). Specificity of monosynaptic connections from thalamus to visual cortex. Nature 378:281–284. [DOI] [PubMed] [Google Scholar]
- Rockland KS, Lund JS, Humphrey AL (1982). Anatomical binding of intrinsic connections in striate cortex of tree shrews (Tupaia glis). J Comp Neurol 209:41–58. [DOI] [PubMed] [Google Scholar]
- Rumberger A, Tyler CJ, Lund JS (2001). Intra- and inter-areal connections between the primary visual cortex V1 and the area immediately surrounding V1 in the rat. Neuroscience 102:35–52. [DOI] [PubMed] [Google Scholar]
- Ruthazer ES, Stryker MP (1996). The role of activity in the development of long-range horizontal connections in area 17 of the ferret. J Neurosci 16:7253–7269. [DOI] [PMC free article] [PubMed] [Google Scholar]
- Schiller PH, Finlay BL, Volman SF (1976). Quantitative studies of single-cell properties in monkey striate cortex. I. Spatiotemporal organization of receptive fields. J Neurophysiol 39:1288–1319. [DOI] [PubMed] [Google Scholar]
- Schummers J, Marino J, Sur M (2002). Synaptic integration by V1 neurons depends on location within the orientation map. Neuron 36:969–978. [DOI] [PubMed] [Google Scholar]
- Shouval HZ, Goldberg DH, Jones JP, Beckerman M, Cooper LN (2000). Structured long-range connections can provide a scaffold for orientation maps. J Neurosci 20:1119–1128. [DOI] [PMC free article] [PubMed] [Google Scholar]
- Snodderly DM, Gur M (1995). Organization of striate cortex of alert, trained monkeys (Macaca fascicularis): ongoing activity, stimulus selectivity, and widths of receptive field activating regions. J Neurophysiol 74:2100–2125. [DOI] [PubMed] [Google Scholar]
- Somers DC, Nelson SB, Sur M (1995). An emergent model of orientation selectivity in cat visual cortical simple cells. J Neurosci 15:5448–5465. [DOI] [PMC free article] [PubMed] [Google Scholar]
- Tiao YC, Blakemore C (1976). Functional organization in the visual cortex of the golden hamster. J Comp Neurol 168:459–481. [DOI] [PubMed] [Google Scholar]
- Toyama K, Kimura M, Tanaka K (1981a). Cross-correlation analysis of interneuronal connectivity in cat visual cortex. J Neurophysiol 46:191–201. [DOI] [PubMed] [Google Scholar]
- Toyama K, Kimura M, Tanaka K (1981b). Organization of cat visual cortex as investigated by cross-correlation technique. J Neurophysiol 46:202–214. [DOI] [PubMed] [Google Scholar]
- Ts’o DY, Gilbert CD, Wiesel TN (1986). Relationships between horizontal interactions and functional architecture in cat striate cortex as revealed by cross-correlation analysis. J Neurosci 6:1160–1170. [DOI] [PMC free article] [PubMed] [Google Scholar]
- Van Hooser SD, Heimel JA, Nelson SB (2003). Receptive field properties and laminar organization of lateral geniculate nucleus in the gray squirrel (Sciurus carolinensis). J Neurophysiol 90:3398–3418. [DOI] [PubMed] [Google Scholar]
- Van Hooser SD, Heimel JA, Chung S, Nelson SB, Toth LJ (2005). Orientation selectivity without orientation maps in visual cortex of a highly visual mammal. J Neurosci 25:19–28. [DOI] [PMC free article] [PubMed] [Google Scholar]
- Weliky M, Kandler K, Fitzpatrick D, Katz LC (1995). Patterns of excitation and inhibition evoked by horizontal connections in visual cortex share a common relationship to orientation columns. Neuron 15:541–552. [DOI] [PubMed] [Google Scholar]
- Yoshimura Y, Sato H, Imamura K, Watanabe Y (2000). Properties of horizontal and vertical inputs to pyramidal cells in the superficial layers of the cat visual cortex. J Neurosci 20:1931–1940. [DOI] [PMC free article] [PubMed] [Google Scholar]