

Abstract
Ionotropic glutamate receptors perform diverse functions in the nervous system. As a result, multiple receptor subtypes have evolved with different kinetics, ion permeability, expression patterns, and regulation by second messengers. Kainate receptors show slower recovery from desensitization and have different affinities for agonists than AMPA receptors. Based on analysis of ligand binding domain crystal structures, we identified interdomain interactions in the agonist-bound state that are conserved in kainate receptors and absent in AMPA receptors. Mutations in GluR6 designed to disrupt these contacts reduced agonist apparent affinity, speeded up receptor deactivation and increased the rate of recovery from desensitization. Conversely, introduction of mutations in GluR2 that enabled additional interdomain interactions in the agonist-bound state increased agonist apparent affinity 15-fold, and slowed both deactivation and recovery from desensitization. We conclude that interdomain interactions have evolved as a distinct mechanism that contributes to the unique kinetic properties of AMPA and kainate receptors.
Keywords: glutamate receptor, gating, desensitization, crystal structure, kainate, AMPA
Introduction
The rate of decay of excitatory synaptic currents mediated by glutamate receptor ion channels (iGluRs) is tuned over a wide range of kinetics (Hestrin et al., 1990; Silver et al., 1992; Zhang and Trussell, 1994; Geiger et al., 1995). Classical studies recognized that the activation of ion channels by neurotransmitters is mediated by separate binding and gating steps (del Castillo and Katz, 1957) and that the affinity of agonists for the receptor complex determines the rate of decay of the synaptic current (Colquhoun et al., 1977; Pan et al., 1993). For iGluRs, crystallographic analysis suggests that agonist affinity for the ligand binding domain is determined by two distinct mechanisms. The first is formation of intermolecular bonds between the receptor and the agonist molecule (Armstrong and Gouaux, 2000; Mayer and Armstrong, 2004). The second arises from conformational changes triggered by the binding of agonists. The resulting movement of domain 2 of the ligand-binding domain toward domain 1 permits formation of state-dependent intramolecular bonds, which stabilize the active agonist bound conformation. The amino acids that form these stabilizing contacts are distinct from those that interact directly with the agonist, and are distributed widely over the surface of the two lobes that move toward each other in the transition from the resting to glutamate-bound state (Armstrong and Gouaux, 2000; Robert et al., 2005).
Evidence for this model was obtained from experiments on the GluR2 subtype of AMPA receptor for which a hydrogen bond contact in the glutamate-bound but not resting state is formed by the side chain of Glu402, located in domain 1, with the hydroxyl group of Thr686 in domain 2. The T686A mutation disrupts hydrogen bond formation with Glu402, produces a rightward shift of the glutamate concentration–response curve, increases the rate of deactivation, and increases the rate of recovery from desensitization (Robert et al., 2005). All three effects are a result of a reduced stability of the glutamate-bound activated state of the receptor. The bond between Glu402 and Thr686 or its equivalent is one of a number of interdomain contacts that are common to both AMPA and kainate receptors. However, during a crystallographic analysis of GluR5 and GluR6 subtype kainate receptors, we noted the presence of a number of additional interdomain contacts, which are unique to kainate receptors and absent in AMPA receptors (Mayer, 2005). These novel contacts are formed by charged residues in helix F of domain 2, which interact with sites located at the base and tip of loop 2 of domain 1, a structure for which a functional role has not yet been elucidated. By exchanging residues between kainate and AMPA receptors, we demonstrate that the contacts between loop 2 and helix F make important contributions to the stability of the active state of kainate receptors. In addition, by introducing the missing residues into AMPA receptors, we were able to engineer gain of function mutations, one of which shows a 15-fold increase in sensitivity to glutamate.
Materials and Methods
Mutagenesis.
Point mutations for electrophysiological experiments were introduced by overlapping PCR with Pfu DNA polymerase to generate cDNA fragments, which were then ligated into appropriately digested GluR2 and GluR6 pRK vectors engineered to produce green fluorescent protein via a down-stream internal ribosome entry site, as described previously (Chen et al., 1999). After subcloning, the amplified segments were sequenced in their entirety. Amino acid numbers correspond to the mature protein after cleavage of the signal peptide.
Protein expression, crystallographic data collection, phasing, and refinement.
The rat GluR2 S1S2 A455E/S652D mutant ligand-binding core was overexpressed as a soluble protein in OrigamiB (DE3) Escherichia coli and purified to homogeneity using Ni2+ NTA and ion-exchange chromatography. Crystals were grown at 277 °K using the hanging drop technique and a reservoir of 14% polyethylene glycol 8 K, 0.1 m zinc acetate, and 0.1 m sodium acetate, pH 5.5, mixed at a 1:1 volume ratio with protein at a concentration of 5–15 mg/ml in a buffer containing 20 mm NaCl, 10 mm HEPES, pH 7.0, 10 mm Na glutamate, and 1 mm EDTA. Crystals were cryoprotected by brief soaks in mother liquor supplemented with increasing concentrations of glycerol to a final value of 20% v/v. X-ray diffraction data were collected at Advanced Photon Source beamline ID22 at 100 °K using an MAR 300 CCD detector (Table 1). Data was indexed, scaled, and merged using HKL2000 (Otwinowski and Minor, 2001). The structure was solved by difference Fourier techniques using the wild-type (wt) complex with glutamate stripped of solvent, ions and ligand as the initial model (PDB code 1FTJ), followed by rigid body refinement, simulated annealing, and positional and individual B-factor refinement using CNS 1.1 (Brunger et al., 1998). Model building into Fo–Fc and composite omit maps was performed using O (Jones and Kjeldgaard, 1997), and was coupled with cycles of crystallographic refinement, resulting in values for Rwork and Rfree of 21.2 and 22.7%, respectively (Table 1). Additional crystallographic calculations were performed using CCP4 (1994) and the USF suite (Kleywegt et al., 2001). Domain closure was calculated using the program FIT after least squares superposition of domain 1 using Cα atoms as described previously (Mayer, 2005). Figures were prepared using BOBSCRIPT (Esnouf, 1997), MOLSCRIPT (Kraulis, 1991), and RASTER3D (Merrit and Bacon, 1997). Coordinates and structure factors for the GluR2 A455E/S652D mutant have been deposited in the protein data bank with the accession code 2GFE.
Table 1.
Data collection and refinement statistics
| Data Collection | |
|---|---|
| Space group | P21212 |
| Unit cell (Å) | |
| a | 114.4 |
| b | 163.3 |
| c | 47.6 |
| Number per a.u. | 3 |
| Wavelength (Å) | 1.0000 |
| Resolution (Å)a | 40–1.54 (1.60) |
| Unique observations | 129880 |
| Mosaicity (°) | 0.36 |
| Mean redundancyb | 3.6 (2.8) |
| Completeness (%)b | 98.2 (97.2) |
| Rmerge (%)bc | 0.049 (0.354) |
| I/ς(I)b | 15.0 (2.78) |
| Refinement | |
|---|---|
| Resolution (Å) | 39.42–1.54 |
| Protein atoms (ac) | 6211 (97) |
| Ligand atoms | 30 |
| Water atoms | 746 |
| Zinc ions | 5 |
| Rwork/Rfree (%)d | 21.25/22.74 |
| rms deviations | |
| Bond lengths (Å) | 0.0045 |
| Bond angles (°) | 1.125 |
| Bond B valuese | 1.14/1.92 |
| Angle B valuese | 1.80/2.86 |
| Mean B values (Å2) | |
| Protein overall | 18.11 |
| Main chain | 16.58 |
| Side chain | 19.72 |
| Ligand | 10.91 |
| Zinc ions | 24.12 |
| Water | 27.29 |
| Ramachandran statisticsf | 94.2/5.8/0/0 |
ac, Alternate conformation.
aValue in parentheses indicates the low resolution limit for last shell of data.
bValues in parentheses indicate statistics for last shell of data.
cRmerge = (Σ II − <II>) / ΣI II, where <II> is the mean II over symmetry-equivalent reflections.
dRwork = (Σ ‖Fo − Fc‖) / Σ Fo, where Fo and Fc denote observed and calculated structure factors, respectively; 5% of the reflections were set aside for the calculation of the Rfree value.
eValues are for main chain/side chain.
fPercentage of residues in most favored/allowed/generous/disallowed regions.
Electrophysiological experiments.
Human embryonic kidney (HEK) cells were transfected with 1.5 μg of cDNA per 35 mm coverslip by the calcium phosphate method (Chen and Okayama, 1987). Experiments were performed at room temperature 24–72 h after transfection. Cells were identified by green fluorescence and outside-out membrane patch recordings with an Axopatch 200A amplifier were obtained from cells expressing either wild-type GluR6(Q), GluR2(Q)flip, or mutant receptors. Patches were positioned in front of a fast perfusion system consisting of a glass flow pipe mounted on a piezoelectric translator (Clements and Westbrook, 1991; Colquhoun et al., 1992). At the completion of a recording, solution exchange time (20–80% to peak) was estimated from open tip responses and ranged from 0.1–0.4 ms. For concentration–response measurements, outside-out patches or whole cells lifted from the coverslip were positioned in front of a six-barrel quartz glass flow pipe. Patch pipettes had a resistance of 2–4 MΩ, and were filled with a solution containing the following (in mm): 150 CSF, 20 HEPES, 10 NaCl, 10 EGTA, pH 7.3. The extracellular medium contained the following (in mm): 140 NaCl, 2.4 KCl, 10 HEPES, 10 glucose, 4 MgCl2, 4 CaCl2, pH 7.3, 305 mOsm. Cyclothiazide was dissolved in DMSO before dilution with extracellular solution to a final concentration of 100 μm and was used to block desensitization for concentration–response measurements for GluR2; 10 μm concanavalin A was used to block desensitization for GluR6. Holding potential was typically −70 mV. Currents were filtered at 2 kHz and digitized at 10 kHz. The data were analyzed using Axograph 4.9 (Molecular Devices, Union City, CA). For measurements of deactivation and desensitization, the decay time course of the response after a 1 ms application or during a 500 ms application of 10 mm glutamate was fit to a single exponential function. For recovery from desensitization, a paired-pulse protocol was used and the peak amplitude of the second pulse was calculated as a ratio of the first pulse. Although a more detailed analysis of recovery from desensitization has been accomplished by fitting multistate kinetic schemes (Robert et al., 2005), to simplify comparison between mutants we fit responses to a single exponential function. For concentration–response measurements, data from each cell was normalized to the response recorded with 10 mm l-glutamate, and the mean normalized results were fitted to the Hill equation to obtain the EC50 value; typically, each glutamate concentration was applied two to three times with a variable order and their amplitude ratio to 10 mm glutamate were averaged. Hill coefficients obtained from the fits ranged from 1.1 to 1.2 for GluR6 and 1.26 to 1.39 for GluR2, and did not show any apparent correlation to the EC50 value.
Results
Our experiments were stimulated by recent work on AMPA receptors, which revealed that the stability of the agonist receptor complex is determined not only by direct contacts made by the agonist with the receptor binding site, but also by a conformation-specific protein–protein contact between Glu402 and Thr686 that forms as a result of agonist-induced domain closure (Robert et al., 2005). At present, there has been no systematic analysis performed to determine whether additional conformation-specific contacts between the two lobes of the ligand binding core are functionally important. In addition, recent crystallographic studies on glutamate receptors have identified a number of interdomain hydrogen-bond and ion-pair contacts linking the two lobes of the ligand binding core, which are unique to kainate receptors and absent in AMPA receptors, but it is not known whether these are functionally important (Mayer, 2005). In this study, we begin to address these issues by studying the functional consequences of mutations that perturb contacts unique to kainate receptors.
Crystallographic analysis of kainate receptor ligand binding cores
Our analysis focused on two areas in the second loop of domain 1 (loop 2), which form contacts with two separate regions of helix F in domain 2; we named these sites 1 and 2 (Fig. 1). Site 1, which can be further broken down into two subsites, A and B, results from the interaction of a conserved aspartate side chain near the N terminus of helix F in domain 2, with the side chains of a conserved lysine (site 1A) and a conserved asparagine (site 1B) present at the start and end of loop 2, respectively (Table 2). In three independent crystallographic GluR6 ligand binding core structures, there is a salt bridge between Lys456 and Asp656 (Table 2), and sigmaA-weighted omit electron density maps for both side chains were consistently well resolved (Fig. 1B). A similar interaction was found in four of five GluR5 ligand binding core structures (Table 2). For site 1B, a hydrogen bond is formed between Asn468 and Asp656, and was present in the three GluR6 ligand binding core structures, as well as all five of the GluR5 ligand binding core structures (Table 2). Although the bond distance from Asn468 to Asp656 varied from 2.52 to 3.54 Å, electron density for the Asn and Asp side chains was of good quality in all of these structures.
Figure 1.
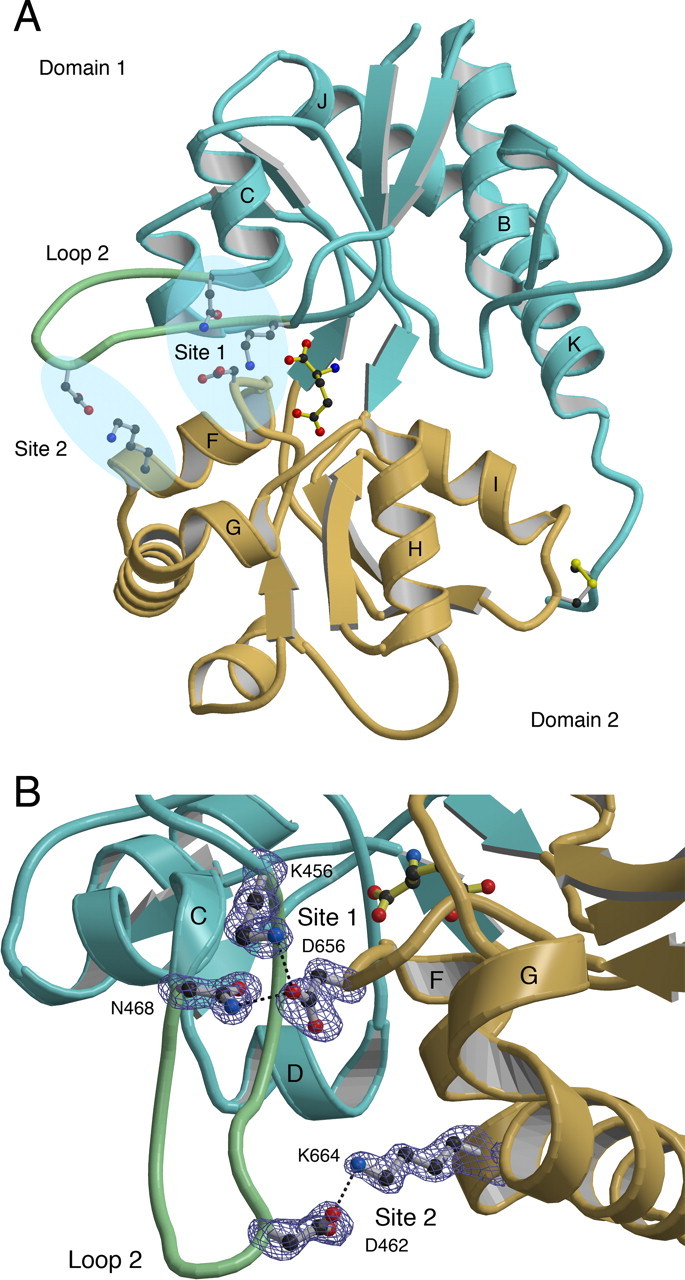
Interdomain contacts in the GluR6 ligand-binding core. A, Ribbon diagram of the GluR6 glutamate complex (PDB identification: 1S501S50) indicating the locations of domain 1 (cyan), domain 2 (pale orange), loop 2 (pale green), and the ligand (yellow bonds). Amino acid side chains mediating some interdomain contacts in sites 1 and 2 are drawn using ball-and-stick representation; letters indicate selected α helices. B, SigmaA-weighted Fo–Fc omit electron density map at 1.65 Å contoured at 3.0 ς for site 1 and 2.2 ς for site 2. Atoms for the indicated side chains were omitted from the Fc calculation. Dashed lines indicate hydrogen bonds and ion pair interactions. Note that all of the side chains are well ordered and have unambiguous electron density.
Table 2.
Interdomain bond distances in kainate and AMPA receptors
| D1 to D2 | Site 1A |
Site 1B |
Site2 |
|---|---|---|---|
| K to D/D/S | N to D/D/S | D/D/A to K/K/R | |
| GluR6 P61a | 2.96 | 3.36 | 3.09 |
| GluR6 P212121 Ab | 2.73 | 3.52 | 2.60 |
| GluR6 P212121 B | 2.86 | 3.54 | 2.77 |
| GluR5 C2c | 2.47 | 3.35 | 3.56 |
| GluR5 P21 Ad | 3.37 | 2.52 | 3.28 |
| GluR5 P21 B | 2.38 | 3.33 | 3.38 |
| GluR5 P21 C | 2.69 | 2.90 | 3.04 |
| GluR5 P21 D | ned | 3.52 | 2.83 |
| wt GluR2 Ae | 4.15 | 4.81 | Ala |
| wt GluR2 B | 5.25 | 3.66 | Ala |
| wt GluR2 C | 3.21 | 3.64 | Ala |
| GluR2 mut Af | 3.70 | 3.43 | ned |
| GluR2 mut B | 3.56 | 3.51 | ned |
| GluR2 mut C | 2.83 | 3.28 | ned |
Hydrogen bond and ion pair contact distances in Å for sites 1, 2, and 3 in a series of 14 crystallographic independent molecules for the ligand-binding cores of wild-type GluR6, GluR5, and GluR2, and the GluR2 A455E/S652D mutant (mut) (PDB accession codes:
a1S50,
b1S7Y,
c1TXF,
d2F36,
e1FTJ,
f2GFE). ned, No electron density.
Site 2 is formed by a salt bridge between Asp462 at the tip of loop 2 and Lys664 near the C terminus of helix F. This contact was present in all eight of the kainate receptor ligand binding core structures (Table 2) and, despite the location of Asp462 at the tip of loop 2, a region for which disorder is common in the crystal structures of glutamate receptor ligand binding cores, electron density was unambiguous for both the Asp and Lys side chains in the majority of structures (Fig. 1B). In combination, the results of these crystallographic studies suggest that sites 1 and 2 make important contributions to the stability of the glutamate bound complexes of GluR6 and GluR5, but functional experiments using site-directed mutagenesis are required to establish this. Because the GluR6 subtype of the kainate receptor gives robust expression in electrophysiological assays, whereas GluR5 expresses poorly and exhibits variable kinetics (Swanson et al., 1997), we have restricted our functional analysis to GluR6.
Disruption of GluR6 interdomain contacts accelerates deactivation and recovery from desensitization
To test the functional effects of mutations designed to perturb the interdomain contacts in GluR6, we transiently transfected GluR6(Q) wild-type and mutant forms into HEK293-T cells and performed patch-clamp recordings with fast perfusion techniques on outside-out patches. We first focused on kinetic measurements of receptor deactivation, desensitization, and recovery from desensitization (Fig. 2A,B). Our analysis was based on widely used kinetic models for AMPA receptor gating in which the apparent affinity for glutamate, measured as an EC50, the rate of decay of responses to brief applications of glutamate, and the rate of recovery from desensitization are determined by the rate constants for both ion channel opening and closing and also by the rate constants for binding and dissociation of glutamate, as well as transitions between ligand-bound closed states and ligand-bound desensitized states (Patneau et al., 1992; Raman and Trussell, 1992, 1995; Robert et al., 2005). Although in principle more detailed kinetic measurements are required to determine whether mutations that produce changes in macroscopic responses such as the EC50 and rates of deactivation and recovery from desensitization do so via changes in channel-gating kinetics, rate constants for ligand binding and dissociation, or a combination thereof, our experiments were designed with the benefit of structural knowledge. As a result, although we cannot definitively state that the responses we observe result from a change in agonist affinity, common sense tells us that this is the most likely underlying mechanism.
Figure 2.

Receptor kinetics and EC50 for glutamate in GluR6. A, Macroscopic currents for responses to 1 ms applications of glutamate for wild-type GluR6 (blue) and the K456A mutant (black) scaled to the same peak amplitude. B, Superimposed responses to 50 ms applications of 10 mm glutamate separated by varying time intervals to show recovery from desensitization for wild-type GluR6 and the K456A mutant. The peak responses were fit with a single exponential shown as a red curve. C, Macroscopic currents for responses recorded from wild-type GluR6 and the N468S mutant in response to varying concentrations of glutamate after a 10 min preincubation with 10 μm concanavalin A. Glutamate concentrations are given in micromolars above the responses; note the difference in concentration ranges. D, Concentration–response data for wild-type GluR6 and mutants from sites 1 and 2. Current amplitudes were normalized to the response to 10 mm glutamate. Error bars are SEM for each concentration and in some cases are smaller than the symbols. The lines drawn through the data points are fits to the Hill equation. Hill coefficients were not statistically different and ranged from 1.1 to 1.2. E, Correlation between the time constants for deactivation and recovery from desensitization (r = 0.75). F, Correlation between EC50 values and time constant for recovery from desensitization. G, Weak correlation between EC50 values and time constant for desensitization. Error bars are SEM for each value and in some cases are smaller than the symbols.
Deactivation was measured by exposing the patch to a brief (1 ms) pulse of 10 mm glutamate and measuring the rate of current decay from the peak response. Compared with GluR6 wild-type deactivation (2.19 ± 0.28 ms; n = 8), mutation of the Asp at position 656 of site 1 to either Ala, Ser, or Asn caused a significant shortening of the time constant of deactivation, with the D656N mutation giving the fastest value of any GluR6 mutant tested (0.53 ± 0.06 ms; n = 6; p < 0.001) and D656A the third fastest (Table 3). Unexpectedly, the rate of onset of desensitization, measured by current decay during a 500 ms application of 10 mm glutamate, was also moderately accelerated by all three mutations to Asp656, from 3.84 ± 0.20 ms in wild-type GluR6 to 2.45 ± 0.08 ms for D656A. The effects on recovery from desensitization, measured with a paired-pulse protocol (see Materials and Methods), followed the behavior found for deactivation, as the Ala and Asn mutations had large effects on the time constant for recovery (2.85 ± 0.08 s for GluR6 wt vs 0.47 ± 0.02 s for D656N; p < 0.001), whereas the D656S mutation produced a smaller effect (Table 3).
Table 3.
Functional analysis of receptor kinetics and affinity for GluR6 and GluR2
| Receptor | n | τdeact | τdesens | τrec | EC50 |
|---|---|---|---|---|---|
| GluR6 wt | 8 | 2.19 ± 0.28 | 3.84 ± 0.20 | 2.85 ± 0.08 | 37.5 ± 2.2 |
| D656A | 8 | 1.00 ± 0.10*** | 2.45 ± 0.08*** | 1.46 ± 0.04*** | 56.6 ± 2.5 |
| D656S | 5 | 1.30 ± 0.14* | 2.40 ± 0.14** | 2.48 ± 0.09** | nd |
| D656N | 6 | 0.53 ± 0.06*** | 2.14 ± 0.30*** | 0.47 ± 0.02*** | 288 ± 20*** |
| K456A | 7 | 0.73 ± 0.11** | 2.15 ± 0.10*** | 0.65 ± 0.02*** | 726 ± 5.7*** |
| K456M | 6 | 1.08 ± 0.24*** | 2.90 ± 0.38 | 0.56 ± 0.02*** | 497 ± 21*** |
| K456R | 9 | 1.60 ± 0.20 | 2.90 ± 0.20* | 2.06 ± 0.06*** | nd |
| N468S | 7 | 1.07 ± 0.05*** | 2.00 ± 0.14*** | 1.96 ± 0.08*** | 114 ± 15.6*** |
| K664A | 12 | 1.60 ± 0.11 | 4.40 ± 0.22 | 1.98 ± 0.07*** | nd |
| K664M | 6 | 1.16 ± 0.13** | 2.90 ± 0.22 | 1.51 ± 0.05*** | 194 ± 18.5*** |
| K664R | 5 | 1.05 ± 0.18** | 2.70 ± 0.33 | 1.67 ± 0.07*** | nd |
| D462A | 9 | 2.19 ± 0.15 | 4.76 ± 0.47 | 1.89 ± 0.11*** | 48.8 ± 3.6 |
| GluR2 wt | 12 | 0.78 ± 0.11 | 6.92 ± 0.91 | 22.9 ± 2.1 | 66.0 ± 0.3 |
| A455E | 10 | 1.25 ± 0.17 | 7.30 ± 0.86 | 41.6 ± 3.8* | 37.5 ± 1.1*** |
| A455D | 12 | 1.85 ± 0.23*** | 5.70 ± 0.68 | 42.0 ± 2.73* | 41.0 ± 0.5*** |
| S652D | 12 | 2.18 ± 0.18*** | 6.36 ± 0.44 | 76.2 ± 3.54*** | 18.4 ± 1.4*** |
| A-E/S-D | 10 | 2.73 ± 0.17*** | 6.52 ± 0.32 | 127.2 ± 10.1*** | 4.4 ± 0.2*** |
| A-D/S-D | 8 | 3.03 ± 0.10*** | 7.31 ± 0.34 | 124.2 ± 8.9*** | 4.5 ± 0.2*** |
τdeact,τdesens, and τrec are time constants (in ms) for the rates of deactivation, desensitization, and recovery from desensitization, respectively (GluR6 recovery is in seconds). EC50 (in μm) was determined by fitting mean normalized concentration responses obtained after treatment with concanavalin A or cyclothiazide to the Hill equation. Measurements are shown as mean ± SEM.
*p < 0.05;
**p < 0.01;
***p < 0.001 compared with wild type with one-way ANOVA and Tukey–Kramer multiple-comparisons post test. nd, Not determined.
At site 1A, mutations of the lysine residue that interacts with Asp656 also produced a significant acceleration of receptor kinetics, although the effects were more dependent on the nature of the side chain that was introduced. An Ala at this position resulted in a threefold faster deactivation than wild type and a 2.8-fold faster recovery from desensitization, among the fastest for any GluR6 mutants. Surprisingly, replacement of Lys 456 with an Arg also resulted in faster kinetics in all three parameters, but the effects were more moderate than the Ala or Met mutants, causing, for example, only a 1.2-fold shift in recovery from desensitization, consistent with the conservation of a positively charged residue. The other residue interacting with Asp 656, Asn 468 (site 1B), was mutated to the serine side chain found in AMPA receptors, resulting in an acceleration in all three parameters, including a 1.9-fold increase in rate of onset of desensitization, the fastest of all GluR6 mutants.
The impact of mutations at site 2 on receptor kinetics was generally milder than those at site 1, but in most cases still significant (Table 3). Lys 664 was changed to Ala, Met or Arg. All three mutants deactivated significantly faster than wild type, with K664R having the fastest value, 1.05 ± 0.18 ms, indicating that side chain chemistry is more important than charge conservation. The rate of onset of desensitization was affected differently, with the K664A mutant increasing the time constant slightly relative to wild type, whereas the Met and Arg mutants showed a 1.3- and 1.4-fold decrease, respectively. In contrast, the rate of recovery from desensitization was consistently quickened, with K664M showing a 1.9-fold decrease. Mutation of Asp462, which forms a salt bridge with Lys 664 at site 2, speeded recovery from desensitization, but not deactivation or desensitization, providing additional evidence for the relatively weaker influence of site 2 on receptor kinetics. Overall, however, disruption of any of the interdomain contacts in GluR6 was sufficient to accelerate the kinetics of the receptor. A plot of the rate of recovery from desensitization, which proceeds on the second time scale, versus the rate of deactivation, which proceeds with ∼103-fold faster kinetics, revealed a striking correlation (Fig. 2E). The most effective mutants were at site 1, and these decreased the time constants for deactivation and recovery from desensitization fourfold to sixfold.
To assess whether the observed changes in kinetics are accompanied by rightward shifts in concentration–response curves, as would be expected for binding site mutations that decreased the stability of glutamate bound states, we measured the EC50 for macroscopic responses to glutamate for the same mutants. Transfected cells were pretreated with the desensitization blocker concanavalin A (10 μm for 10 min) to avoid errors associated with measurement of peak amplitude responses for rapidly desensitizing receptors. Concentration–response curves were constructed by normalizing individual steady-state responses over a range of glutamate concentrations from 1 μm to 10 mm, as appropriate for individual mutants, to the response at 10 mm glutamate, a saturating concentration (Fig. 2C). We found, in general agreement with the changes in the response kinetics, that mutations at site 1 produced larger shifts in EC50 than mutations at site 2 (Fig. 2D). Wild-type GluR6 had an EC50 of 37.5 ± 2.2 μm, whereas the three mutants that had the largest effects on the rates of deactivation and recovery from desensitization (Fig. 2E) also produced the largest rightward shifts in the EC50 for glutamate (Table 3). The K456A mutant, for example, showed a nearly 20-fold rightward shift (EC50, 726 ± 5.7 μm). Overall, shifts in EC50 for kainate receptor mutants showed a clear trend with the largest changes occurring for receptors with the fastest kinetics of deactivation and recovery from desensitization (Fig. 2F). Surprisingly, there was also a modest correlation of changes in EC50 with the rate of onset of desensitization (Fig. 2G), but this was much less pronounced than for recovery from desensitization (Fig. 2F).
AMPA receptor gain of function mutants
AMPA receptors typically have much faster kinetics of recovery from desensitization, and generally lower affinity for glutamate than kainate receptors (Dingledine et al., 1999). We wanted to test whether this is, in part, the result of the absence of these interdomain contacts formed by sites 1 and 2 in kainate receptors. Comparison of the structures of GluR2 and GluR6 show that there are two key amino acid differences in the interdomain interaction sites. In site 1, Asp656 is replaced by a serine, and in site 2, Asp462 is replaced by an alanine (Fig. 3). In addition, the extent of domain closure for GluR2 is nearly 6° less than for GluR6 (Mayer, 2005), and as a result, it seems plausible that the formation of energetically favorable contacts between helix F and loop 2 would be reduced in AMPA receptors. To address these issues, we crystallized the ligand-binding core of the GluR2 A455E/S652D double mutant in complex with glutamate and solved its structure at 1.54 Å resolution (Table 1). In an attempt to generate AMPA receptor gain of function mutants we introduced the missing Asp side chains into sites 1 and 2 in full-length receptors. We also examined the effect of extending the length of the side chain at site 2 by making the A455E mutant in full-length GluR2.
Figure 3.
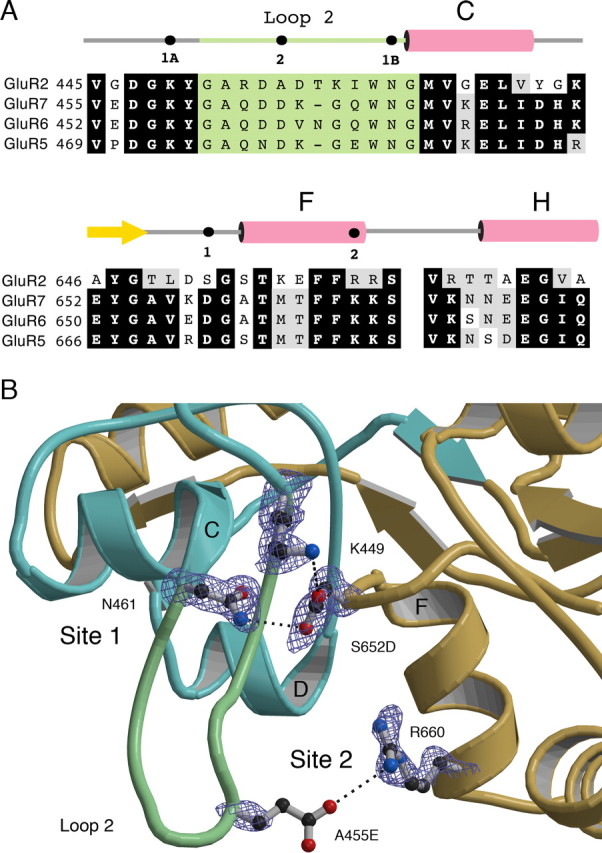
Interdomain contacts in wild-type and mutant GluR2 ligand binding cores. A, Amino acid sequence alignments for GluR2, GluR5, GluR6, and GluR7. Black and gray boxes indicate identical residues and conservative substitutions; residues forming loop 2 are shaded in green. The secondary structure above the alignment is for GluR6 and indicates the location of helices C, F, and H (pink) and β-strand 9 (yellow). Filled circles indicate the locations of sites 1A, 1B, and 2. B, SigmaA-weighted Fo–Fc omit electron density map at 1.54 Å contoured at 2.5 ς for the GluR2 A455E/S652D mutant ligand-binding core. Atoms for the side chains drawn in ball-and-stick notation were omitted from the Fc calculation. Dashed lines indicate hydrogen bonds and ion pair interactions. There was no density for the A455E side chain beyond Cβ. The ribbon diagram is oriented and colored as in Figure 1B.
The GluR2 A455E/S652D mutant crystals were isomorphous with those for wild-type GluR2 and contained three molecules in the asymmetric unit. A least-squares superposition using Cα carbon atoms for the mutant and wild-type subunits, excluding loops 1 and 2, gave root mean square deviation (rmsd) values of 0.19, 0.17, and 0.22 Å for the three molecules, indicating that there was essentially no change in 2° structure produced by the mutations. By comparison, rmsd values for superposition of wild-type chains B and C on chain A of the wild-type protein were 0.56 and 0.37 Å, with values of 0.53 and 0.26 Å for the same set of superpositions using mutant protein coordinates; these larger values result from subtle differences in the conformation of the three molecules in the asymmetric unit. Analysis of the extent of domain closure for the mutant protein revealed a <1° difference from the values for wild-type subunits, indicating that the A455E/S652D mutation does not increase domain closure to produce a GluR6-like structure. Examination of site 1A in the A455E/S652D mutant protein reveals that replacement of serine by aspartate supports formation of a salt bridge with Lys449 (Fig. 3B). The mean bond distance, 3.36 Å, is longer than the 2.85 Å value found in the GluR6 structures (Table 2), but well within the range for an energetically favorable contact (Kumar and Nussinov, 2002). As a result, the interaction is much more favorable than for wild-type GluR2, for which the mean distance between the Lys449 NZ and Ser652 OG atoms is 4.2 Å, too long for hydrogen bond formation. For site 1B, introduction of the aspartate side chain permits Asn461 to act as a hydrogen bond donor and again produces a closer contact (mean distance 3.40 Å) than observed for the interaction between Ser652 with Asn461 in wild-type GluR2, for which the mean separation is 4.04 Å.
For site 2, the glutamate side chain that replaced the alanine at position 455 was not well ordered, and in omit maps there was no electron density beyond Cβ despite data collected to a resolution of 1.54 Å (Fig. 3B). This is strikingly different from the situation for kainate receptors and likely occurs because the A455E mutant side chain adopts multiple conformations. Comparison of the amino acid sequence for loop 2 of AMPA and kainate receptors, in conjunction with the crystal structures, reveals arginine and lysine residues at positions 453 and 458 near the tip of loop 2 in GluR2. In kainate receptors, these residues are replaced by glutamine and glycine, respectively. It is plausible that in AMPA receptors these basic amino acids provide alternate binding sites within domain 1 for the side chain of the A455E mutant, and we propose that these compete with Arg660 on helix F, destabilizing the contact with domain 2.
Our analysis also revealed that for the GluR2 A455D/S652D mutant, the main chain between Asp651 and Gly653 changes conformation in the A and B subunits compared with the wild-type structure, resulting in formation of additional solvent-mediated and direct hydrogen bonds between domains 1 and 2 as a result of a flip of the peptide bond connecting Asp651 with Asp652, as first described by Armstrong and Gouaux (2000).
Introduction of acidic residues at sites 1 and 2 slows deactivation and recovery from desensitization
To test the functional effects of introduction of acidic residues at sites 1 and 2 of GluR2, we used identical techniques as for GluR6 to investigate changes in receptor kinetics. At site 1, mutation of the serine side chain of residue 652 to the aspartate found in kainate receptors resulted in a threefold slowing of the time constant of deactivation (0.78 ± 0.11 ms, n = 12 for GluR2-wt vs 2.18 ± 0.18 ms, n = 12 for S652D; p < 0.001) (Fig. 4A,B). At site 2, mutation of the alanine at residue 455 to aspartate also significantly slowed the deactivation time constant, but to a slightly lesser extent than the mutation at site 1 (1.85 ± 0.23 ms; n = 12; p < 0.001). Extension of this acidic side chain by replacing the aspartate with a glutamate residue lessened the effect on deactivation, although it still resulted in a receptor that deactivated more slowly than wild-type GluR2 (0.78 ± 0.11 ms versus 1.25 ± 0.18 ms; n = 10). To test whether the effects of the two mutations were additive, we combined the site 1 mutation with each of the site 2 mutations. For both of these double mutations, the time constant of deactivation relative to both wild-type GluR2 and the single mutations was dramatically increased. For A455E/S652D the deactivation rate was 2.73 ± 0.17 ms, (p < 0.001 vs wt and vs A455E). For A455D/S652D the rate was even slower at 3.03 ± 0.11 ms (p < 0.001 vs wt and vs A445D; p < 0.01 vs S652D), indicating that sites 1 and 2 act independently.
Figure 4.
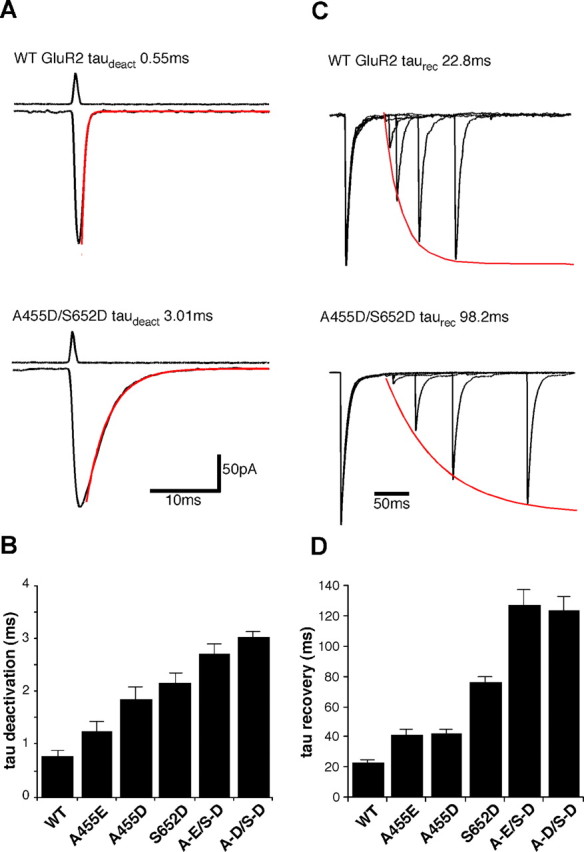
Deactivation and recovery from desensitization for wild-type GluR2 and gain of function mutants. A, Macroscopic currents recorded from outside-out patches for wild-type GluR2 and the A455D/S652D double mutant. Single exponential fits are shown in red. The top traces show open tip responses. B, Bar plot showing time constant of deactivation for wild-type GluR2 and five mutants. C, Superimposed responses from 50 ms applications of 10 mm glutamate separated by varying time intervals to show recovery from desensitization for wild-type GluR2 and the A455D/S652D double mutant. Currents were normalized to the peak of the first response and the peaks of the second were then fitted with a single exponential shown in red. D, Bar plot showing the time constant for recovery from desensitization for wild-type GluR2 and five mutants.
In contrast to the effects of GluR2 mutations on the rate of deactivation, the impact on the rate of onset of desensitization was minimal, and none of the five mutations produced a significant difference in the time constant of desensitization (Fig. 5E). The rate of recovery from desensitization, however, was slowed in all three single mutants, consistent with a reduction in stability of the glutamate bound complex. Once again the S652D mutation at site 1 produced the largest functional effect, slowing the time constant for recovery from desensitization more than threefold versus wild-type GluR2 (Fig. 4C,D). The A455D mutant produced a more modest, but still significant, twofold slowing of recovery (p < 0.05), whereas the value for A455E was again very close to that for A455D, showing that the additional length of glutamate over aspartate at the 455 side chain does not have any further effect. The A455D/S652D and A455E/S652D double mutants each slowed recovery to an even greater extent than any single mutants, to 124.2 ± 8.9 and 127.2 ± 10.1 ms, respectively, versus 22.9 ± 2.1 ms for wild-type GluR2.
Figure 5.

GluR2 EC50 for glutamate is correlated with receptor kinetics. A, Macroscopic currents recorded from wild-type GluR2 and the S652D mutant in response to varying concentrations of glutamate in the presence of 100 μm cyclothiazide. The concentration of glutamate is given in micromolars above the responses. B, Concentration–response analysis for wild-type GluR2 and three mutants. Current amplitudes were normalized to the response to 10 mm glutamate. Error bars are SEM for each concentration and in some cases are smaller than the symbols. Lines drawn through the data points are fits to the Hill equation. Hill coefficients were not significantly different between all receptors and ranged from 1.26 to 1.39. C, Correlation between EC50 values obtained from the concentration–response analysis shown in B and the time constant for deactivation. D, Correlation between EC50 values and the time constant for recovery from desensitization. E, Lack of correlation between EC50 values and the time constant of desensitization. Error bars for C–E show SEM and in some cases are smaller than the symbols.
Mutations at sites 1 and 2 in GluR2 also regulate sensitivity to glutamate
Because the introduction of acidic residues at sites 1 and 2 showed significant effects on the kinetics of deactivation and recovery from desensitization, and were designed to increase the stability of the interaction between domain 1 and domain 2 in the closed cleft conformation, they should also produce leftward shifts in concentration–response curves, as a result of an increase in affinity for glutamate. To determine the EC50 of each receptor for glutamate, we blocked desensitization by including 100 μm cyclothiazide in the external solution and then exposed outside-out patches or whole cells lifted from the coverslip to varying concentrations of glutamate (Fig. 5A). The result was a leftward shift in the concentration–response curve for each of the mutants (Fig. 5B). Of the single mutants, the S652D mutation showed the largest shift, to an EC50 value of 18.4 ± 1.42 μm from the wild-type GluR2 value of 66 ± 0.28 μm. Both of the site 2 mutations gave intermediate EC50 values of 37.5 ± 1.1 μm for A455E and 41 ± 0.54 μm for A455D. The double mutations produced an even greater relative shift to values of 4.4 ± 0.21 μm for A455E/S652D and 4.5 ± 0.22 μm for A455D/S652D. Noting that the degree of the shift in concentration–response curves was similar to the effects seen on receptor kinetics, we plotted the EC50 versus the time constants for deactivation, desensitization, and recovery from desensitization for each mutant and saw a strong correlation between EC50 and deactivation (r = 0.95) (Fig. 5C) and recovery (r = 0.95) (Fig. 5D), but almost no correlation between EC50 and desensitization (r = 0.08) (Fig. 5E). Although the GluR6 mutants tended to show similar correlations between apparent receptor affinity and deactivation/recovery from desensitization, the correlation in the GluR2 mutants were in comparison much stronger.
Discussion
Although AMPA and kainate receptors have very similar structures, they have strikingly different gating properties that impact their physiological role in synaptic function. Previous functional and structural studies of the GluR2 ligand binding core demonstrated that agonist affinity is determined not only by interactions between the agonist and amino acid residues from domain 1 and domain 2, but also by interdomain interactions unique to the agonist-bound state, and that these interdomain interactions are different in AMPA and kainate receptors (Armstrong and Gouaux, 2000; Mayer, 2005; Robert et al., 2005). The result of these different interactions is most likely a relatively more stable agonist-bound state in kainate receptors than AMPA receptors. Here, we show the structural and functional relevance of these interactions and their contribution to the physiological differences between two types of glutamate receptors, attributing a functional role to loop 2 of domain 1 that had not been described previously. As a result of these interactions between loop 2 and helix F of domain 2, we propose that agonist dwell time at the receptor is increased in kainate receptors, which limits the rates of both receptor deactivation and recovery from desensitization. Without these interactions, AMPA receptors have a shorter agonist dwell time and are tuned for faster kinetics. We demonstrate this by showing that the GluR6 subtype of kainate receptor had reduced sensitivity to glutamate and showed accelerated deactivation and recovery from desensitization when we disrupted the interdomain interactions. Conversely, introduction of these sites in the AMPA receptor GluR2 subunit increased sensitivity to glutamate >15-fold and significantly slowed both the rate of deactivation and recovery from desensitization, most likely by creating a more stable receptor-glutamate complex, like that found in some kainate receptors.
Structural observations
We initially identified sites 1 and 2 by comparing the crystal structures of the closed-cleft glutamate-bound forms of AMPA and kainate receptors with the open-cleft GluR2 apo structure (Armstrong and Gouaux, 2000; Mayer, 2005). Although the structure of an apo form of a kainate receptor has not been reported, the recent crystallization of GluR5 competitive antagonist complexes provides a second reference point for an open-cleft structure (Mayer et al., 2006). In this series of structures, we found that when residues in domain 1 are aligned by least squares superposition, the Cα positions of the residues forming sites 1 and 2 in domain 2, D656 and K664 in GluR6, move outwards by 9.47 Å and 7.95 Å, respectively, during the transition from the glutamate- to antagonist-bound forms. For AMPA receptors, the equivalent residues move 7.09 Å and 6.40 Å during the transition from the glutamate bound complex to the apo form. As a result of these large movements, intramolecular bonds between the side chains forming sites 1 and 2 can only be formed in the closed cleft conformation stabilized by agonists.
In previous studies on wild-type AMPA receptors, the presence or absence of a peptide bond flip in the main chain connecting Asp651 and Gly653 was correlated with agonist affinity and was present in all three subunits for complexes with the high-affinity agonist AMPA, but only one of three subunits for glutamate, and was absent for the low-affinity partial agonist kainate, for antagonists and the apo state (Armstrong and Gouaux, 2000). Our results with the GluR2 A455D/S652D mutant suggest that the probability of the peptide bond flip is a function of stability of the agonist-bound state independent of whether this is controlled by ligand receptor interactions, or contacts between domains 1 and 2 that are formed as a result of agonist-stabilized domain closure. In the GluR5 and GluR6 kainate receptor complexes with glutamate, the peptide bond is flipped in all of the structures solved to date and, thus, in this context the GluR2 A455D/S652D mutant produces a more kainate receptor-like conformation.
Comparison of GluR2 and GluR6 mutations with previous studies
The majority of the functional effects we observed here are consistent with results from previous studies that altered interdomain interactions in glutamate receptors and support the hypothesis that the stability of the agonist-bound closed-cleft conformation is a critical determinant of the kinetics of deactivation and recovery from desensitization. The T686 mutations in GluR2 were shown to speed deactivation and recovery from desensitization, slow desensitization, and decrease sensitivity to glutamate, all of which can be attributed to destabilization of the closed-cleft conformation (Robert et al., 2005). Mutations at equivalent sites in GluR5 and GluR6 showed similar effects on agonist sensitivity and deactivation rates (Swanson et al., 1997). The GluR6 mutants we describe here were designed to destabilize the closed-cleft conformation, and caused similar changes in deactivation, recovery from desensitization, and affinity in GluR6 as were observed for GluR2 T686 mutants. We did however observe one effect we cannot explain. GluR2 T686 mutations decreased the rate of desensitization, whereas the GluR6 mutations analyzed here consistently increased the rate of onset of desensitization and the GluR2 mutations described here produced no significant effect. The reason for this is unclear, but may be attributable to differential effects of the mutations on the relative stability of the closed-cleft active conformation and the desensitized state of the receptors, and suggests that these states may be slightly different in AMPA and kainate receptors.
Interdomain interactions account for differences in rate of deactivation but only partially for recovery from desensitization
Although our study shows that the domain 1–domain 2 interactions are a major contributor to the differences in AMPA and kainate receptor kinetics, the extent varies with the parameter considered. The differences in the rate of deactivation between wild-type AMPA and kainate receptors, which we measured to differ by approximately threefold, was modulated by mutation of interdomain contacts to the extent that mutant GluR6 receptors could be made to deactivate as fast as wild-type GluR2, whereas GluR2 mutants could be made to deactivate as slowly or even slower than wild-type GluR6, suggesting that the difference in the interdomain contacts between the two wild-type receptors is sufficient to account for their different rates of deactivation. Recovery from desensitization, however, shows over a 100-fold difference between GluR6 and GluR2 wild-type receptors. Our mutations speeded the rate of recovery for GluR6 at most fivefold, still leaving a 20-fold difference between the mutants and GluR2 wild type. GluR2 mutants’ rates of recovery were slowed also by a factor of 5, still leaving a 20-fold difference. Therefore, differences other than the interdomain interactions we investigated here must contribute to the slow rate of recovery in GluR6 compared with GluR2, and indicate that differences elsewhere in the molecule underlie the much greater stability of the desensitized state that is typical of kainate receptors. The degree to which sensitivity to glutamate was affected by our mutations is harder to compare, because the measurements were done in the presence of cyclothiazide and concanavalin A, which may affect the affinity of the receptors to different degrees (Stern-Bach et al., 1998).
Physiological role of interdomain contacts
Based on their fast deactivation and recovery from desensitization, AMPA receptors are better adapted than kainate receptors to signal at fast excitatory synapses; this is because action potential trains with short interpulse intervals should, in principle, lead to buildup of receptor desensitization in kainate receptors and, hence, strong depression of synaptic response amplitudes. The particular importance of AMPA receptor gating for fast excitatory signaling is highlighted by the degree of modulation of receptor gating by subunit expression pattern, alternative splicing of the flip and flop isoforms, and RNA editing (Seeburg, 1993; Dingledine et al., 1999). Thus, it seems feasible that with the development of fast glutamatergic synapses, interdomain interactions that stabilize the agonist-bound state would be disadvantageous, and this function may have been downregulated in AMPA receptors. In contrast, kainate receptors, which seem to perform more modulatory functions, appear to have stronger interdomain interactions, leading to higher agonist affinity but slow recovery from desensitization. In this study, we examined two sites that differ between AMPA and kainate receptors, but the crystal structures reveal numerous other contacts between domains 1 and 2 that would be expected to differ in the apo and glutamate bound conformations. Determining the extent to which these are functionally important will require a very large series of experiments, but ultimately, this information will be required to fully understand the process of iGluR activation by agonists.
Footnotes
M.C.W. and C.G. contributed equally to this work.
This work was supported by German Research Council Grant SFB-406, by the Brown Foundation (C.R.) and the intramural research program of the National Institute of Child Health and Human Development, National Institutes of Health, Department of Health and Human Services (M.L.M.). We thank Carla Glasser for technical assistance and Dr. P. Seeburg for the gift of the wild-type GluR2 and GluR6 plasmids. We thank Hui Deng for help with cell culture. Nucleic acid sequencing was performed by the National Institute of Neurological Disorders and Stroke DNA sequencing facility. Synchrotron diffraction data were collected at Southeast Regional Collaborative Access Team 22-ID beamline at the Advanced Photon Source, Argonne National Laboratory (Argonne, IL). Supporting institutions may be found at www.ser-cat.org/members.html. Use of the Advanced Photon Source was supported by the U.S. Department of Energy, Office of Science, Office of Basic Energy Sciences, under contract number W-31-109-Eng-38.
References
- Armstrong N, Gouaux E (2000). Mechanisms for activation and antagonism of an AMPA-sensitive glutamate receptor: crystal structures of the GluR2 ligand binding core. Neuron 28:165–181. [DOI] [PubMed] [Google Scholar]
- Brunger AT, Adams PD, Clore GM, DeLano WL, Gros P, Grosse-Kunstleve RW, Jiang JS, Kuszewski J, Nilges M, Pannu NS, Read RJ, Rice LM, Simonson T, Warren GL (1998). Crystallography and NMR system: a new software suite for macromolecular structure determination. Acta Crystallogr D Biol Crystallogr 54:905–921. [DOI] [PubMed] [Google Scholar]
- Chen C, Okayama H (1987). High-efficiency transformation of mammalian cells by plasmid DNA. Mol Cell Biol 7:2745–2752. [DOI] [PMC free article] [PubMed] [Google Scholar]
- Chen GQ, Cui C, Mayer ML, Gouaux E (1999). Functional characterization of a potassium-selective prokaryotic glutamate receptor. Nature 402:817–821. [DOI] [PubMed] [Google Scholar]
- Clements JD, Westbrook GL (1991). Activation kinetics reveal the number of glutamate and glycine binding sites on the N-methyl-d-aspartate receptor. Neuron 7:605–613. [DOI] [PubMed] [Google Scholar]
- Colquhoun D, Large WA, Rang HP (1977). An analysis of the action of a false transmitter at the neuromuscular junction. J Physiol (Lond) 266:361–395. [DOI] [PMC free article] [PubMed] [Google Scholar]
- Colquhoun D, Jonas P, Sakmann B (1992). Action of brief pulses of glutamate on AMPA/kainate receptors in patches from different neurones of rat hippocampal slices. J Physiol (Lond) 458:261–287. [DOI] [PMC free article] [PubMed] [Google Scholar]
- del Castillo J, Katz B (1957). Interaction at end-plate receptors between different choline derivatives. Proc R Soc Lond B Biol Sci 146: pp. 369–381. [DOI] [PubMed] [Google Scholar]
- Dingledine R, Borges K, Bowie D, Traynelis SF (1999). The glutamate receptor ion channels. Pharmacol Rev 51:7–61. [PubMed] [Google Scholar]
- Esnouf RM (1997). An extensively modified version of MolScript that includes greatly enhanced coloring capabilities. J Mol Graph Model 15:132–134. 112–113. [DOI] [PubMed] [Google Scholar]
- Geiger JR, Melcher T, Koh DS, Sakmann B, Seeburg PH, Jonas P, Monyer H (1995). Relative abundance of subunit mRNAs determines gating and Ca2+ permeability of AMPA receptors in principal neurons and interneurons in rat CNS. Neuron 15:193–204. [DOI] [PubMed] [Google Scholar]
- Hestrin S, Nicoll RA, Perkel DJ, Sah P (1990). Analysis of excitatory synaptic action in pyramidal cells using whole-cell recording from rat hippocampal slices. J Physiol (Lond) 422:203–225. [DOI] [PMC free article] [PubMed] [Google Scholar]
- Jones TA, Kjeldgaard M (1997). Electron-density map interpretation. Meth Enzymol 277:173–208. [DOI] [PubMed] [Google Scholar]
- Kleywegt GJ, Zou JY, Kjelgaard M, Jones TA (2001). Around O. In: Crystallography of biological macromolecules pp. 353–356. Dordrecht, The Netherlands: Kluwer Academic.
- Kraulis PJ (1991). MOLSCRIPT: a program to produce both detailed and schematic plots of protein structures. J Appl Cryst 24:946–950. [Google Scholar]
- Kumar S, Nussinov R (2002). Relationship between ion pair geometries and electrostatic strengths in proteins. Biophys J 83:1595–1612. [DOI] [PMC free article] [PubMed] [Google Scholar]
- Mayer ML (2005). Crystal structures of the GluR5 and GluR6 ligand binding cores: molecular mechanisms underlying kainate receptor selectivity. Neuron 45:539–552. [DOI] [PubMed] [Google Scholar]
- Mayer ML, Armstrong N (2004). Structure and function of glutamate receptor ion channels. Annu Rev Physiol 66:161–181. [DOI] [PubMed] [Google Scholar]
- Mayer ML, Ghosal A, Dolman NP, Jane DE (2006). Crystal structures of the kainate receptor GluR5 ligand binding core dimer with novel GluR5-selective antagonists. J Neurosci 26:2852–2861. [DOI] [PMC free article] [PubMed] [Google Scholar]
- Merrit EA, Bacon DJ (1997). Raster3D: photorealistic molecular graphics. Methods Enzymol 277:505–524. [DOI] [PubMed] [Google Scholar]
- Otwinowski Z, Minor W (2001). Denzo and Scalepack. International Tables for Crystallography 226–235. F.
- Pan ZZ, Tong G, Jahr CE (1993). A false transmitter at excitatory synapses. Neuron 11:85–91. [DOI] [PubMed] [Google Scholar]
- Patneau DK, Mayer ML, Jane DE, Watkins JC (1992). Activation and desensitization of AMPA/kainate receptors by novel derivatives of willardiine. J Neurosci 12:595–606. [DOI] [PMC free article] [PubMed] [Google Scholar]
- Raman IM, Trussell LO (1992). The kinetics of the response to glutamate and kainate in neurons of the avian cochlear nucleus. Neuron 9:173–186. [DOI] [PubMed] [Google Scholar]
- Raman IM, Trussell LO (1995). The mechanism of alpha-amino-3-hydroxy-5-methyl-4-isoxazolepropionate receptor desensitization after removal of glutamate. Biophys J 68:137–146. [DOI] [PMC free article] [PubMed] [Google Scholar]
- Robert A, Armstrong N, Gouaux JE, Howe JR (2005). AMPA receptor binding cleft mutations that alter affinity, efficacy, and recovery from desensitization. J Neurosci 25:3752–3762. [DOI] [PMC free article] [PubMed] [Google Scholar]
- Seeburg PH (1993). The molecular biology of mammalian glutamate receptor channels. Trends Neurosci 16:359–365. [DOI] [PubMed] [Google Scholar]
- Silver RA, Traynelis SF, Cull-Candy SG (1992). Rapid-time-course miniature and evoked excitatory currents at cerebellar synapses in situ. Nature 355:163–166. [DOI] [PubMed] [Google Scholar]
- Stern-Bach Y, Russo S, Neuman M, Rosenmund C (1998). A point mutation in the glutamate binding site blocks desensitization of AMPA receptors. Neuron 21:907–918. [DOI] [PubMed] [Google Scholar]
- Swanson GT, Gereau RWt, Green T, Heinemann SF (1997). Identification of amino acid residues that control functional behavior in GluR5 and GluR6 kainate receptors. Neuron 19:913–926. [DOI] [PubMed] [Google Scholar]
- Zhang S, Trussell LO (1994). Voltage clamp analysis of excitatory synaptic transmission in the avian nucleus magnocellularis. J Physiol (Lond) 480:123–136. [DOI] [PMC free article] [PubMed] [Google Scholar]