

Abstract
Ca2+ stores were studied in a preparation of freshly dissociated terminals from hypothalamic magnocellular neurons. Depolarization from a holding level of −80 mV in the absence of extracellular Ca2+ elicited Ca2+ release from intraterminal stores, a ryanodine-sensitive process designated as voltage-induced Ca2+ release (VICaR). The release took one of two forms: an increase in the frequency but not the quantal size of Ca2+ syntillas, which are brief, focal Ca2+ transients, or an increase in global [Ca2+]. The present study provides evidence that the sensors of membrane potential for VICaR are dihydropyridine receptors (DHPRs). First, over the range of −80 to −60 mV, in which there was no detectable voltage-gated inward Ca2+ current, syntilla frequency was increased e-fold per 8.4 mV of depolarization, a value consistent with the voltage sensitivity of DHPR-mediated VICaR in skeletal muscle. Second, VICaR was blocked by the dihydropyridine antagonist nifedipine, which immobilizes the gating charge of DHPRs but not by Cd2+ or FPL 64176 (methyl 2,5 dimethyl-4[2-(phenylmethyl)benzoyl]-1H-pyrrole-3-carboxylate), a non-dihydropyridine agonist specific for L-type Ca2+ channels, having no effect on gating charge movement. At 0 mV, the IC50 for nifedipine blockade of VICaR in the form of syntillas was 214 nm in the absence of extracellular Ca2+. Third, type 1 ryanodine receptors, the type to which DHPRs are coupled in skeletal muscle, were detected immunohistochemically at the plasma membrane of the terminals. VICaR may constitute a new link between neuronal activity, as signaled by depolarization, and a rise in intraterminal Ca2+.
Keywords: internal stores, presynaptic, sparks, magnocellular neurons, voltage, Ca2+ channels
Introduction
In common with virtually every cell type, neurons contain intracellular Ca2+ stores from which Ca2+ can be discharged into the cytosol through intracellular Ca2+ release channels. Although there has been considerable interest in Ca2+ stores located postsynaptically, those in nerve terminals have received scant attention until recently (Berridge, 1998; Melamed-Book et al., 1999; Llano et al., 2000; Suzuki et al., 2000; Emptage et al., 2001; Sharma and Vijayaraghavan, 2003). Now it has become clear that Ca2+ stores in nerve terminals are involved in physiological processes such as long-term potentiation (Lauri et al., 2003) and long-term depression (Unni et al., 2004) as well as pathophysiological states such as spinal cord injury (Ouardouz et al., 2003). The mechanisms for mobilizing Ca2+ from stores is not known in many cases, and it is often simply assumed that calcium-induced Ca2+ release (CICR) arising from Ca2+ influx is responsible or that CICR is the sole mobilizing mechanism for ryanodine-sensitive stores in neurons (Bouchard et al., 2003; Collin et al., 2005).
Recently, we demonstrated short-lived focal Ca2+ transients mediated by the class of Ca2+ release channels known as ryanodine receptors (RyRs) in freshly dissociated magnocellular nerve terminals (De Crescenzo et al., 2004). These neurohypophyseal terminals are a favorable preparation because they are relatively large and are isolated without an accompanying postsynaptic structure (Lemos and Nowycky, 1989; Neher, 1998). Because these Ca2+ transients closely resemble Ca2+ sparks in muscle, in both their time course and quantity of Ca2+ released, they were designated Ca2+ syntillas [scintilla (Latin for “spark”) in a nerve terminal, typically a synaptic structure]. Using whole-cell, tight-seal voltage clamp, we also demonstrated for the first time that depolarization in the absence of extracellular Ca2+ either increased syntilla frequency or caused an increase in global [Ca2+]. This process, which had not been observed previously in any cell type other than muscle, we designate as voltage-induced Ca2+ release (VICaR). We now ask which proteins provide the voltage sensors in the plasma membrane for VICaR and which serve to release the Ca2+ from the stores into the cytosol. That is, what are the sensors and effectors for VICaR? In our previous study, we showed that both spontaneous syntillas and VICaR were ryanodine sensitive, indicating that RyRs serve at least as one of the effectors of VICaR.
Here we provide evidence that the voltage sensors for VICaR in the plasma membrane in terminals of hypothalamic neurons are dihydropyridine receptors (DHPRs). Moreover, it appears that the DHPRs are linked to type 1 RyRs in a manner bearing similarities to the mechanism in skeletal muscle. Comparison with another excitatory secretory cell, the chromaffin cell, suggests that VICaR demands the presence of type 1 RyRs. This study provides us with information about the molecular machinery of VICaR in neurons, a process that may constitute a new link between neuronal activity, as signaled by depolarization of the plasma membrane, and a rise in Ca2+ in nerve terminals.
Materials and Methods
Electrophysiology and calcium imaging.
Isolated nerve terminals from adult Swiss Webster mouse hypothalamic neurons were patched in “whole-terminal” configuration (De Crescenzo et al., 2004). Pipette solution contained the following (in mm): 0.05 K5fluo-3 (Invitrogen, Carlsbad, CA), 135 KCl, 2 MgCl2, 30 HEPES, 4 MgATP, and 0.3 Na-GTP, pH 7.2. Ca2+-free bath solution contained the following (in mm): 135 NaCl, 5 KCl, 10 HEPES, 10 glucose, 0.2 EGTA, and 1 MgCl2, pH 7.2. For Ca2+-containing bath solution, calcium was added (2.2 mm) and EGTA was omitted. Nifedipine, cadmium, and FPL 64176 (methyl 2,5 dimethyl-4[2-(phenylmethyl)benzoyl]-1H-pyrrole-3-carboxylate) (FPL) (from Sigma, St. Louis, MO) were applied by a puffer pipette for 4–8 min before recording commenced. Fluorescence images using fluo-3 as a calcium indicator were obtained using a custom-built wide-field, high-speed digital imaging system described in detail previously (ZhuGe et al., 1999; De Crescenzo et al., 2004). The terminals were imaged using a Nikon (Tokyo, Japan) 100×, 1.3 numerical aperture (NA) oil immersion lens, giving a pixel size of 133 nm at the specimen, with a shutter to control exposure duration. Rapid imaging at 50 Hz (exposure, 10 ms) was performed for 4 s at a time. Two measures of Ca2+ were used: one to quantify the total amount of Ca2+ released per syntilla as determined by its “signal mass” (Sun et al., 1998; ZhuGe et al., 2000), and another, ΔF/F0, to assess mean increase in global [Ca2+].
Immunocytochemistry.
Axon terminals, isolated as described above and plated onto poly-l-lysine-coated coverslips were fixed and permeabilized (0.1 m ethanolamine in PBS plus 0.1% Triton X-100, pH 8) and then immunolabeled as described previously (De Crescenzo et al., 2004). Polyclonal rabbit antibodies (Abs) for RyRs were generated using the following epitopes: RREGPRGPHLVGPSRC for RyR1 (Mitchell et al., 2003) and KAALDFSDAREKKKPKKDSSLSAV for RyR2 (Tunwell et al., 1996). These sequences are unique to RyR1 and RyR2, respectively, in rabbit, human, and mouse (see Fig. 7). For these antisera, preimmune rabbit serum was used as a control. The polyclonal rabbit anti-RyR3 antibody was developed against purified glutathione S-transferase fusion protein corresponding to the region of low homology between the transmembrane domains 4 and 5 of RyR3 and run through an affinity-purification column (Giannini et al., 1995). For the N-type channel, affinity-purified goat antibody was used (CP α-1B; Santa Cruz Biotechnology, Santa Cruz, CA). For the latter two polyclonals, purified IgG (Jackson ImmunoResearch, West Grove, PA) was used as control (see Fig. 6). The antibodies for the three RyRs are the same ones used in a previous study on mouse chromaffin cells (ZhuGe et al., 2006). Because the RyR1 antiserum is critical for this study, we confirmed its specificity with a Western blot performed as described previously (Zissimopoulos and Lai, 2005). For each immunocytochemical preparation, neurohypophyseal terminals from six mice were pooled together. Three preparations were made for imaging RyR1 and an additional two for RyR2 and RyR3, each with its own control. Hundreds of stained terminals were viewed in each preparation, and the results, as shown in Figure 6, are representative of images fully analyzed (as explained in Fig. 1) from 15 typical terminals. Another preparation was used with double staining for either RyR1 and N-type channels or RyR2 and N-type channels. The results from these experiments, as shown in Figure 7, derived from fully analyzed images typical of hundreds observed.
Figure 7.
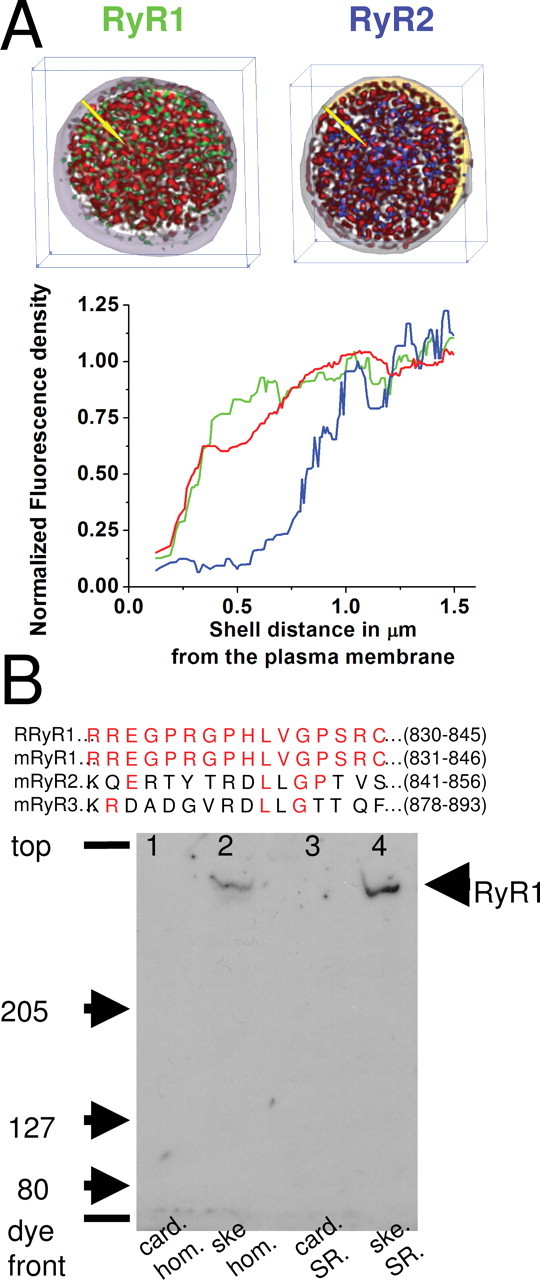
Distribution of type 1 RyR. A, Top, Images show two typical three-dimensional nerve terminal reconstructions approximately ∼3 μm in thickness. In each image, distribution of N-type Ca2+ channels is shown in red; the outer extent of this distribution serves as an unambiguous marker for the plasma membrane. In the left image, green label marks type 1 RyRs, and, in the right image, blue label marks type 2 RyRs. Bottom, The graph provides the average distribution of immunofluorescence for type 1 (green; n = 4) and type 2 (blue; n = 3) RyRs and N-type Ca2+ channels (red; n = 7) in concentric shells from the surface. (The yellow arrows in the images above indicate the direction that the shells are layered with respect to the surface, i.e., normal to it.) The graphs have been corrected for nonspecific fluorescence in each shell using preimmune serum with the techniques outlined in Materials and Methods and Figure 1. The RyR1s are located close to the surface. B, Top, Peptide sequence from which anti-RyR1 was generated. The 15 amino acid sequence common to rabbit (R) and mouse (m) was used to generate the antisera for RyR1. For comparison, the homologous sequence for mouse RyR2 and mouse RyR3 are shown with common amino acids in red. Bottom, Immunoblot analysis of cardiac (card) and skeletal (ske) muscle crude homogenate (hom) and SR vesicle preparations using the RyR1 epitope-specific antisera (1:1000 dilution) after SDS-PAGE and protein electrophoretic transfer to polyvinylidene fluoride membrane. For both homogenate lanes, 50 μg of protein was loaded, whereas for the SR lanes, 50 or 5 μg of protein was loaded for cardiac and skeletal SR, respectively. The major, high-molecular-weight immunoreactive band detected only in the skeletal muscle homogenate and SR vesicle lanes by the RyR1-specific antisera corresponds in mobility to that of the purified skeletal muscle ryanodine receptor.
Figure 6.

Distribution of types 1, 2, and 3 RyRs. A, Representative immunofluorescent images from control (preimmune serum) and types 1 and 2 RyRs. B, Representative immunofluorescent images from control (purified IgG) and type 3 RyR. For both A and B, each panel is an optical section (∼0.65 μm thick) through the middle z plane of the stack of images for the terminal. The left column shows the deconvolved images; the tracing around the perimeter of the terminal was drawn by eye on these images. The right column shows the corresponding images after correction as outlined in Materials and Methods and Figure 1.
Figure 1.
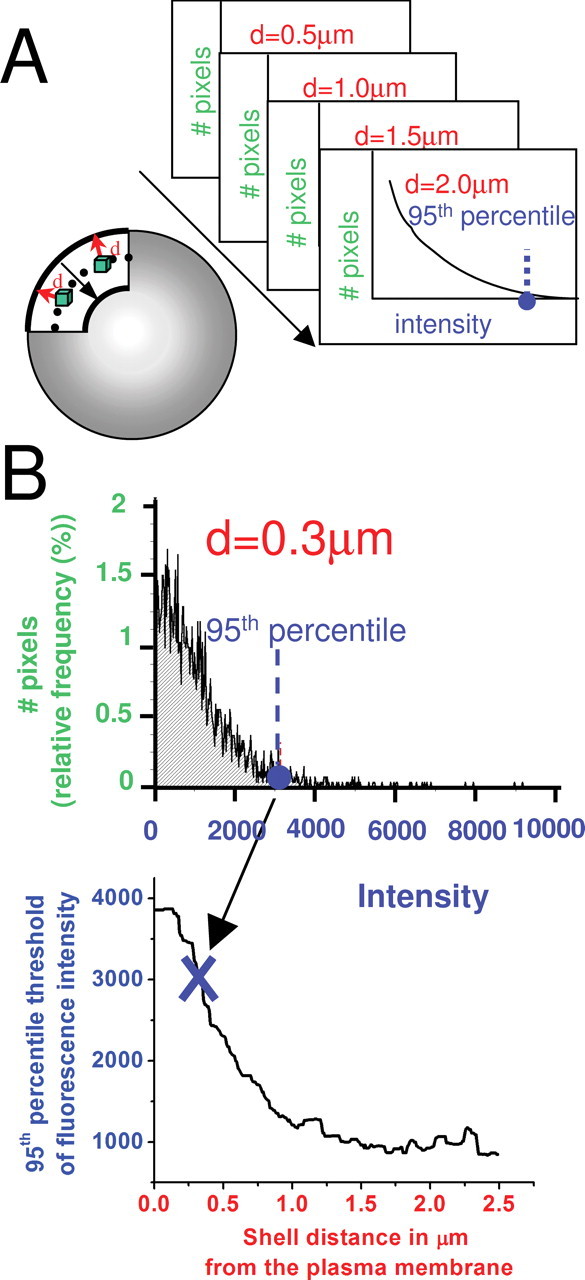
Method of correcting for nonspecific immunofluorescence. Diagrams and data in this figure are all for the immunofluorescence caused by preimmune serum (i.e., controls), which were used for corrections. A, Left, Diagrammatic representation of the concentric shells attributable to preimmune immunofluorescence for which intensity histograms were constructed. Top right, Stack of intensity histograms for all of the voxels (green in diagram at left) was constructed for each distance (d) from the surface of the cell. For each distance, intensity histograms from several (n = 7) control terminals were combined to yield a single average histogram. B. Top, Intensity histogram for the shell at a distance of 0.3 μm from the surface as an example. We took the 95th percentile of brightness from the preimmune control average at each shell (example is shown for 0.3 μm with dashed blue line), and we plotted it versus the distance from the surface of the terminal. This curve was then used to correct all data of the type shown in Figure 6A.
Three-dimensional fluorescence imaging was performed on an inverted wide-field microscope (Nikon Diaphot 200) with excitation by a 100 W mercury lamp. Images were obtained through a 60×, 1.4 NA oil immersion Plan Apo objective (Nikon) and digitally recorded on a cooled, back-thinned CDD camera (PhotoMetrics, Tucson, AZ) with an effective pixel size at the specimen of 83 nm in x–y and a z spacing of 250 nm. This resulted in a three-dimensional stack of ∼25 image planes of each terminal. Stacks were processed to remove out-of-focus fluorescence and enhanced axial resolution using custom-constrained, iterative deconvolution software (Carrington et al., 1995; Scriven et al., 2005). From those optical sections, we built a three-dimensional reconstruction of the immunostained nerve terminal.
The fluorescence from the preimmune serum control was not uniform, being especially bright near the plasma membrane. Hence, we determined the brightness of concentric shells in the control images (i.e., those attributable to immunolabeling of preimmune serum) from the edge of the terminal to the inside, as illustrated in the diagram in Figure 1A, and we did this for both preimmune controls and the immunolabeled terminal. Each shell then has its own average control intensity with preimmune serum. We take the 95th percentile of brightness from those preimmune control averages (at each shell) and plot them versus the distance from the plasma membrane. The curve obtained is represented in Figure 1B and was used to correct the data.
Data analysis.
In all cases, data are reported as mean ± SEM; n is the number of syntillas, and N the number of observations, which in most cases is the same as the number of terminals. The specific statistical tests used are found in the supplemental methods (available at www.jneurosci.org as supplemental material), and p < 0.05 was considered significant. Constrained nonlinear regression from SPSS (2003 version) was used to fit the data of Figure 2C with an expression of the form Ce(V/k) + FB, with C being a constant with units of frequency. This expression arises from a modification of a Boltzmann distribution (supplemental data, available at www.jneurosci.org as supplemental material): FV ≅ A Ps(Vo) e(V/k) + FB, where Ps(V) is very small. Here FV is syntilla frequency at a given membrane potential V; FB is basal syntilla frequency, which is independent of membrane potential; Ps(V) is the probability of the voltage sensor being in a state in which it can trigger a syntilla at a given voltage V; Vo is the value of V at which Ps(V) is 0.5; k is a slope factor; e is the base of the natural logarithm; and A is a proportionality constant. We note that FB is independent of the voltage sensor.
Figure 2.

Syntillas are increased in frequency by membrane depolarization. A, Representative images of syntillas (not successive frames) when membrane potential is held at −80 mV (top row) or after it is jumped from −80 to −60 mV (bottom row) in the presence of extracellular Ca2+. B, As shown for −80 and −60 mV, syntilla frequency data (bar graphs) are well fit by Poisson distributions (open circles connected by line) (p = 0.98 and 0.675, respectively, Kolmogorov–Smirnov test). The distributions differ with means of 1.38 (n = 47) and 2.52 (n = 58) syntillas per 2.5 s sampling interval (p = 0.023) for −80 and −60 mV, respectively. C, Top shows the voltage dependence of syntilla frequency and is characterized by the fitted expression (red line) derived from the following: A Ps(Vo) e(V/k) + FB (as defined in Materials and Methods). k is found to be 8.40 mV, with a 95% confidence level that this value lies between 7.83 and 8.98 mV (see Materials and Methods), and FB, is 0.41 s−1. Bottom shows that the average number of Ca ions released per syntilla (which is directly proportional to the signal mass) does not change as a function of membrane potential. D, Time course of changes in syntilla frequency calculated every 1.3 s to increase temporal resolution. Fluorescence is recorded in each of 18 nerve terminals four times in a row for 4 s, separated by 2 min, the latter indicated by gaps in the plots. In the first and third recordings, nerve terminals are depolarized to −70 and −60 mV (filled circles), respectively, for 2.6 s and then repolarized to −80 mV (open circles) for 1.3 s. In the second and fourth recordings, they are maintained at the holding potential of −80 mV for 4 s.
Results
VICaR in the form of Ca2+ syntillas exhibits the magnitude of voltage dependence expected for a DHPR
Syntilla frequency increased when the membrane potential was jumped from −80 to −60 mV (Fig. 2A,B). This was true not only in the presence of extracellular Ca2+ but also in its absence, and the magnitude of the effect was the same under both conditions (supplemental Fig. 1, available at www.jneurosci.org as supplemental material) (De Crescenzo et al., 2004). Moreover, even in the presence of extracellular Ca2+, no increase in global [Ca2+] was found during depolarization over the voltage range from −80 to −60 mV. Finally, low-voltage-activated Ca2+ channels (i.e., T-type channels) are not found in these hypothalamic nerve terminals in rat, although every other major class of voltage-gated Ca2+ channel is present (Wang et al., 1997, 1999). For all these reasons, the increase in syntilla frequency cannot be attributed to Ca2+ influx and subsequent CICR. Because the increase was also seen in the presence of extracellular Ca2+ over this range of potentials, a mechanism involving Na+ influx through Ca2+ channels cannot be invoked. The absence of Na+ involvement is supported by the fact that current–voltage plots of the voltage-activated Na+ current show no detectable current at potentials below −40 mV (data not shown) (Wang et al., 1992). The same sort of increase in frequency during depolarization over this range of potentials is found for Ca2+ sparks in amphibian skeletal muscle (Klein et al., 1996).
The number of syntillas per observation period was well fit by a discrete Poisson distribution at all potentials between −80 and −60 mV. Examples of such fits are exemplified (Fig. 2B) for the two potentials at the extremes of the range examined, −80 and −60 mV. This is consistent with a view of syntillas as independent events with a stochastic activation process over this range of potentials, as seen for sparks in skeletal muscle (Klein et al., 1996). Moreover, as expected for such a process, the percentage of observation periods in which there were failures, i.e., no syntillas, decreased at −60 mV (Fig. 2B). It was not possible to extend this sort of observation to more positive potentials because the increase in syntilla frequency started to give way to global increases in [Ca2+] (see below).
The increase in frequency during depolarization (Fig. 2C) was well characterized by an exponential function, given in the legend to Figure 2C, with an e-fold increase per 8.40 mV of depolarization and a basal frequency of 0.41 s−1, which is independent of voltage. In determining such a fit, the basal frequency or asymptote in Figure 2C is constrained by two experimental facts. First, on a hyperpolarizing jump from −80 to −95 mV, there was no additional decrease in the syntilla rate (data not shown). Second, when the voltage-sensitive component is eliminated by saturating concentrations of nifedipine during depolarization to 0 mV (see below and Fig. 4), the frequency is reduced to the basal frequency at −80 mV. For comparison, the voltage sensitivity at negative potentials of DHPR-mediated release of Ca2+ from stores in amphibian skeletal muscle as measured by gating charge movement is 7.7 ± 0.6 mV (Shirokova et al., 1995). This is in general agreement with our results, which might be expected, because it has been reported that the same DHPR α isoform found in skeletal muscle (α1S) is expressed in rat magnocellular neurons (Mutsuga et al., 2004). Moreover, in skeletal muscle, DHPRs serve as voltage sensors for VICaR by reason of voltage-induced conformational changes that give rise to gating currents. Such gating charge movements are detected in skeletal muscle over the negative range of potentials shown in Figure 2, which are below the threshold for Ca2+ current through the small fraction of DHPRs that conduct Ca2+ in skeletal fibers (Schwartz et al., 1985). These qualitative and quantitative similarities between VICaR in nerve terminals and in skeletal muscle suggest that dihydropyridine-sensitive membrane proteins function as voltage sensors in both cases.
Figure 4.

Effect of nifedipine concentration on Ca2+ syntillas. Top, Ca2+syntilla frequency recorded in nerve terminals depolarized to 0 mV for 3.6 s in the absence of extracellular Ca2+ with various doses of nifedipine (open triangles). n = 19, 12, 7, 9, and 11 for 0.1, 0.5, 1, 5, and 10 μm nifedipine, respectively. Filled triangle represents syntilla frequency in the absence of nifedipine after depolarization to 0 mV (n = 7); filled circle is the frequency in the absence of nifedipine at holding potential −80 mV (n = 8). Inset is the data only for the last 2.4 s of the 3.6 s period of depolarization. Bottom, The average number of Ca ions released per syntilla was the same at −80 mV (n = 28) and 0 mV (n = 48) in the absence of nifedipine (filled bars; p = 0.35) and at 0 mV at the highest concentration (10 μm) of nifedipine (open bar; n = 17; p = 0.9). (For this analysis only, those terminals responding to depolarization with an increase in syntilla frequency were included, making it likely that the IC50 of nifedipine is overestimated, on the assumption that the terminals that yielded a global increase did so in part because their syntilla frequency was higher.)
Finally, the time course of VICaR is of importance in determining the mechanism at work. Figure 2D shows the time course of alteration in syntilla frequency during depolarization and subsequent repolarization. The change during a shift in potential occurs on a subsecond timescale. In addition to the well recognized mechanism of VICaR in skeletal muscle, there is some evidence that DHPRs can be coupled to G-proteins, for example in cultured skeletal myocytes, and act via a second messenger. The time course of this effect is quite slow, however, on the order of tens of seconds after tetanic stimulation (Araya et al., 2003). The rapid onset of VICaR and its rapid termination in Figure 2D do not appear consistent with this sort of G-protein-mediated effect (see Discussion).
Whereas the frequency of syntillas increased with depolarization (Fig. 2C, top), the mean number of Ca ions released per syntilla, which is directly proportional to the peak signal mass, was not altered by depolarization (Fig. 2C, bottom). In addition, the mean number of Ca ions per syntilla was not affected by the presence or absence of extracellular Ca2+ (De Crescenzo et al., 2004). Hence, over this range of potentials, the syntilla functions as a quantal release of Ca2+ whose frequency is increased by depolarization independently of Ca2+ influx.
The dihydropyridine antagonist nifedipine blocks VICaR
Nifedipine acts on DHPRs by immobilizing their gating charge, thus serving as an “antagonist” of those DHPRs that conduct Ca2+, i.e., L-type Ca2+ channels. This action also makes nifedipine an excellent and well studied uncoupler of excitation from contraction in skeletal muscle, in which the movement of the charge-bearing DHPR “gate” by depolarization appears to provide the mechanical displacement to interact with the RyR. The interaction is assumed to be allosteric; that is, the voltage sensors act at a contact site on the release channel and thereby alter the properties of the RyR protomers, leading to their cooperative opening or closing (Rios and Brum, 1987; Rios et al., 1993; Proenza et al., 2002). Because nifedipine, like other dihydropyridines, is more effective at less negative potentials, we first examined its effects at 0 mV (Bean, 1984). The responses to a depolarization from −80 to 0 mV (Fig. 3) took the form of either an increase in syntilla frequency or an increase in global [Ca2+]. The latter, which occurred 43% of the time, is illustrated by the images of Figure 3A. The time derivative of the global increase provides an index of net Ca2+ influx into the cytosol and is shown in supplemental Figure 2 (available at www.jneurosci.org as supplemental material). An early rapid net influx is evident, followed by a later, slower phase, and the response closely follows the time course of the stimulus (see Discussion). In the remaining cases, the terminals responded to depolarization with an increase in syntilla frequency. To examine the effects of nifedipine, we grouped all responses, both syntillas and increases in global [Ca2+], and used the traditional measure, ΔF/F0, an index of cytosolic Ca2+ concentration, to measure the Ca2+ released from stores (Fig. 3B). In the absence of extracellular Ca2+ (200 μm EGTA added), nifedipine (500 nm) greatly decreased the release of Ca2+ from stores (Fig. 3A) (supplemental Fig. 2, available at www.jneurosci.org as supplemental material). The time derivative of these traces, shown in supplemental Figure 2 (available at www.jneurosci.org as supplemental material), discloses an early rapid net influx followed by a later, slower phase; both are attenuated by nifedipine. With normal extracellular [Ca2+] but in the presence of Cd2+ to block Ca2+ influx (Fig. 3B) (supplemental Fig. 2, available at www.jneurosci.org as supplemental material), the effect of nifedipine was the same.
Figure 3.

Effects of nifedipine on VICaR in the absence and presence of extracellular Ca2+. A, The effect of 500 nm nifedipine on VICaR in the absence of extracellular Ca2+ with 200 μm EGTA added to the extracellular solution. Each row of images is taken before (first image in each row) the jump in membrane potential from −80 to 0 mV and at various times during 1800 ms at 0 mV (remaining images). Top two rows show images in the absence of extracellular Ca2+ (with 200 μm EGTA) under control conditions (first row) and after exposure to 500 nm nifedipine (second row). Rows three and four are the same but in the presence of 2.2 mm Ca2+ with 200 μm Cd2+ without EGTA. B, Traces on the left show time course of ΔF/F0 (mean ± SE) during depolarization from −80 to 0 mV in Ca2+-free solution in the absence (black; n = 14) and presence (blue; n = 16) of nifedipine. ΔF/F0 is calculated from the fluorescence intensity measured in the whole nerve terminal for each image taken every 20 ms. The red arrow indicates the time when the potential is jumped to 0 mV, which was 200 ms after the beginning of the recording. The traces on the right show the effect of nifedipine (500 nm) on VICaR in the presence of normal extracellular Ca2+ with 200 μm Cd2+ present to block Ca2+ influx (n = 14 and 29, without and with nifedipine) using the same conventions and experimental paradigm as the traces on the left. The average ΔF/F0 taken over the final 0.5 s of the traces is decreased in the absence of Ca2+ (left) from 0.78 ± 0.24 to 0.10 ± 0.03 (n = 14 and 16, respectively; p = 0.016) and in the presence of Ca2+ and Cd2+ (right) from 1.34 ± 0.49 to 0.21 ± 0.09 (n = 14 and 29, respectively; p = 0.0004.).
We also examined the effects of nifedipine at 0 mV in those instances in which depolarization caused only an increase in syntilla frequency. We first note that the mean amount of Ca2+ released per syntilla was not significantly different at −80 and 0 mV (p = 0.35, Mann–Whitney test; n = 28 and 48, respectively) (Fig. 4, bottom, filled bars). Hence, the quantum of Ca2+ represented by syntillas elicited at 0 mV was similar to that of the syntillas over the negative range of potentials in Figure 2. Nifedipine blocked the voltage-dependent increase in syntilla frequency (Fig. 4). The IC50 was smaller when we examined the syntilla frequency in the final two-thirds of the 3.6 s observation period at 0 mV (inset at top right). This is to be expected given the use dependence of the dihydropyridines (Bean, 1984). At the highest concentrations of nifedipine, the frequency was reduced to approximately the same level as the spontaneous rate observed at −80 mV (filled circle) and designated as FB in the formulation given in the legend. This is consistent with the identification of FB as a frequency independent of the voltage sensor, resulting from independent, “spontaneous” activity of the effector (i.e., RyR) or from a population of effectors not under the control of the sensor. In terms of the modified Boltzmann expression in the legend for Figure 2, FB is the limiting value of FV at very negative voltages. Also consistent with this interpretation, hyperpolarizing steps from −80 to −95 mV in the presence of extracellular Ca2+ produced no detectable change in syntilla frequency (data not shown).
The amount of Ca2+ released per syntilla did not decrease even in the presence of the highest concentration of nifedipine, consistent with an action on a voltage sensor that governs syntilla frequency but not quantal size. The data in Figures 4 and supplemental Figure 2 (available at www.jneurosci.org as supplemental material) reflect the fact that nifedipine acted by decreasing the percentage of terminals that responded with a global increase in [Ca2+], by decreasing the magnitude of that global increase and by decreasing syntilla frequency in those terminals that did not respond with an increase in global [Ca2+].
FPL does not affect VICaR
Because nifedipine exerted its action in the absence of extracellular Ca2+ or in the presence of Cd2+ when extracellular Ca2+ was included, its action cannot be a result of preventing Ca2+ entry. An additional test of this was provided by the use of the L-type Ca2+ channel agonist FPL. FPL is a Ca2+ channel agonist that acts on a site distinct from the DHPR binding site. Moreover, FPL appears to act by prolonging the open state of the channel with no effect on the frequency of opening, which is regulated by the movement of the charged gate (McDonough et al., 2005). Thus, FPL provides an important control in two respects: as a check on the possible importance of Ca2+ influx and as a test of the idea that the gating charge movement must be affected to alter VICaR. We found that FPL increased the voltage-activated current maximally at a potential of approximately −40 mV in the terminals under the conditions we use (5.8-fold increase; data not shown). Hence, we assessed the action of FPL on VICaR with depolarization to −40 mV in the absence of extracellular Ca2+ (Fig. 5). FPL (2 μm) had no significant effect, whereas nifedipine (500 nm) blocked VICaR. As was the case at 0 mV, nifedipine exerted its action by decreasing the fraction of terminals that responded with a global increase in [Ca2+], decreased the magnitude of that increase, and, in those terminals that responded with a decrease in syntilla frequency, decreased the frequency of syntillas without altering the number of Ca ions per syntilla. The number of Ca ions per syntilla at −40 mV was not significantly different from what it was at −80 mV. Thus, at this potential, as at 0 mV, the syntillas continue to function as quanta of Ca2+.
Figure 5.

FPL does not increase VICaR. A, Average ΔF/F0 traces in absence of external calcium, when nerve terminals were depolarized from −80 to −40 mV (at the red arrow) for 1800 ms. The same paradigm, measurement, and conventions used in Figure 2 are used here. FPL (red trace) had no significant effect, whereas 500 nm nifedipine (blue trace) decreased the average ΔF/F0 trace. B, Correspondingly, the time derivative of ΔF/F0 was decreased by nifedipine but was not altered by FPL. C, Bar graphs represent the average ΔF/F0 over the last second of the traces (50 images) shown in A. FPL at 2 μm did not significantly (p = 0.80) increase ΔF/F0, whereas nifedipine significantly (∗p < 0.05) decreased ΔF/F0 (n = 33,48, and 21, for control, FPL, and nifedipine, respectively).
Type 1 RyRs are found close to the plasma membrane
If the DHPR is the voltage sensor for VICaR as it is in skeletal muscle, then it is not unreasonable to think it might pair with type 1 RyRs as it does in skeletal muscle (Beam and Franzini-Armstrong, 1997). Hence, we would expect to find type 1 RyRs in the nerve terminals, adjacent to the plasma membrane in which they could interact with DHPRs. In previous work (De Crescenzo et al., 2004), we have shown that ryanodine at blocking concentrations for the RyR decreases syntilla frequency, whereas at lower concentrations, it increases syntilla frequency. Caffeine also increased syntilla frequency, whereas heparin was without effect. In that study, no reliable Ab for RyR1 was available to us, but here we report results with Abs specific for type 1 and another specific for type 2.
Immunocytochemistry (Fig. 6) showed that RyR1, RyR2, and RyR3 receptors are found in images of the terminals, but their distribution patterns are different. Only immunofluorescence that was brighter than 95% of the control (i.e., preimmune serum) brightness was counted [51% of corrected pixels for type 1 and 19% for type 2 remained after thresholding, implying that the data were significantly different from controls (5%)]. We consider type 1 RyRs first. Fluorescence caused by type 1 is bright close to the surface of the terminal as is apparent in both the uncorrected optical sections (Fig. 6A, left) and the same sections corrected for fluorescence caused by preimmune serum (Fig. 6A, right). Because the fluorescence caused by the preimmune serum is brighter near the surface, the correction leads to a dimmer signal in this region. Nonetheless, the RyR1 immunofluorescence remains prominent near the surface in the corrected data. Neither type 2 nor type 3 follow this pattern. Type 2 is prominent in the interior but essentially absent from the area near the surface as indicated by the dark halo beneath the surface present in the uncorrected images. This halo becomes even more obvious after correction (Fig. 6A). Type 3 is not volume filling and found in a restricted area well inside the nerve terminals and also at times in a clump in one corner of the terminal (Fig. 6B) and at times in a strand leading out of the terminal. (Possibly this strand is type 3 localized to an axonal remnant but additional investigation of this localization is needed.) From these images, type 1 appears to be the best candidate for VICaR.
To confirm these results, we did a second set of experiments in which immunofluorescence of N-type channels was used to provide a marker of the plasma membrane. Figure 7A shows the results of this set of experiments. From the typical corrected reconstructions in the top of A and the averaged plot derived from the bottom of A, the relationship of each ryanodine receptor type to the Ca2+ channels and hence the plasma membrane is clear. It is apparent that type 1 RyRs are found as close to the cell surface as the N-type channels within the limits of our resolution. This is the sort of pattern to be expected if the RyR1 is coupled to a voltage sensor in the plasma membrane. We note that immunofluorescence caused by RyR1 and RyR2 and the N-type channel is found in the interior of the terminal. In immuno-EM studies on these terminals, N-type channels have been found on the dense-core vesicles in the interior (Fisher et al., 2000) (also see Discussion). In contrast to type 1, type 2 RyR density is lower in the shells that are within a few hundred nanometers of the plasma membrane. Figure 7B shows that the peptide used to produce the anti-RyR1 is conserved between species (rabbit and mouse) but poorly conserved in types 2 and 3. The Western blot in the bottom of the Figure 7B demonstrate that the antibody recognizes an RyR only in skeletal muscle preparation [lane 2, muscle homogenate; lane 4, sarcoplasmic reticulum (SR) membranes] and not in cardiac preparation (lane 1, homogenate; lane 3, SR membranes), confirming its specificity for type 1 RyR.
Moreover, this conclusion is supported by recent work on chromaffin cells in which we found syntillas also mediated by RyRs and almost identical in their properties to the ones studied here. However, in chromaffin cells, there was no evidence for VICaR and there were no type 1 RyRs (ZhuGe et al., 2006).
Discussion
How are DHPRs coupled to internal stores in nerve terminals?
Three lines of evidence indicate that DHPRs are the sensors of membrane potential involved in VICaR. First, the steepness of the voltage dependence of Ca2+ release at negative potentials is compatible with what is expected for a skeletal muscle DHPR (Klein et al., 1996). Second, nifedipine, which immobilizes the gating charge movement in DHPRs, prevents VICaR, whereas the Ca2+ channel pore blocker Cd2+ is without effect. Third, the Ca2+ channel agonist FPL, which does not act at the same site as the dihydropyridines and does not appear to act on the gating charge (McDonough et al., 2005), does not alter VICaR. Hence, we can conclude that the DHPRs do not function in their role as voltage-sensitive L-type Ca2+ channels to allow Ca2+ entry and trigger release from stores via CICR. Moreover, entry of Na ions through Ca2+ channels does not appear to be part of the mechanism because VICaR is observed (1) under conditions in which Ca2+ concentration is normal but Ca2+ channels are blocked by Cd2+, and (2) at subthreshold levels for Ca2+ channel activation in either the absence or presence of extracellular Ca2+.
What is the mechanism of coupling between DHPRs and RyRs in the nerve terminals studied here? Several lines of evidence suggest that it is similar to the well documented interaction between DHPRs and type 1 RyRs underlying excitation–contraction in skeletal muscle. First, the molecular machinery for such coupling is present in these terminals. Patch-clamp studies revealed L-type Ca2+ channels in the terminals (Lemos and Nowycky, 1989; Wang et al., 1997, 1999), and cDNA microarrays studies have shown (Mutsuga et al., 2004) that magnocellular neurons in rat express the same DHPR isoform (α1S) coupled to type 1 RyRs in skeletal muscle (Coronado et al., 2004). In neurons, L-type calcium channels are almost always present but typically contribute only a minor fraction of the overall high-threshold current (Bean and Mintz, 1994; Wang et al., 1997). Indeed the L-type channels that couple to the type 1 RyRs may be nonconductive or poorly conductive (Schwartz et al., 1985) and hence silent electrically unless one is recording gating currents (Shirokova et al., 1995). Furthermore, as shown here, type 1 RyRs are found immunocytochemically adjacent to the plasma membrane in the terminals.
Although a direct coupling of this kind has heretofore been established with clarity only in skeletal muscle, a direct link between RyRs and DHPRs has been suggested in neurons to explain some of the axonal damage as a result of spinal cord injury (Ouardouz et al., 2003). In that study, DHPRs and RyRs were coimmunoprecipitated, which supports the idea of a direct physical interaction between them (Anderson, 1998), and such coimmunoprecipitation (co-IP) had been seen previously in a rat brain membrane preparation (Mouton et al., 2001). In both co-IP studies, it was α1C that was precipitated with RyR1. However, co-IP experiments must be interpreted with care because false positives are possible (Fletcher et al., 2003). Finally, RyRs have been observed to interact functionally with DHPRs in excised membrane patches of cerebellar granule cells (Chavis et al., 1996).
Another possible mechanism for VICaR involves DHPRs to G-proteins as has been found in cultured skeletal myocytes (Araya et al., 2003) and smooth muscle cells (del Valle-Rodriguez et al., 2003), but there is little quantitative data on the voltage sensitivity of these DHPRs, so that comparison with our findings is not possible. In the case of cultured skeletal myocytes, the onset of the increase in cytosolic [Ca2+] induced by VICaR occurs tens of seconds after tetanic stimulation, which is much different from the time course in the nerve terminals (Figs. 1D, 2B, 4A,B) (supplemental Fig. 2B, available at www.jneurosci.org as supplemental material). However, in the case of smooth muscle cells, the time course is faster than the skeletal myocytes, but there is not sufficient data on these cells to compare with the time course in the nerve terminals (del Valle-Rodriguez et al., 2003). Finally, it may be the case that DHPRs have as yet undiscovered properties that are voltage activated, analogous to the recent discovery of phosphatide phosphatase activity coupled to an intrinsic voltage sensor (Murata et al., 2005). Whatever the precise mode of coupling, it seems clear that DHPRs are the voltage sensors for VICaR in the nerve terminals studied here.
How general is VICaR in the nervous system?
Is VICaR confined simply to the terminals studied here or is it found elsewhere? Quite often, the possibility of VICaR is not considered for neurons and a CICR mechanism is simply assumed, so there has been little exploration for VICaR. Moreover, there appears to be considerable difficulty working in Ca2+-free solutions in some CNS tissue (Ransom and Brown, 2003). However, type 1 RyRs are found in many CNS neurons (Zupanc et al., 1992; Giannini et al., 1995; Tarroni et al., 1997; Bouchard et al., 2003), as are α1S DHPRs (Takahashi et al., 2003; Mutsuga et al., 2004). So there is reason to suspect that VICaR is to be found in many neuronal types. It would seem that CICR should no longer simply be assumed as the mechanism when ryanodine-sensitive Ca2+ release is encountered in neurons.
Comparison with chromaffin cells
We reported recently that Ca2+ syntillas are to be found in another excitatory secretory cell, freshly dissociated mouse chromaffin cells (ZhuGe et al., 2006). Qualitatively, quantitatively, and in their pharmacology, these syntillas resemble those found in the neuron terminals studied here. However, these syntillas were different in one important respect: their frequency was not affected by depolarization in the absence of Ca2+ influx, nor was there any increase in global [Ca2+] in response to depolarization. That is, VICaR was absent. Both by reverse transcription-PCR and by immunocytochemistry, type 1 RyRs were absent, whereas type 2 RyRs and type 3 RyRs were present, type 2 in abundance. Moreover, it appears that the skeletal muscle DHPR isoform (α1S) is not present in chromaffin cells (Baldelli et al., 2004). Thus, it is tempting to postulate that the presence of type 1 RyRs and/or the skeletal muscle DHPR isoform (α1S) is a necessary condition for VICaR. It is also noteworthy that there is no staining for RyR2 deep within the chromaffin cells, as we and others (Fisher et al., 2000) have seen in the nerve terminals. It may be that, in the terminals, which are far from the cell body, the dense-core vesicles serve as stores for RyR2s and other proteins.
We may suggest an analogy between hypothalamic nerve terminals and skeletal muscle on the one hand and chromaffin cells and cardiac fibers on the other. In cardiac myocytes and chromaffin cells, RyR1 is missing and RyR2 is the dominant RyR isoform. In these cell types, RyR2s are activated by Ca2+ entry from nearby voltage-gated channels via CICR. In contrast, in skeletal muscle and hypothalamic nerve terminals, RyR1s are found, as is VICaR; here alterations in membrane potential are sufficient to release Ca2+ from internal stores. In all of these cell types, miniature Ca2+ transients are found, sparks in all types of muscle and Ca2+ syntillas in neurons and chromaffin cells, all of which are governed by VICaR or CICR depending on the cell type.
What is the function of VICaR in neurons?
Clearly this mechanism is potentially a new and intriguing way to couple neuronal activity to an increase in cytosolic Ca2+ in nerve terminals. This may allow for a release of Ca2+ into a microdomain that is different from the exocytotic microdomain in which it may have different, even diametrically opposed effects. An example of such a differential effect is found in smooth muscle, in which Ca2+ sparks activate BK channels, causing relaxation, whereas global increases in [Ca2+] cause contraction (Nelson et al., 1995; ZhuGe et al., 2006).
It is unclear as yet whether a single Ca2+ syntilla can cause an exocytotic event in nerve terminals. The evidence is in conflict at this point. There is evidence that “maximinis” at the basket cell–Purkinje cell synapse in the cerebellum are caused by presynaptic, focal Ca2+ (Llano et al., 2000). There is also evidence that nicotine may cause Ca2+ release from ryanodine-sensitive stores in mossy fiber terminals, possibly by enhancing store filling, which results in increased mini-frequency and increased quantal size (Sharma and Vijayaraghavan, 2003). Although these intriguing studies are convincing, they monitor exocytosis only postsynaptically and therefore indirectly. In contrast, in mouse chromaffin cells (ZhuGe et al., 2006), a single syntilla did not trigger a spontaneous exocytotic event at resting potential as detected amperometrically (Haller et al., 1998), nor did blocking virtually all syntillas cause a change in frequency of spontaneous exocytotic events. At least in some excitable exocytotic cells, it would seem that syntillas do not trigger exocytosis, presumably because they do not occur in the appropriate Ca2+ microdomain. It remains to be determined whether this is true in neurohypophyseal terminals.
Footnotes
This work was supported by National Institutes of Health Grant HL 61297 (J.V.W.). We thank Kurt Beam, Bruce Bean, William Hobey, and Eduardo Rios for their insightful comments and critical review of this manuscript. We also thank Vincenzo Sorrentino, who generously provided antibodies for the RyR3.
References
- Anderson NG (1998). Co-immunoprecipitation. Identification of interacting proteins. Methods Mol Biol 88:35–45. [DOI] [PubMed] [Google Scholar]
- Araya R, Liberona JL, Cardenas JC, Riveros N, Estrada M, Powell JA, Carrasco MA, Jaimovich E (2003). Dihydropyridine receptors as voltage sensors for a depolarization-evoked, IP3R-mediated, slow calcium signal in skeletal muscle cells. J Gen Physiol 121:3–16. [DOI] [PMC free article] [PubMed] [Google Scholar]
- Baldelli P, Hernandez-Guijo JM, Carabelli V, Novara M, Cesetti T, Andres-Mateos E, Montiel C, Carbone E (2004). Direct and remote modulation of L-channels in chromaffin cells: distinct actions on alpha1C and alpha1D subunits? Mol Neurobiol 29:73–96. [DOI] [PubMed] [Google Scholar]
- Beam KG, Franzini-Armstrong C (1997). Functional and structural approaches to the study of excitation-contraction coupling. Methods Cell Biol 52:283–306. [DOI] [PubMed] [Google Scholar]
- Bean BP (1984). Nitrendipine block of cardiac calcium channels: high-affinity binding to the inactivated state. Proc Natl Acad Sci USA 81:6388–6392. [DOI] [PMC free article] [PubMed] [Google Scholar]
- Bean BP, Mintz IM (1994). Pharmacology of different types of calcium channels in rat neurons. In: Handbook in membrane channels: molecular and cellular physiology San Diego: Academic.
- Berridge MJ (1998). Neuronal calcium signaling. Neuron 21:13–26. [DOI] [PubMed] [Google Scholar]
- Bouchard R, Pattarini R, Geiger JD (2003). Presence and functional significance of presynaptic ryanodine receptors. Prog Neurobiol 69:391–418. [DOI] [PubMed] [Google Scholar]
- Carrington WA, Lynch RM, Moore ED, Isenberg G, Fogarty KE, Fay FS (1995). Superresolution three-dimensional images of fluorescence in cells with minimal light exposure. Science 268:1483–1487. [DOI] [PubMed] [Google Scholar]
- Chavis P, Fagni L, Lansman JB, Bockaert J (1996). Functional coupling between ryanodine receptors and L-type calcium channels in neurons. Nature 382:719–722. [DOI] [PubMed] [Google Scholar]
- Collin T, Marty A, Llano I (2005). Presynaptic calcium stores and synaptic transmission. Curr Opin Neurobiol 15:275–281. [DOI] [PubMed] [Google Scholar]
- Coronado R, Ahern CA, Sheridan DC, Cheng W, Carbonneau L, Bhattacharya D (2004). Functional equivalence of dihydropyridine receptor alpha1S and beta1a subunits in triggering excitation-contraction coupling in skeletal muscle. Biol Res 37:565–575. [DOI] [PubMed] [Google Scholar]
- De Crescenzo V, ZhuGe R, Velazquez-Marrero C, Lifshitz LM, Custer E, Carmichael J, Lai FA, Tuft RA, Fogarty KE, Lemos JR, Walsh JVJ (2004). Ca2+ syntillas, miniature Ca2+ release events in terminals of hypothalamic neurons, are increased in frequency by depolarization in the absence of Ca2+ influx. J Neurosci 24:1226–1235. [DOI] [PMC free article] [PubMed] [Google Scholar]
- del Valle-Rodriguez A, Lopez-Barneo J, Urena J (2003). Ca2+ channel-sarcoplasmic reticulum coupling: a mechanism of arterial myocyte contraction without Ca2+ influx. EMBO J 22:4337–4345. [DOI] [PMC free article] [PubMed] [Google Scholar]
- Emptage NJ, Reid CA, Fine A (2001). Calcium stores in hippocampal synaptic boutons mediate short-term plasticity, store-operated Ca2+ entry, and spontaneous transmitter release. Neuron 29:197–208. [DOI] [PubMed] [Google Scholar]
- Fisher TE, Carrion-Vazquez M, Fernandez JM (2000). Intracellular Ca2+ channel immunoreactivity in neuroendocrine axon terminals. FEBS Lett 482:131–138. [DOI] [PubMed] [Google Scholar]
- Fletcher S, Bowden SE, Marrion NV (2003). False interaction of syntaxin 1A with a Ca2+-activated K+ channel revealed by co-immunoprecipitation and pull-down assays: implications for identification of protein-protein interactions. Neuropharmacology 44:817–827. [DOI] [PubMed] [Google Scholar]
- Giannini G, Conti A, Mammarella S, Scrobogna M, Sorrentino V (1995). The ryanodine receptor/calcium channel genes are widely and differentially expressed in murine brain and peripheral tissues. J Cell Biol 128:893–904. [DOI] [PMC free article] [PubMed] [Google Scholar]
- Haller M, Heinemann C, Chow RH, Heidelberger R, Neher E (1998). Comparison of secretory responses as measured by membrane capacitance and by amperometry. Biophys J 74:2100–2113. [DOI] [PMC free article] [PubMed] [Google Scholar]
- Klein MG, Cheng H, Santana LF, Jiang YH, Lederer WJ, Schneider MF (1996). Two mechanisms of quantized calcium release in skeletal muscle. Nature 379:455–458. [DOI] [PubMed] [Google Scholar]
- Lauri SE, Bortolotto ZA, Nistico R, Bleakman D, Ornstein PL, Lodge D, Isaac JT, Collingridge GL (2003). A role for Ca2+ stores in kainate receptor-dependent synaptic facilitation and LTP at mossy fiber synapses in the hippocampus. Neuron 39:327–341. [DOI] [PubMed] [Google Scholar]
- Lemos JR, Nowycky MC (1989). Two types of calcium channels coexist in peptide-releasing vertebrate nerve terminals. Neuron 2:1419–1426. [DOI] [PubMed] [Google Scholar]
- Llano I, Gonzalez J, Caputo C, Lai FA, Blayney LM, Tan YP, Marty A (2000). Presynaptic calcium stores underlie large-amplitude miniature IPSCs and spontaneous calcium transients. Nat Neurosci 3:1256–1265. [DOI] [PubMed] [Google Scholar]
- McDonough SI, Mori Y, Bean BP (2005). FPL 64176 modification of CaV1.2 L-type calcium channels: dissociation of effects on ionic current and gating current. Biophys J 88:211–223. [DOI] [PMC free article] [PubMed] [Google Scholar]
- Melamed-Book N, Kachalsky SG, Kaiserman I, Rahamimoff R (1999). Neuronal calcium sparks and intracellular calcium “noise”. Proc Natl Acad Sci USA 96:15217–15221. [DOI] [PMC free article] [PubMed] [Google Scholar]
- Mitchell KJ, Lai FA, Rutter GA (2003). Ryanodine receptor type I and nicotinic acid adenine dinucleotide phosphate receptors mediate Ca2+ release from insulin-containing vesicles in living pancreatic beta-cells (MIN6). J Biol Chem 278:11057–11064. [DOI] [PubMed] [Google Scholar]
- Mouton J, Marty I, Villaz M, Feltz A, Maulet Y (2001). Molecular interaction of dihydropyridine receptors with type-1 ryanodine receptors in rat brain. Biochem J 354:597–603. [DOI] [PMC free article] [PubMed] [Google Scholar]
- Murata Y, Iwasaki H, Sasaki M, Inaba K, Okamura Y (2005). Phosphoinositide phosphatase activity coupled to an intrinsic voltage sensor. Nature 435:1239–1243. [DOI] [PubMed] [Google Scholar]
- Mutsuga N, Shahar T, Verbalis JG, Brownstein MJ, Xiang CC, Bonner RF, Gainer H (2004). Selective gene expression in magnocellular neurons in rat supraoptic nucleus. J Neurosci 24:7174–7185. [DOI] [PMC free article] [PubMed] [Google Scholar]
- Neher E (1998). Vesicle pools and Ca2+ microdomains: new tools for understanding their roles in neurotransmitter release. Neuron 20:389–399. [DOI] [PubMed] [Google Scholar]
- Nelson MT, Cheng H, Rubart M, Santana LF, Bonev AD, Knot HJ, Lederer WJ (1995). Relaxation of arterial smooth muscle by calcium sparks. Science 270:633–637. [DOI] [PubMed] [Google Scholar]
- Ouardouz M, Nikolaeva MA, Coderre E, Zamponi GW, McRory JE, Trapp BD, Yin X, Wang W, Woulfe J, Stys PK (2003). Depolarization-induced Ca2+ release in ischemic spinal cord white matter involves L-type Ca2+ channel activation of ryanodine receptors. Neuron 40:53–63. [DOI] [PubMed] [Google Scholar]
- Proenza C, O’Brien J, Nakai J, Mukherjee S, Allen PD, Beam KG (2002). Identification of a region of RyR1 that participates in allosteric coupling with the α1S (CaV1.1) II-III loop. J Biol Chem 227:6530–6535. [DOI] [PubMed] [Google Scholar]
- Ransom BR, Brown AM (2003). Intracellular Ca2+ release and ischemic axon injury: the Trojan horse is back. Neuron 40:2–4. [DOI] [PubMed] [Google Scholar]
- Rios E, Brum G (1987). Involvement of dihydropyridine receptors in excitation-contraction coupling in skeletal muscle. Nature 325:717–720. [DOI] [PubMed] [Google Scholar]
- Rios E, Karhanek M, Ma J, Gonzalez A (1993). An allosteric model of the molecular interactions of excitation-contraction coupling in skeletal muscle. J Gen Physiol 102:449–481. [DOI] [PMC free article] [PubMed] [Google Scholar]
- Schwartz LM, McCleskey EW, Almers W (1985). Dihydropyridine receptors in muscle are voltage-dependent but most are not functional calcium channels. Nature 314:747–751. [DOI] [PubMed] [Google Scholar]
- Scriven DR, Klimek A, Asghari P, Bellve K, Moore ED (2005). Caveolin-3 is adjacent to a group of extradyadic ryanodine receptors. Biophys J 89:1893–1901. [DOI] [PMC free article] [PubMed] [Google Scholar]
- Sharma G, Vijayaraghavan S (2003). Modulation of presynaptic store calcium induces release of glutamate and postsynaptic firing. Neuron 38:929–939. [DOI] [PubMed] [Google Scholar]
- Shirokova N, Gonzalez A, Ma J, Shirokov R, Rios E (1995). Properties and roles of an intramembranous charge mobilized at high voltages in frog skeletal muscle. J Physiol (Lond) 486:385–400. [DOI] [PMC free article] [PubMed] [Google Scholar]
- Sun XP, Callamaras N, Marchant JS, Parker I (1998). A continuum of InsP3-mediated elementary Ca2+ signalling events in Xenopus oocytes. J Physiol (Lond) 509:67–80. [DOI] [PMC free article] [PubMed] [Google Scholar]
- Suzuki S, Osanai M, Murase M, Suzuki N, Ito K, Shirasaki T, Narita K, Ohnuma K, Kuba K, Kijima H (2000). Ca2+ dynamics at the frog motor nerve terminal. Pflügers Arch 440:351–365. [DOI] [PubMed] [Google Scholar]
- Takahashi Y, Jeong SY, Ogata K, Goto J, Hashida H, Isahara K, Uchiyama Y, Kanazawa I (2003). Human skeletal muscle calcium channel alpha1S is expressed in the basal ganglia: distinctive expression pattern among L-type Ca2+ channels. Neurosci Res 45:129–137. [DOI] [PubMed] [Google Scholar]
- Tarroni P, Rossi D, Conti A, Sorrentino V (1997). Expression of the ryanodine receptor type 3 calcium release channel during development and differentiation of mammalian skeletal muscle cells. J Biol Chem 272:19808–19813. [DOI] [PubMed] [Google Scholar]
- Tunwell RE, Wickenden C, Bertrand BM, Shevchenko VI, Walsh MB, Allen PD, Lai FA (1996). The human cardiac muscle ryanodine receptor-calcium release channel: identification, primary structure and topological analysis. Biochem J 318:477–487. [DOI] [PMC free article] [PubMed] [Google Scholar]
- Unni VK, Zakharenko SS, Zablow L, DeCostanzo AJ, Siegelbaum SA (2004). Calcium release from presynaptic ryanodine-sensitive stores is required for long-term depression at hippocampal CA3–CA3 pyramidal neuron synapses. J Neurosci 24:9612–9622. [DOI] [PMC free article] [PubMed] [Google Scholar]
- Wang G, Thorn P, Lemos JR (1992). A novel large-conductance Ca2+-activated potassium channel and current in nerve terminals of the rat neurohypophysis. J Physiol (Lond) 457:47–74. [DOI] [PMC free article] [PubMed] [Google Scholar]
- Wang G, Dayanithi G, Kim S, Hom D, Nadasdi L, Kristipati R, Ramachandran J, Stuenkel EL, Nordmann JJ, Newcomb R, Lemos JR (1997). Role of Q-type Ca2+ channels in vasopressin secretion from neurohypophysial terminals of the rat. J Physiol (Lond) 502:351–363. [DOI] [PMC free article] [PubMed] [Google Scholar]
- Wang G, Dayanithi G, Newcomb R, Lemos JR (1999). An R-type Ca2+ current in neurohypophysial terminals preferentially regulates oxytocin secretion. J Neurosci 19:9235–9241. [DOI] [PMC free article] [PubMed] [Google Scholar]
- ZhuGe R, Tuft RA, Fogarty KE, Bellve K, Fay FS, Walsh JV Jr (1999). The influence of sarcoplasmic reticulum Ca2+ concentration on Ca2+ sparks and spontaneous transient outward currents in single smooth muscle cells. J Gen Physiol 113:215–228. [DOI] [PMC free article] [PubMed] [Google Scholar]
- ZhuGe R, Fogarty KE, Tuft RA, Lifshitz LM, Sayar K, Walsh JV Jr (2000). Dynamics of signaling between Ca2+ sparks and Ca2+- activated K+ channels studied with a novel image-based method for direct intracellular measurement of ryanodine receptor Ca2+ current. J Gen Physiol 116:845–864. [DOI] [PMC free article] [PubMed] [Google Scholar]
- ZhuGe R, DeCrescenzo V, Sorrentino V, Lai FA, Tuft RA, Lifshitz LM, Lemos JR, Smith C, Fogarty KE, Walsh JV (2006). Syntillas release Ca2+ at a site different from the microdomain where exocytosis occurs in mouse chromaffin cells. Biophys J 90:2027–2037. [DOI] [PMC free article] [PubMed] [Google Scholar]
- Zissimopoulos S, Lai FA (2005). Interaction of FKBP12.6 with the cardiac ryanodine receptor C-terminal domain. J Biol Chem 280:5475–5485. [DOI] [PubMed] [Google Scholar]
- Zupanc GK, Airey JA, Maler L, Sutko JL, Ellisman MH (1992). Immunohistochemical localization of ryanodine binding proteins in the central nervous system of gymnotiform fish. J Comp Neurol 325:135–151. [DOI] [PubMed] [Google Scholar]