

Abstract
Two-photon laser scanning microscopy was used to correlate electrical events detected with whole-cell somatic recordings to Ca2+ transients in dendrites of olfactory bulb granule cells. A subset of spontaneous subthreshold depolarizing events recorded at the soma were shown to correspond to suprathreshold dendritic, Na-dependent action potentials [APs; dendritic spikes (D-spikes)]. These potentials were blocked by intracellular QX-314 (lidocaine N-ethyl bromide), hyperpolarizing current injection at the soma, and by partial inhibition of AMPA/kainate receptors with 0.75 μm DNQX. They were affected only slightly by 100 μm NiCl2. The majority of D-spikes recorded at the soma had a time to peak of <4 ms, comparable with somatic APs, a nonexponential decay, and amplitudes between 3 and 21 mV. Somatically recorded APs produced Ca2+ transients that were observed in spines and dendrites in all parts of the cell. Ca2+ transients from D-spikes were restricted to subsets of distal dendrites and their associated spines but were absent from the soma and dendrite within ∼50–80 μm of the soma. Ca2+ transients in different branches could be correlated with different-sized D-spikes. D-spike and backpropagating AP-induced Ca2+ transients summed in dendrites, provided the interval between them was >5–6 ms. Generation of a D-spike in a particular dendrite <5–6 ms before a somatic AP blocked backpropagation of the somatic AP into that dendrite. The temporally specific interplay between D-spikes and backpropagating APs may play a role in regulating feedback and feedforward inhibition of groups of mitral cells synapsing on different granule cell dendrites.
Keywords: dendrite, dendritic action potential, backpropagating action potential, calcium imaging, olfactory bulb, granule cell
Introduction
Many olfactory neurons have dual-functional dendrites that receive synaptic inputs and release transmitter. Determining the extent to which these cells can compartmentalize their input–output functions is essential to understanding their computational functions.
Active electrical responses in dendrites are proving to be the norm rather than the exception (Segev and London, 2000). The extent to which Na+-dependent action potentials (APs) backpropagate into or are initiated in dendrites (Bischofberger and Jonas, 1997; Chen et al., 1997; Saraga et al., 2003) varies across neuronal types and often depends on factors such as resting membrane potential, spiking pattern (Hoffman et al., 1997), synaptic activity (Margrie et al., 2001; Lowe, 2002), or neuromodulation (Tsubokawa and Ross, 1997; Hoffman and Johnston, 1999; Davison et al., 2004).
Several roles are evident for APs in dendrites (Hausser and Mel, 2003). In some instances, notably pyramidal cells in mammalian hippocampus, backpropagating APs appear to play a pivotal role in activity-dependent modification of synaptic strength by correlating postsynaptic electrical activity with synaptic input within a narrow temporal window (Migliore et al., 1999; Sjostrom and Nelson, 2002; Watanabe et al., 2002; Kampa et al., 2004). In other cells, they can serve to efficiently transmit or enhance the transfer of synaptic input from distal dendrites to the soma/axon compartment (Chen et al., 1997; Hanson et al., 2004). In neurons such as olfactory granule cells that release transmitter from their dendrites, they obviously can play a major role in initiating transmitter release from synapses distributed throughout the arbor (Isaacson and Strowbridge, 1998). Compartmental modeling has suggested that there are several potential levels of organization of output synapses on granule cell dendrites (Woolf et al., 1991), and it seems probable that whether or under what conditions the granule cell can function in local versus global output modes will have important bearing on the computational role it performs in the olfactory bulb circuit (Shepherd et al., 2004).
We used fluorescence imaging of dendritic Ca2+ transients combined with whole-cell intracellular recordings from somata to study spatial properties of AP propagation in granule cell dendrites of frog olfactory bulb. We focused on Ca2+ transients in dendrites resulting from spontaneous activity and from APs evoked by somatically injected depolarizing current or electrically stimulated synaptic inputs. Somatic APs reliably backpropagate into all dendritic branches and spines to produce robust Ca2+ transients, in agreement with previous findings from mammalian slice preparation (Egger et al., 2003). Additionally, we find that primarily Na+-dependent, dendritic spikes (D-spikes) produce Ca2+ transients that can be restricted to subsets of dendritic branches. This adds to growing evidence for dendritically generated active events in granule cells of turtle and rat reported recently by Pinato and Midtgaard (2005) and Egger et al. (2005). In frog, the soma and proximal dendritic segment appear to be a barrier to their propagation, resulting in restriction of D-spike-evoked Ca2+ influx to sets of spines on peripheral branches. Ca2+ transients evoked by backpropagating spikes can add to those from dendritic spikes in those branches that initiate dendritic spikes. However, because dendritically initiated spikes are active events, they block backpropagation of somatic APs for intervals <5–6 ms. These time- and space-dependent interactions between D-spikes and somatic spikes could have branch-specific consequences for transmitter release or synaptic plasticity.
Materials and Methods
Electrophysiology. Procedures were performed in accordance with Canadian Council for Animal Care Guidelines under supervision of the institutional Animal Care and Use Committee. Recordings were made from neurons in hemisected but otherwise intact forebrain of adult Rana pipiens. After deep anesthesia by immersion in MS222 (Sigma, St. Louis, MO), the brain was removed and divided by a razor blade cut along the midline through the thin anterior interbulbar adhesion and callosal fibers of the telencephalon. The olfactory bulb and telencephalon were pinned to the bottom of a Sylgard-lined recording chamber with the cut medial surface facing upwards. Experiments were performed at room temperature, which was regulated to 21 ± 1°C. A bicarbonate-buffered frog Ringer's solution (in mm: 72 NaCl, 2 KCl, 26 NaHCO3, 2.5 NaH2PO4, 0.5 Na2HPO4, 1.5 MgSO4, 2 CaCl2, 10 glucose, pH 7.4) bubbled with 95%/5% O2/CO2 was superfused at a rate of 1–2 ml/min (Delaney and Hall, 1996). Granule cells were visualized using near-infrared illumination (625–750 nm) with an oblique illumination condenser (Olympus, Melville, NY). Somata were selected for patching between 100 and 170 μm below the surface (the majority were ∼120 μm), and most cells were located in the caudal (i.e., interior) portion of the granule cell layers. Average resting membrane potential and input impedance were estimated to be –59.5 ± 3.4 mV (n = 53) and 231 ± 81.5 MΩ (mean ± SD; n = 94), respectively.
Whole-cell recordings were performed using pipettes pulled from nonfilament thin-wall glass capillaries with resistances of 6–8 MΩ containing a K-gluconate-based intracellular solution [in mm: 10 HEPES, 5 glucose, 2 MgCl2, 2 ATPNa2, 0.3 GTP-Na, 91 K-gluconate, 195 mOsm (measured), pH 7.4 adjusted with KOH]. Seal resistances of at least 3 GΩ were obtained in cells chosen for study, and access resistance of 30–70 MΩ (55 ± 26; n = 94) was typical after breakthrough. Voltages reported here are not corrected for junction potentials, and series resistance compensation was not performed. Most physiological measurements were performed within 2–2.5 h of breakthrough, during which the electrophysiological properties of the cells, including the occurrence of dendritic spikes, were typically stable. A twisted pair of 125-μm-diameter enamel-coated Ag wires was used to stimulate olfactory nerve (ON) or lateral olfactory tract (LOT). For local stimulation of mitral cells in the vicinity of imaged granule cells, a monopolar glass pipette with a 10-μm-diameter tip filled with 0.5 m NaCl was positioned in the superficial portion of the external plexiform layer using a stage mounted hydraulic manipulator under bright-field visual control.
To test for possible T-type Ca2+ channel contribution to spontaneous D-spike generation, we superfused the bulbs with Ringer's containing 100 μm NiCl2. The time to peak, amplitude, and frequency were obtained for all D-spikes in each of six cells during a 5 min control period commencing 20 min after breakthrough and then for 5 min after superfusion with NiCl2 for 20–25 min. Average values were obtained for these parameters by measuring from between 24 and 123 D-spikes during control and NiCl2 application. D-spikes were defined as events with dV/dt > 0.6 V/s, and we confirmed in each case that these events were eliminated by hyperpolarizing current sufficient to bring the somatic membrane to –80 mV. We also confirmed that access resistance remained constant during the course of the experiment and that there was no change in amplitude, rate of rise, or frequency of D-spikes during the 20 min control period in artificial CSF before application of NiCl2.
Imaging. Ca-Green-1 K+ salt (150 μm; Invitrogen, San Diego, CA) was loaded into neurons by diffusion from the recording pipette. A minimum of 30 min elapsed before commencing recording of fluorescence transients from dendrites. Fluorescence was excited using 810 nm pulsed laser light generated by a Nd:YaG pumped Ti:sapphire laser system (Verdi 10W; MIRA Optima 900F; Coherent Laser, Santa Clara, CA). An x–y galvonometer mirror assembly (Cambridge Instruments, Deerfield, IL) scanned the beam across the sample through a 40×, 0.8 numerical aperture water dipping lens (Olympus), and fluorescence signals were detected using a GaAsP photomultiplier (H7742P-40 MOD; Hamamatsu, Bridgewater, NJ) using a custom-built microscope modeled after that described by Tsai et al. (2002). A Macintosh (Apple Computers, Cupertino, CA) 867 MHz dual processor computer equipped with an NI PCI6110 analog-to-digital (A/D) board was used to acquire fluorescence signals (600 KHz to 1.25 MHz sampling rate) and to output scan-wave signals simultaneous with acquisition of electrophysiological signals that were obtained with a National Instruments (Austin, TX) PCI6035E A/D board (5 KHz sampling rate). Electrophysiology and imaging were synchronized through real-time signal integration lines on the two digitizing boards. Hardware control, image acquisition, and analysis software were written in-house using Igor Pro (WaveMetrics, Portland, OR) as a platform. External routines written in C++ were linked to the Igor interface to accelerate some display and image analysis functions. Most imaging was performed by defining scan areas comprising 10–20 horizontal scan lines that encompassed a length of dendrite including spines. Dendrites were aligned along the horizontal scan axis using a hardware-based scan rotation device (Tsai et al., 2002) with bidirectional scanning in the horizontal axis to increase scanning rates. Frame rates of 30–150 frames/s were used in this study.
Polygonal regions of interest were defined around dendrites and spines. Fluorescence changes (ΔF/F) were normalized by dividing by the average baseline fluorescence during a period of inactivity (usually obtained during the first 1–2 s at the beginning of a trace). Photomultiplier offset was adjusted to bring background intensities in unfilled areas to near zero. A smoothing polygonal fit (Savitzky-Golay; 9 or 11 point window) was used to temporally smooth the fluorescence data presented. At the end of the experiment, cell morphology was reconstructed from sets of optical sections obtained with vertical steps of 1, 2, or 3 μm to determine where optical measurements had been made.
Results
Subthreshold spontaneous events recorded at the soma
Whole-cell current-clamp or voltage-clamp recordings from granule cells obtained with standard intracellular pipette solutions are characterized by numerous spontaneous subthreshold depolarizing events recorded at the soma that occur at an estimated rate of 10–30 Hz (Fig. 1A,B). The majority of these events range in size from 0.3 to 5 mV with times to peak between 5 and 22 ms. This class of events was blocked by DNQX, not affected by intracellular lidocaine N-ethyl bromide (QX-314; 1 mm), and not diminished in size or frequency by hyperpolarizing current injection, consistent with their being primarily AMPA receptor (AMPAR)-dependent synaptic potentials.
Figure 1.
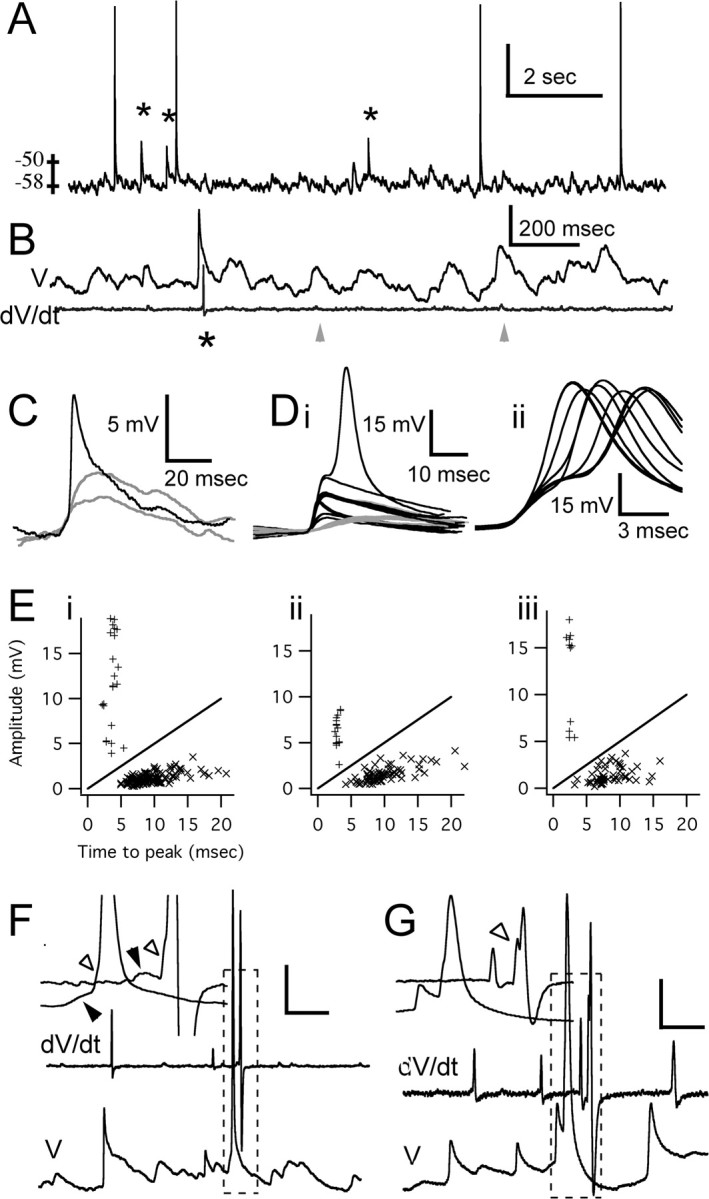
Synaptic and dendritic spike activity in granule cells. A, Granule cell somatic current-clamp recording illustrating a typical pattern of spontaneous activity. Asterisks indicate fast, subthreshold depolarizing events (D-spikes). B, The top trace is another segment of recording from the cell in trace A showing numerous spontaneous subthreshold synaptic potentials and a single fast subthreshold depolarizing event. The bottom trace is the time derivatization of the top trace, which distinguishes fast D-spikes from synaptic potentials. The display of dV/dt is temporally shifted relative to V for clarity. C, Expanded time base showing three segments from the voltage trace in B, as indicated by the arrowheads and the asterisk. D, Segments cut from 120 s of continuous recording. The black segments were chosen for extraction using the derivatized voltage record to identify dendritic spikes as events with dV/dt > 0.6 V/s. Note the appearance of distinct classes of events based on amplitude and time course. For comparative purposes, Di also shows one segment in which a somatically recorded AP followed the fast subthreshold event. The gray segments in Di show several large synaptic potentials to illustrate their comparatively slower time course. Dii shows all of the APs produced during 120 s of recording. Many of these are preceded by a fast prepotential with the same form as the largest of the subthreshold events in Di. E, Amplitude versus time to peak for spontaneous subthreshold events measured from 120 s of data from the cell in A (Ei), from 120 s of recording for the cell shown in Figure 2 A (Eii), and 20 s of recording from another cell (Eiii). The straight line indicates amplitude/time-to-peak ratio of 0.5 V/s. F, G, Recordings from two other cells. The traces are offset slightly along the time axis for clarity. The insets show an expanded scale for intervals indicated by the dashed boxes. The filled arrowheads in the inset graphs in F indicate synaptic potentials; the open arrowheads in F and G indicate a dendritic spike prepotential preceding the AP, which is more clearly seen in the derivatized record. Calibration: A, 15 mV; B, 6 mV, 5 V/s; F, 10 mV, 9 V/s, 10 ms; G, 10 mV, 5 V/s, 5 ms.
Another class of subthreshold events was observed with times to peak of <4 ms (typically 2–3.5 ms), amplitudes of 3–21 mV, and a faster initial decay phase (Fig. 1C,D) compared with the majority of subthreshold events. They occurred spontaneously in 71 of 94 cells at normal resting membrane potential of around –60 mV. Because the frequency of these fast potentials varied between different granule cells and depended strongly on resting membrane potential, we examined the last 36 cells that we recorded during our study that maintained membrane potential between –57 and –63 mV with either no injected current (18 cells) or between –1 and –13 pA (18 cells). During recording periods of at least 5 min duration obtained within 10 min of initial breakthrough, the frequency of these fast potentials ranged from 0.017 to 1.574 Hz with an average rate 0.30 ± 0.36 Hz (n = 36). In any given preparation, although the overall average rate of these fast subthreshold events was usually <1 Hz, short bursts of two to five events at rates as high as 150 Hz were occasionally seen.
When present in a cell, these events persisted for the duration of recordings without evidence of washout for up to 2 or 3 h after breakthrough with and without high-affinity Ca2+ indicator in the pipettes. Despite the small overlap in size between the two classes of subthreshold potentials, the different time course of the rising and initial recovery phases clearly separates the events into distinct populations (Fig. 1E). For example, for the cells shown in Figure 1E, the average times to peak of the fastest class of events was 2.53 ± 0.30 ms (n = 11) (Fig. 1Ei), 3.65 ± 0.77 ms (n = 22) (Fig. 1Eii), and 2.96 ± 0.24 ms (n = 16) (Fig. 1Eiii) compared with the EPSPs, which had average times to peak of 9.66 ± 3.06 ms (n = 126) (Fig. 1Ei), 8.61 ± 2.60 ms (n = 51) (Fig. 1Eii), and 10.0 ± 3.38 ms (n = 76) (Fig. 1Eiii). The average amplitudes of the fast class of events were 12.30 ± 5.1 mV (Fig. 1Ei), 6.24 ± 1.6 mV (Fig. 1Eii), and 11.8 ± 5.2 mV (Fig. 1Eiii), whereas the corresponding average EPSP amplitudes were 1.16 ± 0.58 mV (Fig. 1Ei), 1.43 ± 0.89 mV (Fig. 1Eii), and 1.54 ± 0.91 mV (n values as indicated for time to peak data). The faster events were thus readily isolated from the majority of subthreshold potentials by plotting dV/dt versus time for current-clamp recordings (Fig. 1B,F,G). D-spikes had peak rates of rise of >0.5 V/s, typically >2 V/s, whereas derivatized EPSPs were usually not distinguishable above the noise level (<0.2 V/s).
Hyperpolarizing current injection readily blocked the fast class of spontaneous events. Calcium imaging experiments described below led to the conclusion that the fast class of events corresponded to action potentials initiating in the dendrites, that is D-spikes. The combination of a rising phase with maximum dV/dt > 0.6 V/s and susceptibility to hyperpolarization that was always seen for these events served as a defining criterion for D-spikes. We routinely injected hyperpolarizing current as a means of confirming that fast subthreshold events were D-spikes and not large EPSPs, because EPSPs increased in size with hyperpolarization, whereas D-spikes were blocked. Typically, hyperpolarization by 10–20 mV below average resting membrane potential was sufficient to block all spontaneous fast events in all cells tested in this manner (n = 62) (Fig. 2A,C), whereas further hyperpolarization blocked those evoked by strong local synaptic stimulation (n = 3) (Fig. 2A,B).
Figure 2.

Voltage dependence and sensitivity to QX-314 of dendritic spikes. A, The top trace shows a continuous current-clamp recording with and without hyperpolarizing current injection with the corresponding derivatized record underneath. A stimulating pipette inserted into the superficial external plexiform layer stimulated synaptic inputs at 5 s intervals (stimulus artifacts can be seen in voltage recording but were removed from the derivatized record for clarity). The insets are expanded time base segments from portions of the continuous record, as indicated by the arrows. Inset Ai shows evoked D-spikes and an aborted action potential; inset Aii shows spontaneous D-spikes between stimuli. With hyperpolarization to about –79 mV, only three D-spikes are evoked and no spontaneous D-spikes occur. At about –60 mV, many spontaneous D-spikes occur and synaptic potentials evoke action potentials with several D-spikes. Intermediate hyperpolarization to about–72 mV produced one spontaneous D-spike and several evoked D-spikes. B, C, Segments of data extracted from another 2 min of recording from the same cell during which the membrane potential was adjusted similar to the records shown in A. Records in which no D-spikes were seen are presented in gray; those with D-spikes are black. B, Stimulation evokes only synaptic potentials at –79 mV (Bi); D-spikes and sometimes action potentials are evoked at –65 mV (Bii)or –71 mV (Biii) average resting membrane potential. C, Spontaneous D-spikes do not occur at –79 mV (Ci) resting membrane potential, as indicated by dashed line, and are seen at a lower frequency for –71 mV (Ciii) versus –65 mV (Cii). D, A cumulative count of all D-spikes shows that 1 mm QX-314 added to the pipette gradually blocks the occurrence of spontaneous D-spikes (results from 2 cells shown in left panel). Without QX-314, D-spikes are produced at a constant rate as illustrated by data from three other cells (right). The vertical axes are in millivolts or volts per second for A–C.
Full-sized spontaneous APs (SAPs) that were recorded from the soma were often evoked by D-spikes, particularly if they summated with smaller slower potentials (Fig. 1F). We examined 317 SAPs in derivatized voltage recordings in 33 cells and detected that the SAP was triggered from a distinct fast rising prepotential in 171 cases. Across the population of cells, we could detect a distinct prespike preceding 50 ± 35% of SAPs; many cells had no detectable prespikes, whereas many others showed prespikes for all SAPs (Fig. 1D,F,G). Although there are high rates of spontaneous synaptic potentials, the threshold for firing at the soma is 10–15 mV depolarized from resting Vm (Hall and Delaney, 2002; Cang and Isaacson, 2003), thus it is not surprising that a large proportion of spontaneous APs are triggered from large amplitude D-spikes. This average possibly underestimates the frequency of prespikes, because they cannot be detected if they trigger a full SAP early in their rising phase.
Spontaneously occurring D-spikes were progressively blocked within several minutes of the onset of recording by including 0.5–2 mm QX-314 in the recording pipette. Three cells were perfused with 0.5 mm, two with 1 mm, and one with 2 mm. The frequency was sampled for a period of ∼1 min between 3 and 7 min after breakthrough and again ∼20 min after breakthrough. We performed one other experiment with 2 mm QX-314 in the pipette, but by the time we switched from voltage clamp to current clamp, we had no evidence of D-spikes. The two cells perfused with 1 mm were sampled continuously as shown. The mean frequency of spontaneous D-spikes (defined as events with peak dV/dt > 0.6 V/s and being blocked by hyperpolarizing current injection) was 0.76 ± 0.34 Hz in these six cells. By 20 min after breakthrough, five of six preparations exhibited no spontaneous D-spikes, whereas one of the preparations perfused with 0.5 mm had a D-spike frequency of 0.07 Hz, resulting an average of 0.012 ± 0.029 Hz (Fig. 2D). In the absence of QX-314, we routinely recorded D-spikes for up to 3 h after breakthrough without rundown. Representative control recordings obtained from three cells not treated with QX-314 are shown in Figure 2D.
We examined the effects of DNQX at varying low concentrations (0.5 and 2 μm, 1 and 1.5 μm, 0.75 μm) on the generation of D-spikes in three preparations. DNQX at 1–2 μm reduced EPSP amplitudes by ∼75% and blocked all D-spikes within 5 min. We could not restore D-spikes with depolarization under these conditions. Partial blockade of AMPA/kainate receptors with 0.75 μm DNQX reduced synaptic potentials to about one-half of their normal size (Fig. 3C) and blocked spontaneous production of D-spikes (beginning 1300 s after the start of the experiment) (Fig. 3A,C). After abolition of all D-spikes by 0.75 μm DNQX, depolarization of the cell (Fig. 3B) could restore their occurrence at a low rate but usually not before initiating numerous full-sized somatic APs (Fig. 3C, right). The fast events that could be evoked with depolarization in the presence of AMPAR block appeared to be of similar size and time course as some of the events seen before block (Fig. 3E). These observations are consistent with the spontaneous generation of D-spikes by synaptic depolarization at spike-initiating zones distant from the soma. In the absence of sufficiently large distal synaptic potentials, produced by partial AMPAR block, current injected into the soma preferentially activates a proximal spike generating region in or near the soma rather than a distal dendrite (Fig. 3D).
Figure 3.

Partial block of AMPA receptors inhibits spontaneous D-spikes. A, Cumulative count of D-spikes before and after addition of DNQX. B, Record of current injected through the pipette during the experiment. C, Voltage recording. D, Derivitized voltage with segments between 300 and 350 s and 2500 –2550 s expanded to show the loss of D-spikes but not somatic APs after partial AMPAR block. E, All D-spikes detected during the periods indicated by the white bars over the data in C.
Evidence for T-type Ca2+ channel dependent active responses in granule cells has been reported by two groups, Egger et al. (2003, 2005) in rat and Pinato and Midtgaard (2003, 2005) in turtle. Perfusion with 100 μm NiCl2 for 20 min had a small (17%) slowing effect on time to peak of spontaneous D-spikes in all cells tested (see Materials and Methods; mean difference, 0.76 ± 0.42 ms; n = 6 cells; paired sample t test, 0.005 < p < 0.01). There was also a reliable decrease in amplitude in all cells of 3–28%, with a mean of 18% (mean difference, –1.54 ± 0.81 mV; n = 6; paired sample t test, 0.005 < p < 0.01). These small changes were accompanied by a tendency for instability in resting membrane potential and intermittent short bursts of two or three APs, unless a few picoamperes of negative current, sufficient to hyperpolarize the membrane by 5–10 mV, were applied. Consequently, if no additional hyperpolarizing current was applied during NiCl2 application, D-spike frequency would increase by ∼50% along with SAP generation. We therefore applied enough hyperpolarizing current to try to maintain the SAP rate in NiCl2 similar to the control rate. Under these conditions, the rate of spontaneous D-spike generation was slightly (115 ± 27%) but not significantly increased. The increased frequency and depolarization may be the result of reduced inhibition of mitral cells by granule cells, leading to more excitatory input. It is also possible that T-channels may be contributing Ca2+ to activate Ca2+-dependent K+ channels that control excitability of granule cell dendrites. We have not yet performed imaging experiments in combination with T-channel blockers. Nor have we explored the effect of Ni2+ on T-spikes evoked by localized synaptic stimulation. The time to peak (∼4 ms) and initial rapid rate of recovery of our D-spikes (Fig. 1C) are comparable with somatic APs and almost an order of magnitude faster than the stimulus-evoked, low-threshold spikes described in mammalian granule cells [Egger et al. (2003), their Fig. 6; Egger et al. (2005), their Fig. 8A], suggesting a smaller contribution of T-channels to D-spikes in frog granule cells. Furthermore, unlike rodent granule cells [Egger et al. (2003), their Figs. 4A and 5], we have not yet seen facilitation of Ca2+ transients evoked by backpropagating APs by hyperpolarizing presteps, nor do we observe a voltage-dependent after-spike depolarization (data not shown) (Hall and Delaney, 2002). Thus, although spontaneous production of D-spikes is not blocked by NiCl2, there is some evidence to suggest a contribution of T-type currents to dendritic excitability in frog granule cells.
Figure 6.

Ca2+ transients associated with different electrophysiologically defined D-spikes can be localized to different branches. Each panel shows dendritic spikes from a total of 57 s of simultaneous electrophysiology and imaging. The black segments show those D-spikes that were associated with fluorescence transients and those D-spike plus APs that were associated with transients that were >150% of the size of the transients of EAPs. The gray segments indicate that either no transient was produced by a D-spike or, if an action potential was triggered from a D-spike, a transient was seen with an amplitude similar in size to that produced by EAPs. These data show that transients in the same primary dendrite were associated with D-spikes of a similar size, whereas those in a different dendrite correlated with a different class of dendritic spikes.
Figure 8.
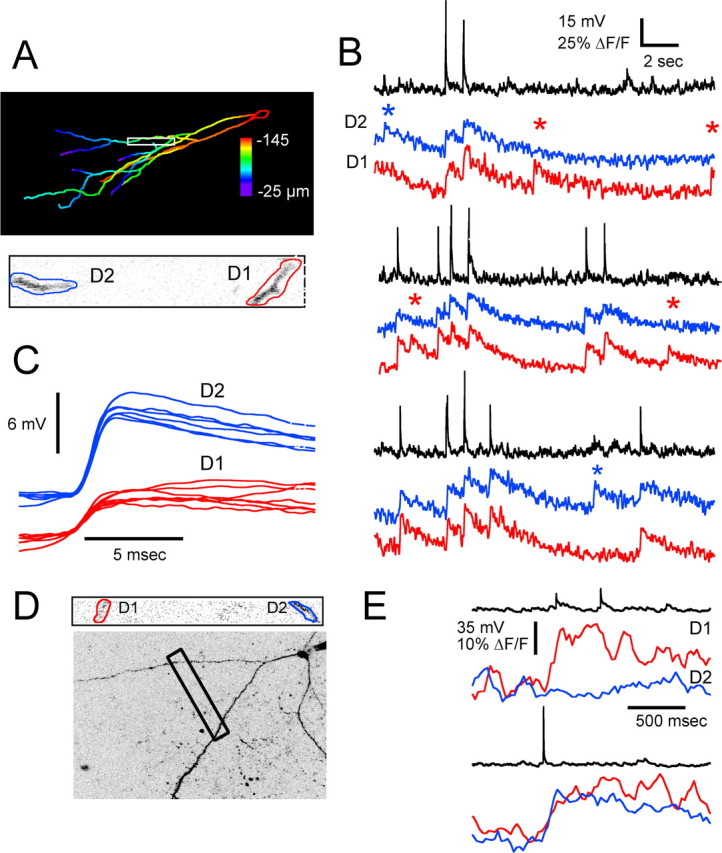
Simultaneous Ca2+ imaging in two branches shows D-spike-associated transients can be restricted to different dendrites. A, Maximum intensity projection with depth below surface encoded by color. B, Simultaneous optical recording from two dendritic segments of the cell shown in A. Asterisks indicate the occurrence of D-spikes in the electrophysiological records, corresponding to two different classes, as shown in C. C, Dendritic spikes corresponding to the non-AP fluorescence transients in each of the dendritic segments are shown on an expanded time scale to illustrate their size and shape. Fluorescence transients associated with each class of D-spike are restricted to one or the other branch, whereas backpropagating current evoked or spontaneous APs invade both dendrites. D, Another cell with two distal dendrites connected via a primary apical dendrite near the soma. Optical recordings were made simultaneously at two locations, as indicated. E, Ca2+ transient associated with D-spike localized to one dendrite (top); somatic action potential causes transient in both branches (bottom).
Figure 4.

Fluorescence (Ca2+) transients associated with somatic action potentials and fast subthreshold events (D-spikes). A, Continuous recording (19.8 s) of somatic membrane potential and fluorescence measured from an 80-μm-long segment of dendrite 250 μm distal to the soma (illustrated in D). EAP indicates action potentials evoked by injection of depolarizing current into the soma. Several D-spikes are indicated by asterisks above the recording, one of which is correlated with a fluorescence transient in the dendrite as indicated by the dashed vertical line. The dots in the ΔF/F trace show measurements from each frame, whereas the solid line is a smoothing polynomial fit to the data. B, C, Expanded views of segments of recording in A, as indicated by the arrows that show the variation in Ca2+ transients produced by spontaneous somatic APs depending on whether they are preceded by dendritic spikes. D, Both dendritic and EAPs produce Ca2+ influx along the length of distal dendrites, and transients produced by spontaneous dendritic spikes are comparable with those produced by EAPs. The black solid line measured from entire length and spines as shown in the accompanying image, the gray solid line, and the black dotted line are measurements made from ∼25% of the distal and proximal ends of the dendrite, as indicated by the lines above the image. E, Fifty D-spike segments extracted from 78 s of recording from this dendrite location. The black traces show eight D-spikes that were associated with either a fluorescence transient alone or a larger than normal SAP-evoked transient (e.g., B). The gray traces show all other occurrences of dendritic spikes. F, Distribution of fluorescence transient amplitudes measured from 20 cells. Amplitudes were normalized to the average of the two EAPs stimulated near the start of each recording period (e.g., A). The top distribution shows responses to D-spikes. The bottom distribution shows transients from SAPs. Class 1 transients are defined as those that were <150% and class 2 as those that were >150% of the size of the average EAP transient.
Figure 5.
Ca2+ transients in single spines compared with adjacent dendrite. A, Responses recorded simultaneously in four spines and dendrite to EAPs and SAPs. Also indicated by arrows are two rare events showing Ca2+ transients that were not associated with either a D-spike or an AP, presumably synaptic in origin, that were restricted to a single spine. B, Two D-spikes (*) with Ca2+ transients (arrows) observed simultaneously in a spine head and adjacent dendrite. The gray traces show Ca2+ responses in the spine head; the black traces shown responses in the dendrite.
The pharmacological and electrophysiological profile of these fast events that we have defined as D-spikes suggests they are active, predominantly sodium-dependent spikes, generated in the periphery by spontaneous synaptic input that occasionally is sufficiently large enough to locally generate a dendritic AP. Activation of excitatory synaptic inputs by stimulation of mitral cells causes a mixed response in granule cells comprised of synaptic potentials, D-spikes, and sometimes SAPs. Similar dendritically generated spikes with a significant Na+ dependence have been reported recently in response to evoked synaptic excitation in isolated turtle olfactory bulb (Pinato and Midtgaard, 2005).
Ca2+ imaging experiments are described in following sections to directly support the conclusion that, although they are subthreshold in the soma, these events correspond to large amplitude suprathreshold action potentials in the dendrites.
Ca2+ transients in dendrites
High-speed imaging of dendrites was performed in 73 cells to characterize dendritic Ca2+ transients to backpropagating APs [SAPs or current-evoked APs (EAPs)] and to determine whether D-spikes that were subthreshold at the soma were correlated with Ca2+ transients in the dendrites. Given the relatively low rate of occurrence of spontaneous D-spikes, we adopted a strategy of measuring fluorescence and electrophysiology continuously over periods of 15–22 s (Fig. 4A). Spontaneous APs and EAPs produced Ca2+ transients in proximal and distal dendrites of all 73 cells. We did not attempt to detect differences in the amplitude of fluorescence transients in proximal versus distal dendrites as reported for mammalian granule cells in brain slice (Egger et al., 2003). Rather than focus on differences in backpropagating somatic AP-evoked Ca2+ in different parts of the neuron, we used the reliable Ca2+ transient resulting from a backpropagating EAP as a standard against which SAP and D-spike Ca2+ transients could be normalized (Fig. 4F). Near the beginning of each recording period, we typically stimulated two EAPs at an interval of 1 s by injecting 45 ms depolarizing current pulses through the electrode. Ca2+ transients generated by SAP or by D-spikes were then compared with the transients produced by action potentials evoked through somatic current injection (Fig. 4A,D,F).
When a Ca2+ transient was observed in the dendrite, in response to an EAP or a SAP, spines that were attached to that dendrite showed a corresponding transient. Examples from two cells are illustrated in Figure 5, A and B. We examined 102 spines in 22 granule cells for which we had Ca2+ and electrophysiological recordings of EAPs and SAPs and could discern at least one spine and a portion of the dendrite from which it originated. For every EAP or SAP, there was evidence for a comparably sized transient in both the spine and the dendrite. For 8 of these 22 cells, we were able to obtain good signal to noise in optical traces in spines (one to three per cell) and a piece of adjacent dendrite for which we had responses to between 5 and 14 APs (EAP or SAP). The average fractional change in fluorescence in the spines was 1.05 ± 0.29 of that in the adjacent dendrite (n = 101 events).
Action potential-evoked Ca2+ transients were seen in all dendrites of the 73 cells that were imaged. For these 73 cells, we examined one primary branch in 35 cells, two different main branches in 33 cells, and three or more branches in five cells. Of the 73 cells we imaged, 60 had spontaneously occurring electrophysiologically defined D-spikes. Our success in finding a spontaneous D-spike-associated Ca2+ transient was probably reduced by the fact that we did not image all branches. For the 60 cells with D-spikes, we imaged one main branch in 23 cells, two branches in 32 cells, and three branches in five cells. We identified D-spike-associated Ca2+ transients in at least one dendrite in 26 (43%) of these cells after imaging one main branch in 10 cells, two branches in 14 cells, and three branches in two cells.
If a D-spike produced a Ca2+ transient, it was comparable in size to that of an EAP or an SAP (see Figs. 4D,F, 5B, 7A). Measuring at different points along a dendrite showed that when a D-spike evoked Ca2+, it did so over a large length (see Figs. 4D, 6, 9E–G).
Figure 7.

D-spikes and fluorescence transients resulting from local stimulation of mitral cells. Stimulating pipette in superficial plexiform layer. Ai–Avi, Membrane potential and fluorescence. In each record, an EAP is followed after 4 s by a single stimulus producing a synaptic response and D-spikes. B, Expanded view of period surrounding stimulus as indicated by the box in left panels. The top trace is dV/dt; the bottom trace is membrane potential. Stimulus intensity was increased from trials i to ii and iii, decreased slightly in iv, increased in v, and increased further in vi. The arrowheads indicate D-spikes that correlated with a fluorescence transient similar in size to the EAP transient or increased transient amplitude when a SAP was produced.
Figure 9.

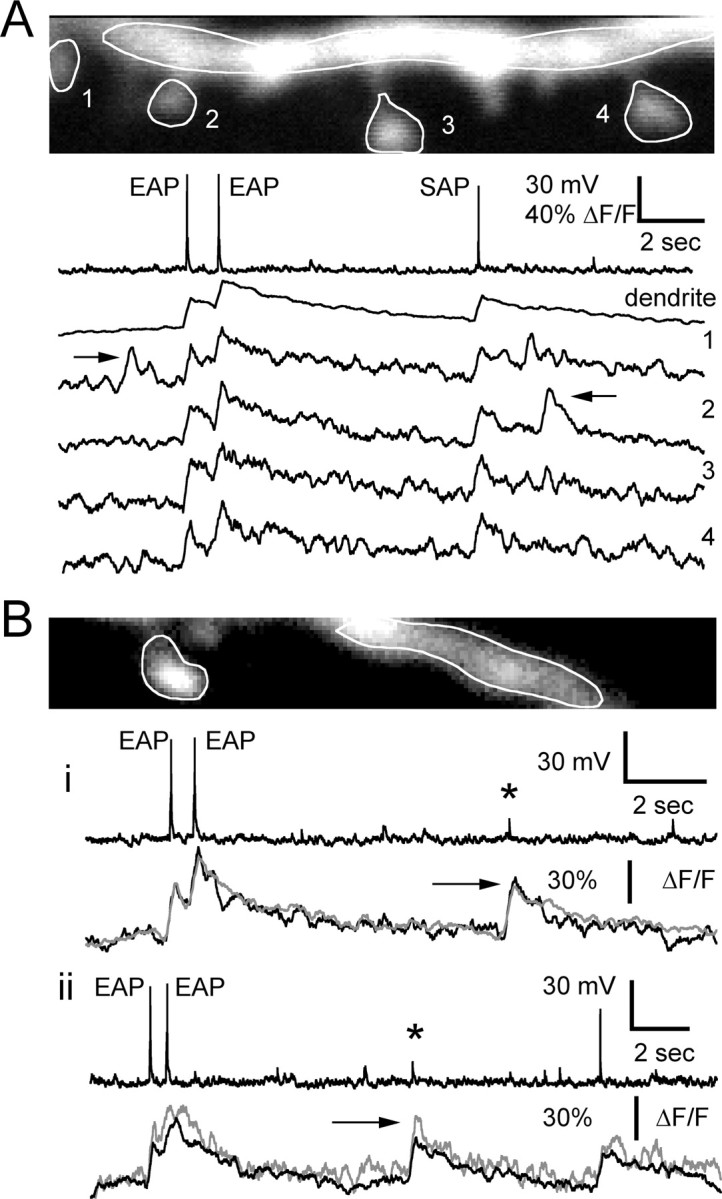
Dendritic spikes produce Ca2+ transients in distal but not proximal portions of the dendrites. A, Location of imaged dendrite sections. B–D, Representative traces of membrane potential and fluorescence transients are shown for each region of dendrite. Inset overlays, All D-spikes observed during 58 s of recording associated with a fluorescence transient are shown in black. For traces in which an AP occurred after the D-spike, a black trace corresponds to a summated Ca2+ response, and a gray trace corresponds to a Ca2+ transient of a size expected from an AP alone. E, Another cell. F–H, Representative traces from each region with D-spikes overlaid as above. D-spikes were recorded over 58 s in F and G and 77.5 s in H. Calibration: B–D, inset, as indicated in B; F–H, insets, as indicated in G. Calibration for bottom traces, as indicated in B, apply to all.
Localized spine Ca2+ transients were described by Egger et al. (2005) in response to minimal synaptic stimulation. In our study, Ca2+ transients in the absence of either an AP or a D-spike that were restricted to individual spines and absent from the adjacent dendrite were observed spontaneously in a small number (five) of instances. Examples of such responses are shown in Figure 5A (arrows), suggesting that there could be synergy between large synaptic responses and D-spikes for the spines that receive synaptic input coincident with a D-spike or an AP.
Because D-spikes occurred spontaneously at rates on the order of 0.5 per second for the cell as a whole and less than once every 10 or more seconds in any given branch, the opportunities for averaging several responses were limited. Nonetheless, when we were able to obtain sufficient signal to noise from single spines, a D-spike-associated Ca2+ transient response was always observed coincident with a transient in the adjacent parent dendrite (Fig. 5B). In six cells, each with one or two spines visible (eight spines total) for which we had at least two recordings of a D-spike Ca2+ transient with good signal to noise, the fractional fluorescence change in the spine was 0.98 ± 0.23 of that in the adjacent dendrite (n = 33 events).
Observing that not all D-spikes evoked Ca2+ transients in the segment of dendrite we were imaging, we hypothesized that some D-spikes originated in other dendrite(s) and did not invade the one we were imaging. Although we could routinely image across 100 μm of visual field, simultaneously imaging from segments of more than one widely separated dendrite was difficult because of the small chance of finding two segments from different dendrites in the same 2- to 3-μm-thick optical section. We therefore compared the electrophysiological waveform of the D-spikes that were associated with Ca2+ transients to those that were not to test for dendrite specific Ca2+ transients. We reliably observed that some of the classes of D-spikes that could be distinguished based on amplitude and rise time were never correlated with Ca2+ transients in the dendrite we were imaging. On the other hand, a subset of D-spikes defined by their similar size and shape were correlated with a Ca2+ transient (Fig. 6) (see also Figs. 7, 9B,G,F). Furthermore, the Ca2+ transients observed sequentially in two different main dendritic branches could be correlated with the occurrence of two different classes of D-spikes (Fig. 6).
Using ON or LOT stimulation to evoke synaptic potentials, we were not able to activate a D-spike without also inducing a full-blown somatic potential. We presume this is because ON and LOT stimuli activate synapses distributed across all dendrites, so the soma can be brought to threshold by the summation of small synaptic potentials distributed across a wide area. Using a small-diameter pipette positioned in the superficial external plexiform layer adjacent to a filled granule cell dendrite, we were able to generate synaptic potentials from small numbers of mitral dendrite synapses and stimulate D-spikes without evoking a somatic spike. Imaging a dendrite of one of these cells showed that only one of the D-spikes that we could evoke was correlated with a Ca2+ transient (Fig. 7Ai–Aiv). Increasing the stimulus intensity evoked both D-spikes and a somatic AP resulting in a summation of the Ca2+ transient amplitude (Fig. 7Avi).
In two cells, we were able to simultaneously measure from two widely separated dendrites that fortuitously passed through the same optical section. In this case, we were able to observe D-spike-evoked Ca2+ transients in one dendrite that did not appear in the other and vice versa (Fig. 8A–C).
In order for D-spikes to be restricted to one or a subset of dendrites, they must “fail” at some point. Because they are recorded as subthreshold events in the soma, they obviously fail in this compartment. Frog granule cells in the posterior region of the bulb where we recorded are often multipolar, and in these cases, the soma suffices to isolate one branch from another. In 26 cells, we confirmed the presence of a D-spike-associated Ca2+ transient in distal dendrites. In eight of these cells, we also made measurements within 10–80 μm of the soma and did not observe any Ca2+ transients in this region in response to a total of >100 D-spikes (Fig. 9). Although there were no Ca2+ transients associated with D-spikes in dendrite proximal to the soma, in these eight cells, we confirmed that EAPs and SAPs always produced clearly detectable transients, which suggests the electrophysiological failure of D-spikes occurs in proximal dendrite near to the soma. Therefore, major branches could possibly be isolated from each other with respect to D-spikes if they arose from a branch-point near the soma. Direct evidence for isolation of D-spikes to separate distal branches with the same parent dendrite was obtained in the one cell with this kind of morphology that we sampled in this way (Fig. 8D,E). Additional specific studies are needed to determine the extent to which this observation is the norm and whether neuromodulation controls the spread of D-spikes.
Interactions between D-spikes and somatic APs
Spontaneous APs were generated at irregular intervals. They were often preceded by one or more D-spikes (Figs. 1D, 4B), and this was particularly evident by examining differentiated voltage recordings (Fig. 1F,G). Ca2+ transients associated with spontaneous APs were either comparable with those from current-evoked APs or approximately twice the amplitude of D-spike- or current-evoked Ca2+ transients (Fig. 4). In every instance (n = 25) in which the Ca2+ transient from a SAP was >1.5 times larger than the current-evoked control AP, a D-spike could be detected preceding the AP, consistent with an approximately linear summation of Ca2+ transients from the D-spike and the backpropagating AP. This summation was observed when the interval between the peak of the D-spike and the peak of the AP was >5–6 ms (Fig. 10A, red traces). This indicates that the dendrite can support repetitive firing or at least a pair of APs at a rate of up to 160–200 Hz. Thus, the effective firing rate in the dendrites is much higher than the maximal firing rate of ∼30 Hz, which can be achieved with suprathreshold current injections to the soma.
Figure 10.

A, D-spikes block backpropagation of somatic APs at intervals of less than ∼6 ms. The traces in A are from the cell from Figure 6, whereas traces in B are from the cell from Figure 9E. The traces were selected based on the presence of a D-spike belonging to the size class that was associated with a fluorescence transient in the imaged dendrite. The black traces are D-spikes without APs, which had fluorescence transients that were comparable with current-evoked AP transients and D-spikes with APs that had nonsummated fluorescence responses. In these cases, the D-spike to AP interval <6 ms. The red traces are D-spikes plus APs that showed summated fluorescence responses (>150% of EAP transient amplitude). Note that summation was only seen with D-spike to AP interval >6 ms. C, Diagrams summarizing the variety of interactions between D-spikes and backpropagating somatically generated APs. The color of branches represents Ca2+ transient amplitude produced by corresponding electrophysiological events. Blue is no change; yellow is equivalent to an evoked somatic action potential; red is equivalent to approximately twice that of an EAP-induced Ca2+ transient. The arrows indicate dendrites 1 and 2, respectively.
Although spontaneous bursts of D-spikes at rates up to 150 Hz were occasionally seen, unless an AP was initiated, we saw either no Ca2+ transient or a transient of a size expected from a single D-spike. This would be consistent with D-spikes independently generated in different dendrites rather than repeated firing in the same dendrite, although given the fact that we relied on spontaneous generation of D-spikes for these measurements, we cannot rule out the possibility that D-spikes can occur repetitively at >100 Hz in the same dendrite. If the interval between a D-spike and a somatic AP was <5–6 ms, no summation of D-spike and AP Ca2+ transients was seen (Fig. 10A,B, black traces). This result is expected if both D-spikes and backpropagating somatic APs are active events, because a brief refractory period would exist after firing of a D-spike, preventing backpropagation of the somatic AP.
Discussion
Spontaneously generated active electrical events were detected by a combination of electrophysiological somatic recordings and dendritic Ca2+ imaging. These active events appeared as 3–21 mV depolarizing spikelets, which rose to peak and initially decayed at rates significantly faster than spontaneous synaptic potentials, comparable with full-sized somatically recorded APs. Their sensitivity to low concentration of internally perfused Na+ channel blocker, their block by hyperpolarizing current, increased frequency with sustained depolarizing current, their rapid time course, and the minimal effects of NiCl2 all argue against their being primarily Ca2+ spikes supported by T-type channels. Both somatically recorded dendritic spikes (D-spikes) and their Ca2+ transients were abolished by partial AMPA-receptor blockade, indicating they were normally initiated by large amplitude (individual or summated) spontaneous postsynaptic potentials. In support of this conclusion, localized stimulation of synaptic inputs from mitral cells with small bore pipettes positioned close to a dendrite could initiate these D-spikes. Given the low rate of spontaneous D-spikes relative to the frequency of spontaneous synaptic inputs, it seems reasonable to hypothesize that these might result from coincident synaptic inputs to a pair or a few adjacent spines on the same branch. It remains to be determined over what distances synaptic inputs can summate locally to be effective in raising the dendrite above threshold.
Additional evidence that the somatically recorded D-spike spikelets resulted from large amplitude, dendritically generated APs was obtained by imaging Ca2+ transients in dendrites that were correlated with D-spikes. Ca2+ transients associated with D-spikes were restricted to dendrites (and spines), more than ∼50–80 μm distal to the soma. The failure to detect Ca2+ transients in the soma or the dendrite proximal to the soma in response to D-spikes does not reflect a lack of voltage-gated Ca2+ channels, because APs that were full sized in somatic recordings produced clear transients in these parts of the cell. Thus, it would appear that D-spikes fail at some point in the proximal dendritic region. Analysis of the waveforms of D-spikes recorded at the soma shows that there are typically several size classes of D-spikes. In most instances, Ca2+ transients in different dendrites were correlated with different D-spike classes, whereas Ca2+ transients measured at different locations along a particular dendrite correlated with only one or a small subset of the electrophysiologically defined D-spikes. This leads to the conclusion that D-spikes are initiated independently in major dendritic branches and are restricted to subsets of dendrites.
Some of our data also show that when a primary dendrite branches a few tens of micrometers from the soma, orthodromically conducting D-spikes from one daughter do not necessarily propagate antidromically out the other. Thus, compartmentalization in the form of branch-specific D-spikes can occur even for granule cells with a single primary dendrite originating from the soma. The different sizes of D-spikes recorded at the soma presumably correspond to properties of the different dendrites such as their diameter or the geometry of their joining the proximal dendritic segment or the soma. Morphological, electrophysiological, and modeling studies will be required to test whether the different D-spike classes correspond to different electrophysiological compartments that are defined by the major branching pattern. Whatever the source of the difference in size, the fact that D-spikes from one dendrite can be much larger than others (Figs. 6, 8) means that some branches are inherently more effective for generating the somatic APs that spread throughout the cell. Inhibitory inputs to proximal dendrite or possibly basal dendrites could potentially enhance the segregation of D-spikes or modulate the efficacy of different branches for the initiation of somatic APs.
Action potentials initiated at or near the soma reliably spread throughout all dendrites to cause a Ca2+ influx in all their spines in mammals (Egger et al., 2003) and frog. Thus, inputs that are sufficient to initiate a somatic AP, whether caused by concentrated input to one region or diffuse input to spines on several dendrites, will produce a potential output signal from all release sites. At the other end of the spectrum, the close proximity of NMDA receptors to presynaptic release apparatus in the spine head (Sassoe-Pognetto and Ottersen, 2000; Sassoe-Pognetto et al., 2003) opens the possibility that release can be driven by Ca2+ entering through these receptors. Voltage-clamp experiments have shown that Ca2+ influx through NMDA receptors alone can sustain release under favorable conditions (Halabisky et al., 2000), and so probably at the very least, this influx contributes to AP-evoked release in activated spines. In mammalian slice, recent studies have shown that voltage-dependent channels within the spine compartment can amplify stimulus evoked synaptic potentials, yet under some conditions, the voltage-gated Ca2+ influx is still localized to a spine, so that even voltage-dependent influx can be highly compartmentalized (Egger et al., 2005). Spontaneous Ca2+ transients restricted to single spines were observed too infrequently in the course of our study to characterize their source (NMDA or voltage-gated Ca2+ channels), but their occurrence (Fig. 5A) supports the hypothesis that individual spine input–output functions can occur in amphibian granule cells as well.
Modeling studies that assumed purely passive dendrites (Woolf et al., 1991) suggested that subsets of spines on a single branchlet or local segment of a dendrite could act as a single compartment in response to large synaptic potentials spreading passively. However, at least for frog granule cells, our data suggest that the local excitability of dendrites is generally such that localized synaptic potentials can produce D-spikes that propagate actively along the length of a dendritic branch to all spines Figure 10C. These may not spread to other dendrites, particularly if they originate independently from the soma or from a bifurcation point near the soma.
In many cell types, the soma separates groups of dendrites, for example, apical from basal or basal from basal in pyramidal cells or different primary dendrites of multipolar interneurons. In granule cells, basal dendrites are probably the site of some or all granule–granule inhibitory synapses (Price and Powell, 1970; Wellis and Kauer, 1994), whereas apical dendrites are the site for mitral–granule reciprocal synapses, so our data provide evidence for possible separation of output to different classes of targets by D-spikes in these cells.
In addition to synchronizing Ca2+ influx into groups of spines located on the same branch, D-spikes also offer the opportunity to increase the total Ca2+ influx and presumably transmitter release when a somatic AP is initiated within >5 ms after the occurrence of a D-spike. Although APs generated by current injected into the soma have relatively long interspike intervals (>30 ms), our Ca2+ imaging indicates that somatic APs can backpropagate into a dendrite that generated a D-spike at intervals as short as 5–6 ms (150–200 Hz). We have not investigated whether it is possible to locally generate trains of D-spikes in the same dendrite at these high rates with focal synaptic stimulation, but nonetheless, the invasion of a dendrite by a somatic spike shortly after the occurrence of a D-spike produces an approximate doubling of the total Ca2+ influx into the spines in the dendrite(s) that fired the D-spike(s). This potentially increases the synaptic output from the branch(es) initiating D-spike(s) compared with other branches or may provide a signal for modification of synapses differentially across branches.
So far, our data indicate that for intervals <5–6 ms, backpropagation of a somatically generated AP is blocked or attenuated into a dendrite that has initiated a D-spike (Fig. 10A,B). A possible consequence of this AP collision may be that during periods of synaptic input, when several dendrites are generating D-spikes and releasing transmitter, spines on dendrites that generate D-spikes within <5 ms of a backpropagating AP (i.e., coincident with the SAP) will experience relatively less Ca2+ influx and presumably release comparatively less transmitter (Fig. 10C). Thus, inhibition onto mitral cells synapsing on this dendrite would be expected to be less compared with others. This selective reduction of inhibition to subsets of mitral cells has a parallel in the reduced feedback inhibition of active mitral cells through activation of metabotropic glutamate receptors on granule cell spines, as described by Hayashi et al. (1993). The narrow temporal window for the block of backpropagation might favor firing mitral cells that are active at the phase of the odor-evoked oscillation immediately before the onset of granule cell AP generation. Another consideration though is that the subset of spines that receive synaptic input that is coincident with and/or responsible for initiating a D-spike or a backpropagating AP would have larger Ca2+ transients, as a result of the combination of an NMDA receptor (synaptic) as well as a voltage-gated Ca2+ channel (D-spike) influx (note that this is not indicated in Fig. 10C).
Thus, for Ca2+ influx into granule cell spines, which will correlate to the efficacy of transmitter release, there are several levels of compartmentalization demonstrated for olfactory granule cells in this and other (Egger et al., 2003, 2005) studies. Ca2+ influx restricted to single spines, groups of spines on separate dendritic branches, or all spines on all branches in response to excitatory synaptic input have been observed, demonstrating that there is the scope for these neurons to control their input–output functions across many spatial scales.
Footnotes
This work was supported by grants to K.R.D. from the Canadian Institutes for Health Research (MOP 14455), the Michael Smith Foundation for Health Research, and the International Collaboration on Repair Discoveries/Rick Hansen Neurotrauma Fund. T.Z. was supported by a Hungarian Eötvös Foundation Fellowship. We thank D. Kleinfeld, W. Denk, and K. Svoboda for technical help with building the two-photon laser scanning system and Z. Nusser and B. Strowbridge for their comments on a draft of this manuscript.
Correspondence should be addressed to K. R. Delaney, Department of Biology, University of Victoria, P.O. Box 3020, Station CSC, Victoria, British Columbia V8W 3N5, Canada. E-mail: kdelaney@uvic.ca.
DOI:10.1523/JNEUROSCI.1419-05.2006
Copyright © 2006 Society for Neuroscience 0270-6474/06/260030-11$15.00/0
References
- Bischofberger J, Jonas P (1997) Action potential propagation into the presynaptic dendrites of rat mitral cells. J Physiol (Lond) 504: 359–365. [DOI] [PMC free article] [PubMed] [Google Scholar]
- Cang J, Isaacson JS (2003) In vivo whole-cell recording of odor-evoked synaptic transmission in the rat olfactory bulb. J Neurosci 23: 4108–4116. [DOI] [PMC free article] [PubMed] [Google Scholar]
- Chen WR, Midtgaard J, Shepherd GM (1997) Forward and backward propagation of dendritic impulses and their synaptic control in mitral cells. Science 278: 463–467. [DOI] [PubMed] [Google Scholar]
- Davison I, Boyd J, Delaney K (2004) Dopamine inhibits mitral/tufted to granule cell synapses in the frog olfactory bulb. J Neurosci 24: 8057–8067. [DOI] [PMC free article] [PubMed] [Google Scholar]
- Delaney KR, Hall BJ (1996) An in vitro preparation of frog nose and brain for the study of odour-evoked oscillatory activity. J Neurosci Methods 68: 193–202. [DOI] [PubMed] [Google Scholar]
- Egger M, Svoboda K, Mainen ZF (2005) Dendrodendritic synaptic signals in olfactory bulb granule cells: spine boost and global low-threshold spike. J Neurosci 25: 3521–3530. [DOI] [PMC free article] [PubMed] [Google Scholar]
- Egger V, Svoboda K, Mainen ZF (2003) Mechanisms of lateral inhibition in the olfactory bulb: efficiency and modulation of spike-evoked calcium influx into granule cells. J Neurosci 23: 7551–7558. [DOI] [PMC free article] [PubMed] [Google Scholar]
- Halabisky B, Friedman D, Radojicic M, Strowbridge BW (2000) Calcium influx through NMDA receptors directly evokes GABA release in olfactory bulb granule cells. J Neurosci 20: 5124–5134. [DOI] [PMC free article] [PubMed] [Google Scholar]
- Hall BJ, Delaney KR (2002) Contribution of a calcium-activated nonspecific conductance to NMDAR mediated synaptic potentials in granule cells of the frog olfactory bulb. J Physiol (Lond) 543: 819–834. [DOI] [PMC free article] [PubMed] [Google Scholar]
- Hanson JE, Smith Y, Jaeger D (2004) Sodium channels and dendritic spike initiation at excitatory synapses in globus pallidus neurons. J Neurosci 24: 329–340. [DOI] [PMC free article] [PubMed] [Google Scholar]
- Hausser M, Mel B (2003) Dendrites: bug or feature? Curr Opin Neurobiol 13: 372–383. [DOI] [PubMed] [Google Scholar]
- Hayashi Y, Momiyama A, Takahashi T, Ohishi H, Ogawa-Meguro R, Shigemoto R, Mizuno N, Nakanishi S (1993) Role of a metabotropic glutamate receptor in synaptic modulation in the accessory olfactory bulb. Nature 366: 687–690. [DOI] [PubMed] [Google Scholar]
- Hoffman DA, Johnston D (1999) Neuromodulation of dendritic action potentials. J Neurophysiol 81: 408–411. [DOI] [PubMed] [Google Scholar]
- Hoffman DA, Magee JC, Colbert CM, Johnston D (1997) K+ channel regulation of signal propagation in dendrites of hippocampal pyramidal neurons. Nature 387: 869–875. [DOI] [PubMed] [Google Scholar]
- Isaacson JS, Strowbridge BW (1998) Olfactory reciprocal synapses: dendritic signaling in the CNS. Neuron 20: 749–761. [DOI] [PubMed] [Google Scholar]
- Kampa BM, Clements J, Jonas P, Stuart GJ (2004) Kinetics of Mg2+ unblock of NMDA receptors: implications for spike-timing dependent synaptic plasticity. J Physiol (Lond) 556: 337–345. [DOI] [PMC free article] [PubMed] [Google Scholar]
- Lowe G (2002) Inhibition of backpropagating action potentials in mitral cell secondary dendrites. J Neurophysiol 88: 64–85. [DOI] [PubMed] [Google Scholar]
- Margrie TW, Sakmann B, Urban NN (2001) Action potential propagation in mitral cell lateral dendrites is decremental and controls recurrent and lateral inhibition in the mammalian olfactory bulb. Proc Natl Acad Sci USA 98: 319–324. [DOI] [PMC free article] [PubMed] [Google Scholar]
- Migliore M, Hoffman DA, Magee JC, Johnston D (1999) Role of an A-type K+ conductance in the back-propagation of action potentials in the dendrites of hippocampal pyramidal neurons. J Comput Neurosci 7: 1–15. [DOI] [PubMed] [Google Scholar]
- Pinato G, Midtgaard J (2003) Regulation of granule cell excitability by a low-threshold calcium spike in turtle olfactory bulb. J Neurophysiol 90: 3341–3351. [DOI] [PubMed] [Google Scholar]
- Pinato G, Midtgaard J (2005) Dendritic sodium spikelets and low-threshold calcium spikes in turtle olfactory bulb granule cells. J Neurophysiol 93: 1285–1294. [DOI] [PubMed] [Google Scholar]
- Price JL, Powell TPS (1970) The synaptology of the granule cells of the olfactory bulb. J Cell Sci 7: 125–155. [DOI] [PubMed] [Google Scholar]
- Saraga F, Wu CP, Zhang L, Skinner FK (2003) Active dendrites and spike propagation in multi-compartment models of oriens-lacunosum/moleculare hippocampal interneurons. J Physiol (Lond) 552: 673–689. [DOI] [PMC free article] [PubMed] [Google Scholar]
- Sassoe-Pognetto M, Ottersen OP (2000) Organization of ionotropic glutamate receptors at dendrodendritic synapses in the rat olfactory bulb. J Neurosci 20: 2192–2201. [DOI] [PMC free article] [PubMed] [Google Scholar]
- Sassoe-Pognetto M, Utvik JK, Camoletto P, Watanabe M, Stephenson FA, Bredt DS, Ottersen OP (2003) Organization of postsynaptic density proteins and glutamate receptors in axodendritic and dendrodendritic synapses of the rat olfactory bulb. J Comp Neurol 463: 237–248. [DOI] [PubMed] [Google Scholar]
- Segev I, London M (2000) Untangling dendrites with quantitative models. Science 290: 744–750. [DOI] [PubMed] [Google Scholar]
- Shepherd GM, Chen WR, Greer CA (2004) Olfactory bulb. In: The synaptic organization of the brain (Shepherd GM, ed), pp 165–216. Oxford: Oxford UP.
- Sjostrom PJ, Nelson SB (2002) Spike timing, calcium signals and synaptic plasticity. Curr Opin Neurobiol 12: 305–314. [DOI] [PubMed] [Google Scholar]
- Tsai P, Nishimura N, Yoder E, White A, Dolnick E, Kleinfeld D (2002) Principles, design and construction of a two photon scanning microscope for in vitro and in vivo studies. In: Methods for in vivo optical imaging, pp 113–171. Boca Raton, FL: CRC.
- Tsubokawa H, Ross WN (1997) Muscarinic modulation of spike backpropagation in the apical dendrites of hippocampal CA1 pyramidal neurons. J Neurosci 17: 5782–5791. [DOI] [PMC free article] [PubMed] [Google Scholar]
- Watanabe S, Hoffman DA, Migliore M, Johnson D (2002) Dendritic K+ channels contribute to spike-timing dependent long-term potentiation in hippocampal pyramidal neurons. Proc Natl Acad Sci USA 99: 8366–8371. [DOI] [PMC free article] [PubMed] [Google Scholar]
- Wellis DP, Kauer JS (1994) GABAergic and glutamatergic synaptic input to identified granule cells in salamander olfactory bulb. J Physiol (Lond) 475: 419–430. [DOI] [PMC free article] [PubMed] [Google Scholar]
- Woolf TB, Shepherd GM, Greer CA (1991) Local information processing in dendritic trees: subsets of spines in granule cells of the mammalian olfactory bulb. J Neurosci 11: 1837–1854. [DOI] [PMC free article] [PubMed] [Google Scholar]