Abstract
The perceptual localization of objects flashed at the time of a saccade often shows large spatial distortions. These perisaccadic mislocalizations exhibit different spatial patterns depending on the experimental condition. In darkness, when only extraretinal information is available, mislocalization is spatially uniform. In light and when visual references are available, mislocalization is directed toward the saccade target, resembling a compression of visual space. These patterns are derived from measurements of the absolute perceived position of the flashed object in egocentric space. Here, we report that also the perceived location of the saccade target is altered when an object is flashed perisaccadically. The mislocalization of the target depends on the presentation time of the flashed object and is directed toward the position of the flash. The resulting compression of the relative distance between target and flash is similar in darkness and in light and can also be found during fixation. When the localization of the flashed object is described relative to the perceived location of the saccade target, spatial compression becomes similar in many experimental conditions. We therefore suggest that perisaccadic compression relies on an encoding of relative spatial locations of objects rather than on localizations in egocentric space.
Keywords: eye movement, saccade, spatial perception, visual perception, human, spatial localization
Introduction
The visual system compensates the changes that a saccade causes to the retinal image and generates a constant percept of space. Cancellation theories of space constancy (Von Helmholtz, 1866; Sperry, 1950; Von Holst and Mittelstaedt, 1950) hold that the command signal from the brain to the eye muscles is used to cancel the image motion on the retina to establish visual stability. However, findings of transient mislocalizations during saccades suggest that either the extraretinal signal is sluggish (Honda, 1991, 1993; Dassonville et al., 1992) or that the cancellation does not account for the visual persistence and latency of the object (Pola, 2004). The “reference object” (Deubel et al., 1984, 1996, 1998, 2002; Deubel, 2004) and “saccade target” (McConkie and Currie, 1996; Currie et al., 2000) theories instead rely on visual information for space constancy and ascribe a particular role to the saccade target. They hold that before each saccade, some information from the presaccadic image, particularly the position and properties of the saccade target, are encoded in memory. After the saccade, the visual system searches for the target near the landing point of the eye. If the target is found, its location is matched with its stored position, and the world is considered stable. If the target location cannot be established, the assumption of visual stability fails. Only in this case does the visual system use extraretinal signals to recalibrate the visual scene with respect to current gaze direction.
To probe the mechanism of visual stability, researchers often exploited the mislocalization of objects flashed shortly before, during, or after a saccade (Matin and Pearce, 1965; Bischof and Kramer, 1968). These mislocalizations likely have their origin in the process that transforms the scene representation before the saccade into the scene representation after the saccade and may thus provide information about the mechanism of visual stability. The saccade target seems to have a special role in the pattern of mislocalization. Morrone et al. (1997) and Ross et al. (1997) reported that flashed bars are mislocalized toward the saccade target in a pattern reflecting a compression of visual space. Additional work also revealed an important role for other visual factors in perisaccadic compression. Compression occurs orthogonal to saccade direction (Kaiser and Lappe, 2004). The strength of compression depends on the contrast of the stimulus (Michels and Lappe, 2004). Compression of flash positions toward the target is only seen when visual references are present after the saccade (Lappe et al., 2000). This last finding relates to the claim of the saccade target theory that the time immediately after the saccade is particular important. At this time, the visual system searches for the saccade target, and the presence of visual references allows evaluation of the previously stored position of the target. Compression may then reflect an error in the process that localizes objects relative to the saccade target. In this case, the perceived location of the saccade target is a critical parameter for the pattern of mislocalization.
Materials and Methods
Subjects
Four male subjects (including the authors), 26–36 years of age, participated in the experiments. All subjects had normal vision and were experienced in psychophysical experiments. With the exception of the two authors, subjects were naive to the particular purpose of the experiments.
Stimuli and experimental set-up
All experiments were performed in a dark room (luminance, ≤0.1 cd/m2). Observers sat 60 cm in front of a large projection screen (Dataframe Cineplex, 120 × 120 cm). The head was fixed with a head/chin rest. All stimuli were generated with a frame rate of 120 Hz by a computer (Indigo 2; Silicon Graphics, Mountain View, CA) and were back projected with a cathode ray tube video projector (ECP 4100; Electrohome, Kitchener, Ontario, Canada) onto the screen.
Procedure
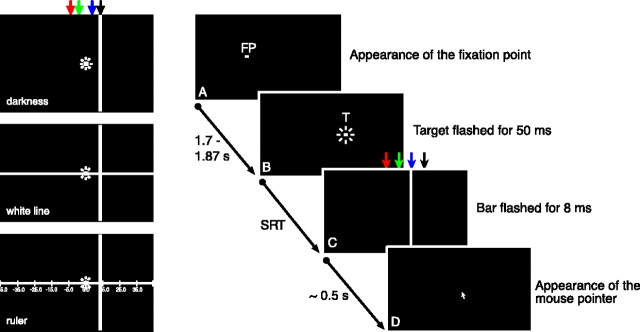
All stimuli were presented on a dark background. Each trial started with the presentation of a fixation dot (0.35 × 0.35°; luminance, 20 cd/m2) 6.4° left of straight ahead (Fig. 1 A). The fixation dot extinguished after a variable time (1700–1870 ms) and simultaneously a saccade target with the same size and luminance as the fixation point appeared for 50 ms 12.8° right of the fixation point (i.e., 6.4° right of straight ahead) (Fig. 1 B). Subjects were asked to perform a saccade from the fixation point toward the saccade target as soon as possible. At unpredictable times around saccade onset, a thin vertical bar (0.5 × 90°; mean luminance, 20 cd/m2) was briefly presented at one of four possible positions for one video frame (8 ms). Two bar positions were located between the fixation point and the saccade target (–2.6 and 2.6° with respect to straight ahead). The other two bar positions were located beyond the saccade target (10 and 13.6° with respect to straight ahead) (Fig. 1C). Approximately 500 ms after the presentation of the saccade target, a mouse pointer appeared in the middle of the screen, 2° above the horizontal axis of the fixation point and the saccadic target (Fig. 1 D). In blocks of trials, subjects were instructed to move the mouse pointer either to the apparent horizontal position of the bar or to the apparent horizontal position of the saccade target. Subjects indicated the apparent positions of target or bar by pressing the left mouse button. At this time, subjects were allowed to freely move their eyes. The location of the mouse pointer was recorded along with the time of the flashed bar. After subjects had pressed the mouse button, a new trial started with the appearance of the fixation dot. All experiments were done in blocks of 100 single trials. Each subject performed at least three series on different days. We tested three different conditions (Fig. 1).
Figure 1.
Spatial arrangement of stimuli and time course of presentation. A, Subjects were presented with a fixation point (FP), 6.4° left of the screen center. B, After a variable time, the fixation point disappeared and a saccade target (T) was presented for 50 ms 12.8° to the right. Subjects had to perform a saccade toward the saccade target as fast as possible. C, Before, during, or after the saccade, a vertical bar was flashed for 8 ms at one of four positions [–2.6° (red), 2.6° (green), 10° (blue), and 13.6° (black)]. D, Approximately 500 ms after the saccade, a mouse pointer appeared and subjects indicated the horizontal perceived position of the saccade target by pressing the left mouse button. The left column shows the three tested conditions in complete darkness (top), with a white line leading to retinal excitation without providing visual references (middle) and with a ruler to provide visual references. SRT, Saccadic reaction time.
Darkness. The first condition was run in complete darkness, and all stimuli were presented on a dark background (Fig. 1, top). The fixation point as well as the saccade target was presented only before the saccade. Therefore, no visual references were available at saccade onset or at the time when the subjects indicated the perceived position of the flashed object.
White line. The second condition presented a white horizontal line (mean luminance, 20 cd/m2) (Fig. 1, middle). The white line was visible during the entire trial. Like the first condition, it did not provide visual references along the horizontal axis, but it induced retinal illumination similar to the third condition (ruler).
Ruler. The third condition added nonambiguous visual references, which were provided by a horizontal ruler displayed on the screen (Fig. 1, bottom). The ruler was a horizontal white line (mean luminance, 20 cd/m2) with short vertical lines at 12.8° intervals, each labeled with a number. One of the marks fell on the fixation point, another on the saccade goal. The ruler was visible during the entire trial.
Data analysis
Horizontal eye position was recorded with an Ober2 infrared eye tracker at a sample rate of 200 Hz. The goggles of the eye tracker restricted the binocular visual field to 30 × 20°. Because of the restricted field of view, subjects were not able to see the edges of the large projection screen. Saccade reaction time for each saccade was determined off-line by a velocity criterion (10% of maximum speed). In addition, the experimenter visually checked each saccade for appropriate direction, amplitude, and timing. Trials in which the saccade did not meet the requirements of the task or trials in which subjects performed a corrective saccade were discarded. For each subject and condition, between 170 and 400 responses were collected.
Mislocalizations during fixation
In control experiments, the same subjects were instructed to keep fixation at the fixation point. Control experiments were performed in the three conditions “darkness,” “white line,” and “ruler.” Subjects were presented with the same visual stimulation as in the saccade experiments (i.e., with target and bar being presented together). In one block, subjects had to localize the perceived position of the saccade target. In another block, subjects had to localize the perceived position of the bar. The bar could appear at one of the four bar positions described above (i.e., at positions –2.6°, 2.6°, 10°, or 13.6°) within a time period of 400 ms after fixation point offset. In line with the saccade experiments, subjects performed at least three blocks of 100 single trials in each experimental condition. Also in line with the saccade experiments, subjects were allowed to freely move their eyes when the mouse pointer appeared on the screen. Eye movements were recorded during the entire experiment. Trials in which the subject did not fixate appropriately were discarded.
Results
Mislocalization during saccades
Mislocalization of the saccade target
Figure 2 shows perceived positions of the saccade target for different positions of the flashed bar for individual subjects as well as the mean over subjects (bottom row). The four curves in each subplot indicate the perceived target positions when the additionally flashed bar was presented at –2.6° (red), 2.6° (green), 10° (blue), or 13.6° (black). Individual curves show a sliding mean with a temporal window of 40 ms. The shaded areas that surround the curves show the corresponding SE.
Figure 2.
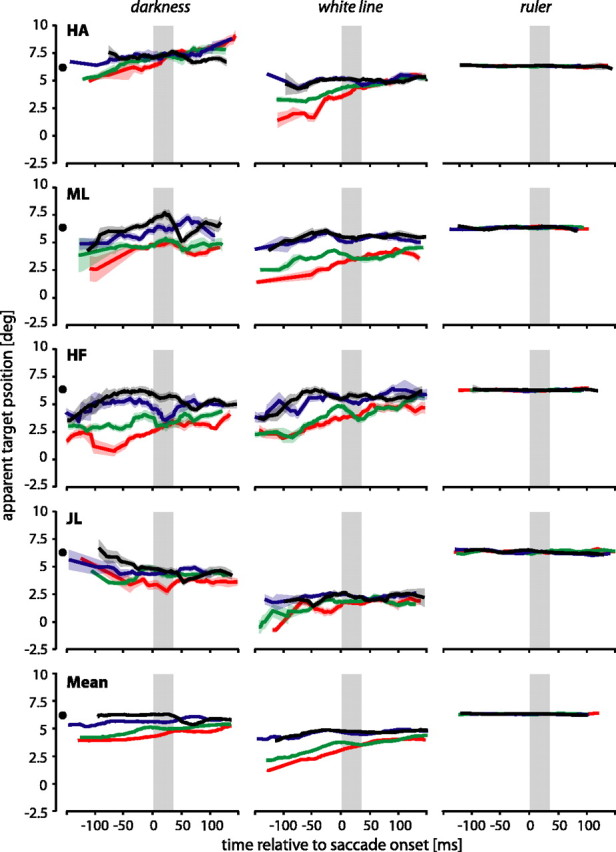
Perceived saccade target positions for the four subjects in the darkness (left), white line (middle), and ruler (right) conditions. The saccade target was always presented at 6.4° (indicated by the filled circle next to the ordinate) for 50 ms when the fixation point disappeared. The curves show the perceived position of the saccade target with respect to the presentation time of the additionally flashed bar. All times are relative to saccade onset. Individual curves show a sliding mean with a temporal window of 40 ms. The surrounding shaded areas show the corresponding SE. The colors of the curves indicate the positions of the flashed bar at –2.6° (red), 2.6° (green), 10° (blue), and 13.6° (black) (see Fig. 1). In the darkness and white line conditions, a separation of the curves depending on the position of the additional presented bar is visible. In general, the red and green curves, which correspond to bar positions left of the target, are always under the blue and black curves, which correspond to bar positions beyond the target. In the ruler condition, the saccade target was presented on top of a ruler tick mark, and here, as expected, no separation of the curves occurred. deg, Degrees.
Although the saccade target was always presented at the same position (6.4°), its apparent position in the darkness and white line conditions varied with the presentation time and location of the flashed bar. For instance, if the bar was flashed immediately before the saccade, at position 2.6°, subject HF reported the saccade target in darkness at 4.5° (Fig. 2, green curve of subject HF in the left column). If the bar was presented 130 ms before saccade onset (i.e., immediately after the presentation of the saccade target), subject HF reported the saccade target at 2.5°.
In the conditions darkness and white line (Fig. 2, left and middle columns), mislocalizations of the saccade target clearly depended on the position of the additionally flashed bar. For instance, subject HF always showed a separation of the red from the black curve in the condition darkness. Approximately 80 ms before saccade onset, this separation is ∼5°. The red curve represents the perceived target positions when the bar appeared at –2.6°, whereas the black curve shows the respective situation when the bar appeared at 13.6°. The four bar positions can be grouped into two positions left of the saccade target (red and green curves) and two positions right of the saccade target (blue and black curves). For all subjects except HA in the darkness condition, the red and green curves always lie below the blue and the black curves. Thus, all subjects show a separation of the curves depending on the position of the flashed bar, albeit to different degrees (compare HA and HF in the darkness condition). The separation of the curves is also evident in the mean data. The separation was statistically significant for all subjects in the darkness and white line conditions (one-way ANOVA; p < 0.001) and was not significant in the ruler condition (one-way ANOVA; p > 0.1). Moreover, the perceived target position is not only influenced by the position of the flashed bar but also depends on the time at which the bar was presented; mislocalizations of the saccade target were strongest when the target and the bar were presented immediately after each other. The longer the time difference between the two objects, the weaker became the separation of the curves. For the majority of the subjects in the darkness and white line conditions, the mislocalizations of the saccade target seem to decrease with increasing time delay of the presentation of the bar. To test this observation, we fitted for each subject and each bar position a regression line to the raw data in the interesting time interval from –150 to 0 ms. We then tested whether the slope of the regression line was statistically different from 0 (t test; p < 0.05). For the white line condition, we found significant differences for subjects HA, ML, and HF at bar position –2.6° (red curve), for all subjects at bar position 2.6° (green curve), and for subject HF at bar positions 10 and 13.6° (blue and black curves). In the condition darkness, slopes were significantly >0 at bar position 13.6° for subjects ML and HF, and at bar position –2.6° for subject ML. In the ruler condition, all subjects perceived the saccade target at its real position at any time, and no separation of the curves could be observed (Fig. 2, right column). This is not surprising because the target location was continuously identified by a tick mark on the ruler. In complete darkness, no other information than extraretinal information is available. The ruler condition provides visual references about horizontal positions via vertical tick marks. These tick marks can be used to embed the saccadic target in the postsaccadic visual scene. In contrast, the white line condition causes retinal excitation but, because there are no tick marks, does not provide any visual references about horizontal positions that could be used to embed the saccadic target in the postsaccadic visual scene. Hence, this condition is similar to the darkness condition but very different from the ruler condition.
Saccade amplitudes
Do saccade amplitudes change along with the perceptual mislocalization of the saccade target? Figure 3 shows deviations of saccade amplitudes from mean amplitudes for the different flash positions. These deviations are small for most of the time (i.e., saccade amplitudes were mostly not affected by the flash position). A separation of the curves only occurred when the bar was presented shortly after the saccadic target and, hence, long before saccade onset (Fig. 3, subject HF in condition darkness or subject HA in condition white line). In this case, saccade amplitudes were affected by bar positions. Saccadic amplitudes for JL and HA were less affected for bar presentation long before the saccade in the darkness, presumably because these subjects also did not show much target mislocalization (Fig. 2) at that time in this condition.
Figure 3.
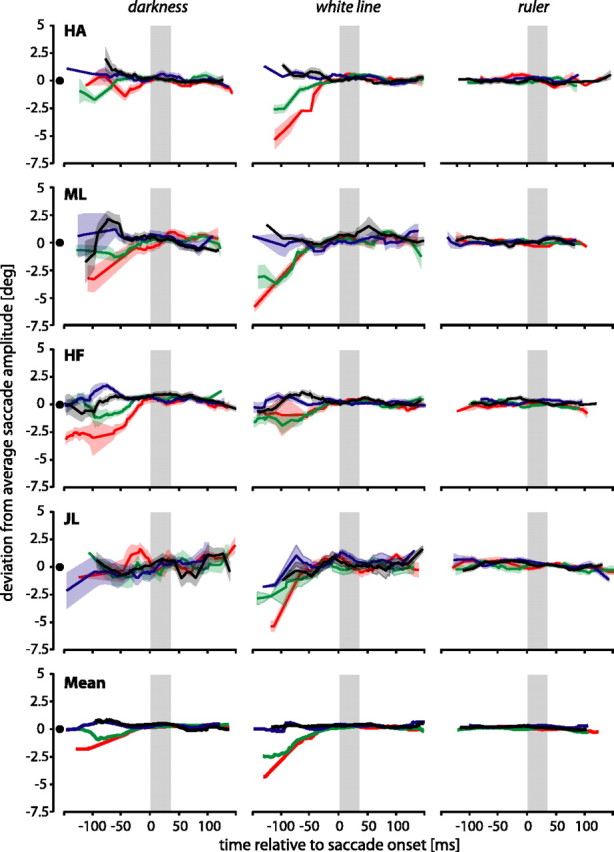
Deviations of saccade amplitude from average saccade amplitude when bars were flashed at various times relative to saccade onset. The colors of the curves indicate the position of the flashed bar (same conventions as in Fig. 2). The x-axis shows the presentation time of the flashed bar. The y-axis shows the deviation of a particular saccade from average saccade amplitude.
Mislocalization of the bar
The time course of mislocalizations of the bar differed from the time course of mislocalizations of the saccade target. Figure 4 shows apparent bar positions. Data in the darkness and ruler conditions were available for our subjects from previous experiments with identical stimulation procedures (Lappe et al., 2000). Data in the white line condition were recorded in a new recording session. In contrast to the mislocalization of the saccade target, the mislocalizations of the flashed bar typically started ∼50 ms before saccade onset, reached a maximum around the beginning of the saccade, and returned to baseline shortly after the saccade (Fig. 4, subject HA in the white line condition). Figure 4 also shows that the pattern of mislocalization of the flashed bar depended on whether visual references were available. In darkness, all four bar positions were uniformly mislocalized (i.e., at any point in time the distances between the four curves remain constant) (Fig. 4, left column). When visual references were available, this overall mislocalization pattern changed. For subjects ML and JL, distances between curves became smaller around saccade onset (Fig. 4, right column), indicating a compression of space. This compression was somewhat weaker for subjects HA and HF, but it can still be seen in the mean data across subjects (bottom row). To quantify the compression, we calculated a compression index, which confirmed a stronger compression in the presence of visual references than in darkness (see below, Compression of bar-target distance).
Figure 4.
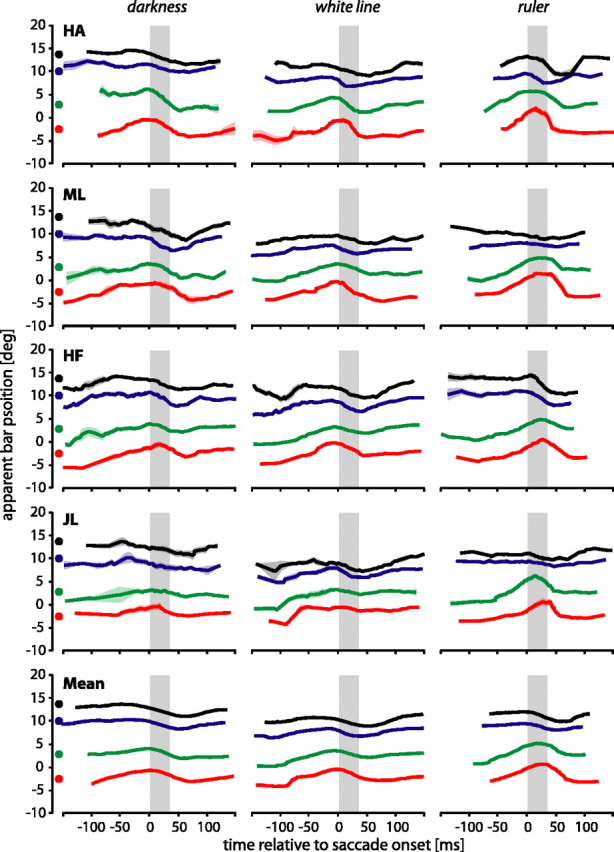
Perceived bar positions for the four subjects in the darkness (left), white line (middle), and ruler (right) conditions. Individual curves show a sliding mean with a temporal window of 40 ms. The surrounding shaded areas show the corresponding SE. Colors correspond to the real bar positions at –2.6° (red), 2.6° (green), 10° (blue), and 13.6° (black). The real bar positions are indicated by color-filled circles next to the ordinate. Gray bars show the mean saccade duration.
Mislocalization during fixation
Mislocalization of the target
To investigate whether the mislocalization of the saccade target depended on the saccade itself, we performed control experiments in which the saccade target and/or the bar were shown, but subjects were asked to keep fixation at the fixation point throughout the entire trial. Consistent with previous findings in conditions of steady fixation (Müsseler et al., 1999; Eggert et al., 2001; Sheth and Shimojo, 2001), the flashed object was often perceived somewhat closer toward the fovea than it was presented. This underestimation has been linked to a visual memory effect (Sheth and Shimojo, 2001) or a mismatch between egocentric and exocentric location mechanisms (Eggert et al., 2001), but its exact cause is still unknown. However, in addition to this general underestimation of the saccade target, we found a strong influence of the flashed bar on the perceived position of the saccade target in the darkness and white line conditions (Fig. 5, left and middle columns). As in the saccade experiments, the mislocalizations of the saccade target depended on the position of the additionally flashed bar: almost all subjects showed a separation of the red and green curves (which correspond to bar positions left of the target) from the blue and black curves (which correspond to bar positions right of the target). The separation of the curves was largest, ∼150–200 ms, after fixation point offset, which is, interestingly, in the range of a typical saccade latency. As expected, there was no separation of the curves in the condition when the ruler was present (Fig. 5, right column).
Figure 5.
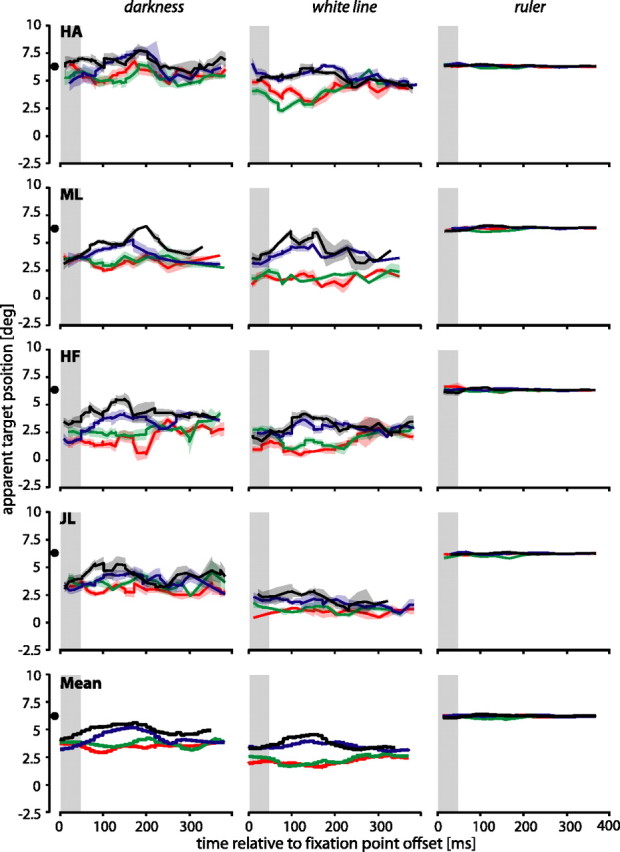
Perceived target positions during steady fixation. The time axis gives the presentation time of the flashed bar relative to fixation point offset. The gray shaded areas show the time when the target was present. All other conventions are the same as in Figure 2.
Mislocalization of the bar
Figure 6 shows the results of the fixation experiments in which subjects had to localize the perceived position of the bar. There is a general underestimation in the apparent position of the bar, but in contrast to the saccade experiments, which clearly showed a maximal mislocalization of the bar around saccade onset (Fig. 4), the results during steady fixation show no variation over time (Fig. 6).
Figure 6.
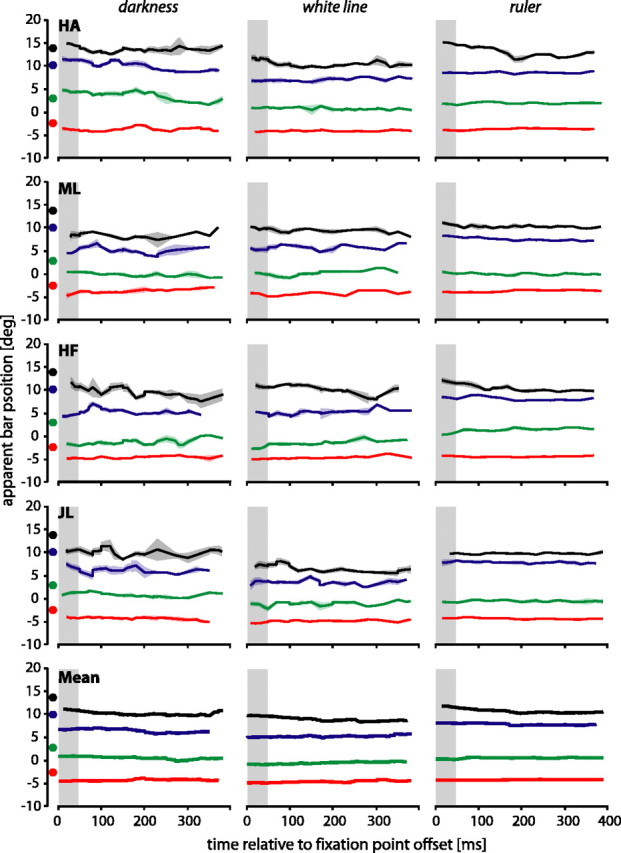
Perceived bar positions during steady fixation. The gray shaded are as show the time when the target was present. All other conventions are the same as in Figure 2.
Compression of bar-target distance
In previous work, we defined two index measures to compare the overall amount of mislocalization in saccade direction (shift index) and in the strength of compression of visual space (compression index) across subjects and conditions (Lappe et al., 2000; Awater and Lappe, 2004; Awater et al., 2005). The shift index was defined as the mean of the four perceived bar positions for each point in time. The compression index was defined as the SD across the four perceived bar positions, respectively. Using these indices, we found strong compression when visual references were available and much less compression in darkness (Lappe et al., 2000). The indices, however, did not take into account the shift of apparent position of the saccade target. We therefore call this an absolute compression of bar position. The present experiments, in contrast, also showed that the saccade target is mislocalized if its position is not exactly determined by visual references (darkness and white line conditions). The mislocalizations of the saccade target in these conditions, at least for the positions left of the saccade target, are such that its apparent position is drawn toward the additionally flashed bar. To analyze this further, we calculated a relative compression index that considered also the perceived position of the saccade target (Fig. 7A). The relative compression was determined by calculating the distance between the perceived bar and the perceived target position for each bar position and flash time, normalized to the real distance between both objects. The mean over all four bar positions gives a measure of the relative compression over time.
Figure 7.
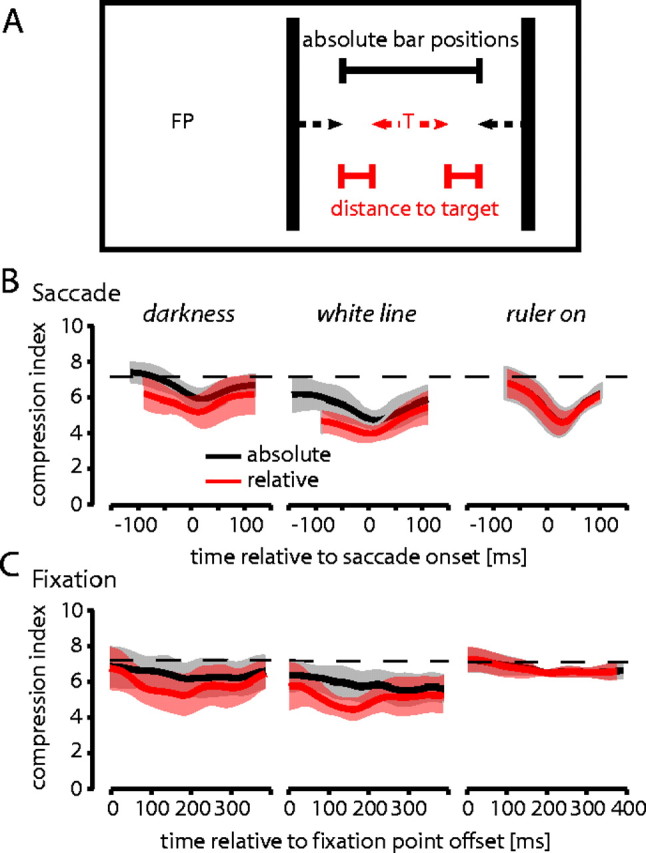
Absolute (black) and relative (red) compression indices averaged across subjects (for calculation, see Results). Shaded areas indicating the SD across subjects. In the last 50 ms before saccade onset, relative compression is stronger than absolute compression in the darkness and white line conditions. In contrast, there is no such difference between absolute and relative compression in the ruler condition.
We performed this analysis for each subject and condition. Figure 7 shows the absolute (black curves) and relative (colored curves) compression indices averaged across subjects for the three conditions (darkness, white line, and ruler) in the saccade experiments (Fig. 7B) and in the fixation experiments (Fig. 7C). In both saccade and fixation experiments, relative compression was stronger in the conditions in which the position of the saccade target was not determined by visual references (i.e., darkness and white line conditions). In the ruler condition, relative and absolute compressions were identical in saccade and fixation experiments. The strength of relative compression in the 50 ms before saccade onset was very similar in all conditions but the ruler condition during fixation.
Discussion
Perisaccadic compression has been manifested previously as the mislocalization of the absolute position of the object in space, assuming that the saccade target is perceived at its real position (Morrone et al., 1997; Lappe et al., 2000; Burr et al., 2001). We found that this assumption is not always true. A transient saccade target is mislocalized toward an additionally flashed object if its position is not determined by visual references. Although absolute compression is strong only in the presence of visual references (Lappe et al., 2000), relative compression, which takes into account the mislocalization of the saccade target, is of similar strength in the presence and the absence of visual references. We conclude that the compression reflects an error in the relative distance measure between the target and another object.
Mislocalization of bar and target positions
Mislocalization of the flashed bar starts ∼70 ms before and peaks at approximately saccade onset. Mislocalization of the saccade target is strongest when the target and bar are presented immediately after each other (i.e., long before saccade onset). During steady fixation, mislocalization patterns of the target are similar to those during a saccade. The localization of the bar, in contrast, is clearly different between fixation and saccade, showing a clear time course only during saccades. Therefore, bar and target mislocalization must, at least in part, reflect different mechanisms.
When a distractor is near a saccade target, the saccade end-point often falls between target and distractor (Findlay, 1982; Ottes et al., 1984; Eggert et al., 2002). Saccadic amplitudes of our subjects were influenced by the flashed bar up to 50 ms before saccade onset. At this time, target selection by the visual system may have averaged the apparent position of the target and the flashed bar and changed the amplitude of the saccade accordingly. However, a change of perceived target position was also seen shortly before saccade onset. At this time, saccade amplitude cannot be modified. Still, the flashed bar shifted perceived target position. It is therefore unlikely that the apparent target shift is a direct consequence of saccade amplitude modification. More parsimoniously, the mislocalization reflects a visual effect that, if time permits, can change the saccade amplitude as well.
Presaccadically, the saccade target is the locus of visual attention (Hoffmann and Subramaniam, 1995; Kowler et al., 1995; Deubel and Schneider, 1996). An abruptly appearing object attracts visual attention (Yantis and Jonides, 1984; Remington et al., 1992). Therefore, the flash of the bar might distract attention away from the saccade target position and toward the flashed bar. This distraction of attention may contribute to the localization errors if subjects after the saccade report the presaccadic locus of attention as the saccade target position.
A two-step theory of perisaccadic localization
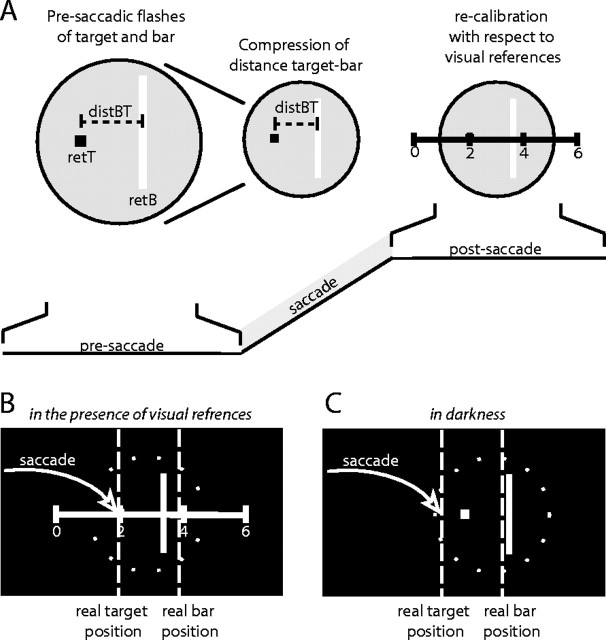
We believe our results can be explained by a combination of processes of encoding and retrieval of location information in perisaccadic localization (Fig. 8). In our model, compression originates in the presaccadic encoding stage, but its manifestation in perceptual judgments is influenced by the combination with other signals in the postsaccadic retrieval stage. In the first step, the encoding, retinal information is gathered from the saccade target position (retT) and from the position of the flashed bar (retB) (Fig. 8A). We assume that at this stage also the relative distance between bar and target is encoded (distBT). If the bar is flashed near saccade onset, this encoding of the bar-target distance is compressed. Different processes may contribute to this distance compression for bar and target and may either require the execution of the saccade or act also during fixation. The second step, the retrieval, takes place after the saccade and uses the encoded presaccadic information (retT, retB, and distBT) together with extraretinal information about the change in eye position (xEP) and visual information about the postsaccadic retinal position of the saccade target (postT). These signals are used in combination to anchor the presaccadic signals to the postsaccadic scene. The exact combination of the signals at the retrieval stage predicts whether the bar location will appear compressed, whether the target location will appear shifted, or both. We assume that in different experimental conditions, these signals are used to different degrees depending on preferences in the system and the reliability of the respective signal (cf. Niemeier et al., 2003).
Figure 8.
An encoding and retrieval model of perisaccadic localization. A, In a first step, the presaccadic encoding, retinal positions of bar (retB) and target (retT) as well as the retinal distance between the target and bar (distBT) is encoded. If the bar is flashed near saccade onset, this distance is compressed. In a second step, the postsaccadic retrieval, the encoded information is embedded in the postsaccadic visual scene. This step takes place after the saccade and uses, depending on the information available after the saccade, a combination of extraretinal eye position information and visual information about postsaccadic retinal positions to anchor the presaccadically encoded relationships in the postsaccadic scene. The exact combination of the signals at the retrieval stage predicts whether the bar location will appear compressed, whether the target location will appear shifted, or both. B, Postsaccadic visual references provide an anchor point for the saccade target. The compressed retinal distance between bar and target leads to absolute a compression of the bar positions. C, In the absence of postsaccadic visual information, extraretinal eye position signals must be used to relate the stored presaccadic information to the postsaccadic scene. Although the extraretinal eye position signal may be imprecise, it can be used to locate the bar slightly shifted from its veridical position. The target is mislocalized according to the compression of the bar-target distance.
For a saccade in the presence of visual references, postsaccadic visual information about the location of the target is available (Fig. 8B). Experiments on the saccade object theory (Deubel et al., 1996, 1998, 2002; McConkie and Currie, 1996; Currie et al., 2000; Deubel, 2004) suggest that this information is preferentially used by the visual system to assure visual stability. In this case, our model would combine accurate postsaccadic target position with a compressed bar-target distance signal leading to a strong absolute compression of the bar position toward the target. Without postsaccadic visual references (Fig. 8C), the saccade target theory holds that extraretinal eye position signals are used to relate the stored presaccadic information to the postsaccadic scene. We may assume that the extraretinal eye position signal is imprecise and leads to position shifts (Honda, 1989, 1991, 1993; Dassonville et al., 1992). However, if the visual system were to use the relative distance encoding between bar and target for the postsaccadic scene reconstruction, then the extraretinal eye position signal may either be used to retrieve target position followed by retrieval of bar position from the relative distance encoding, or the extraretinal signal may be used to retrieve bar position followed by retrieval of target position from the relative distance encoding. In the first case, the target position would appear accurate and the bar position would appear compressed. In the second case, the bar position would appear accurate, and the target position would appear compressed. The observation of apparent shifts of the target position suggests that the system follows the second case in our experimental conditions. Perhaps the bar gives a more reliable signal, because it is larger and more intense than the target and also because it is closer in time to the postsaccadic report. If this assumption is correct, a straightforward prediction would be that if the size and intensity of the flashed bar is decreased, the bar should no longer serve as the anchor point to which the target is localized. Thus, by creating an experimental condition in which the salience of the bar is decreased and the salience of the target is increased, we would expect an absolute compression of bar positions even in darkness.
During fixation, the second step (postsaccadic retrieval) is not necessary. The system may directly use the visual signals of target position (retT), bar position (retB), or bar-target distance (distBT). The fact that we observe a mislocalization in this condition at all suggests that the relative encoding of bar-target distance is used and that this compression occurs at least to some degree independently of the saccade. Again, we must differentiate between the presence and absence of visual reference information about target position. Without visual references, we observed a mislocalization of the saccade target but less mislocalization of the bar. This suggest that the bar position is registered accurately and that the target position is retrieved from the compressed bar-target distance. This is very similar to the saccade case, and the argument that the bar is the more reliable signal because of its size, intensity, and nearness in time to the report may be applied to both cases. With visual references, localization of both bar and target is essentially veridical. We assume that in this case, the target position is not retrieved from the bar-target distance but directly form the retinal position of the target and the associated visual reference information.
Origin of bar-target compression
In the above explanation, perisaccadic compression arises from the compression of the relative distance between the saccade target and the bar. Such compression occurs both under saccade conditions and under conditions of fixation, although possibly by different mechanisms. There are a number of possibilities how such compression may arise. Under conditions of fixation, mislocalizations of flashed objects often occur toward the fovea, but they are influenced by additional visual references (Musseler et al., 1999; Sheth and Shimojo, 2001). These mislocalizations may be caused by a mismatch between egocentric and exocentric localization mechanisms (Eggert et al., 2001). Sheth and Shimojo (2001) found larger mislocalizations when the interstimulus interval between two successively presented objects became larger and suggested a visual memory effect as the underlying mechanism of the mislocalizations.
Another possibility is that the bar-target distance is compressed because of modulatory influences of either a saccade plan or the shift of the attentional focus induced by the appearance of the target. Hamker et al. (2004) proposed that perisaccadic compression is induced by an oculomotor reentry signal originating from the frontal eye field or the superior colliculus. This reentry signal modulates the gain of neural responses to flashed stimuli in the vicinity of the saccade target. The gain modulation distorts the spatial profile of activity in a cortical map of perceptual space such that the activity maximum is shifted toward the target position. Consistent with the two-step theory, the reentry modulation and the associated distance compression occurs in visual coordinates before saccade execution. The reentry signal also acts as an emergent attentional gain factor to increase performance at the attended location (Hamker, 2005). Thus, the compression observed for saccades should also occur during fixation provided that the shift of attention toward the target position is strong enough.
Footnotes
M.L. was supported by the German Science Foundation (Deutsche Forschungsgemeinschaft LA-952/2 and LA-952/3), the German Federal Ministry of Education and Research BioFuture Prize, and the European Community Project Drivsco.
Correspondence should be addressed to Markus Lappe, Psychological Institute II, Westfalian Wilhelms-University, Fliednerstrasse 21, 48149 Muenster, Germany. E-mail: mlappe@psy.uni-muenster.de.
DOI:10.1523/JNEUROSCI.2407-05.2006
Copyright © 2006 Society for Neuroscience 0270-6474/06/260012-09$15.00/0
References
- Awater H, Lappe M (2004) Perception of visual space at the time of pro- and anti-saccades. J Neurophysiol 91: 2457–2464. [DOI] [PubMed] [Google Scholar]
- Awater H, Burr D, Lappe M, Morrone MC, Goldberg ME (2005) The effect of saccadic adaptation on the localization of visual targets. J Neurophysiol 93: 3605–3614. [DOI] [PubMed] [Google Scholar]
- Bischof N, Kramer E (1968) Untersuchungen und Ueberlegungen zur Richtungswahrnehmung bei willkuerlichen sakkadischen Augenbewegungen. Psychologische Forschung 32: 185–218. [DOI] [PubMed] [Google Scholar]
- Burr DC, Morrone MC, Ross J (2001) Separate visual representations for perception and action revealed by saccadic eye movements. Curr Biol 11: 798–802. [DOI] [PubMed] [Google Scholar]
- Currie CB, McConkie GW, Carlson-Radvansky LA, Irwin DE (2000) The role of the saccade target object in the perception of a visually stable world. Percept Psychophys 62: 673–683. [DOI] [PubMed] [Google Scholar]
- Dassonville P, Schlag J, Schlag-Rey M (1992) Oculomotor localization relies on a damped representation of saccadic eye displacement in human and nonhuman primates. Vis Neurosci 9: 261–269. [DOI] [PubMed] [Google Scholar]
- Deubel H (2004) Localization of targets across saccades: role of landmark objects. Vis Cogn 11: 173–202. [Google Scholar]
- Deubel H, Schneider WX (1996) Saccade target selection and object recognition: evidence for a common attentional mechanism. Vision Res 36: 1827–1837. [DOI] [PubMed] [Google Scholar]
- Deubel H, Wolf W, Hauske G (1984) The evaluation of the oculomotor error signal. In: Theoretical and applied aspects of eye movement research (Gale AG, Johnson F, eds), pp 55–62. Amsterdam: Elsevier.
- Deubel H, Schneider WX, Bridgeman B (1996) Postsaccadic target blanking prevents saccadic suppression of image displacement. Vision Res 36: 985–996. [DOI] [PubMed] [Google Scholar]
- Deubel H, Bridgeman B, Schneider WX (1998) Immediate post-saccadic information mediates space constancy. Vision Res 38: 3147–3159. [DOI] [PubMed] [Google Scholar]
- Deubel H, Schneider WX, Bridgeman B (2002) Transsaccadic memory of position and form. Prog Brain Res 140: 165–180. [DOI] [PubMed] [Google Scholar]
- Eggert T, Ditterich J, Straube A (2001) Mislocalization of peripheral targets during fixation. Vision Res 41: 343–352. [DOI] [PubMed] [Google Scholar]
- Eggert T, Sailer U, Ditterich J, Straube A (2002) Differential effect of a distractor on primary saccades and perceptual localization. Vision Res 42: 2969–2984. [DOI] [PubMed] [Google Scholar]
- Findlay JM (1982) Global visual processing for saccadic eye movements. Vision Res 22: 1033–1045. [DOI] [PubMed] [Google Scholar]
- Hamker FH (2005) The reentry hypothesis: the putative interaction of the frontal eye field, ventrolateral prefrontal cortex, and areas V4, IT for attention and eye movement. Cereb Cortex 15: 431–447. [DOI] [PubMed] [Google Scholar]
- Hamker FH, Zirnsak M, Lappe M (2004) A computational model of saccadic mislocalization of briefly flashed stimuli based on spatial reentry. J Vision [Suppl] 4: 736a. [Google Scholar]
- Hoffmann JE, Subramaniam B (1995) The role of visual attention in saccadic eye movements. Percept Psychophys 57: 787–795. [DOI] [PubMed] [Google Scholar]
- Honda H (1989) Perceptual localization of visual stimuli flashed during saccades. Percept Psychophys 45: 162–174. [DOI] [PubMed] [Google Scholar]
- Honda H (1991) The time courses of visual mislocalization and of extraretinal eye position signals at the time of vertical saccades. Vision Res 31: 1915–1921. [DOI] [PubMed] [Google Scholar]
- Honda H (1993) Saccade-contingent displacement of the apparent position of visual stimuli flashed on a dimly illuminated structured background. Vision Res 33: 709–716. [DOI] [PubMed] [Google Scholar]
- Kaiser M, Lappe M (2004) Perisaccadic mislocalization orthogonal to saccade direction. Neuron 41: 293–300. [DOI] [PubMed] [Google Scholar]
- Kowler E, Anderson E, Dosher B, Blaser E (1995) The role of attention in programming of saccades. Vision Res 35: 1897–1916. [DOI] [PubMed] [Google Scholar]
- Lappe M, Awater H, Krekelberg B (2000) Postsaccadic visual references generate presaccadic compression of space. Nature 403: 892–895. [DOI] [PubMed] [Google Scholar]
- Matin L, Pearce DG (1965) Visual perception of direction for stimuli flashed during voluntary saccadic eye movements. Science 148: 1485–1488. [DOI] [PubMed] [Google Scholar]
- McConkie GW, Currie CB (1996) Visual stability across saccades while viewing complex pictures. J Exp Psychol Hum Percept Perform 22: 563–581. [DOI] [PubMed] [Google Scholar]
- Michels L, Lappe M (2004) Dependence of saccadic compression and suppression on contrast. Vision Res 44: 2327–2336. [DOI] [PubMed] [Google Scholar]
- Morrone MC, Ross J, Burr DC (1997) Apparent position of visual targets during real and simulated saccadic eye movements. J Neurosci 17: 7941–7953. [DOI] [PMC free article] [PubMed] [Google Scholar]
- Müsseler J, van der Heijden AH, Mahmud SH, Deubel H, Ertsey S (1999) Relative mislocalization of briefly presented stimuli in the retinal periphery. Percept Psychophys 61: 1646–1661. [DOI] [PubMed] [Google Scholar]
- Niemeier M, Crawford JD, Tweed DB (2003) Optimal transsaccadic integration explains distorted spatial perception. Nature 422: 76–80. [DOI] [PubMed] [Google Scholar]
- Ottes FP, Van Gisbergen JA, Eggermont JJ (1984) Metrics of saccade responses to visual double stimuli: two different modes. Vision Res 24: 1169–1179. [DOI] [PubMed] [Google Scholar]
- Pola J (2004) Models of the mechanism underlying perceived location of a perisaccadic flash. Vision Res 44: 2799–2813. [DOI] [PubMed] [Google Scholar]
- Remington RW, Johnston JC, Yantis S (1992) Involuntary attentional capture by abruptly onsets. Percept Psychophys 51: 279–290. [DOI] [PubMed] [Google Scholar]
- Ross J, Morrone MC, Burr DC (1997) Compression of visual space before saccades. Nature 386: 598–601. [DOI] [PubMed] [Google Scholar]
- Sheth BR, Shimojo S (2001) Compression of space in visual memory. Vision Res 41: 329–341. [DOI] [PubMed] [Google Scholar]
- Sperry RW (1950) Neural basis of the spontaneous optokinetic response produced by visual inversion. J Comp Physiol Psychol 43: 482–489. [DOI] [PubMed] [Google Scholar]
- Von Helmholtz H (1866) Handbuch der Physiologischen Optik. Hamburg: Leopold Voss.
- Von Holst E, Mittelstaedt H (1950) Das Reafferenzprinzip (Wechselwirkung zwischen Zentralnervensystem und Peripherie). Naturwissenschaften 37: 464–476. [Google Scholar]
- Yantis S, Jonides J (1984) Abrupt visual onsets and selective attention: evidence from visual search. J Exp Psychol Hum Percept Perform 10: 601–621. [DOI] [PubMed] [Google Scholar]


