

Abstract
Directing attention to some acoustic features of a sound has been shown repeatedly to modulate the stimulus-induced neural responses. On the contrary, little is known about the neurophysiological impact of auditory attention when the auditory scene remains empty. We performed an experiment in which subjects had to detect a sound emerging from silence (the sound was detectable after different durations of silence). Two frontal activations (right dorsolateral prefrontal and inferior frontal) were found, regardless of the side where sound was searched for, consistent with the well established role of these regions in attentional control. The main result was that the superior temporal cortex showed activations contralateral to the side where sound was expected to be present. The area extended from the vicinity of Heschl's gyrus to the surrounding areas (planum temporale/anterior lateral areas). The effect consisted of both an increase in the response to a sound delivered after attention was directed to detect its emergence and a baseline shift during the silent period. Thus, in absence of any acoustic stimulus, the search for an auditory input was found to activate the auditory cortex.
Keywords: sustained attention; fMRI; auditory; sparse sampling; listening in silence; human cognition, behavior, and anatomy
Introduction
Goal-directed attention is described as a dynamic process involved in behavioral situations such as voluntary orientation or event expectancy, all resulting in a modulation of the sensory processing of the attended stimulus (Rees and Lavie, 2001; Chun and Marois, 2002; Corbetta and Shuman, 2002). Many neuroimaging studies, mostly concerning the visual modality, provided evidences for a top-down control by which high-level brain areas influence sensory-specific regions to select the behaviorally relevant information (Chawla et al., 1999; Kastner et al., 1999; Downar et al., 2000; Kanwisher and Wojciulik, 2000; Kastner and Ungerleider, 2000; Herrmann and Knight, 2001; Hopfinger et al., 2001; Corbetta and Shuman, 2002; Lipschutz et al., 2002; Pessoa et al., 2003; Petkov et al., 2004). Stimulus expectancy has been shown to modulate activity in the visual areas (V1, V2, V3, V4) both before (i.e., baseline shift) and after (i.e., sensory processing modulation) stimulus occurrence (Kastner et al., 1999; Kanwisher and Wojciulik, 2000; Hopfinger et al., 2001; Rees and Lavie, 2001). More precisely, activity in the low-level visual cortex (V1, V2, V3) depended on the task difficulty, with a decrease as the task was getting easier (Ress et al., 2000), and corresponded to the subjects' percepts rather than to the physically presented stimulus (Ress and Heeger, 2003). These attentional effects impact on the cortical regions that will respond to the upcoming target stimuli and suggest that one form of top-down control biases the activity in cortical regions where selective processing will subsequently occur. In the auditory modality, some neuroimaging studies have also focused on the effect of selective attention. They found high-level areas (including dorsolateral prefrontal areas) partially overlapping the visual attention network (Kanwisher and Wojciulik, 2000; Corbetta and Shulman, 2002) as well as enhanced activity in the auditory areas (Heschl's gyrus and planum temporale) (Woldorff et al., 1993; Downar et al., 2000; Lipschutz et al., 2002). In addition, a recent report (Kraemer et al., 2005) showed that musical gaps can induce auditory activations, likely to be related to musical mental imagery (for review, see Zatorre at al., 2005). In all of these studies, however, the activity was always recorded in the presence of acoustic stimuli and/or scanner noise. Thus, little is known about the neurophysiological substrate of attentively listening in silence to detect a sound when the auditory scene remains silent.
To address this issue, we used a sparse sampling functional magnetic resonance imaging (fMRI) method to avoid a saturation of the auditory cortex activity and a paradigm that allowed manipulating the load of sustained attention during listening in silence for detecting the presence of a sound.
These results were reported in preliminary form at the 34th Annual Meeting of the Society for Neuroscience (San Diego, CA).
Materials and Methods
Subjects
Subjects were 20–29 years of age (three female and eight male) with normal hearing. They were all right-handed and without any history of neurological or psychiatric disorder. Informed consent was obtained for all subjects, and this study was approved by National Ethical Regulation (number RBM 03-18).
Experimental design
The listening-in-silence trial. In each trial, two opposite horizontal green arrows were presented during 4.5 s to the subjects (Fig. 1). Then, one of the arrows turned red to indicate the side of the forthcoming sound. Subjects were informed that sound intensity would rise progressively up and that they would have to press a button once they detected the sound. Actually, to be sure that the subject did not perceive any sound during the listening period, the sound intensity was kept to zero during one of four randomized durations (0, 1.5, 4.5, or 7.5 s). In postexperiment interviews, subjects indicated that they had never realized that the sound was not continuously rising up. Sounds consisted of 28 different band-pass-filtered noise bursts (24 semitone-wide, with a low frequency cutoff ranging from 175 to 831 Hz and varying in 1 semitone steps across all different sounds used). Sound intensity was abruptly rising up as a sixth degree polynomial time function from 0 dB up to a maximum of 100 dB sound pressure level in 1500 ms. As soon as the subject detected the sound and pressed the button, the sound was stopped. For the four silence durations (0, 1.5, 4.5, or 7.5 s), the reaction times (from the actual beginning of the sound until the button press) were: 1.12 ± 0.18, 1.04 ± 0.15, 1.15 ± 0.12, and 1.05 ± 0.12 s (mean ± SD). MRI acquisition started after button press (i.e., on average 1.5 s after sound onset). Four scans were acquired at 1.5 s intervals. The next trial began at the end of the MRI acquisition, and the next cue appeared 4.5 s later.
Figure 1.

Trial design. Listening in silence. Two opposite horizontal green (represented as light gray in the figure) arrows were presented during 4.5 s. Then, one of the arrows turned red (represented as dark gray in the figure) to indicate the side of the forth coming sound. The sound intensity was kept to zero during one of the four randomized duration delays (0, 1.5, 4.5, 7.5 s). The sound intensity then rose rapidly up to reach hearing threshold in <1 s. As soon as the subject detects the sound, he presses the response button: the sound intensity is immediately turned to zero, and the scanning begins (4 scans of 1.5 s duration were acquired successively). A resting state trial was also performed. Two opposite horizontal gray arrows instructed the subject to rest until the next color switches. The duration was 9 s for each resting state trial.
The resting state trial. Two opposite horizontal gray arrows instructed the subject to rest until the arrow color switches. The trial lasted 10.5 s, and no acoustic stimulus was delivered. Four scans were acquired with the same timing as for the sound detection trial.
The experiment consisted in two runs of 56 sound detection trials (i.e., 28 left- and 28 right-attended trials), including seven repetitions of each delay (0, 1.5, 4.5, 7.5 s) and 10 resting state trials. Trial order was randomized.
Subjects were equipped with earplugs covered by piezoelectric circumaural headphones. Before fMRI acquisition, an empirical method was used to adjust stimulus intensity. A series of band-passed noises was delivered through the headphones to individually adjust the sound loudness, allowing a comfortable hearing level and a clear sound perception with this setting.
fMRI methods
A sparse sampling acquisition protocol was used following the procedure described by Seifritz et al. (2002). Images were acquired using a 3 T whole-body scanner (Medspec 30/80 Avance; Brücker, Ettlingen, Germany) equipped with a circular polarized head coil. For each participant, we first acquired high-resolution T1-weighted anatomical images (inversion-recovery sequence; voxel size, 1 × 0.75 × 1.22 mm; sagittal orientation) covering the whole brain. For functional imaging, an echo planar imaging sequence was used with an echo time of 30 ms, a repetition time of 1580 ms, an acquisition bandwidth of 123 kHz, a matrix of 64 × 64, and a field of view of 192 × 192 mm. The resulting in-plane resolution was 3 × 3 mm. Twenty-six adjacent axial slices (thickness, 3 mm; interslice gap, 0.5 mm) were acquired parallel to the bicommissural plane.
Data analysis
The data were preprocessed with SPM2 software (http://www.fil.ion.ucl.ac.uk/spm/). Each subject's image was realigned to a scan halfway through the time series to correct for head motion and then normalized using the template of the Montreal Neurological Institute. The scans were eventually smoothed with a Gaussian kernel of 6 × 6 × 7 mm half-height width. The functional data were analyzed with a general linear model (Friston et al., 1995; Wicker and Fonlupt, 2003). We used a mixed-effect model allowing for inference about the population by taking into account intersubject variance (called “random effect analysis” in SPM software). The factors were: the attended side (two discrete levels), the order of the scan in the trial (four discrete levels), the run (two discrete levels), and the duration of the listening-in-silence period (four discrete levels). This procedure provided maps of contrasts of interest (described below) for each subject. The averaged contrasts across the 11 subjects were then compared with 0 using Student's t test.
The difference between the sum of the four listening-in-silence durations and four times the resting state (contrast1111–4) was calculated for each of the four scans. This provided one value for each of the four scans collected after subject's response, called “listening in silence versus resting state scan n” (n = 1, 2, 3, 4). From these values, the following contrasts were then computed:
Listening in silence versus resting state. The average of the four values was computed (i.e., the linear combination with coefficients 1, 1, 1, 1). The comparison of this contrast to 0 tested for a global effect of the task regardless of the scan order.
Increase of sound-induced hemodynamic response. A linear combination of the four values was computed with the coefficients: –3, –1, 1, 3. The comparison of this contrast to 0 tested for an increasing effect of listening in silence versus resting state across the four collected scans.
A parametric analysis (Mazoyer et al., 2002) was also performed using the listening-in-silence duration as a continuous factor. This consists in computing the regression of each voxel activity with the listening-in-silence duration. This approach has a greater statistical power and provides a global view of the duration effect compared with multiple pair-wise contrasts combining different durations. Separate regressions were computed for the attention directed to the left or to the right side.
All the statistical maps were thresholded at p < 0.01 (t = 3.17). Only clusters of at least 20 contiguous voxels were taken into consideration. The anatomical location of clusters was determined using “MAsks for Region of INterest Analysis” (http://www.bion.de/Marina.htm) and “Talairach Daemon” (http://ric.uthscsa.edu/projects/talairachdaemon.html) software. In addition, the location of the planum temporale was estimated from a digital version of a probability map reported in the literature (Westbury et al., 1999).
In brief, our analysis strategy was (1) to compute the contrast listening in silence versus resting state so as to identify all regions activated, whether they involved general arousal, auditory expectancy, or sound processing; (2) to regress activities with the listening-in-silence duration so as to eliminate general arousal effect and to focus on auditory attention during both silence and sound presentation; and (3) to apply a linear regression analysis across scans 1–4 on both effects 1 and 2, so as to dissociate the regions exhibiting effects before sound emergence from those showing effects during sound processing
Results
Listening in silence in an attempt to detect the presence of a sound was compared with the resting state using the contrast listening in silence versus resting state. The areas exhibiting a significant increase of the blood oxygenation level-dependent (BOLD) signal are described in Table 1 and are illustrated in supplemental Figure 1 (available at www.jneurosci.org as supplemental material). These areas represent a distributed network covering frontal, temporal, and parietal lobes and subcortical areas. In the frontal cortex, we observed an increased activity bilaterally in a region covering the anterior extremity of the insula and the adjacent inferior frontal operculum. Activations were also observed in the supplementary motor area (SMA) and in the precentral/inferior frontal gyrus only in the right hemisphere. In the temporal lobe, activations were located in the superior temporal gyrus bilaterally in the vicinity of the auditory areas. In the left parietal lobe, increased activity was located at the junction of the angular and supramarginal gyrus. Finally, activations were also observed in subcortical areas, left thalamus, and caudate nuclei bilaterally.
Table 1.
Brain regions activated when listening in silence for detecting a sound
|
|
MNI coordinates for tmax |
|
|
||||
|---|---|---|---|---|---|---|---|
| Side and region (Brodmann's area) |
x
|
y
|
z
|
tmax
|
Cluster size |
||
| Frontal | |||||||
| R precentral/inferior frontal gyrus (BA 44/6) | 52 | 19 | 33 | 5.97 | 498 | ||
| R middle frontal/inferior frontal gyrus (BA 46/45) | 49 | 37 | 23 | 6.47 | 137 | ||
| L anterior insula/inferior frontal gyrus (BA 47/13) | -38 | 13 | 1 | 5.33 | 171 | ||
| R anterior insula/inferior frontal gyrus (BA 47/ BA 13) | 37 | 19 | 5 | 6.69 | 383 | ||
| Median cingulate/supplementary motor area (BA 6/32) | -2 | 22 | 37 | 4.96 | 77 | ||
| Supplementary motor area (BA 6/32) | 4 | 10 | 51 | 7.84 | 444 | ||
| Temporal | |||||||
| L superior temporal gyrus (BA 41/42/22) | -50 | -26 | 9 | 5.75 | 364 | ||
| R superior temporal gyrus (BA 41/42/22) | 64 | -32 | 12 | 4.87 | 57 | ||
| Parietal | |||||||
| L angular/supramarginal gyrus (BA 40/39) | -50 | -62 | 29 | 9.13 | 292 | ||
| Subcortical | |||||||
| L thalamus | -11 | -20 | 15 | 4.48 | 64 | ||
| L caudate nucleus | -8 | 1 | 9 | 7.01 | 332 | ||
| R caudate nucleus |
10 |
1 |
12 |
9.22 |
588 |
||
Results are derived from a mixed-effect analysis (11 subjects), and the clusters correspond to the contrast listening in silence versus resting state. x, y, and z correspond to the stereotaxic coordinates (in millimeters) in the Montreal Neurological Institute (MNI) reference brain provided with SPM2. The statistical map is thresholded at t = 3.17, which corresponds to p < 0.01. All tmax values (the maximum value of t among the voxels of the cluster) correspond to p < 0.001 (t(0.001) = 4.58). Cluster size represents the number of contiguous voxels showing significant activation (2 × 2 × 2 mm voxels). R, Right; L, left; BA, Brodmann's area.
Some of the activations revealed by the contrast listening in silence versus resting state are clearly related to general arousal processes. Our aim was to separate the effect related to general arousal (i.e., the subject has a task to perform vs resting state) from the effect specifically related to listening in silence of different duration. For that purpose, we performed a parametric regression analysis of the fMRI data using the listening-in-silence duration (i.e., the time before sound emergence) as a continuous factor. For all of the different durations, one can reasonably assume that the effect related to general arousal was identical. This analysis shows a circumscribed network (Fig. 2, Table 2). An effect is observed, regardless of the side (left or right) to which the attention is directed, in two frontal regions: precentral/inferior frontal gyrus and anterior insula/inferior frontal gyrus in the right hemisphere. In contrast, two large regions exhibited an effect specific to the side where the sound was searched for. They were located in the superior temporal cortex including the Heschl's gyrus and the superior temporal gyrus (Fig. 2). These activations were found in the hemisphere contralateral to the attended side. Some local maxima of the contrast map were observed within each of these bilateral areas: one close to the Heschl's gyrus, one more posterior in the superior temporal gyrus, and another one in the middle temporal gyrus on the right side (Table 2, supplemental Fig. 2, available at www.jneurosci.org as supplemental material).
Figure 2.
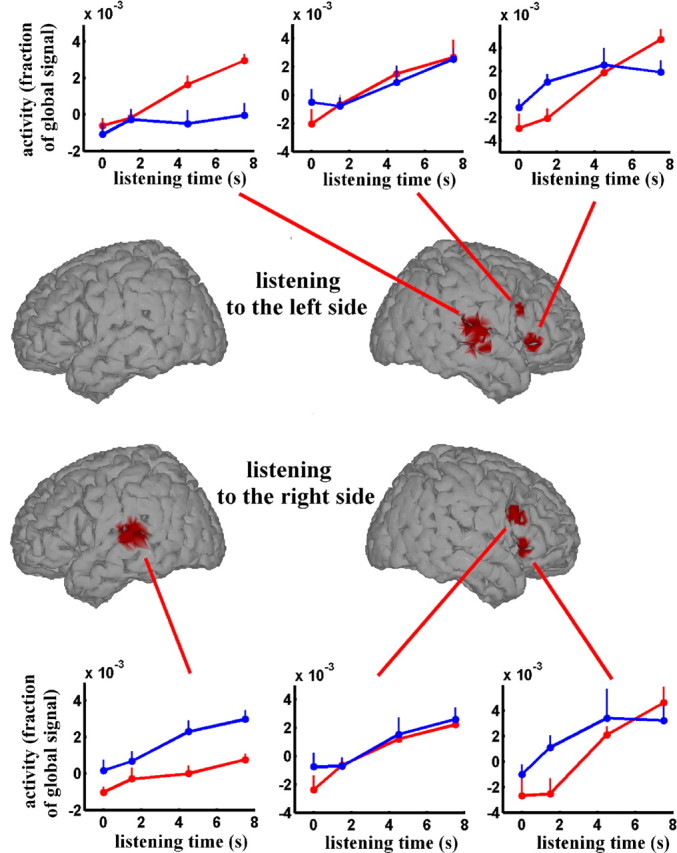
Topography of the brain activities correlating with the listening-in-silence duration. Active regions are displayed on a pseudo-three-dimensional brain render. The top and bottom depict the active areas for listening to the sound in the left or right side, respectively. The detailed characteristics of the active regions are given in Table 2. Insets, The across-subjects averaged response of the different regions depicted on the brain render. The adjusted MR signal is plotted as a function of the time during which the subjects have listening in silence. The result is the mean ± SEM across the 11 subjects. The blue and red lines are related to listening to right and left sides, respectively.
Table 2.
Brain regions activated during listening in silence, parametric regression analysis
|
|
MNI coordinates at tmax |
|
|
||||
|---|---|---|---|---|---|---|---|
| Side and region |
x
|
y
|
z
|
tmax
|
Cluster size |
||
| Listening to the right side | |||||||
| Temporal | |||||||
| L superior temporal gyrus | -58 | -34 | 8 | 4.26 | 737 | ||
| Local maxima | |||||||
| Heschl's gyrus | -42 | -30 | 8 | 3.66 | 18 | ||
| Superior temporal gyrus | -58 | -34 | 8 | 4.26 | 130 | ||
| Frontal | |||||||
| R precentral gyrus/inferior frontal triangular/opercular part | 48 | 18 | 24 | 3.98 | 57 | ||
| R anterior insula, inferior frontal gyrus orbital part | 52 | 24 | -6 | 3.59 | 29 | ||
| Listening to the left side | |||||||
| Temporal | |||||||
| R middle and superior temporal gyri | 56 | -8 | -18 | 4.40 | 952 | ||
| Local maxima | |||||||
| Middle temporal gyrus | 56 | -8 | -18 | 4.40 | 66 | ||
| Heschl's gyrus | 42 | -22 | 6 | 4.19 | 25 | ||
| Superior temporal gyrus | 64 | -10 | 6 | 3.49 | 22 | ||
| Frontal | |||||||
| R precentral gyrus/inferior frontal opercular/triangular part | 54 | 18 | 26 | 3.63 | 43 | ||
| R anterior insula, inferior frontal gyrus orbital part |
48 |
26 |
-6 |
4.25 |
119 |
||
Results are derived from a mixed-effect analysis (11 subjects), and the clusters correspond to the voxels whose activity correlates with the listening-in-silence period (0, 1.5, 4.5, 7.5 s). The analysis is performed separately when listening to the right or the left side. x, y, and z correspond to the stereotaxic coordinates (in millimeters) in the Montreal Neurological Institute (MNI) reference brain provided with SPM2. The statistical map is thresholded at t = 3.17, which corresponds to p < 0.01. All tmax values (the maximum value of t among the voxels of the cluster) correspond to p < 0.005. Cluster size represents the number of contiguous voxels showing significant activation (2 × 2 × 2 mm voxels). Local maxima are detected within the temporal clusters. R, Right; L, left.
In each trial, we recorded four consecutive scans (during 6 s after subject's response) and, in the above analysis, a global effect has been determined regardless of the evolution of the effect across the four scans. Actually, this global effect could be related to two distinct processes: a baseline shift during the listening-in-silence period and/or an increase of the hemodynamic response induced by the delivered sound (including the stimulus sound and the scanner noise). According to previous studies (Belin et al., 1999; Hall et al., 1999; Specht and Reul, 2003), the time course of the sound-induced hemodynamic response should be increasing from scan 1 to scan 4. In Figure 3, we have represented the two contrasts, listening in silence versus resting state and increase of sound-induced hemodynamic response, for voxels in the temporal region. The color array allows distinguishing the voxels exhibiting close values for the two contrasts from those exhibiting larger differences between the two contrasts. More precisely, only listening in silence versus resting state or increase of soundinduced hemodynamic response contrast was significant at green or red voxels, respectively. The two contrasts are both significant at yellow voxels. The two curve-plot insets represent typical example of voxels exhibiting a constant or a varying listening-in-silence effect across the four scans. For voxels close to Heschl's gyrus, the listening-in-silence effect is increasing across the four scans. More precisely, the effect time course looks like the auditory hemodynamic response curve described previously in the literature (Belin et al., 1999; Hall et al., 1999; Specht and Reul, 2003). In contrast, for voxels located more laterally and/or posteriorly to the previous ones, the listening-in-silence effect is present in the first scan and does not increase over scans. In addition, supplemental Figure 3 (available at www.jneurosci.org as supplemental material) shows the two listening in silence versus resting state contrasts measured in scans 1 and 4.
Figure 3.

Brain areas exhibiting an increase of the listening-in-silence effect from scan 1 to scan 4 (from 0 to 6 s after subject's response). The values of the increase of sound-induced hemodynamic response contrasts (see Materials and Methods for detailed definition of the contrasts) are represented in the black-to-red color scale (contrast #2). The values of listening in silence versus resting state contrast (effect present in at least 1 of the 4 scans) are represented in the black-to-green color scale (contrast #1). More precisely, the black-to-yellow color scale corresponds to voxels exhibiting close values for the two contrasts, whereas the black–red/black–green color scales corresponds to voxels exhibiting difference between the two contrasts. The insets show the adjusted BOLD signal (difference between activity during listening-in-silence conditions and activity during resting state condition) plotted as a function of the scan order of two representative voxels. The result is the mean ± SEM across the 11 subjects.
A similar analysis across the four scans was performed in the temporal regions obtained with the parametric regression analysis with the listening-in-silence durations (supplemental Fig. 4, available at www.jneurosci.org as supplemental material).
Discussion
Listening in silence to detect a sound was shown to activate a distributed network of brain areas. Several subsystems could be dissociated according to their putative functional role.
A first subsystem, frequently associated with general arousal processes, included thalamic nuclei, parietal areas, the prefrontal cortex, and the SMA. SMA activation likely reflects the preparation of the motor response required by the task (Dum and Strick, 2002; Rushworth et al., 2004), and thalamic/caudate activation may relate to general arousal (Pinault, 2004; Shipp, 2004). Two frontal regions, precentral/inferior frontal gyrus and anterior insula/inferior frontal gyrus in the right hemisphere, seem to have a greater specificity because their activities correlate the duration of the listening-in-silence period. Dorsolateral prefrontal areas found here are generally thought to modulate the activity of the visual pathway during attention-related tasks (Rees et al., 1997; Kanwisher and Wojciulik, 2000; Rees and Lavie, 2001; Mazoyer et al., 2002; Chaminade and Fonlupt, 2003). The dorsolateral prefrontal area has also been found to be associated with auditory attention (Bushara et al., 1999; Lewis et al., 2000). The present finding is consistent with our former suggestion of a role of the dorsolateral prefrontal cortex in directing attention to the external world (Wicker and Fonlupt, 2003). The second region was located in the right inferior frontal cortex extending to the anterior insular gyrus. It has been associated to several high-level auditory processes, especially in allocating auditory attention (Hall et al., 2000; Alain et al., 2001; Lipschutz et al., 2002; Binder et al., 2004).
A second subsystem involves regions with an activity correlating with the duration of the listening-in-silence period. Two areas are located in the right hemisphere, regardless of the side toward which attention is directed. These areas, located in the dorsolateral and inferior frontal cortex, were overlapping with two of the areas revealed by the contrast listening in silence versus resting state. This demonstrates that the right frontal areas are implicated in sustained attention.
Within this second subsystem, several areas exhibited an effect depending on the side toward which attention was directed. They were located in the superior temporal cortex, including the Heschl's gyrus and surrounding areas, extending from the planum temporale down to the superior temporal sulcus, and encroaching on the middle temporal gyrus in the right hemisphere. These activations were found in the hemisphere contralateral to the attended side. Such a strong contralateral selectivity in these temporal auditory regions has been reported previously using monaural stimulation (Jäncke et al., 2002) and in selective orientation to one ear during dichotic listening (Hall et al., 2000; Jäncke et al., 2003). Our results probably refer to processes distinct from those corresponding to an increased activity in the superior temporal gyrus after regular patterns of sound (Hughes et al., 2001; Mustovic et al., 2003), at the offset of long-duration sound (Jäncke et al., 1999; Harms and Melcher, 2002; Seifritz et al., 2002), or induced by a brief period of silence (Kraemer et al., 2005) interpreted as auditory imagery. Auditory imagery has been also shown to increase activity in the auditory areas (Bunzeck et al., 2005; Zatorre and Halpern, 2005) and in the right inferior frontal areas (Hoshiyama et al., 2001). However, two points argue against a role of mental imagery in the observed effect. First, the attended sound did not represent any known object and was never the same, whereas, in most experiments dealing with auditory mental imagery, the target of imagery was a meaningful sound. Second, if the subject had experienced a mental imagery period leading to an auditory illusion, he would have pressed the response button before the actual occurrence of the sound. Such false alarm never occurred in our experiment. The effects presented here rather refer to a baseline shift process similar to that observed in the visual modality (Rees et al., 1997; Chawla et al., 1999; Kastner et al., 1999) in which visual areas were reported to be activated during stimulus expectancy.
Within this large activated area in the superior temporal gyrus, areas in the vicinity of the Heschl's gyrus exhibit increased reactivity to acoustic input, whereas surrounding areas exhibit a baseline shift during listening in silence. The former effect has been reported previously in selective attention studies focusing on feature extraction, both in auditory discrimination task (Hall et al., 2000; Alain et al., 2001) and in audio-visual competition task (Petkov et al., 2004). The latter effect shows an increased activity in the auditory areas during listening to an empty auditory scene as it has been shown in the visual modality (Rees et al., 1997; Chawla et al., 1999; Kastner et al., 1999; Kanwisher and Wojciulik, 2000; Rees and Lavie, 2001; Corbetta and Shuman, 2002). These visual baseline shifts were found preferentially in the areas involved in the processing of the attended feature. In the present report, the auditory areas underlying this baseline shift process involve regions in the vicinity of the planum temporale and anterior lateral areas known as associative auditory areas (Wessinger et al., 2001; Griffiths and Warren, 2002; Hart et al., 2004; Zatorre et al., 2004).
In conclusion, our results show that sustained attention (which can be defined as the continuous monitoring of a particular stimulus) (Posner and Petersen, 1990) in the auditory modality is based on a neural network exhibiting strong analogies with the one supporting sustained attention in the visual modality. The network involves the same frontal areas and the processes in the sensory-specific area appear to be of the same nature. In particular, an increase of activity in the auditory areas occurs even in absence of the auditory stimulus.
Footnotes
J.V. was supported by a grant from the Fondation pour la Recherche Médicale. We thank J. L. Anton, B. Nazarian, and M. Roth from the fMRI Centre (Marseille, France) for their helpful assistance.
Correspondence should be addressed to Pierre Fonlupt, Institut National de la Santé et de la Recherche Médicale Unité 280, Institut Fédératif de Neurosciences de Lyon, Université Claude Bernard Lyon 1, Centre Hospitalier le Vinatier, Bâtiment 452, 95 Boulevard Pinel, 69675 Bron Cedex, France. E-mail: fonlupt@lyon.inserm.fr.
J. Voisin's present address: Centre interdisciplinaire de recherche en réadaptation et intégration sociale, 525, Boulevard Hamel, Québec G1M2S8, Canada.
DOI:10.1523/JNEUROSCI.2967-05.2006
Copyright © 2006 Society for Neuroscience 0270-6474/06/260273-06$15.00/0
J.V. and A.B.-C. contributed equally to this work.
References
- Alain C, Arnott S, Hevenor S, Graham S, Grady C (2001) “What” and “where” in the human auditory system. Proc Natl Acad Sci USA 98: 12301–12306. [DOI] [PMC free article] [PubMed] [Google Scholar]
- Belin P, Zatorre R, Hoge R, Evans A, Pike B (1999) Event-related fMRI of the auditory cortex. NeuroImage 10: 417–429. [DOI] [PubMed] [Google Scholar]
- Binder J, Liebenthal E, Possing E, Medler D, Ward D (2004) Neural correlates of sensory and decision processes in auditory object identification. Nat Neurosci 7: 295–301. [DOI] [PubMed] [Google Scholar]
- Bunzeck N, Wuestenberg T, Lutz K, Heinze HJ, Jäncke L (2005) Scanning silence: mental imagery of complex sounds. NeuroImage 26: 1119–1127. [DOI] [PubMed] [Google Scholar]
- Bushara K, Weeks R, Ishii K, Catalan M, Tian B, Rauschecker J, Hallett M (1999) Modality-specific frontal and parietal areas for auditory and visual spatial localization in humans. Nat Neurosci 2: 759–766. [DOI] [PubMed] [Google Scholar]
- Chaminade T, Fonlupt P (2003) Changes of effective connectivity between the lateral and medial parts of the prefrontal cortex during a visual task. Eur J Neurosci 18: 675–679. [DOI] [PubMed] [Google Scholar]
- Chawla D, Rees G, Friston K (1999) The physiological basis of attentional modulation in extrastriate visual areas. Nat Neurosci 2: 671–676. [DOI] [PubMed] [Google Scholar]
- Chun M, Marois R (2002) The dark side of visual attention. Curr Opin Neurobiol 12: 184–189. [DOI] [PubMed] [Google Scholar]
- Corbetta M, Shulman G (2002) Control of goal-directed and stimulus-driven attention in the brain. Nat Rev Neurosci 3: 201–215. [DOI] [PubMed] [Google Scholar]
- Downar J, Crawley A, Mikulis D, Davis K (2000) A multimodal cortical network for the detection of change in the sensory environment. Nat Neurosci 3: 277–283. [DOI] [PubMed] [Google Scholar]
- Dum R, Strick P (2002) Motor areas in the frontal lobe of the primate. Physiol Behav 77: 677–682. [DOI] [PubMed] [Google Scholar]
- Friston K, Holmes A, Worsley K, Poline JB, Frith C, Frackowiak R (1995) Statistical parametric maps in functional imaging: a general linear model approach. Hum Brain Mapp 2: 189–210. [Google Scholar]
- Griffiths T, Warren J (2002) The planum temporale as a computational hub. Trends Neurosci 25: 348–353. [DOI] [PubMed] [Google Scholar]
- Hall D, Haggard M, Akeroyd M, Palmer A, Summerfield Q, Elliot M, Gurney E, Bowtell R (1999) “Sparse” temporal sampling in auditory fMRI. Hum Brain Mapp 7: 213–223. [DOI] [PMC free article] [PubMed] [Google Scholar]
- Hall D, Haggard M, Akeroyd M, Summerfield Q, Palmer A, Elliot M, Bowtell R (2000) Modulation and task effects in auditory processing measured using fMRI. Hum Brain Mapp 10: 107–119. [DOI] [PMC free article] [PubMed] [Google Scholar]
- Harms M, Melcher J (2002) Sound repetition rate in human auditory pathway: representations in waveshape and amplitude of fMRI activation. J Neurophysiol 88: 1433–1450. [DOI] [PubMed] [Google Scholar]
- Hart H, Palmer A, Hall D (2004) Different areas of human non-primary auditory cortex are activated by sounds with spatial and nonspatial properties. Hum Brain Mapp 21: 178–190. [DOI] [PMC free article] [PubMed] [Google Scholar]
- Herrmann C, Knight R (2001) Mechanism of human attention: event-related potentials and oscillations. Neurosci Biobehav Rev 25: 465–476. [DOI] [PubMed] [Google Scholar]
- Hopfinger J, Woldorff M, Fletcher E, Mangun G (2001) Dissociating top-down attentional control from selective perception and action. Neuropsychologia 39: 1277–1291. [DOI] [PubMed] [Google Scholar]
- Hoshiyama M, Gunji A, Kakigi R (2001) Hearing the sound of silence: a magnetoencephalographic study. NeuroReport 12: 1097–1102. [DOI] [PubMed] [Google Scholar]
- Hughes H, Darcey T, Barkan H, Williamson P, Roberts D, Aslin C (2001) Response of human auditory association cortex to the omission of an expected acoustic event. NeuroImage 13: 1073–1089. [DOI] [PubMed] [Google Scholar]
- Jäncke L, Buchanan T, Lutz K, Specht K, Mirzazade S, Shah N (1999) The time course of BOLD response in the human auditory cortex to acoustic stimuli of different duration. Brain Res Cogn Brain Res 8: 117–124. [DOI] [PubMed] [Google Scholar]
- Jäncke L, Wüstenberg T, Schulze K, Heinze HJ (2002) Asymetric hemodynamic responses of the human auditory cortex to monaural and binaural stimulation. Hear Res 170: 166–178. [DOI] [PubMed] [Google Scholar]
- Jäncke L, Specht K, Shah J, Hugdahl K (2003) Focused attention in a simple dichotic listening task: an fMRI experiment. Brain Res Cogn Brain Res 16: 257–266. [DOI] [PubMed] [Google Scholar]
- Kanwisher N, Wojciulik E (2000) Visual attention: insights from brain imaging. Nat Rev Neurosci 1: 91–100. [DOI] [PubMed] [Google Scholar]
- Kastner S, Ungerleider L (2000) Mechanisms of visual attention in the human cortex. Annu Rev Neurosci 23: 315–341. [DOI] [PubMed] [Google Scholar]
- Kastner S, Pinsk M, De Weerd P, Desimone R, Ungerleider L (1999) Increased activity in human visual cortex during directed attention in the absence of visual stimulation. Neuron 22: 751–761. [DOI] [PubMed] [Google Scholar]
- Kraemer D, Macrae C, Green A, Kelly W (2005) Sound of silence activates auditory cortex. Nature 434: 158. [DOI] [PubMed] [Google Scholar]
- Lewis J, Beauchamp M, DeYoe E (2000) A comparison of visual and auditory motion processing in human cerebral cortex. Cereb Cortex 10: 873–888. [DOI] [PubMed] [Google Scholar]
- Lipschutz B, Kolinsky R, Damhaut P, Wikler D, Goldman S (2002) Attention-dependent changes of activation and connectivity in dichotic listening. NeuroImage 17: 643–656. [PubMed] [Google Scholar]
- Mazoyer P, Wicker B, Fonlupt P (2002) A neural network elicited by parametric manipulation of the attention load. NeuroReport 13: 2331–2334. [DOI] [PubMed] [Google Scholar]
- Mustovic H, Scheffler K, Di Salle F, Esposito F, Neuhoff J, Hennig J, Seifritz E (2003) Temporal integration of sequential auditory events: silent period in sound pattern activates human planum temporale. NeuroImage 20: 429–434. [DOI] [PubMed] [Google Scholar]
- Pessoa L, Kastner S, Ungerleider L (2003) Neuroimaging studies of attention: from modulation of sensory processing to top-down control. J Neurosci 23: 3990–3998. [DOI] [PMC free article] [PubMed] [Google Scholar]
- Petkov C, Kang X, Alho K, Bertrand O, Yund E, Woods D (2004) Attentional modulation of human auditory cortex. Nat Neurosci 7: 658–663. [DOI] [PubMed] [Google Scholar]
- Pinault D (2004) The thalamic reticular nucleus: structure, function and concept. Brain Res Brain Res Rev 46: 1–31. [DOI] [PubMed] [Google Scholar]
- Posner M, Petersen S (1990) The attention systems of the human brain. Annu Rev Neurosci 13: 25–42. [DOI] [PubMed] [Google Scholar]
- Rees G, Lavie N (2001) What can functional imaging reveal about the role of attention in visual awareness? Neuropsychologia 39: 1343–1353. [DOI] [PubMed] [Google Scholar]
- Rees G, Frackowiak R, Frith C (1997) Two modulatory effects of attention that mediate object categorization in human cortex. Science 275: 835–838. [DOI] [PubMed] [Google Scholar]
- Ress D, Heeger D (2003) Neuronal correlates of perception in early visual cortex. Nat Neurosci 6: 414–420. [DOI] [PMC free article] [PubMed] [Google Scholar]
- Ress D, Backus B, Heeger D (2000) Activity in primary visual cortex predicts performance in a visual detection task. Nat Neurosci 3: 940–945. [DOI] [PubMed] [Google Scholar]
- Rushworth M, Walton M, Kennerley S, Bannerman D (2004) Action sets and decisions in the medial frontal cortex. Trends Cogn Sci 8: 410–417. [DOI] [PubMed] [Google Scholar]
- Seifritz E, Esposito F, Hennel F, Mustovic H, Neuhoff J, Bilecen D, Tedeschi G, Scheffler K, Di Salle F (2002) Spatiotemporal pattern of neural processing in the human auditory cortex. Science 297: 1706–1708. [DOI] [PubMed] [Google Scholar]
- Shipp S (2004) The brain circuitry of attention. Trends Cogn Sci 8: 223–230. [DOI] [PubMed] [Google Scholar]
- Specht K, Reul J (2003) Functional segregation of the temporal lobe into highly differentiated subsystems for auditory perception: an auditory rapid event-related fMRI-task. NeuroImage 20: 1944–1954. [DOI] [PubMed] [Google Scholar]
- Wessinger C, Vanmeter J, Tian B, Van Lare J, Pekar J, Rauschecker J (2001) Hierarchical organization of the human auditory cortex revealed by functional magnetic resonance imaging. J Cogn Neurosci 13: 1–7. [DOI] [PubMed] [Google Scholar]
- Westbury C, Zatorre R, Evans A (1999) Quantifying variability in the planum temporale: a probability map. Cereb Cortex 9: 392–404. [DOI] [PubMed] [Google Scholar]
- Wicker B, Fonlupt P (2003) Generalized least-squares method applied to the fMRI time series with empirically determined correlation matrix. NeuroImage 18: 588–594. [DOI] [PubMed] [Google Scholar]
- Woldorff M, Gallen C, Hampson S, Hillyard S, Pantev C, Sobel D, Blooms F (1993) Modulation of early sensory processing in human auditory cortex during auditory selective attention. Proc Natl Acad Sci USA 90: 8722–8726. [DOI] [PMC free article] [PubMed] [Google Scholar]
- Zatorre R, Halpern A (2005) Mental concerts: musical imagery and auditory cortex. Neuron 47: 9–12. [DOI] [PubMed] [Google Scholar]
- Zatorre R, Bouffard M, Belin P (2004) Sensitivity to auditory object features in human temporal neocortex. J Neurosci 24: 3637–3642. [DOI] [PMC free article] [PubMed] [Google Scholar]